 Qiong Li
 Ailing Chen2†
 Ying Gu
 Ping Yu
 Chaoyan Yue
- 1Department of Obstetrics and Gynecology, The First People’s Hospital of Chenzhou, Chenzhou, China
- 2Department of Obstetrics and Gynecology, Women’s Hospital of Jiangnan University, Wuxi Maternity and Child Health Care Hospital, Wuxi, China
- 3Obstetrics & Gynecology Hospital of Fudan University, Shanghai Key Lab of Reproduction and Development, Shanghai Key Lab of Female Reproductive Endocrine Related Diseases, Shanghai, China
- 4Wuxi School of Medicine, Jiangnan University, Wuxi, Jiangsu, China
- 5Center of Reproductive Medicine, Women’s Hospital of Jiangnan University, Wuxi Maternity and Child Health Care Hospital, Wuxi, China
Background: The metabolic score for insulin resistance (METS-IR) is a novel and effective indicator for assessing insulin resistance. Previous studies have shown that METS-IR is positively associated with the risk of type 2 diabetes. However, the association between METS-IR and gestational diabetes mellitus (GDM) has not yet been clearly clarified. This study aims to investigate the association between METS-IR and GDM as well as its related adverse pregnancy outcomes and to evaluate its predictive value.
Methods: A total of 37,770 singleton pregnant women from three hospitals in China between January 2018 and June 2024 were included in the study. METS-IR was calculated using the formula: ln ([high-density lipoprotein cholesterol (HDL-C) (mg/dL)] × [2 × fasting glucose (mg/dL)] + TG (mg/dL) × BMI (kg/m2)). Participants were divided into four groups according to METS-IR quartiles. Multivariable logistic regression models, smoothed curve fitting, and subgroup analyses were conducted to assess the associations between METS-IR and GDM as well as related adverse pregnancy outcomes. The receiver operating characteristic (ROC) curves were used to evaluate the predictive performance.
Results: After adjusting for potential confounders, higher METS-IR levels were significantly associated with an increased risk of GDM. Compared with the lowest quartile group (Q1), the risks of GDM in the Q2, Q3, and Q4 groups increased by 13% (OR = 1.13, 95% CI: 1.02–1.25), 59% (OR = 1.59, 95% CI: 1.44–1.75), and 165% (OR = 2.65, 95% CI: 2.42–2.91), respectively. Similar associations were also observed between METS-IR and preterm birth, macrosomia, gestational diabetes mellitus (GDM) complicated with preeclampsia (GDM&PE), and pharmacologically treated GDM class A2 (GDMA2). Smoothed curve fitting suggested an approximately linear dose–response relationship between METS-IR and GDM. Subgroup analysis indicated that the association between METS-IR and GDM remained consistent across different age groups (interaction p > 0.05), with a higher GDM risk observed among women aged ≥35 years. The ROC analysis showed that the areas under the curve (AUCs) of METS-IR for predicting GDM, preterm birth, macrosomia, GDM&PE, and GDMA2 were 0.623, 0.532, 0.640, 0.741, and 0.712, respectively.
Conclusion: This study demonstrated that METS-IR is positively associated with GDM risk and its related adverse pregnancy outcomes. METS-IR may serve as a useful tool for risk stratification and early intervention in clinical practice for GDM.
Introduction
Gestational diabetes mellitus (GDM) refers to abnormal glucose tolerance first detected during pregnancy and is one of the most common metabolic complications encountered in pregnant women (1). Globally, the prevalence of GDM is approximately 16.7% (2). In recent years, with increasing obesity rates and a rising proportion of advanced maternal age pregnancies, the incidence of GDM has continued to increase, posing significant threats to both maternal and fetal health (3). GDM is closely associated with multiple adverse pregnancy outcomes, including hypertensive disorders of pregnancy, preterm birth, and macrosomia (4). It also significantly increases the long-term risk of type 2 diabetes in mothers, as well as the likelihood of obesity and metabolic syndrome in offspring (5, 6). Existing evidence suggests that women who develop GDM exhibit enhanced insulin resistance (IR) and impaired β-cell compensation early in pregnancy (7), indicating that metabolic disturbances may occur before clinical diagnosis. Therefore, applying effective metabolic evaluation tools for risk stratification of GDM and timely intervention is important for improving pregnancy outcomes and interrupting the intergenerational transmission of metabolic disorders.
IR is one of the key pathophysiological mechanisms underlying the development of GDM and serves as an important marker for predicting and assessing GDM risk (8, 9). However, traditional methods for evaluating IR, such as the euglycemic-hyperinsulinemic clamp (EHC), although considered the gold standard, are technically complex and invasive, which limits their applicability in routine clinical screening (10). Thus, there is a pressing need to develop simple, non-invasive, and accurate surrogate markers for IR to improve early risk stratification of GDM. The metabolic score for insulin resistance (METS-IR), developed by the team of Professor Bello-Chavolla OY, is a novel cardiometabolic risk scoring model. This score incorporates routinely available clinical parameters, including glucose-related indices (fasting plasma glucose, FPG), lipid profiles (such as triglycerides (TG) and high-density lipoprotein cholesterol (HDL-C)), and obesity-related measures (such as body mass index (BMI)) (11). Studies have demonstrated that METS-IR outperforms EHC in detecting impaired insulin sensitivity (11), with good reproducibility and ease of calculation, making it a promising indirect tool for assessing IR. Some cohort studies have consistently shown a positive association between METS-IR and the risk of developing type 2 diabetes (12–15). Recent studies have demonstrated an association between elevated METS-IR and an increased risk of GDM. One study using NHANES data included 5,189 pregnant women (417 with GDM) and found a significant association between higher METS-IR and GDM, particularly among women with high school education or higher (16). Another cohort study in Iran (n = 1,845) reported that first-trimester METS-IR may predict GDM in Iranian women (17). While these studies support the potential of METS-IR as a predictive tool, they have limitations, including single-center design, small sample size, and reliance on self-reported data, which may affect generalizability and accuracy. To address these limitations, our multicenter study with a large sample size rigorously controlled for confounders and applied multiple statistical methods to examine the association between METS-IR and both GDM and related adverse pregnancy outcomes. Our findings aim to provide a simple, practical clinical indicator for early risk stratification and prediction of GDM.
Methods
Study design
This study is a multicenter retrospective cohort study conducted between January 2018 and June 2024. A total of 37,770 singleton pregnant women were enrolled from three medical centers: Obstetrics and Gynecology Hospital of Fudan University, Huangpu Branch (Center 1), Obstetrics and Gynecology Hospital of Fudan University, Yangpu Branch (Center 2), and the First People’s Hospital of Chenzhou (Center 3). Among them, 5,166 were diagnosed with GDM, and 32,604 had normal glucose tolerance. Baseline clinical data and laboratory tests were collected at the first antenatal visit and obtained from the Hospital Information System (HIS) and Laboratory Information System (LIS). The inclusion criteria were as follows: (1) singleton pregnancy and (2) delivery at any of the participating hospitals. The exclusion criteria were as follows: initial measurements of FPG, TG, or HDL-C after 24 weeks of gestation, multiple pregnancies, preexisting diabetes or other endocrine disorders, chronic hypertension, cardiovascular disease, renal disease, or respiratory disease, and incomplete maternal or neonatal records. Figure 1 illustrates the participant inclusion process. The study was approved by the Ethics Committees of the Obstetrics and Gynecology Hospital of Fudan University and the First People’s Hospital of Chenzhou. All participants provided broad informed consent, and the study was conducted in accordance with the principles of the Declaration of Helsinki.
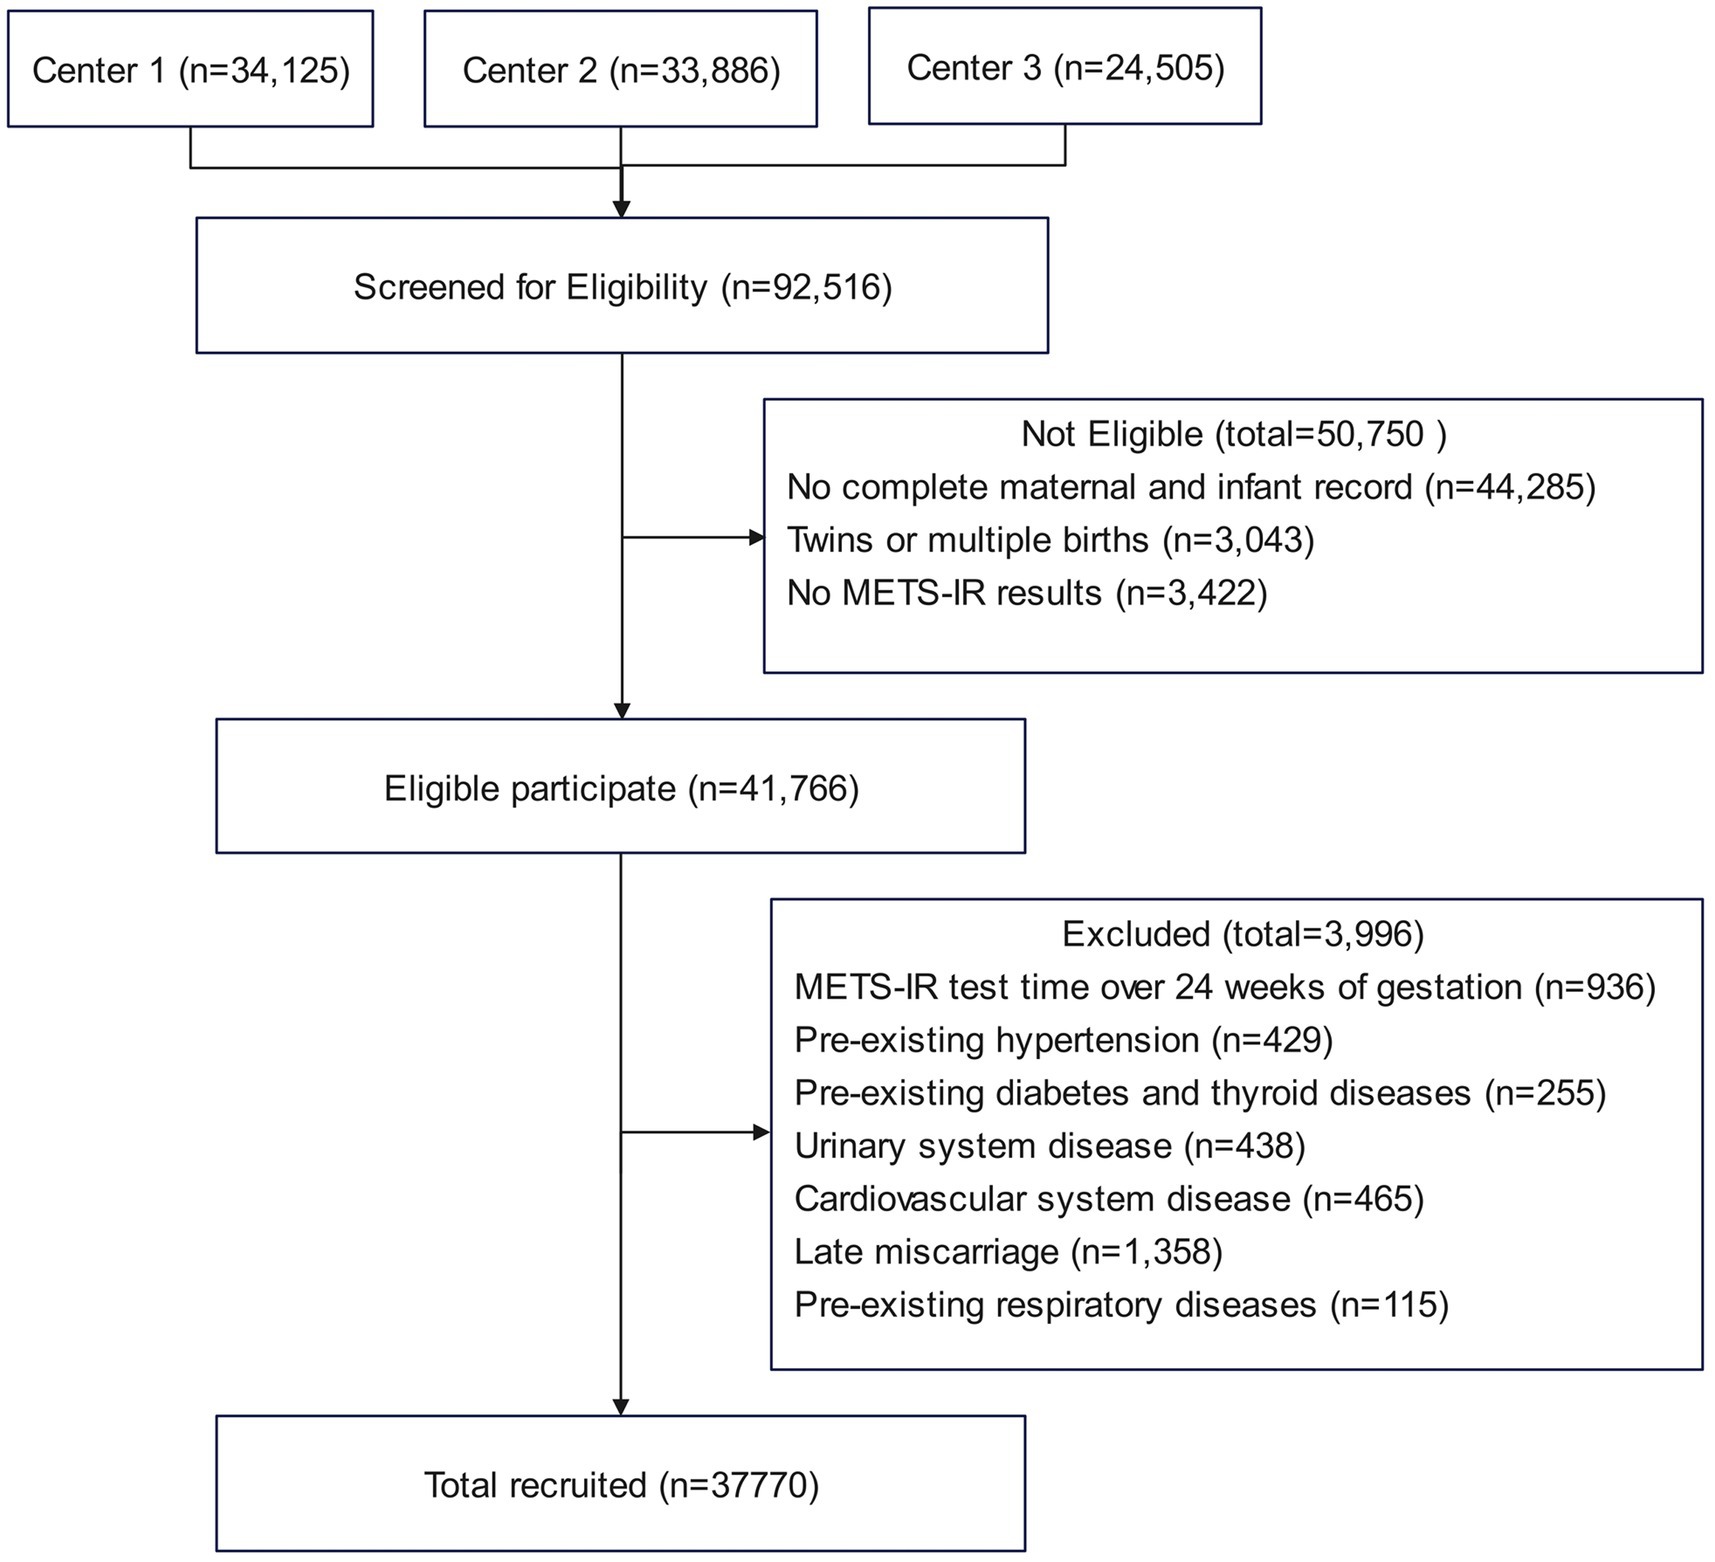
Figure 1. Flowchart of study participants.
Variables and measurements
The primary exposure variable was METS-IR. Demographic and clinical data, including age, prepregnancy body mass index (BMI), history of chronic diseases (hypertension, diabetes, etc.), and education level, were collected by trained healthcare professionals. Laboratory data were obtained from the first antenatal visit before 24 weeks of gestation. After an overnight fast of at least 8 h, venous blood samples were drawn and analyzed using an automatic biochemical analyzer to measure FPG (mmol/L), TG (mmol/L), HDL-C (mmol/L), alanine aminotransferase (ALT, U/L), creatinine (Cr, μmol/L), and total cholesterol (TC, mmol/L). METS-IR was calculated as follows: ln[(2 × FPG (mg/dL) + TG (mg/dL)) × BMI (kg/m2)]/ln[HDL-C (mg/dL)], where BMI was calculated as prepregnancy weight (kg) divided by height squared (m2) (11). The METS-IR in this study ranged from 21.58 to 58.43 and was categorized into four quartiles: Q1 (<32.18), Q2 (32.18–36.10), Q3 (36.10–40.91), and Q4 (>40.91). Maternal and neonatal clinical data were collected postpartum, mainly including gestational age at delivery and neonatal birth weight.
Based on previous literature and clinical expertise, potential confounding variables were selected, including age, test week, Cr, ALT, TC, history of hypertension, history of diabetes, tobacco use, alcohol consumption, in vitro fertilization (IVF), adverse pregnancy history, parity, and education level. Age was stratified into <35 years and ≥35 years according to WHO guidelines (18). Adverse pregnancy history was defined as prior spontaneous abortion or major obstetric complications. Education levels were categorized into postgraduate or above, bachelor’s degree, associate degree, senior high school, and junior high school or below.
Outcomes and measurements
The primary outcome was GDM. Diagnosis was based on the International Association of Diabetes and Pregnancy Study Groups (IADPSG) criteria using a 75-g oral glucose tolerance test (OGTT) performed between 24 and 28 weeks of gestation. GDM was diagnosed if any one of the following thresholds was met: fasting glucose ≥5.1 mmol/L, 1-h glucose ≥ 10.0 mmol/L, or 2-h glucose ≥ 8.5 mmol/L (19).
Secondary outcomes included preterm birth, macrosomia, GDM complicated with preeclampsia (GDM&PE), and pharmacologically treated GDM (GDMA2). Preterm birth was defined as delivery before 37 weeks of gestation (20). Macrosomia was defined as a birth weight ≥ 4,000 g (21). GDM&PE was defined as the coexistence of GDM and preeclampsia diagnosed after 20 weeks of gestation. Preeclampsia was diagnosed according to the 2020 American College of Obstetricians and Gynecologists (ACOG) (22). For women with regular menstrual cycles, fetal gestational age was estimated based on the last menstrual period. For those with irregular cycles, early ultrasound findings were used for gestational dating.
Statistical analysis
Baseline characteristics of the study population were summarized across METS-IR quartiles (Q1–Q4). Continuous variables with normal distribution were expressed as mean ± standard deviation (SD), while skewed variables were presented as median (interquartile range, IQR). Categorical variables were described as frequency and percentage (%).
METS-IR was categorized into quartiles and used as a categorical variable, with the lowest quartile (Q1) serving as the reference group. Multivariable logistic regression models were applied to assess the associations between METS-IR and both the primary and secondary outcomes. The results were presented as odds ratios (ORs) with 95% confidence intervals (CIs). According to the STROBE statement (23), two models were constructed: Model I was unadjusted, and Model II was adjusted for age, test week, Cr, ALT, TC, history of hypertension, history of diabetes, tobacco use, alcohol consumption, IVF, adverse pregnancy history, parity, and education levels.
To explore potential effect modification, subgroup analyses were conducted by age, and multivariable logistic regression models were fitted accordingly. Interaction effects were assessed using likelihood ratio tests. A p-value of >0.05 indicated no significant interaction, whereas a p-value of ≤0.05 suggested possible effect modification. Additionally, generalized additive models with smoothing splines were employed to examine the dose–response relationship between METS-IR and GDM.
Finally, receiver operating characteristic (ROC) curves were used to evaluate the predictive performance of METS-IR for GDM, preterm birth, macrosomia, GDM&PE, and GDMA2. The area under the curve (AUC) and optimal cut-off values were calculated to quantify the discriminative ability of METS-IR.
All statistical analyses were performed using Statistical Package for the Social Sciences (SPSS) software (version 21.0, IBM Corporation, Armonk, NY, USA) and R software (version 4.4.1, R Foundation for Statistical Computing). Two-sided p-values of <0.05 were considered statistically significant.
Results
Baseline characteristics
Table 1 presents the baseline characteristics of participants stratified by METS-IR quartiles. A total of 37,770 participants who met the inclusion and exclusion criteria were evenly distributed across the four groups. Analysis showed that only smoking history and alcohol consumption differed significantly across groups (p > 0.05), while variables such as age, prepregnancy BMI, and gestational week at METS-IR measurement did not show significant differences among the four groups (p < 0.05). The prevalence of GDM varied from 8.70 to 21.54% across METS-IR quartiles. Compared with the lowest METS-IR group, the higher METS-IR groups exhibited a significantly higher incidence of GDM. In addition, the incidence of macrosomia, GDM&PE, and GDMA2 was also markedly higher in the high METS-IR groups.
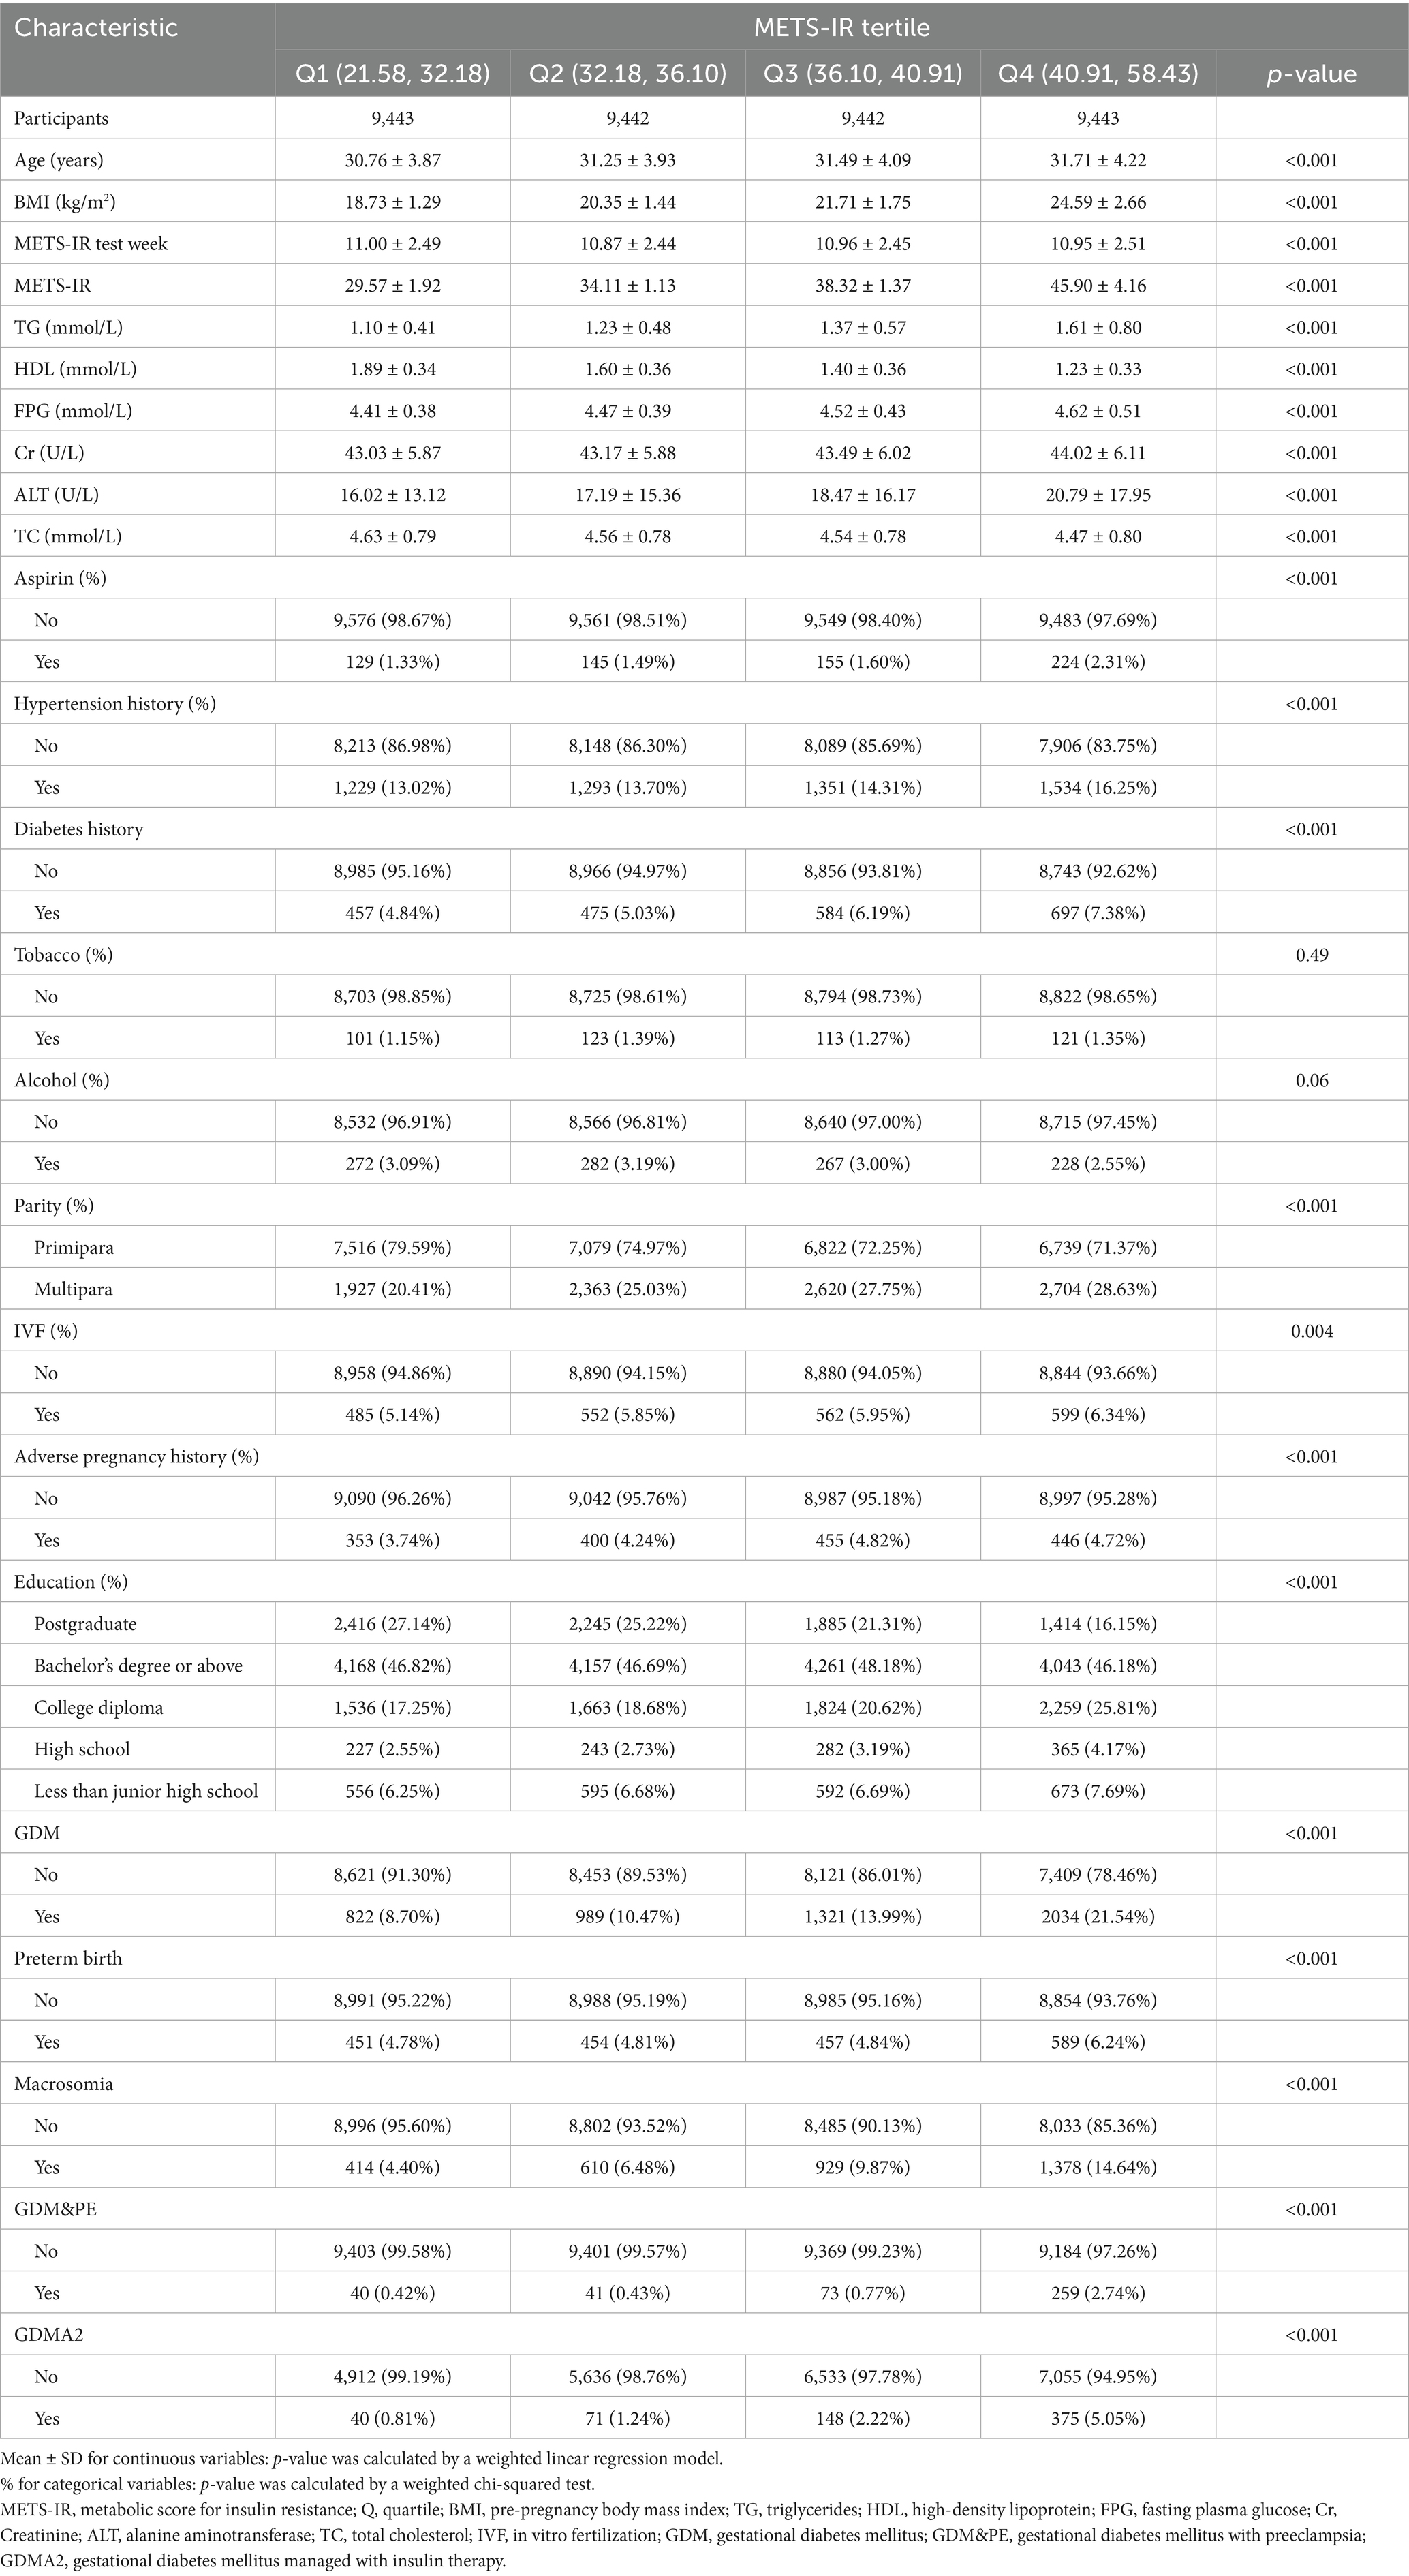
Table 1. Baseline characteristics of participants.
Association between METS-IR and GDM
Table 2 summarizes the associations between METS-IR and the primary outcome (GDM) and secondary outcomes (preterm birth, macrosomia, GDM&PE, and GDMA2), stratified by METS-IR quartiles, with the lowest quartile (Q1) serving as the reference group. In model I (unadjusted), the multivariable regression analysis revealed that, compared with Q1, participants in the higher METS-IR groups had significantly increased risks of GDM, macrosomia, and GDMA2 (p < 0.05). However, a significant increase in risk for preterm birth and GDM&PE was observed only in the highest quartile (Q4) (p < 0.05), with no significant differences in Q2 and Q3.
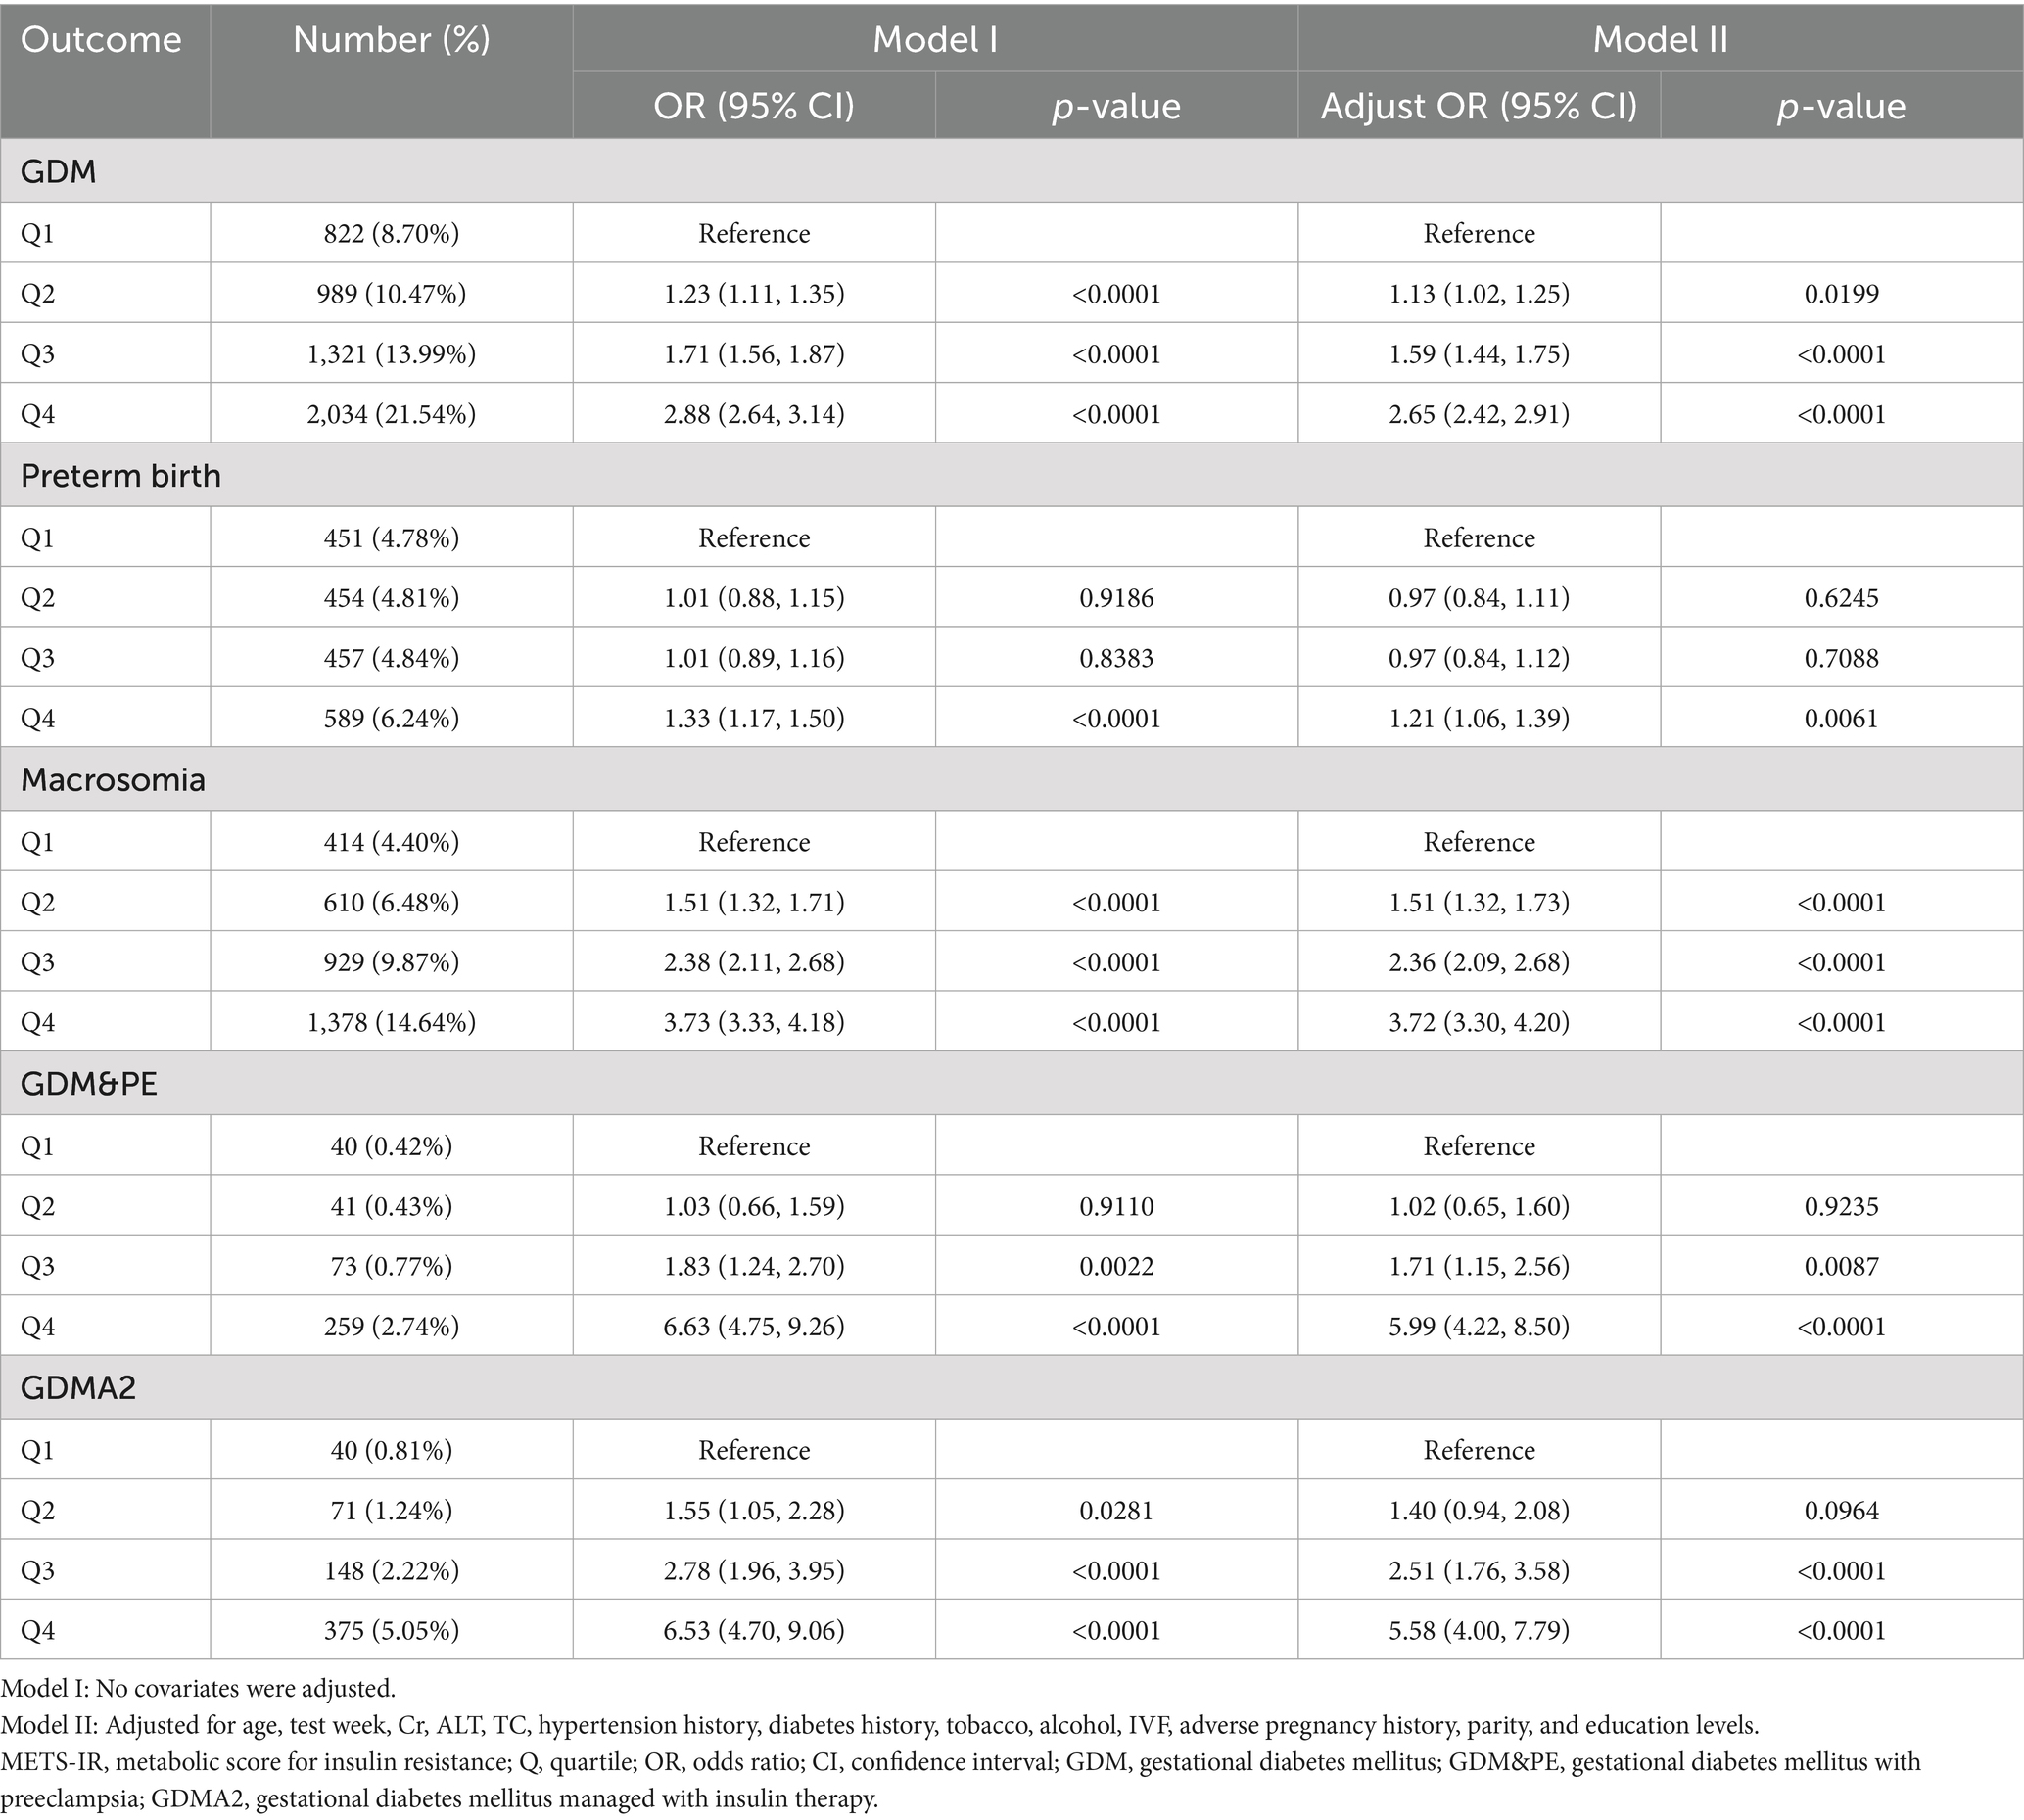
Table 2. The associations between METS-IR and risk of primary and secondary outcomes.
In model II (adjusted for potential confounders), all three higher METS-IR groups showed statistically significant increases in GDM risk compared with Q1. Specifically, the risk of GDM increased by 13% in Q2 (OR = 1.13, 95% CI: 1.02–1.25), 59% in Q3 (OR = 1.59, 95% CI: 1.44–1.75), and 165% in Q4 (OR = 2.65, 95% CI: 2.42–2.91).
The risk of preterm birth did not significantly increase in Q2 and Q3 but increased by 21% in Q4 (OR = 1.21, 95% CI: 1.06–1.39). The risk of macrosomia closely mirrored that of GDM, showing significant increases in all higher METS-IR groups, especially in Q4, where the risk increased by 272% (OR = 3.72, 95% CI: 3.30–4.20). The risk of GDM&PE was significantly elevated in Q3 and Q4, with a 499% increase in Q4 (OR = 5.99, 95% CI: 4.22–8.50). Similarly, the risk of GDMA2 increased significantly in Q3 and Q4, with a 458% increase in Q4 (OR = 5.58, 95% CI: 4.00–7.79).
Furthermore, generalized additive models with smoothing splines suggested a near-linear dose–response relationship between METS-IR levels and GDM risk (Figure 2), indicating that higher METS-IR values were consistently associated with increased GDM risk.
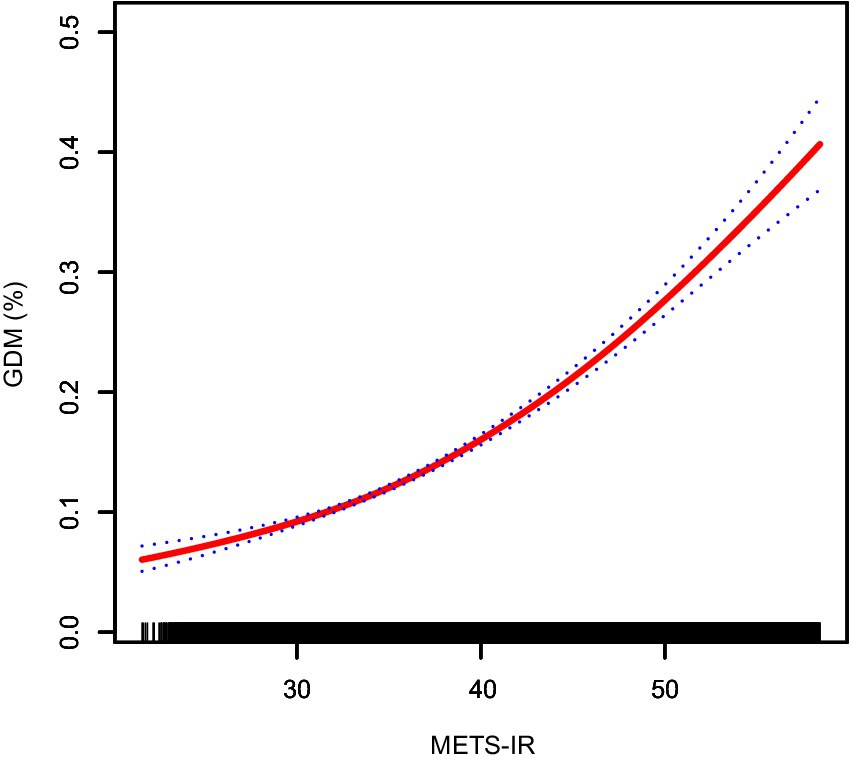
Figure 2. Smooth curve fitting showing the nonlinear relationship between METS-IR and the risk of GDM. The red solid line represents the probability of GDM occurrence, and the blue dotted line indicates the 95% confidence interval (CI) curve. METS-IR, metabolic score for insulin resistance; GDM, gestational diabetes mellitus.
Sensitivity analysis
To further explore the association between METS-IR and GDM, preterm birth, macrosomia, GDM&PE, and GDMA2, subgroup analyses were conducted based on maternal age. Table 3 presents the results of these subgroup analyses. Within the same METS-IR quartile, the incidence of GDM was clearly higher among women aged ≥ 35 years compared to those younger than 35 years (Q1: 7.60% vs. 15.37%; Q2: 9.31% vs. 16.31%; Q3: 12.06% vs. 22.05%; Q4: 19.11% vs. 30.35%). Figure 3 illustrates the dose–response relationship between METS-IR and GDM risk derived from smoothed curve fitting. The results indicated that, at the same METS-IR level, women aged ≥35 years had a higher risk of GDM, and the overall trend of increasing GDM risk with rising METS-IR was consistent across age groups.
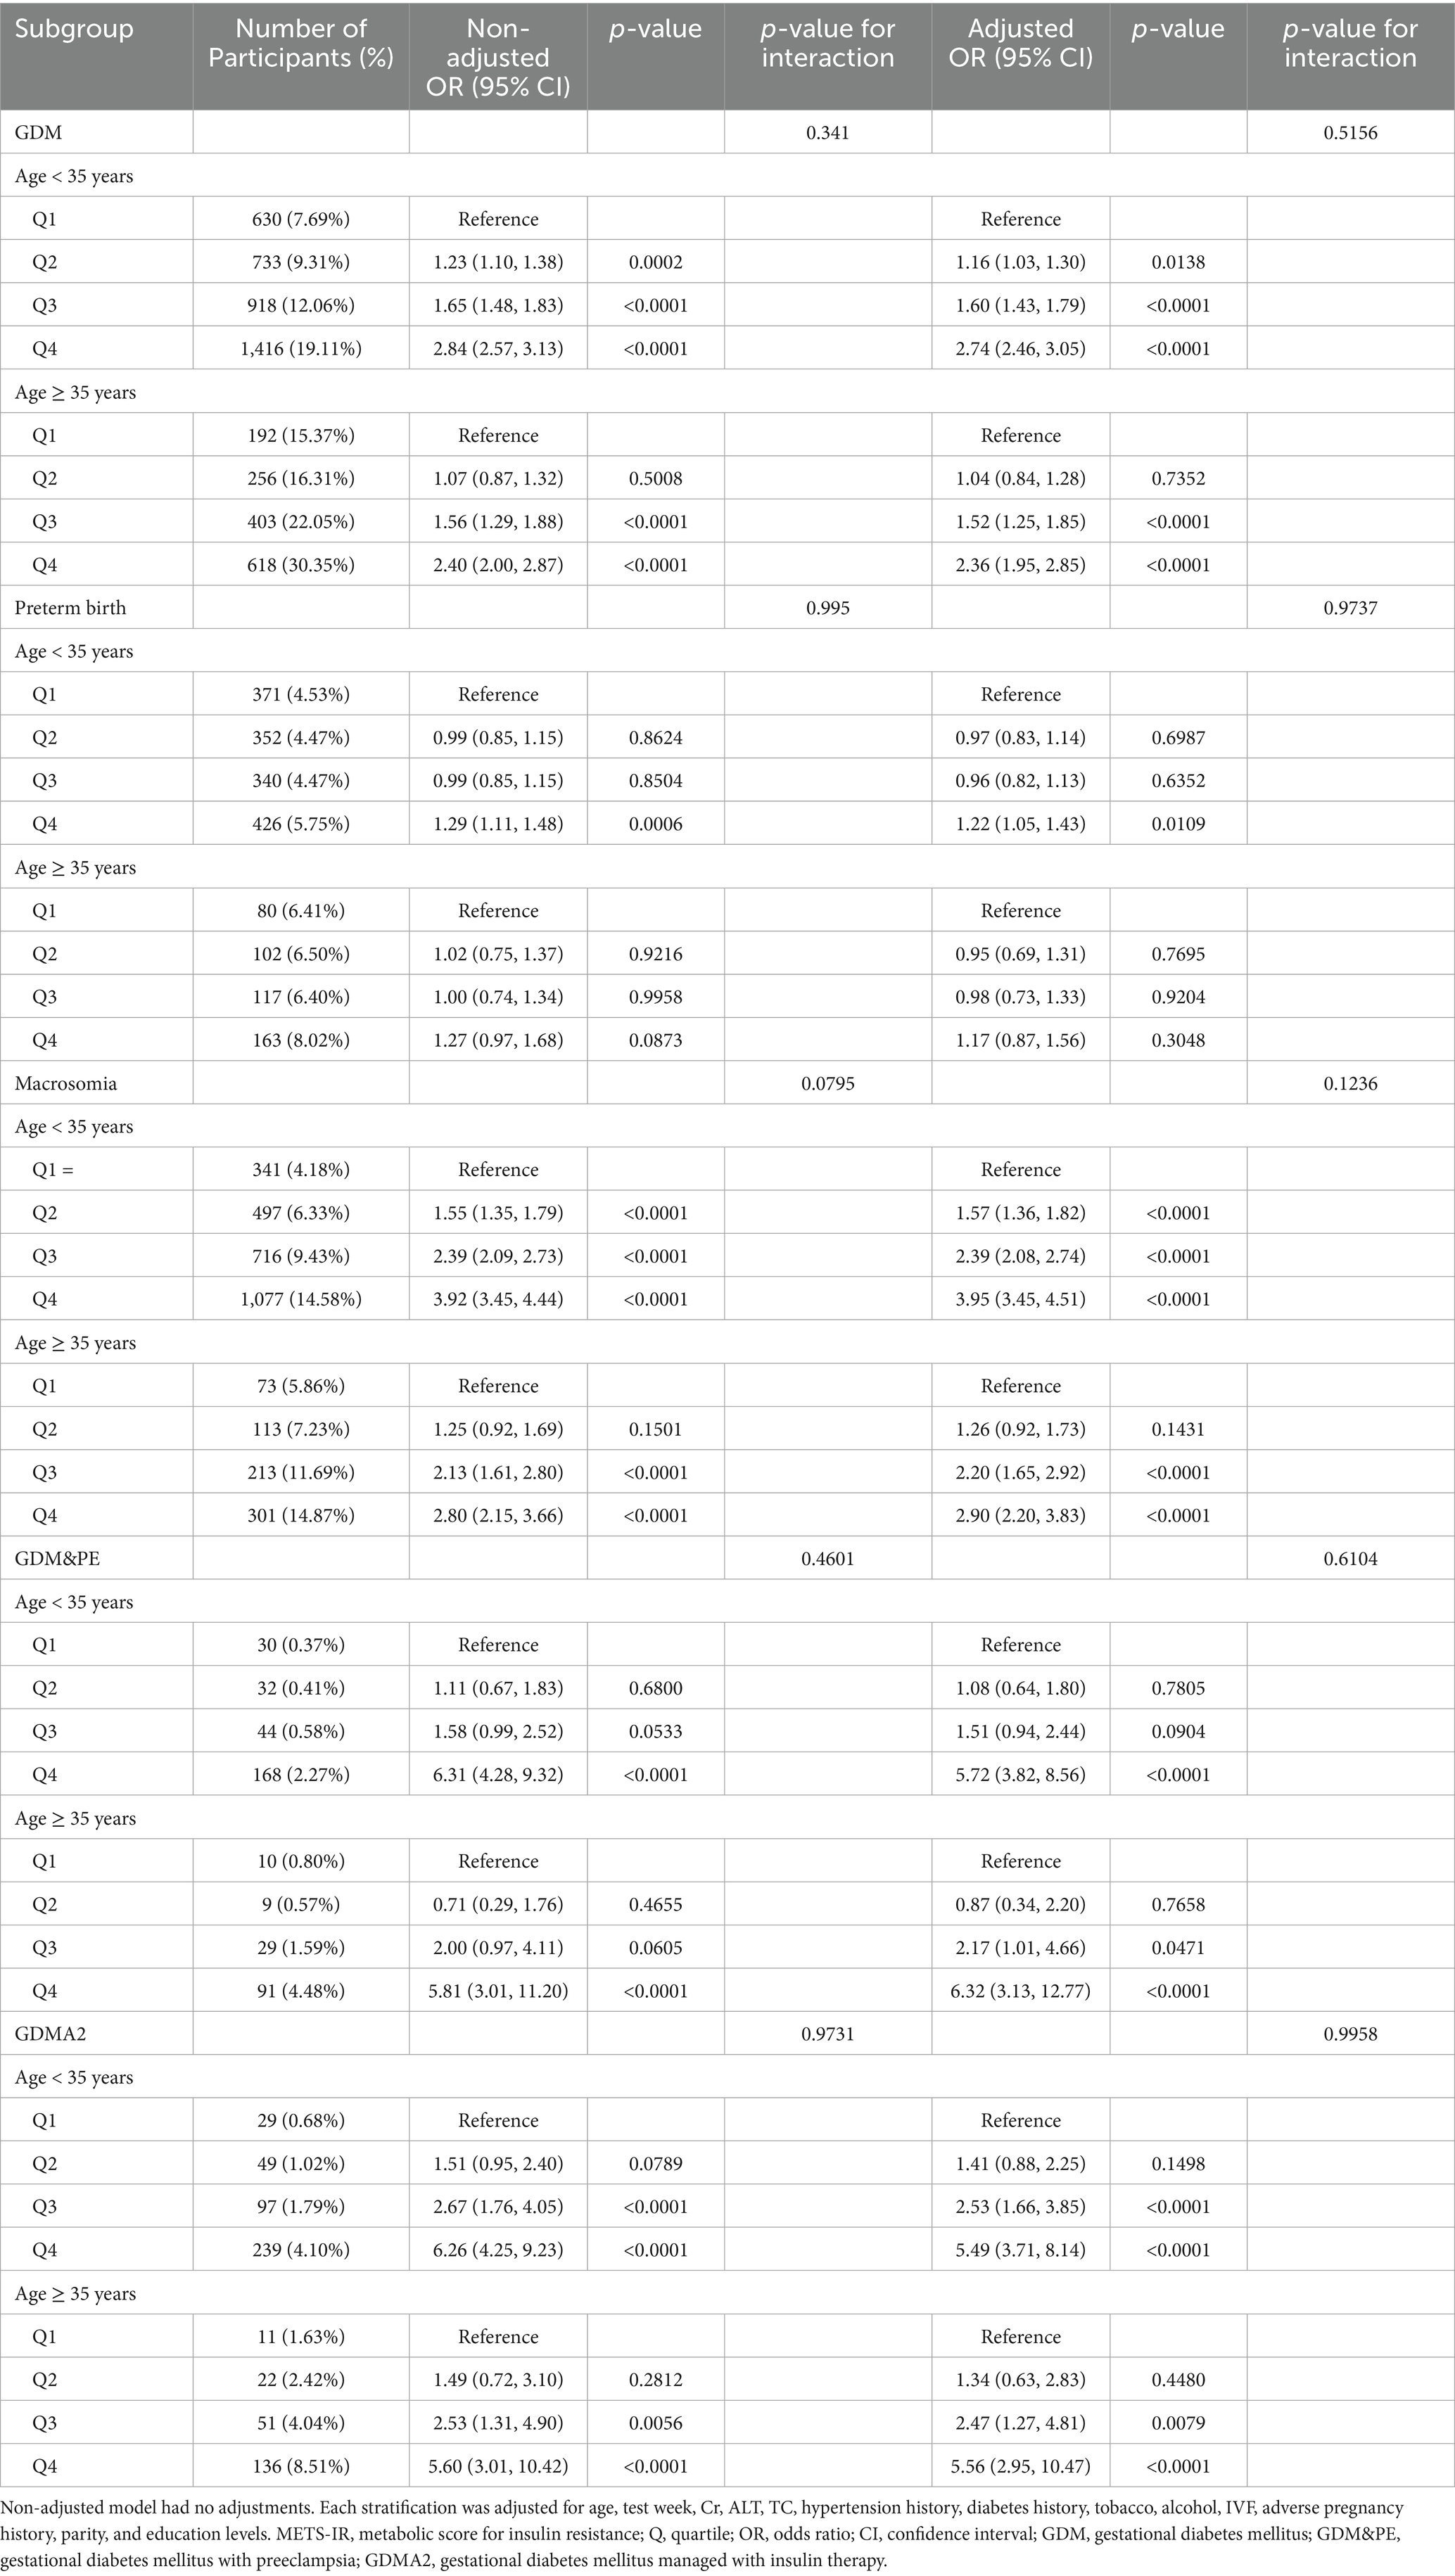
Table 3. Subgroup analysis of the METS-IR index and primary and secondary outcomes.
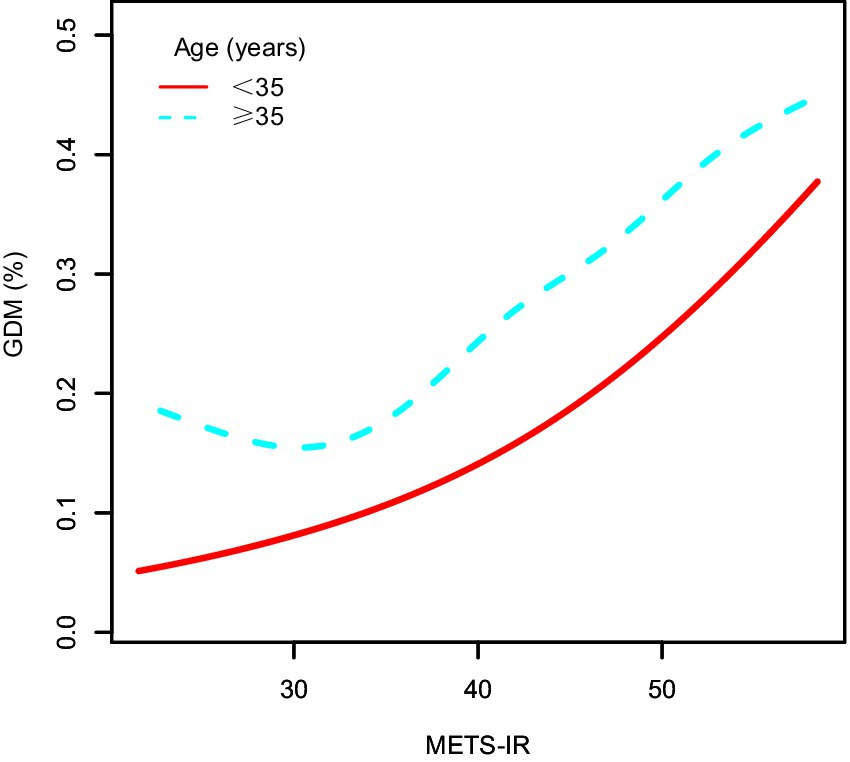
Figure 3. The dose–response relationship between METS-IR and GDM, stratified by age. METS-IR, metabolic score for insulin resistance; GDM, gestational diabetes mellitus.
After adjusting for confounding factors, the association between METS-IR and GDM remained consistent across all quartiles in women younger than 35 years. Compared with Q1, the risk of GDM increased by 52% in Q3 (OR = 1.52, 95% CI: 1.25–1.85) and by 136% in Q4 (OR = 2.36, 95% CI: 1.95–2.85). Subgroup analysis for macrosomia yielded findings similar to those for GDM. The associations between METS-IR and GDM&PE or GDMA2 were generally consistent across age groups. For preterm birth, after adjustment, a significant increase in risk was observed in Q4 among women younger than 35 years (OR = 1.22, 95% CI: 1.05–1.43). However, no significant differences were found among different METS-IR groups in women aged ≥ 35 years. The interaction test showed no statistically significant differences among all the subgroups (interaction p > 0.05).
ROC analysis
ROC analysis was used to evaluate the predictive performance of METS-IR for GDM and its related adverse outcomes. As shown in Table 4 and Figure 4, the AUC for GDM, preterm birth, macrosomia, GDM&PE, and GDMA2 was 0.623 (95% CI: 0.614–0.631), 0.532 (95% CI: 0.518–0.546), 0.640 (95% CI: 0.631–0.650), 0.741 (95% CI: 0.715–0.767), and 0.712 (95% CI: 0.691–0.733), respectively. Using the Youden index, optimal cut-off values for predicting GDM, preterm birth, macrosomia, GDM&PE, and GDMA2 were identified as 38.118, 36.633, 37.992, 40.509, and 42.314, respectively. The corresponding specificities were 64.4, 65.0, 63.1, 73.8, and 77.2%, respectively, and the sensitivities were 54.0, 41.3, 58.4, 64.9, and 54.3%, respectively.
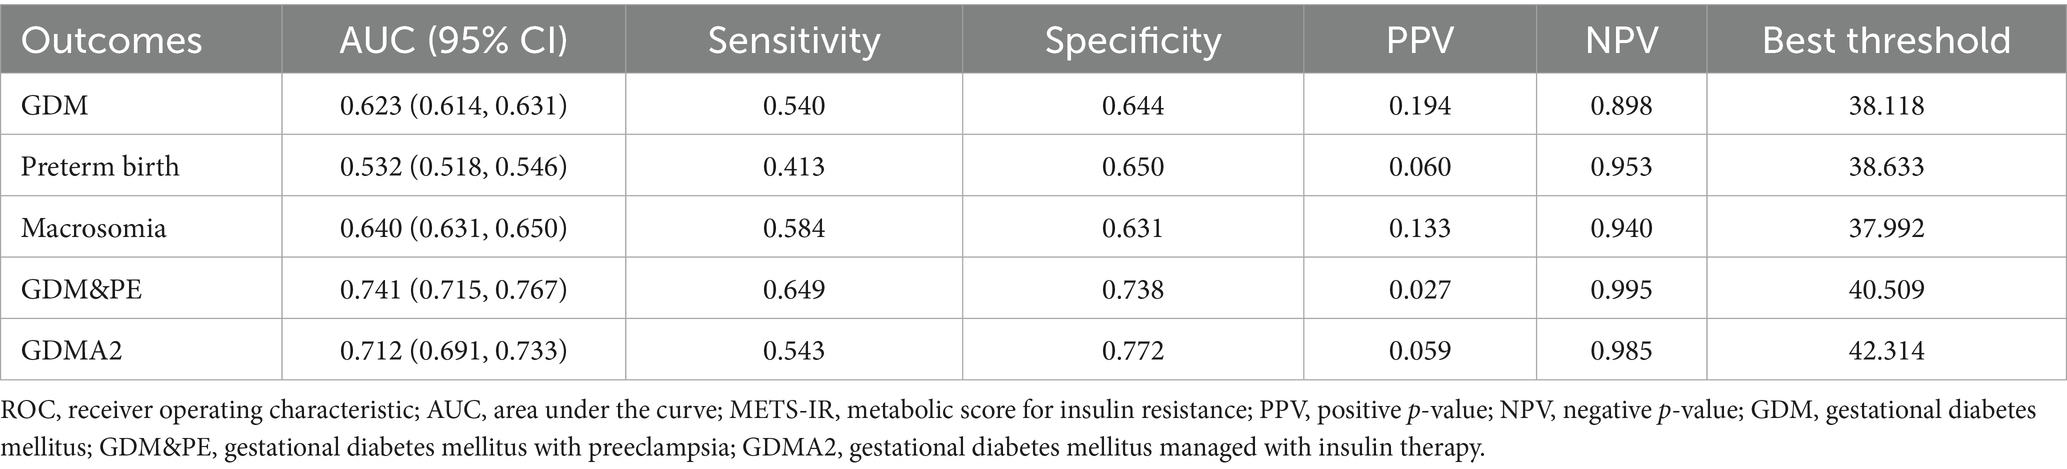
Table 4. Results of ROC analysis of the METS-IR index used to predict the development of primary and secondary outcomes.
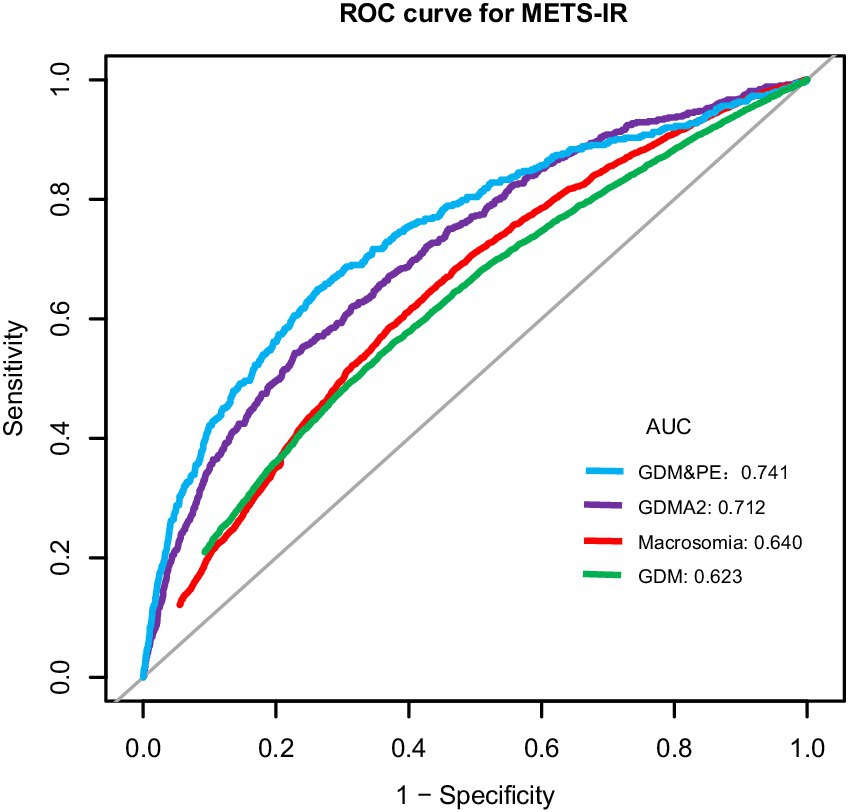
Figure 4. ROC curves for METS-IR to predict the risk of GDM, preterm birth, macrosomia, GDM&PE, and GDMA2 in all participants. ROC, receiver operating characteristic; AUC, area under the curve; METS-IR, metabolic score for insulin resistance; GDM, gestational diabetes mellitus; GDM&PE, GDM complicated with preeclampsia; GDMA2, pharmacologically treated GDM.
Discussion
In this study, we conducted a retrospective cohort analysis of 37,770 pregnant women from three hospitals in China, aiming to investigate the association between METS-IR and GDM, as well as its related adverse pregnancy outcomes. After adjusting for potential confounding factors, the results demonstrated a positive correlation between METS-IR and the risk of GDM. Subgroup analyses stratified by maternal age confirmed a consistent positive association between METS-IR and GDM. Moreover, METS-IR exhibited good discriminative ability in predicting GDM and its complications. Notably, it showed strong predictive performance for GDM&PE and GDMA2, with AUC values of 0.741 (95% CI: 0.715–0.767) and 0.712 (95% CI: 0.691–0.733), respectively. These findings indicate that METS-IR, as a simple and non-invasive metabolic assessment tool, holds potential clinical value in risk stratification and severity prediction of GDM.
Previous studies have established that increased IR is a central mechanism in the development of GDM (24). The EHC technique is considered the gold standard for assessing insulin resistance. However, it is complex, costly, and invasive, making it unsuitable for routine clinical use. As a result, several surrogate indices, including the Quantitative Insulin Sensitivity Check Index (QUICKI), the homeostasis model assessment of insulin resistance (HOMA-IR), the triglyceride-glucose (TyG) index, and the TG/HDL-C, have been used to evaluate insulin resistance and its association with GDM (25, 26). However, the clinical validity of these indices remains uncertain. METS-IR is non-invasive and easily calculated from routine clinical data. Evidence has shown that METS-IR demonstrates better diagnostic performance for insulin resistance compared to EHC (11), and it has been identified as an independent predictor of type 2 diabetes mellitus (13). Our findings indicate that, as METS-IR percentile scores increase, so does the risk of GDM in a graded manner. Compared with the lowest quartile, individuals in the highest METS-IR quartile had a 165% higher risk of developing GDM. This observation aligns with previous findings in general populations. For instance, Cheng et al. (14) reported a significant association between elevated METS-IR and T2DM incidence (OR: 1.804; 95% CI: 1.720–1.891). Another cross-sectional study conducted in China provided similar evidence of a positive correlation (27), and a subsequent 6-year longitudinal study found that each one-standard-deviation increase in METS-IR was associated with an 82% higher risk of developing diabetes (28). More recently, a cohort study in a Japanese population showed that participants in the highest METS-IR quartile had a 215% higher risk of developing diabetes compared to those in the lowest quartile (13). Recent studies have reported a positive association between elevated METS-IR and an increased risk of GDM (16, 17). Building on these findings, our multicenter study with a large sample size, rigorous control of confounders, and comprehensive statistical analyses further confirms the association between METS-IR and GDM. Given the practicality of METS-IR measurement and its strong pathophysiological link to IR, its application in identifying high-risk individuals for GDM appears feasible. To further assess the predictive performance of METS-IR for GDM, we conducted ROC curve analysis, which yielded an AUC of 0.623 (95% CI: 0.614–0.631), with a specificity of 64.4% and a sensitivity of 54.0%. Although the AUC is less than 0.7, METS-IR may be considered as a potential indicator for GDM risk stratification, helping to identify individuals at higher risk during early pregnancy.
In this study, we further evaluated the association between METS-IR and multiple adverse pregnancy outcomes related to GDM. The results showed no significant association between METS-IR and preterm birth, whereas significant positive correlations were observed between METS-IR and macrosomia, GDM&PE, and GDMA2. These findings suggest that METS-IR not only reflects overall IR in pregnant women but may also uncover underlying pathophysiological mechanisms of GDM-related complications. Emerging evidence has demonstrated that IR is closely linked to both GDM and its adverse perinatal outcomes. For instance, compared with women with normal glucose tolerance, those with GDM exhibit higher levels of IR accompanied by more severe metabolic disturbances and worse perinatal outcomes (29). Moreover, insulin resistance has been recognized as one of the key metabolic underpinnings of preeclampsia (PE) (30). However, unlike some previous studies that reported a significant association between IR and preterm birth (8), our study did not detect a statistically significant relationship between METS-IR and preterm birth. This inconsistency may stem from differences in calculation methods and clinical applicability among various IR assessment tools, or it could be due to variations in population characteristics and the extent of confounding adjustment across studies. Notably, our findings revealed that METS-IR demonstrated good predictive performance for GDM&PE and GDMA2, with AUC values of 0.741 and 0.712, respectively, exceeding the performance of several traditional risk parameters. IR not only represents metabolic dysregulation but is also closely associated with endothelial dysfunction (31), and these shared mechanisms may form the basis for the co-occurrence of GDM and PE. Furthermore, accumulating evidence suggests that multiple pathological pregnancy conditions, including PE, GDM, and obesity, are characterized by reduced insulin signaling in the fetal-placental vasculature (32, 33). Therefore, as a surrogate marker of insulin resistance, METS-IR holds clinical value not only in identifying high-risk individuals for GDM but also in predicting severe GDM subtypes complicated by preeclampsia or requiring insulin therapy.
Given that advanced maternal age (≥35 years) is a well-established independent risk factor for GDM (34), we conducted a subgroup analysis stratified by age. The results were consistent with expectations, showing a significantly higher incidence of GDM in the ≥ 35 years group. The positive association between METS-IR and GDM was largely consistent across age groups, indicating that METS-IR is a feasible and stable tool for risk stratification in pregnant women of different ages. However, within the ≥ 35 years subgroup, a significant association between METS-IR and GDM was observed only in Q3 and Q4, but not in Q2. To explain this discrepancy, we propose the following possibilities: It has been documented that, with increasing age, pancreatic β-cell function declines, insulin sensitivity decreases, and glucose metabolism becomes more impaired, thereby elevating the risk of GDM (35, 36). Nevertheless, some older pregnant women may already have a certain degree of insulin resistance prior to pregnancy, which could potentially reduce the sensitivity of METS-IR in capturing changes in IR levels. Additionally, age is an important determinant of lipid metabolism. Studies have shown that HDL-C levels tend to decline with advancing age (37). Since both FPG and HDL-C are key components in the calculation of METS-IR, their age-related variations may affect the stability of the score and consequently reduce its accuracy in predicting GDM. Finally, as an independent risk factor for GDM, age may contribute to disease development through mechanisms not directly related to IR. Therefore, in clinical practice, it is essential to integrate other risk factors alongside METS-IR when assessing GDM risk in older pregnant women.
The association between METS-IR and GDM may involve multiple interacting pathophysiological mechanisms. IR is a central mechanism in the development of GDM. During normal pregnancy, a progressive increase in IR serves as an adaptive response to meet the growing energy demands of both mother and fetus (38). However, when IR becomes excessively elevated, it can lead to inadequate β-cell compensation, resulting in glucose metabolic imbalance and increased risk of GDM (39, 40). As a composite indicator of insulin resistance, elevated METS-IR reflects increased IR and thus holds potential value in identifying individuals at higher risk. Dyslipidemia also plays a significant role in GDM progression. Studies have shown that, compared with women with normal pregnancies, those with GDM often exhibit lower HDL-C levels and higher levels of TG, TC, and LDL-C (41, 42). Since METS-IR incorporates both TG and HDL-C into its scoring system, it partially reflects the degree of lipid metabolic disturbance. Chronic inflammation is another key link connecting insulin resistance and GDM. Pro-inflammatory cytokines such as IL-6 can suppress lipoprotein lipase activity, promote TG accumulation, and exacerbate IR (43). In addition, inflammatory mediators, such as IL-1β, can activate multiple signaling pathways and directly impair pancreatic β-cell function (44, 45). C-reactive protein (CRP) further contributes to systemic inflammation and worsens insulin action defects (46). Previous studies have demonstrated a positive correlation between METS-IR and inflammatory markers, such as CRP and IL-6 (47). Oxidative stress also contributes to insulin resistance by activating the NF-κB pathway, leading to endothelial dysfunction and impaired IR (48). Moreover, lifestyle factors such as dietary patterns and physical activity levels significantly influence insulin sensitivity and thereby modulate the risk of developing GDM. In summary, the relationship between METS-IR and GDM likely results from the complex interplay of multiple metabolic, inflammatory, and oxidative stress mechanisms.
The main strengths of this study lie in its multicenter design and large sample size, which effectively reduced bias caused by small sample sizes and enhanced statistical power, thereby improving the generalizability and applicability of the findings. Moreover, METS-IR is a simple, non-invasive, and easily obtainable metabolic index with good clinical feasibility, making it suitable for widespread application in routine clinical practice and highlighting its important clinical value. Despite these strengths, several limitations should be acknowledged. First, this study was based only on baseline measurements before 24 weeks of gestation. Since METS-IR may vary dynamically across gestation, future prospective studies with multiple time points are needed to explore longitudinal changes in METS-IR and their association with GDM. Second, all participants were from China. Given potential differences in genetic background, lifestyle, and metabolic profiles across populations, future studies in multiethnic and multicenter settings are necessary to confirm the generalizability of our findings. Finally, as a retrospective cohort study, our analysis excluded some patients due to incomplete clinical data. Additionally, information on exercise, dietary interventions, and insulin use was not collected. Although we adjusted for multiple confounders, potential selection bias may still influence the results.
Conclusion
Our findings demonstrate that the METS-IR score is positively associated with the risk of GDM and has a certain predictive value for GDM occurrence, particularly in identifying severe subtypes such as GDM&PE or GDMA2. As a novel, simple, and easily accessible marker of insulin resistance, METS-IR holds promise for use in risk stratification and early intervention strategies for GDM, offering valuable clinical insights with strong practical implications.
Data availability statement
The original contributions presented in the study are included in the article/supplementary material; further inquiries can be directed to the corresponding author/s.
Ethics statement
The studies involving humans were approved by the ethics committees of Fudan University Obstetrics and Gynecology Hospital and the ethics committees of Chenzhou First People’s Hospital. The studies were conducted in accordance with the local legislation and institutional requirements. The participants provided their written informed consent to participate in this study. Written informed consent was obtained from the individual(s) for the publication of any potentially identifiable images or data included in this article.
Author contributions
QL: Validation, Writing – review & editing, Formal analysis, Funding acquisition, Data curation, Visualization, Investigation, Resources, Conceptualization, Writing – original draft, Methodology. AC: Writing – review & editing, Validation, Funding acquisition. CZ: Writing – review & editing, Resources, Writing – original draft. YZ: Writing – original draft, Writing – review & editing, Resources. ML: Writing – review & editing, Writing – original draft, Resources. YG: Writing – original draft, Resources, Writing – review & editing. YP: Methodology, Writing – review & editing, Writing – original draft. PY: Writing – review & editing, Methodology, Writing – original draft. CY: Resources, Project administration, Visualization, Validation, Formal analysis, Writing – review & editing, Writing – original draft, Supervision, Data curation, Investigation, Conceptualization, Software, Methodology.
Funding
The author(s) declare that financial support was received for the research and/or publication of this article. This study was supported by the Xiangnan College-Level Research Project (2024XJ162), the Top Talent Support Program for young and middle-aged people of Wuxi Health Committee (BJ2020079 and BJ2023076), Jiangsu Commission of Health Scientific Research Project (Z2024001), and the Wuxi Association for Science and Technology Soft Science Research Project (KX-25-A18).
Acknowledgments
This research has been conducted using data collected from the Obstetrics and Gynecology Hospital affiliated with Fudan University, Huangpu Branch and Yangpu Branch, and the First People’s Hospital of Chenzhou. All authors thank the physicians, nurses, and scientific staff of the two hospitals.
Conflict of interest
The authors declare that the research was conducted in the absence of any commercial or financial relationships that could be construed as a potential conflict of interest.
Generative AI statement
The authors declare that no Gen AI was used in the creation of this manuscript.
Any alternative text (alt text) provided alongside figures in this article has been generated by Frontiers with the support of artificial intelligence and reasonable efforts have been made to ensure accuracy, including review by the authors wherever possible. If you identify any issues, please contact us.
Publisher’s note
All claims expressed in this article are solely those of the authors and do not necessarily represent those of their affiliated organizations, or those of the publisher, the editors and the reviewers. Any product that may be evaluated in this article, or claim that may be made by its manufacturer, is not guaranteed or endorsed by the publisher.
References
1. Diagnostic criteria and classification of hyperglycaemia first detected in pregnancy: a World Health Organization guideline. Diabetes Res Clin Pract. (2014) 103:341–63. doi: 10.1016/j.diabres.2013.10.012
2. Chivese, T, Hoegfeldt, CA, Werfalli, M, Yuen, L, Sun, H, Karuranga, S, et al. IDF diabetes atlas: the prevalence of pre-existing diabetes in pregnancy - a systematic reviewand meta-analysis of studies published during 2010-2020. Diabetes Res Clin Pract. (2022) 183:109049. doi: 10.1016/j.diabres.2021.109049
3. Sweeting, A, Wong, J, Murphy, HR, and Ross, GP. A clinical update on gestational diabetes mellitus. Endocr Rev. (2022) 43:763–93. doi: 10.1210/endrev/bnac003
4. Ye, W, Luo, C, Huang, J, Li, C, Liu, Z, and Liu, F. Gestational diabetes mellitus and adverse pregnancy outcomes: systematic review and meta-analysis. BMJ. (2022) 377:e067946. doi: 10.1136/bmj-2021-067946
5. Saravanan, P. Gestational diabetes: opportunities for improving maternal and child health. Lancet Diabetes Endocrinol. (2020) 8:793–800. doi: 10.1016/S2213-8587(20)30161-3
6. Yamamoto, JM, Kellett, JE, Balsells, M, García-Patterson, A, Hadar, E, Solà, I, et al. Gestational diabetes mellitus and diet: a systematic review and Meta-analysis of randomized controlled trials examining the impact of modified dietary interventions on maternal glucose control and neonatal birth weight. Diabetes Care. (2018) 41:1346–61. doi: 10.2337/dc18-0102
7. Buchanan, TA, and Xiang, AH. Gestational diabetes mellitus. J Clin Invest. (2005) 115:485–91. doi: 10.1172/JCI200524531
8. Benhalima, K, Van Crombrugge, P, Moyson, C, Verhaeghe, J, Vandeginste, S, Verlaenen, H, et al. Characteristics and pregnancy outcomes across gestational diabetes mellitus subtypes based on insulin resistance. Diabetologia. (2019) 62:2118–28. doi: 10.1007/s00125-019-4961-7
9. Mastrogiannis, DS, Spiliopoulos, M, Mulla, W, and Homko, CJ. Insulin resistance: the possible link between gestational diabetes mellitus and hypertensive disorders of pregnancy. Curr Diab Rep. (2009) 9:296–302. doi: 10.1007/s11892-009-0046-1
10. DeFronzo, RA, Tobin, JD, and Andres, R. Glucose clamp technique: a method for quantifying insulin secretion and resistance. Am J Phys. (1979) 237:E214–23.
11. Bello-Chavolla, OY, Almeda-Valdes, P, Gomez-Velasco, D, Viveros-Ruiz, T, Cruz-Bautista, I, Romo-Romo, A, et al. METS-IR, a novel score to evaluate insulin sensitivity, is predictive of visceral adiposity and incident type 2 diabetes. Eur J Endocrinol. (2018) 178:533–44. doi: 10.1530/EJE-17-0883
12. Hou, Y, Li, R, Xu, Z, Chen, W, Li, Z, Jiang, W, et al. Association of METS-IR index with type 2 diabetes: a cross-sectional analysis of national health and nutrition examination survey data from 2009 to 2018. PLoS One. (2024) 19:e0308597. doi: 10.1371/journal.pone.0308597
13. Qiu, J, He, S, Yu, C, Yang, R, Kuang, M, Sheng, G, et al. Assessing the validity of METS-IR for predicting the future onset of diabetes: an analysis using time-dependent receiver operating characteristics. BMC Endocr Disord. (2024) 24:238. doi: 10.1186/s12902-024-01769-0
14. Cheng, H, Yu, X, Li, YT, Jia, Z, Wang, JJ, Xie, YJ, et al. Association between METS-IR and prediabetes or type 2 diabetes mellitus among elderly subjects in China: a large-scale population-based study. Int J Environ Res Public Health. (2023) 20:1053. doi: 10.3390/ijerph20021053
15. Xie, Q, Kuang, M, Lu, S, Huang, X, Wang, C, Zhang, S, et al. Association between MetS-IR and prediabetes risk and sex differences: a cohort study based on the Chinese population. Front Endocrinol. (2023) 14:1175988. doi: 10.3389/fendo.2023.1175988
16. Liu, J, Zhu, Y, Shi, H, Miao, Y, Chen, J, Li, Q, et al. First trimester metabolic syndrome insulin resistance index and offspring congenital heart disease risk: the mediating role of gestational diabetes mellitus. J Cardiol. (2025) 21:S0914-5087. doi: 10.1016/j.jjcc.2025.08.008
17. Rouholamin, S, Razavi, M, Pirjani, R, and Rezaeinejad, M. Metabolic score for insulin resistance (METS-IR) as a predictor of gestational diabetes: findings from a prospective Iranian cohort study. Clin Biochem. (2025) 139:110982. doi: 10.1016/j.clinbiochem.2025.110982
18. Arabzadeh, H, Doosti-Irani, A, Kamkari, S, Farhadian, M, Elyasi, E, and Mohammadi, Y. The maternal factors associated with infant low birth weight: an umbrella review. BMC Pregnancy Childbirth. (2024) 24:316. doi: 10.1186/s12884-024-06487-y
19. Weinert, LS. International Association of Diabetes and Pregnancy Study Groups recommendations on the diagnosis and classification of hyperglycemia in pregnancy: comment to the International Association of Diabetes and Pregnancy Study Groups Consensus Panel. Diabetes Care. (2010) 33:e97; author reply e8. doi: 10.2337/dc10-0544
20. Swarray-Deen, A, Sepenu, P, Mensah, TE, Osei-Agyapong, J, Sefogah, PE, Appiah-Sakyi, K, et al. Preterm birth in low-middle income countries. Best Pract Res Clin Obstet Gynaecol. (2024) 95:102518. doi: 10.1016/j.bpobgyn.2024.102518
21. Jeyaseelan, L, Yadav, B, Silambarasan, V, Vijayaselvi, R, and Jose, R. Large for gestational age births among south Indian women: temporal trend and risk factors from 1996 to 2010. J Obstet Gynaecol India. (2016) 66:42–50. doi: 10.1007/s13224-015-0765-y
22. Gestational hypertension and preeclampsia: ACOG practice bulletin summary, number 222. Obstet Gynecol. (2020) 135:1492–5. doi: 10.1097/AOG.0000000000003892
23. Fitchett, EJA, Seale, AC, Vergnano, S, Sharland, M, Heath, PT, Saha, SK, et al. Strengthening the reporting of observational studies in epidemiology for newborn infection (STROBE-NI): an extension of the STROBE statement for neonatal infection research. Lancet Infect Dis. (2016) 16:e202–13. doi: 10.1016/S1473-3099(16)30082-2
24. Mora-Ortiz, M, and Rivas-García, L. Gestational diabetes mellitus: unveiling maternal health dynamics from pregnancy through postpartum perspectives. Open Res Europe. (2024) 4:164. doi: 10.12688/openreseurope.18026.2
25. Poveda, NE, Garcés, MF, Darghan, AE, Jaimes, SAB, Sánchez, EP, Díaz-Cruz, LA, et al. Triglycerides/glucose and triglyceride/high-density lipoprotein cholesterol indices in normal and preeclamptic pregnancies: a longitudinal study. Int J Endocrinol. (2018):8956404. doi: 10.1155/2018/8956404
26. Tahapary, DL, Pratisthita, LB, Fitri, NA, Marcella, C, Wafa, S, Kurniawan, F, et al. Challenges in the diagnosis of insulin resistance: focusing on the role of HOMA-IR and tryglyceride/glucose index. Diabetes Metab Syndr Clin Res Rev. (2022) 16:102581. doi: 10.1016/j.dsx.2022.102581
27. Li, X, Xue, Y, Dang, Y, Liu, W, Wang, Q, Zhao, Y, et al. Association of non-Insulin-Based Insulin Resistance Indices with risk of incident prediabetes and diabetes in a Chinese rural population: a 12-year prospective study. Diabetes Metabolic Syndrome Obesity. (2022) 15:3809–19. doi: 10.2147/DMSO.S385906
28. Zhang, M, Liu, D, Qin, P, Liu, Y, Sun, X, Li, H, et al. Association of metabolic score for insulin resistance and its 6-year change with incident type 2 diabetes mellitus. J Diabetes. (2021) 13:725–34. doi: 10.1111/1753-0407.13161
29. Liu, Y, Hou, W, Meng, X, Zhao, W, Pan, J, Tang, J, et al. Heterogeneity of insulin resistance and beta cell dysfunction in gestational diabetes mellitus: a prospective cohort study of perinatal outcomes. J Transl Med. (2018) 16:289. doi: 10.1186/s12967-018-1666-5
30. Scioscia, M, Gumaa, K, and Rademacher, TW. The link between insulin resistance and preeclampsia: new perspectives. J Reprod Immunol. (2009) 82:100–5. doi: 10.1016/j.jri.2009.04.009
31. Muniyappa, R, and Sowers, JR. Role of insulin resistance in endothelial dysfunction. Rev Endocr Metab Disord. (2013) 14:5–12. doi: 10.1007/s11154-012-9229-1
32. Salsoso, R, Farías, M, Gutiérrez, J, Pardo, F, Chiarello, DI, Toledo, F, et al. Adenosine and preeclampsia. Mol Asp Med. (2017) 55:126–39. doi: 10.1016/j.mam.2016.12.003
33. Antonioli, L, Blandizzi, C, Csóka, B, Pacher, P, and Haskó, G. Adenosine signalling in diabetes mellitus--pathophysiology and therapeutic considerations. Nat Rev Endocrinol. (2015) 11:228–41. doi: 10.1038/nrendo.2015.10
34. Mehari, MA, Maeruf, H, Robles, CC, Woldemariam, S, Adhena, T, Mulugeta, M, et al. Advanced maternal age pregnancy and its adverse obstetrical and perinatal outcomes in Ayder comprehensive specialized hospital, northern Ethiopia, 2017: a comparative cross-sectional study. BMC Pregnancy Childbirth. (2020) 20:60. doi: 10.1186/s12884-020-2740-6
35. Meneilly, GS, Knip, A, and Tessier, D. Diabetes in the elderly. Can J Diabetes. (2013) 37:S184–90. doi: 10.1016/j.jcjd.2013.01.045
36. Bansal, N, Dhaliwal, R, and Weinstock, RS. Management of diabetes in the elderly. Med Clin North Am. (2015) 99:351–77. doi: 10.1016/j.mcna.2014.11.008
37. Cho, KH, Park, HJ, Kim, SJ, and Kim, JR. Decrease in HDL-C is associated with age and household income in adults from the Korean National Health and nutrition examination survey 2017: correlation analysis of low HDL-C and poverty. Int J Environ Res Public Health. (2019) 16. 3329 doi: 10.3390/ijerph16183329
38. Sonagra, AD, Biradar, SM, K, D, and Murthy, DSJ. Normal pregnancy- a state of insulin resistance. J Clin Diagn Res. (2014) 8:Cc01–3. doi: 10.7860/JCDR/2014/10068.5081
39. Powe, CE, Huston Presley, LP, Locascio, JJ, and Catalano, PM. Augmented insulin secretory response in early pregnancy. Diabetologia. (2019) 62:1445–52. doi: 10.1007/s00125-019-4881-6
40. Song, S, Zhang, Y, Qiao, X, Duo, Y, Xu, J, Peng, Z, et al. HOMA-IR as a risk factor of gestational diabetes mellitus and a novel simple surrogate index in early pregnancy. Int J Gynaecol Obstet. (2022) 157:694–701. doi: 10.1002/ijgo.13905
41. Toescu, V, Nuttall, SL, Martin, U, Nightingale, P, Kendall, MJ, Brydon, P, et al. Changes in plasma lipids and markers of oxidative stress in normal pregnancy and pregnancies complicated by diabetes. Clin Sci (Lond). (2004) 106:93–8. doi: 10.1042/CS20030175
42. Ryckman, KK, Spracklen, CN, Smith, CJ, Robinson, JG, and Saftlas, AF. Maternal lipid levels during pregnancy and gestational diabetes: a systematic review and meta-analysis. BJOG. (2015) 122:643–51. doi: 10.1111/1471-0528.13261
43. Kern, PA, Ranganathan, S, Li, C, Wood, L, and Ranganathan, G. Adipose tissue tumor necrosis factor and interleukin-6 expression in human obesity and insulin resistance. Am J Physiol Endocrinol Metab. (2001) 280:E745–51. doi: 10.1152/ajpendo.2001.280.5.E745
44. Rehman, K, and Akash, MS. Mechanisms of inflammatory responses and development of insulin resistance: how are they interlinked? J Biomed Sci. (2016) 23:87. doi: 10.1186/s12929-016-0303-y
45. Donath, MY, Böni-Schnetzler, M, Ellingsgaard, H, and Ehses, JA. Islet inflammation impairs the pancreatic beta-cell in type 2 diabetes. Physiology (Bethesda). (2009) 24:325–31. doi: 10.1152/physiol.00032.2009
46. Ndumele, CE, Pradhan, AD, and Ridker, PM. Interrelationships between inflammation, C-reactive protein, and insulin resistance. J Cardiometab Syndr. (2006) 1:190–6. doi: 10.1111/j.1559-4564.2006.05538.x
47. Ding, L, Gao, YH, Li, YR, Huang, YF, Wang, XY, and Qi, X. Metabolic score for insulin resistance is correlated to Adipokine disorder and inflammatory activity in female knee osteoarthritis patients in a Chinese population. Diabetes Metabolic Syndrome Obesity. (2020) 13:2109–18. doi: 10.2147/DMSO.S249025
48. Stühlinger, MC, Abbasi, F, Chu, JW, Lamendola, C, McLaughlin, TL, Cooke, JP, et al. Relationship between insulin resistance and an endogenous nitric oxide synthase inhibitor. JAMA. (2002) 287:1420–6. doi: 10.1001/jama.287.11.1420
Glossary
GDM - Gestational diabetes mellitus
IR - Insulin resistance
EHC - Euglycemic-hyperinsulinemic clamp
METS-IR - Metabolic score for insulin resistance
FPG - Fasting plasma glucose
TG - Triglycerides
HDL-C - High-density lipoprotein cholesterol
BMI - Body mass index
ALT - Alanine aminotransferase
Cr - Creatinine
TC - Total cholesterol
IVF - In vitro fertilization
OGTT - Oral glucose tolerance test
GDM&PE - GDM complicated with preeclampsia
GDMA2 - Pharmacologically treated GDM
Q - Quartile
SD - Standard deviation
OR - Odds ratio
CI - Confidence intervals
ROC - Receiver operating characteristic
AUC - Area under the curve
Keywords: METS-IR, insulin resistance, gestational diabetes mellitus, cohort study, multicenter
Citation: Li Q, Chen A, Zhao C, Zhang Y, Li M, Gu Y, Pang Y, Yu P and Yue C (2025) Association of metabolic score for insulin resistance with gestational diabetes mellitus: a multicenter cohort study. Front. Nutr. 12:1661119. doi: 10.3389/fnut.2025.1661119
Edited by:
Haoqiang Zhang, University of Science and Technology of China, ChinaReviewed by:
Wen wen Zhu, Affiliated Central Hospital of Huzhou University, ChinaXiangjin Gao, Tongji University, China
Copyright © 2025 Li, Chen, Zhao, Zhang, Li, Gu, Pang, Yu and Yue. This is an open-access article distributed under the terms of the Creative Commons Attribution License (CC BY). The use, distribution or reproduction in other forums is permitted, provided the original author(s) and the copyright owner(s) are credited and that the original publication in this journal is cited, in accordance with accepted academic practice. No use, distribution or reproduction is permitted which does not comply with these terms.
*Correspondence: Ping Yu, eXVwaW5nMTk4ODA3QDEyNi5jb20=; Chaoyan Yue, MjAxMTEyNTAwMDdAZnVkYW4uZWR1LmNu
†These authors have contributed equally to this work