 Chuanxin Shi1,2
 Qingyan Zhu1,2
 Zhuangzhuang Lu1,2
 Yongqi Yang1,2
 Yanan Ding1,2
 Junmin Li1,2
 Chunmei Zhang1,2
 Li Xi1,2
 Xiaofang He3
 Zhiqiang Li1,2
 Jincheng Han1,2
 Guangli Yang1,2
 Yan Guo1,2
 Bingbing Ma1,2*
- 1Department of Animal Science, College of Smart Animal Husbandry, College of Biology and Food, Shangqiu Normal University, Shangqiu, China
- 2Henan University-Enterprise Research and Development Center for Biological Feed, Shangqiu, China
- 3College of Animal Science and Food Engineering, Jinling Institute of Science and Technology, Nanjing, China
Background: Wheat is progressively utilized in animal husbandry. However, the chemical properties of wheat are influenced by breed and climate, consequently impacting its economic value and application in feed formulation. This study was conducted to evaluate the digestible energy (DE) and metabolizable energy (ME), as well as apparent total tract digestibility (ATTD) of nutrients in 17 samples of wheat for growing pigs.
Methods: Fifty-one growing barrows were randomly allotted to 17 experimental diets (3 pigs in each diet). The experiment included two successive periods, and per period lasted for 12 days, including 7 days for diet adaptation, 5 days for urine and feces collection.
Results: There was significant (p < 0.01) difference in DE content of 17 wheat cultivars. The DE and ME contents ranged from 16.06 to 16.88 MJ/kg DM and 15.65 to 16.36 MJ/kg DM, respectively. The coefficients variation (CV) of the chemical compositions were bulk density (3.14%), crude protein (CP) (9.00%), neutral detergent fiber (NDF) (34.60%), acid detergent fiber (ADF) (9.65%) and ether extract (EE) (10.16%) in the 17 wheat samples. Except for the ATTD of phosphorus (P), there were significant differences in the ATTD of gross energy (GE) (p = 0.01), organic matter (OM) (p = 0.02), CP (p < 0.01), NDF (p < 0.01), ADF (p < 0.01), EE (p = 0.04) and calcium (Ca) (p = 0.03) in 17 wheat cultivars.
Conclusion: DE was significantly positively correlated with ME and CP content, GE was significantly negatively correlated with starch, and CP content was positively correlated with GE, DE and ME contents. Based on statistical analysis of chemical components of wheat samples, the GE, CP, starch, and bulk density are key variables for predicting effective energy, and the most suitable regression equations of DE and ME in different wheat cultivars were DE = 26.6394 − 0.6783 GE (MJ/kg) + 0.1618 CP (%) and ME = −0.3869 + 0.7788 DE (MJ/kg) + 0.0336 starch (%) + 0.0020 bulk density (g/L).
1 Introduction
Energy feed is a standard raw material in pig complete formula feed, accounting for no less than 60% of complete formula feed composition. Corn, as the energy source of pig complete formula feed, is the primary representative raw material of energy feed. However, China’s annual wheat imports have exceeded 20 million metric tons over the past five years. This growing dependency on imported corn underscores the urgency for identifying alternative energy sources to enhance feed security and reduce production costs. Wheat is one of the three major cereals, second only to corn and rice. With extensive cultivation area and high yield, wheat wholly or partially replaces corn as an energy feed for pigs, which can reduce production costs and alleviate pressure on feed resource shortages. Based on current market conditions, the price of wheat is typically RMB 50–100 per metric ton lower than that of corn. Furthermore, the higher protein content of wheat (wheat: 14–15%; corn: 8–9%) allows for a reduction of about 1–2% in soybean meal usage, leading to an additional cost saving of RMB 30–40 per metric ton (1). The application of wheat could reduce approximately 55% of the corn and 7% of the soybean meal in corn-soybean diet of pig (2). However, the chemical properties of wheat are influenced by breed and climate, different varieties and areas caused differences of chemical properties of wheat and affected utilization of nutrients by pigs (3, 4). Therefore, it is pivotal to evaluate the accurate energy values of different wheat cultivars.
Although wheat can replace corn economically, the variability in wheat nutritional components poses the main obstacle to reasonable utilization. The chemical composition of wheat is influenced by genetic diversity, environmental conditions, and processing technics. These variations significantly impact the energy value and nutrient availability of wheat for pigs (5). Specifically, factors such as cultivar type, growing season, soil quality, and climatic conditions can lead to substantial variability in key nutritional components including crude protein (CP), starch, neutral detergent fiber (NDF), acid detergent fiber (ADF), and gross energy (GE). Therefore, it is essential for facilitating the extensive utilization of wheat in the pig diet to accurately evaluate available energy content. Precision optimization of feed formulations is carried out according to the digestive and metabolic utilization rates of feed components.
Determination of the effective energy of feed ingredients is time-consuming and labor-intensive based on animal digestion or metabolism trials, and unable to effectively avoid errors caused by factors, such as different varieties, batches, and cultivation regions (6). Moreover, traditional methods fail to account for the dynamic changes in nutrient composition caused by genetic improvements and evolving agronomic techniques. Therefore, establishing prediction equations of effective energy serves as a practical approach to address these challenges according to determination of the chemical components and variations in feed ingredients of different sources. The prediction equations is always utilized to evaluate the digestible energy (DE) and metabolizable energy (ME) values of feed ingredients on account of its advantages of saving cost and improving detection efficiency based on its chemical and physical properties (7). Such predictive equations would enable rapid, economic, and accurate energy assessment, facilitating optimal dietary formulation and utilization of wheat in pig production systems.
We hypothesized that different wheat cultivars exhibited significant variation in energy values and nutrient digestibility. Therefore, the object of the experiment was to evaluate the DE, ME and the apparent total tract digestibility (ATTD) of nutrients in 17 wheat cultivars, and build the equations of DE and ME according to their chemical constituents and physical characteristics.
2 Materials and methods
2.1 Wheat samples information
The yield of wheat in Henan Province is the highest in the world. Henan province (China) is located at 30 to 36 degree of north latitude, which belongs to warm temperate transition continental monsoon climate and is suitable for wheat growth. A total of 17 wheat samples were collected from 16 cities in Henan Province during mid-to-late May at the fully ripe stage (Table 1). The chemical constituents of 17 wheat cultivar samples are analyzed and presented in Table 2.
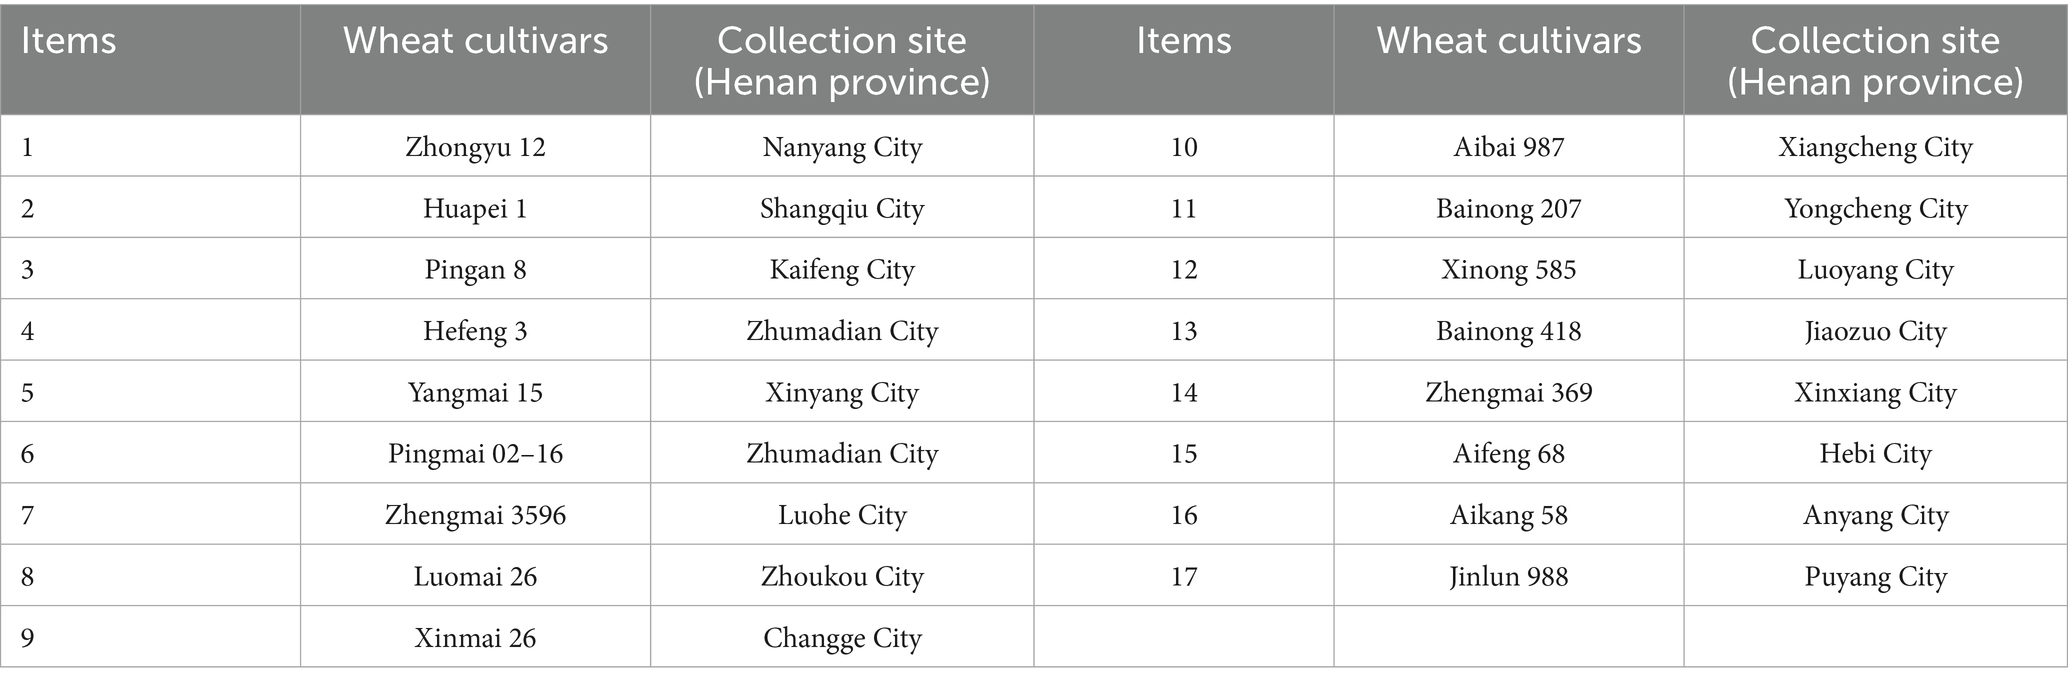
Table 1. Information of 17 wheat samples.
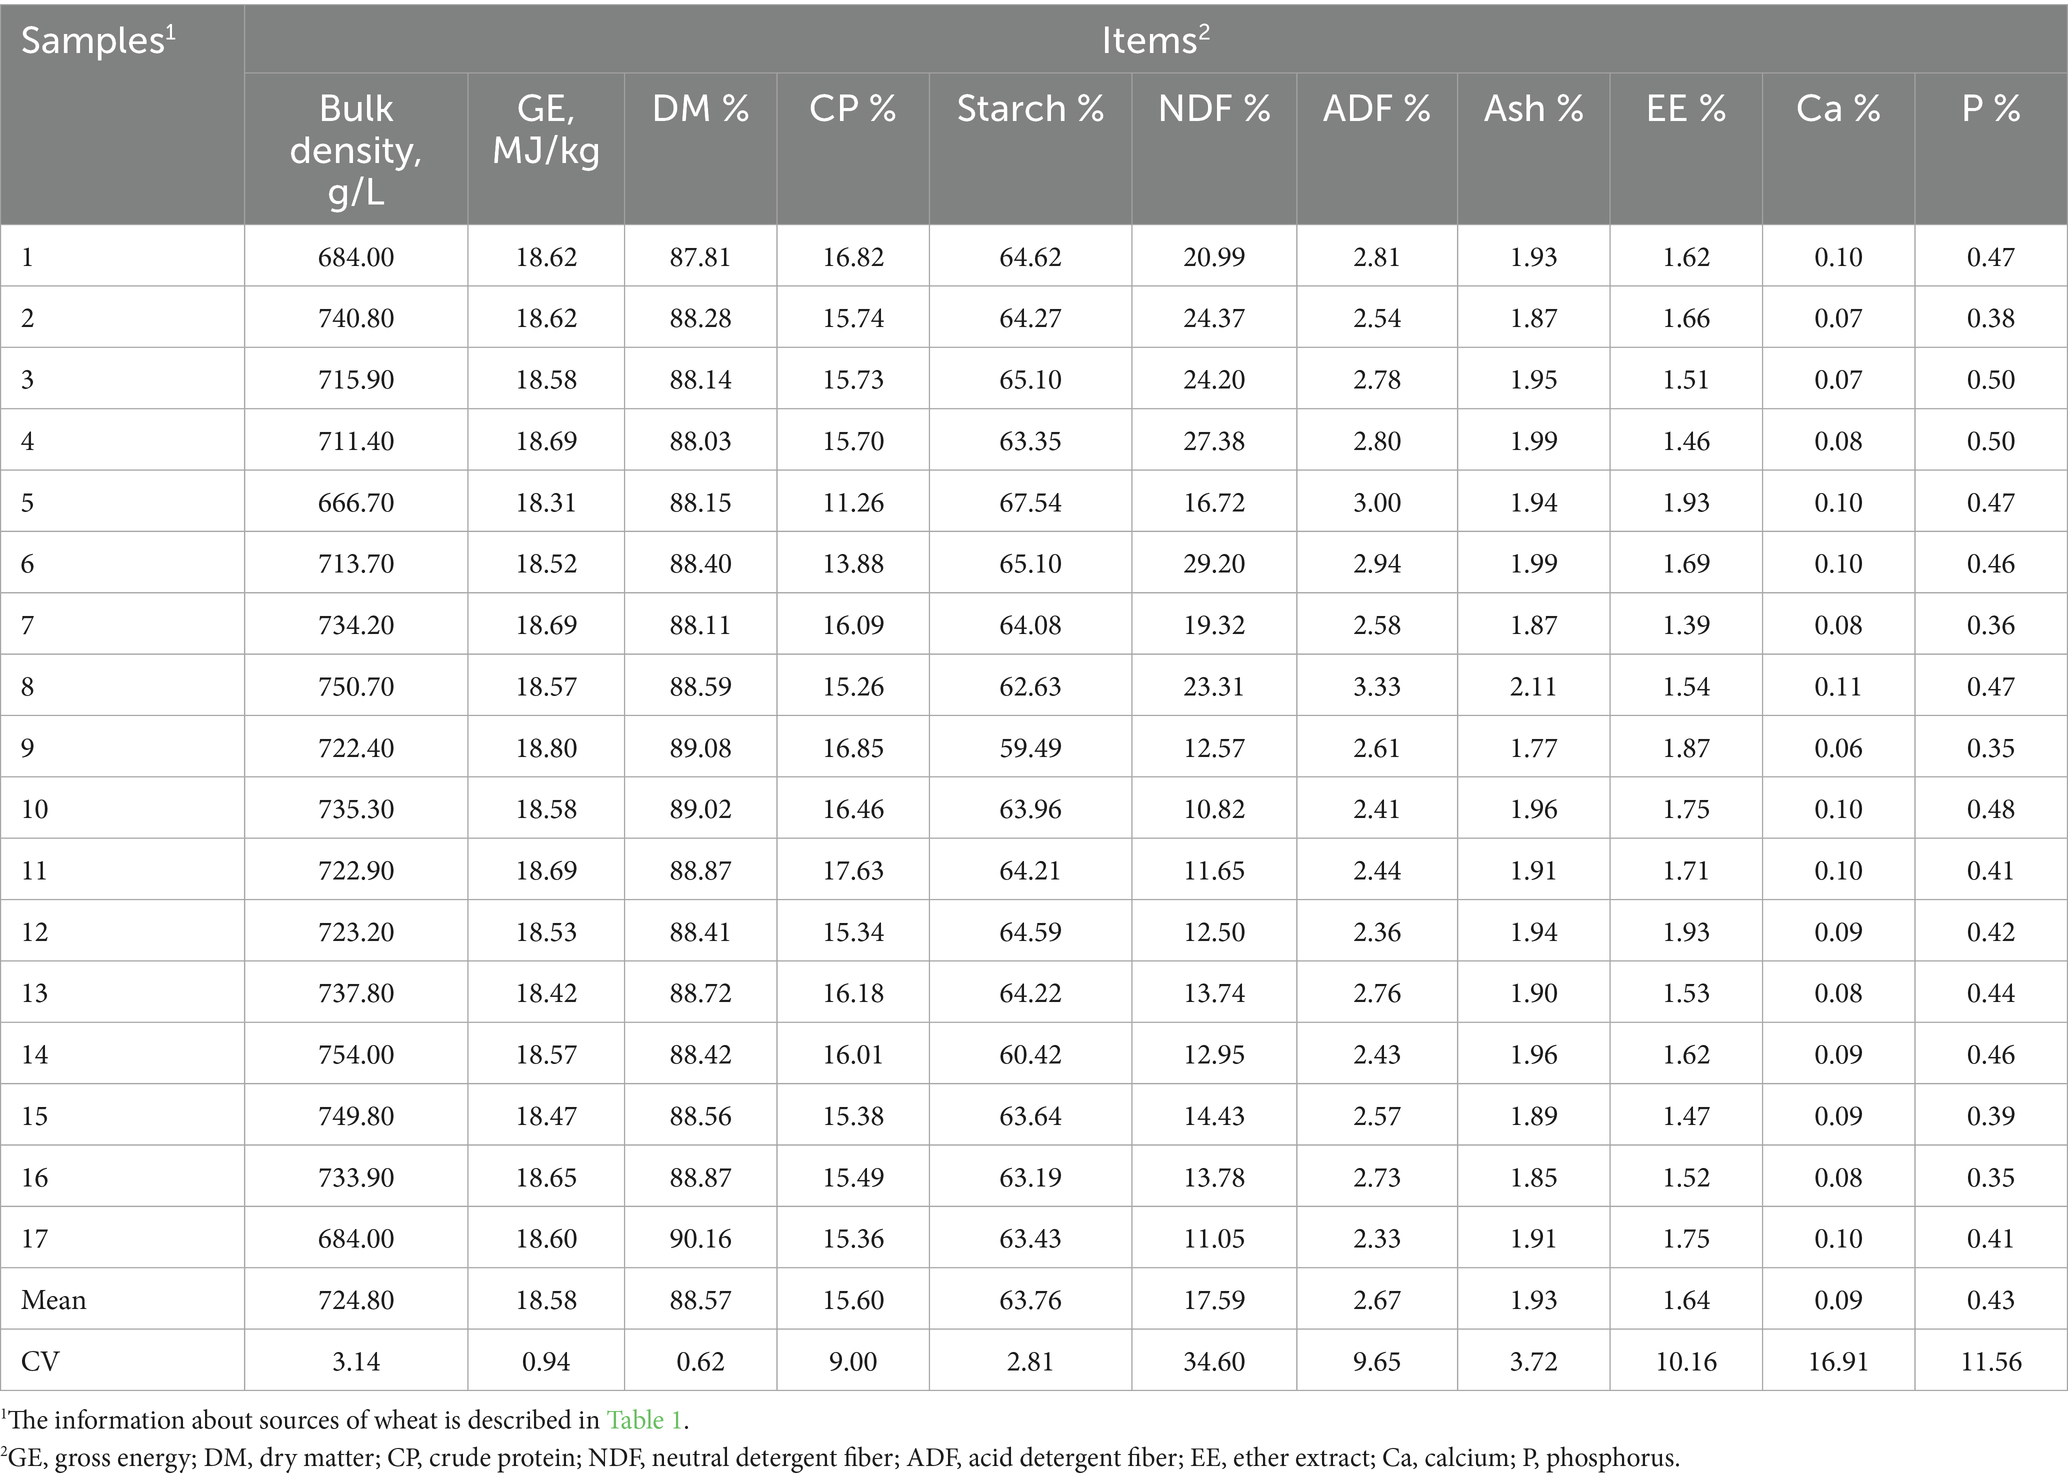
Table 2. Chemical composition of 17 wheat samples (%, DM basis).
2.2 Animal and experimental design
The procedures of this experiment were verified and approved by the Institutional Animal Care and Use Committee of Shangqiu Normal University (2023-1109). This experiment was executed in the animal experimental base of Shangqiu Normal University (Shangqiu, China).
Fifty-one Duroc × (Landrace × Yorkshire) growing barrows (body weight of 30.1 ± 1.8 kg) were cultivated in temperature-controlled room, and environment temperature was ranged from 20 to 25 °C. Each pig was cultivated in metabolism crates (1.4 × 0.7 × 0.6 m). Barrows were randomly allotted to an 17 × 2 incomplete Latin Square design with 17 diets and two consecutive 12-d periods. Each diet included 3 barrows in each period with 6 replications per diet. Dietary composition was shown in Table 3. The chemical constituents of diets were measured and showed in Table 4. Pigs received an equal amount of feed equivalent to 4% of body weight, and feed and water were available ad libitum. The diet ingredient were ground by a 2.5-mm screen (hammer mill). The feed was divided into two equal portions and administered at 8:00 h and 16:00 h daily. The experiment was lasted for 12 d (7 d for adaptive phase and 5 d for samples collection). The experimental samples and protocol were based on previous studies (8). From 8 d to 12 d, feces were gathered and stored at −20 °C to suppress degradation of the samples caused by microorganism. At last, the collected samples for feces were weighed, dissolved, and then homogenized thoroughly. Feces sample of 300 g was dried at 65 °C for 72 h. The 50 mL of 6 N HCl was added into buckets to gather urine sample. We measured the volume of collected urine daily, and 20% of urine was stored at −20 °C.
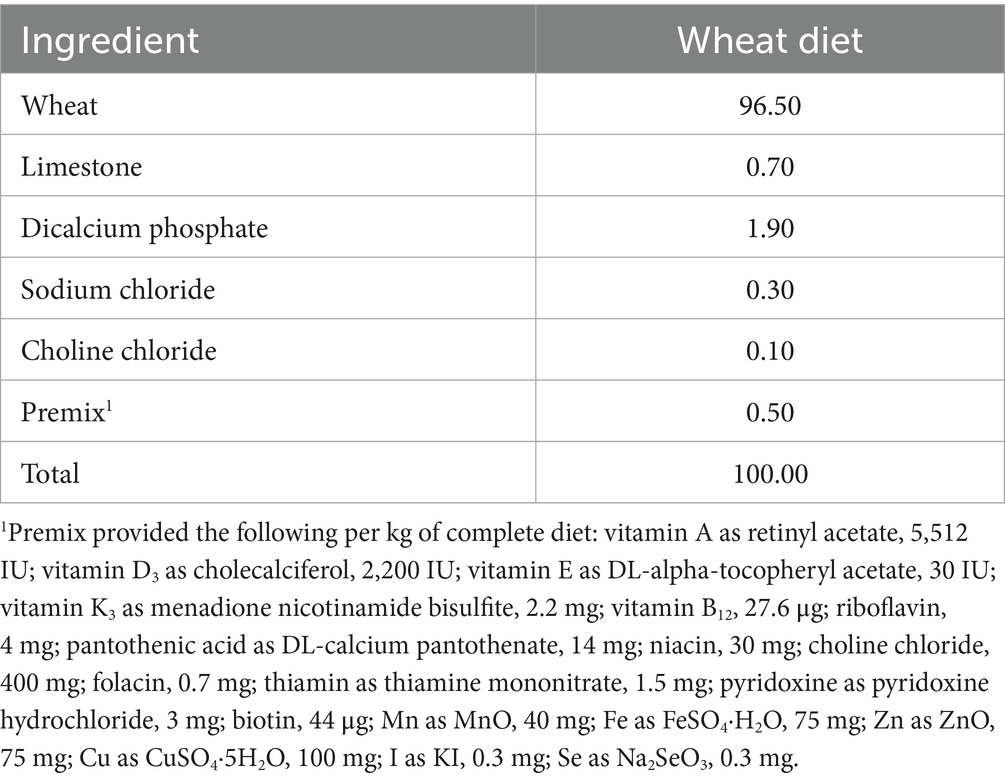
Table 3. Ingredient composition of the experimental diets (%, as-fed basis).
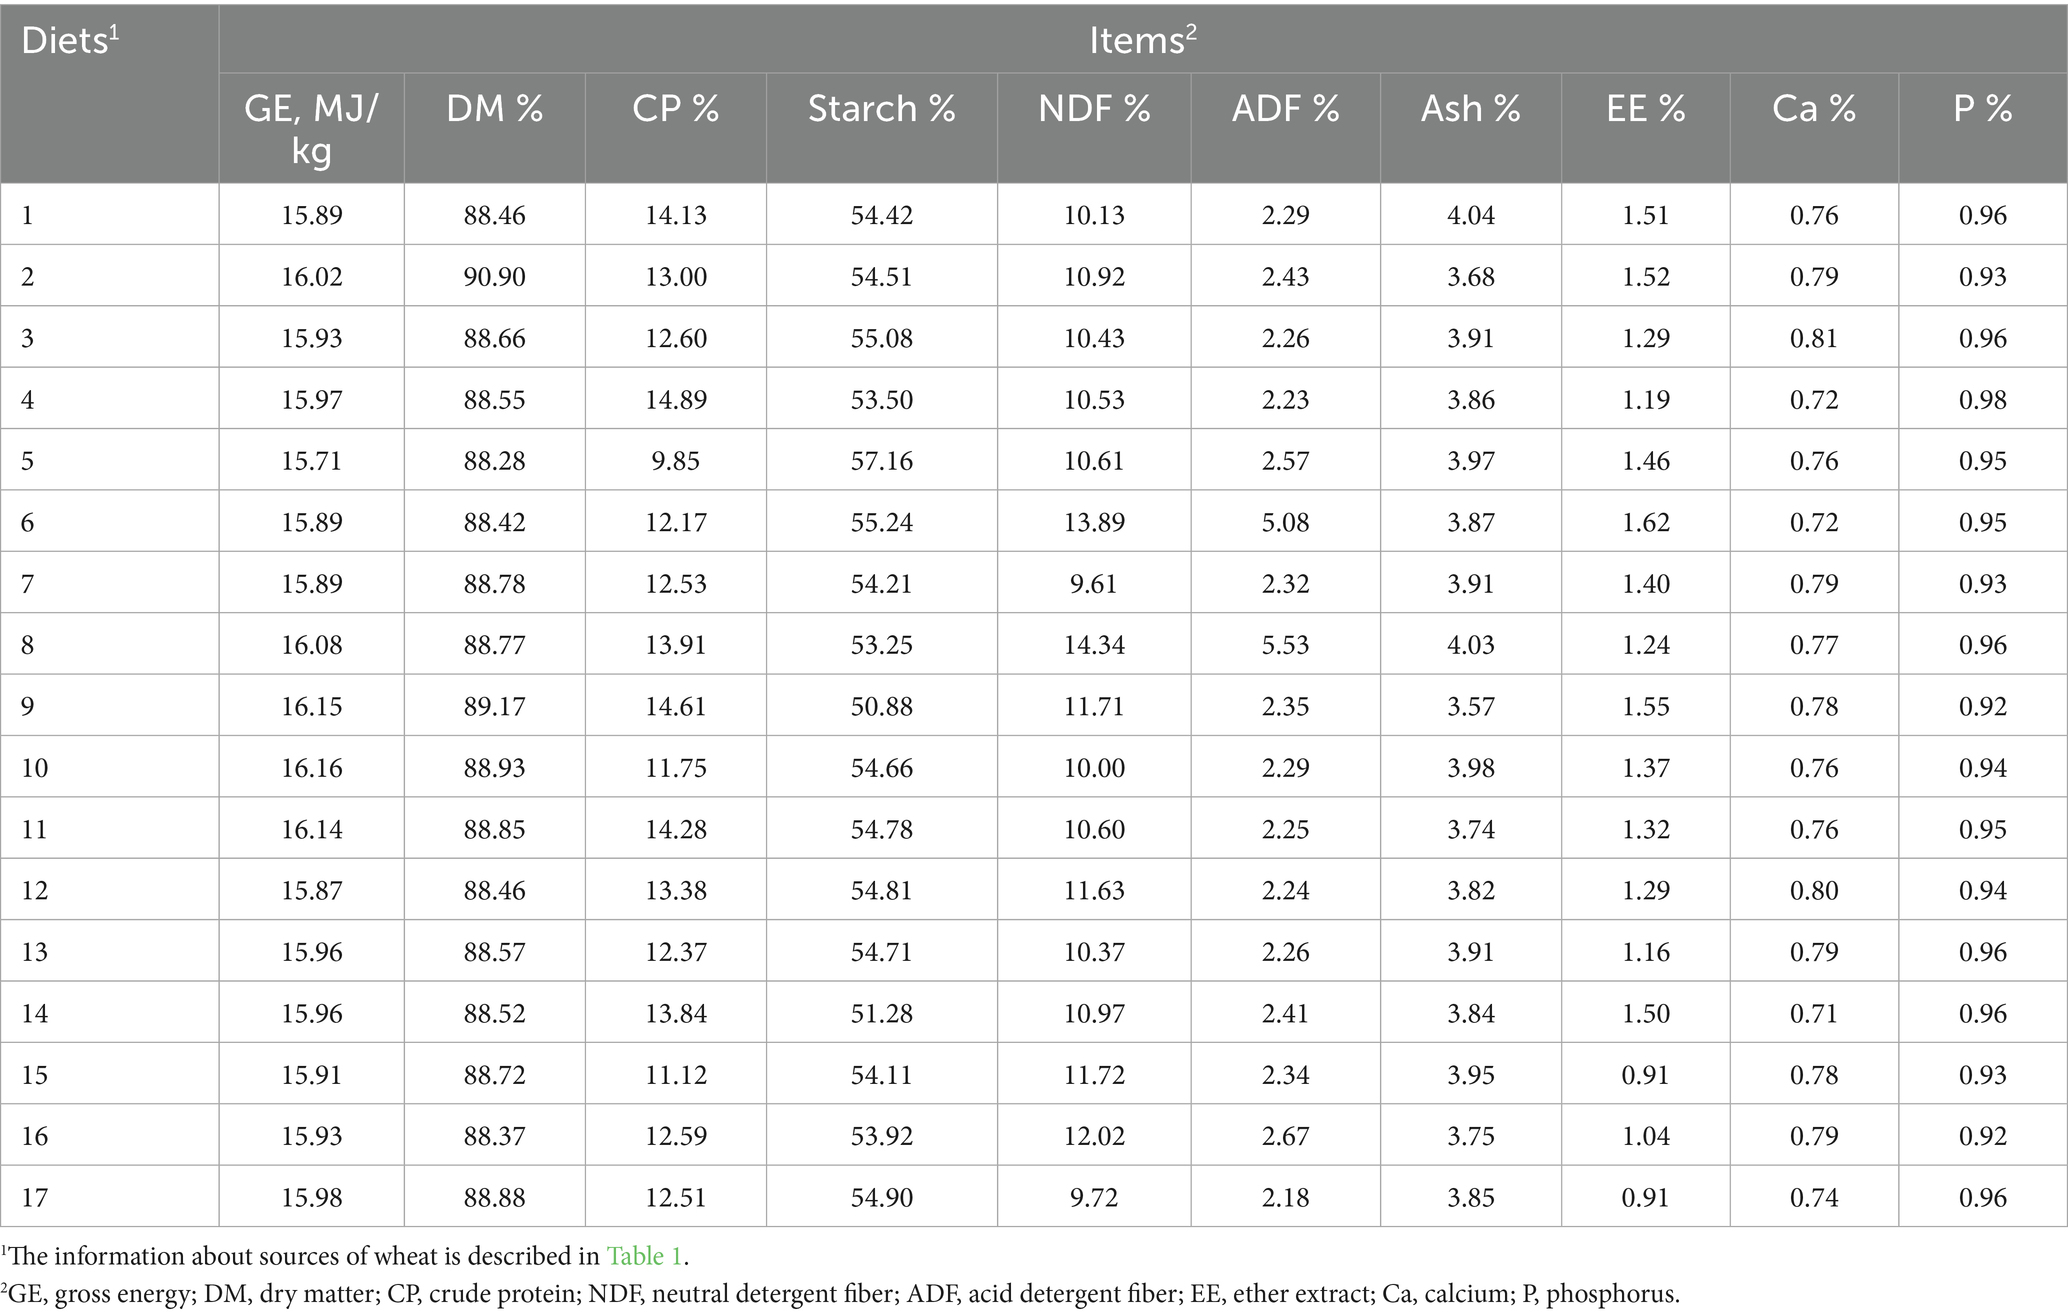
Table 4. The chemical composition of experimental diets (%, as-fed basis).
2.3 Chemical analysis
The detection of dry matter (DM), starch, CP, ash, calcium (Ca), and phosphorus (P) is carried out according to a previous report (9). The ether extract (EE) of samples was determined as previously described (10). The NDF and ADF were analyzed according to McGhee and Stein (11). The GE of all samples were analyzed by an Automatic Isoperibol Oxygen Bomb Calorimeter (Parr 1281 Calorimeter, Moline, IL).
2.4 Calculations
The ATTD of nutrients, DE, and ME of wheat samples were calculated according to the equation described by previous research (12):
In which DEd and MEd are the DE and ME in wheat diets (MJ/kg of DM); GEi is the amount of GE ingested for each pig (MJ of DM); Fi represented the actual amount of feed intake; the amount of GE in the feces and urine of each pig (MJ of DM) are represented by GEf and GEu; DEw and MEw are the content of DE and ME in each wheat sample (MJ/kg of DM); DN and FN are the concentrations of nutrients in diets and feces; Fo is the output of feces.
2.5 Statistical analysis
Data analysis was executed by SAS 9.2. A pig was an experimental unit. The diet was regarded as the fixed effect, and the period and animal were the random effects. The correlation and stepwise regression analysis between chemical compositions and DE, ME were analyzed by the CORR and REG procedures (13). The LSMEANS procedure was executed to calculate the mean values. Tukey’s multiple range test was used to separate statistical differences. The significance level was set at p < 0.05. The equations were considered as the best-fit prediction equations of DE and ME when the R2 is greatest and the residual standard deviation (RSD) is smallest (14).
3 Results and discussion
3.1 The chemical composition and bulk density of 17 different samples of wheat
In this study, the chemical composition and bulk density were presented in Table 2 on a DM basis. CP, starch, and crude fat are essential sources of nitrogen and energy to promote pig growth. The previous study indicated that the contents of CP, starch, and EE were ranged from 12.40 to 17.40%, 54.10 to 58.40%, 1.40 to 1.80% in 12 samples of wheat from Canada Prairie and Western (15). Zhao et al. (14) found that the contents of CP, starch, and EE were ranged from 14.25 to 16.14%, 53.43 to 57.52%, 1.30 to 1.34% in 2 samples of wheat. The results of the CP and EE contents mentioned above were consistent with our data. We found that the contents of CP and EE were ranged from 11.26 to 17.63%, 1.39 to 1.93% in 17 samples of wheat. Moreover, there was a considerable variation in the CP content within different cultivars of wheat (11.26 to 17.63%; CV = 9.00%). This indicated that although the varieties and origins were different, the variability in the energy value of wheat and its primary determinants were similar. Zhang et al. (4) reported that GE, CP, EE, NDF, and ADF is 17.24 MJ/kg, 14.07, 1.44, 15.21, 2.45% in extruded wheat, respectively. Apart from the inherent varietal differences, subsequent processing technologies (such as extrusion and pelleting) also influence the ultimate nutritional value of wheat.
In our study, higher starch content was observed compared with those of the previous reports (14, 15). The variation of wheat starch and CP contents were caused by different varieties, growing season and regions (16). Many previous studies reported that a considerable variation of CP was caused by different climatic conditions rather than soil quality or genetic factors in wheat sample (17, 18). The abundant soil moisture and low environment temperature during the ripening of the wheat results in lower content of protein, whereas the CP content of wheat was higher in the warm weather conditions (15). Starch constitutes the principal component of wheat and serves as the substrate for sugar provision during fermentation. Given the growing demand for wheat as a renewable resource, research aimed at developing wheat varieties with elevated starch content may attract keen interest (19). The content of wheat carbohydrates could provide energy and determine the pattern and efficiency of energy release (20). In addition, protein-riched wheat was preferentially utilized for breadmaking and the requirement of society (21, 22). Whereas wheat, as a feedstuff and renewable resource for biofuel production, eventually contains large amounts of starch (23).
The level of wheat fiber components was affected by the cultivars and growing environment. Many previous studies reported that NDF and ADF fractions were ranged from 16.34 to 25.10% and 2.70 to 5.10% in different cultivars and harvest times of wheat (4, 16, 24, 25). Other researches demonstrated that NDF content and ADF content were from 10.99–15.83%, 2.04–4.70%, which were consistent with our study (12, 14, 26). We found that there were large variations in the NDF concentration (10.82 to 29.20%; CV = 34.60%), and the ADF content (2.33 to 3.33%) was lower compared with the reports mentioned above. Climatic temperature has a great influence on the content of NDF and ADF of wheat. The level of fiber component in wheat in winter was lower than in summer (12). The nutrient absorption capacity of wheat root was decreased in low-temperature, moreover, part of the nutrients in wheat are used to resist cold stress (27). The above findings demonstrated that the interplay between genetic attributes and environmental factors determine nutritional composition of wheat, and ultimately results in a predictable and comparable range of available energy content for swine (see Table 5).
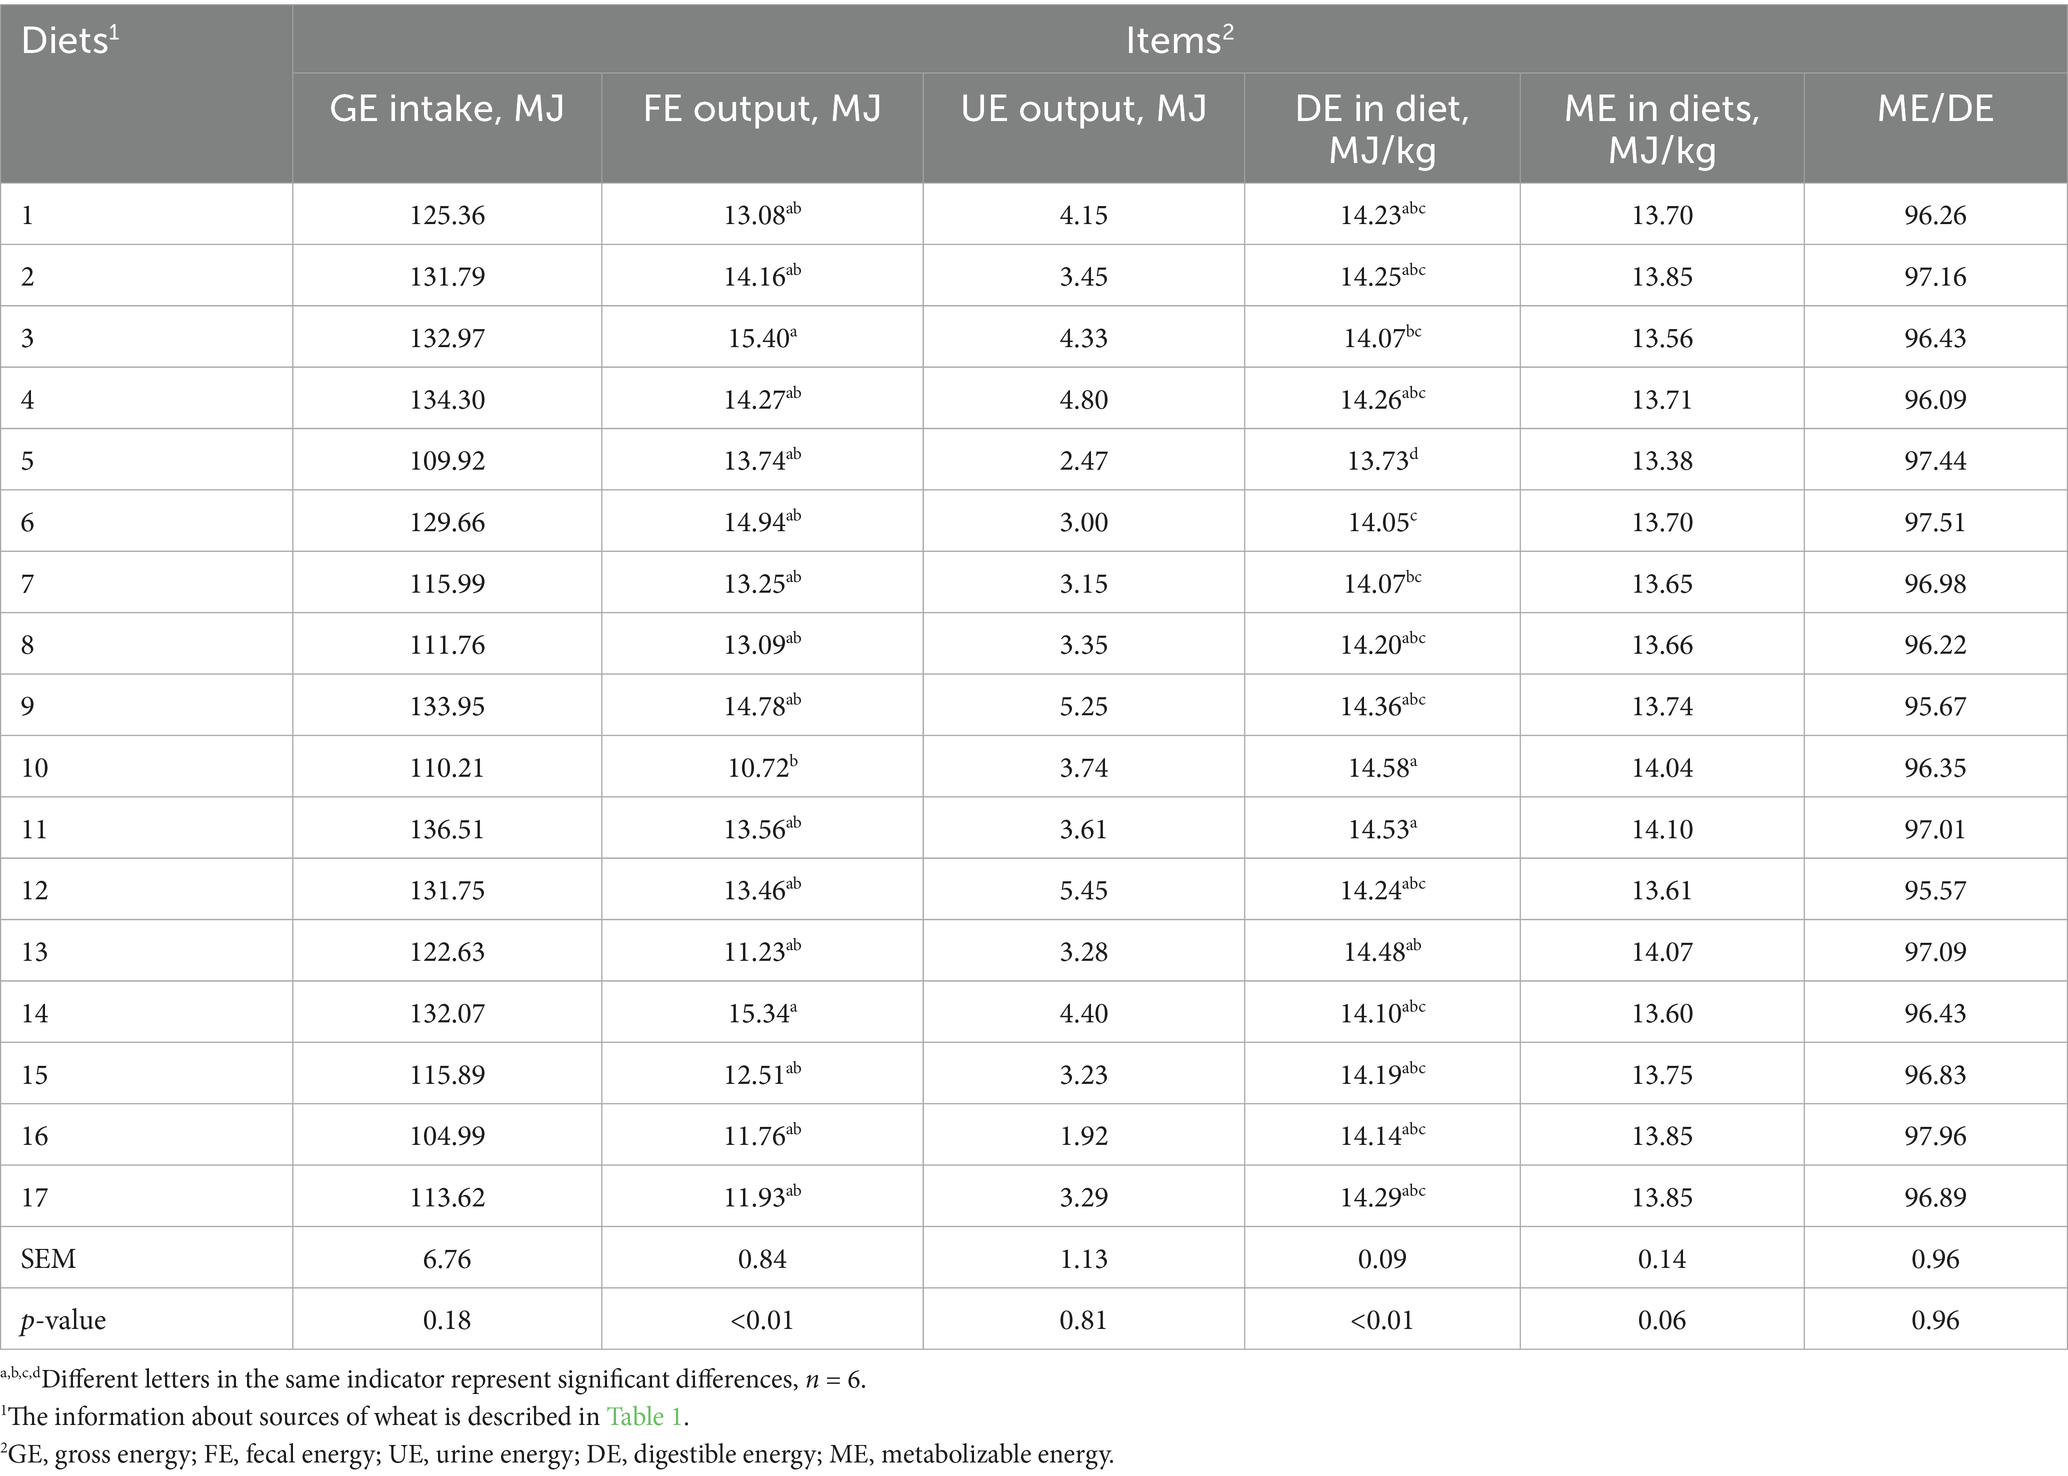
Table 5. The DE and ME of experimental diets.
3.2 Differences in the energy contents and nutrients digestibility of diets
The ATTD of GE, OM, CP, NDF, ADF, EE and Ca showed significant differences (p < 0.05) (Table 6). And the ATTD of GE, DM, OM, CP, NDF, ADF, and EE ranged from 87.30 to 90.77%, 87.76 to 90.37%, 88.63 to 91.06%, 81.73 to 90.44%, 49.04 to 66.14%, 18.19 to 46.31%, 27.07 to 57.13% among 17 wheat cultivars, respectively. The ATTD of GE in our result was similar to previous studies, which reported that the ATTD of GE in the diets ranged from 86.58 to 90.79% in different wheat cultivars (4, 12, 15). An earlier research reported a lower ATTD of GE and DM (ranged from 76.2 to 87.0% and 79.1 to 89.4%) in 20 different wheat grains in growing pigs (8). The different ATTD of GE and nutrients were associated with various chemical composition of wheat grains grown in various areas and climates, for example, the ATTD of GE in winter wheat is higher than that of the spring (12, 28). Previous research demonstrated that the ATTD of DM, NDF, ADF, and CP ranged from 87.47–88.54%, 56.78–64.21%, 25.80–40.74%, and 83.63–87.58% (14), which were consistent with our study.
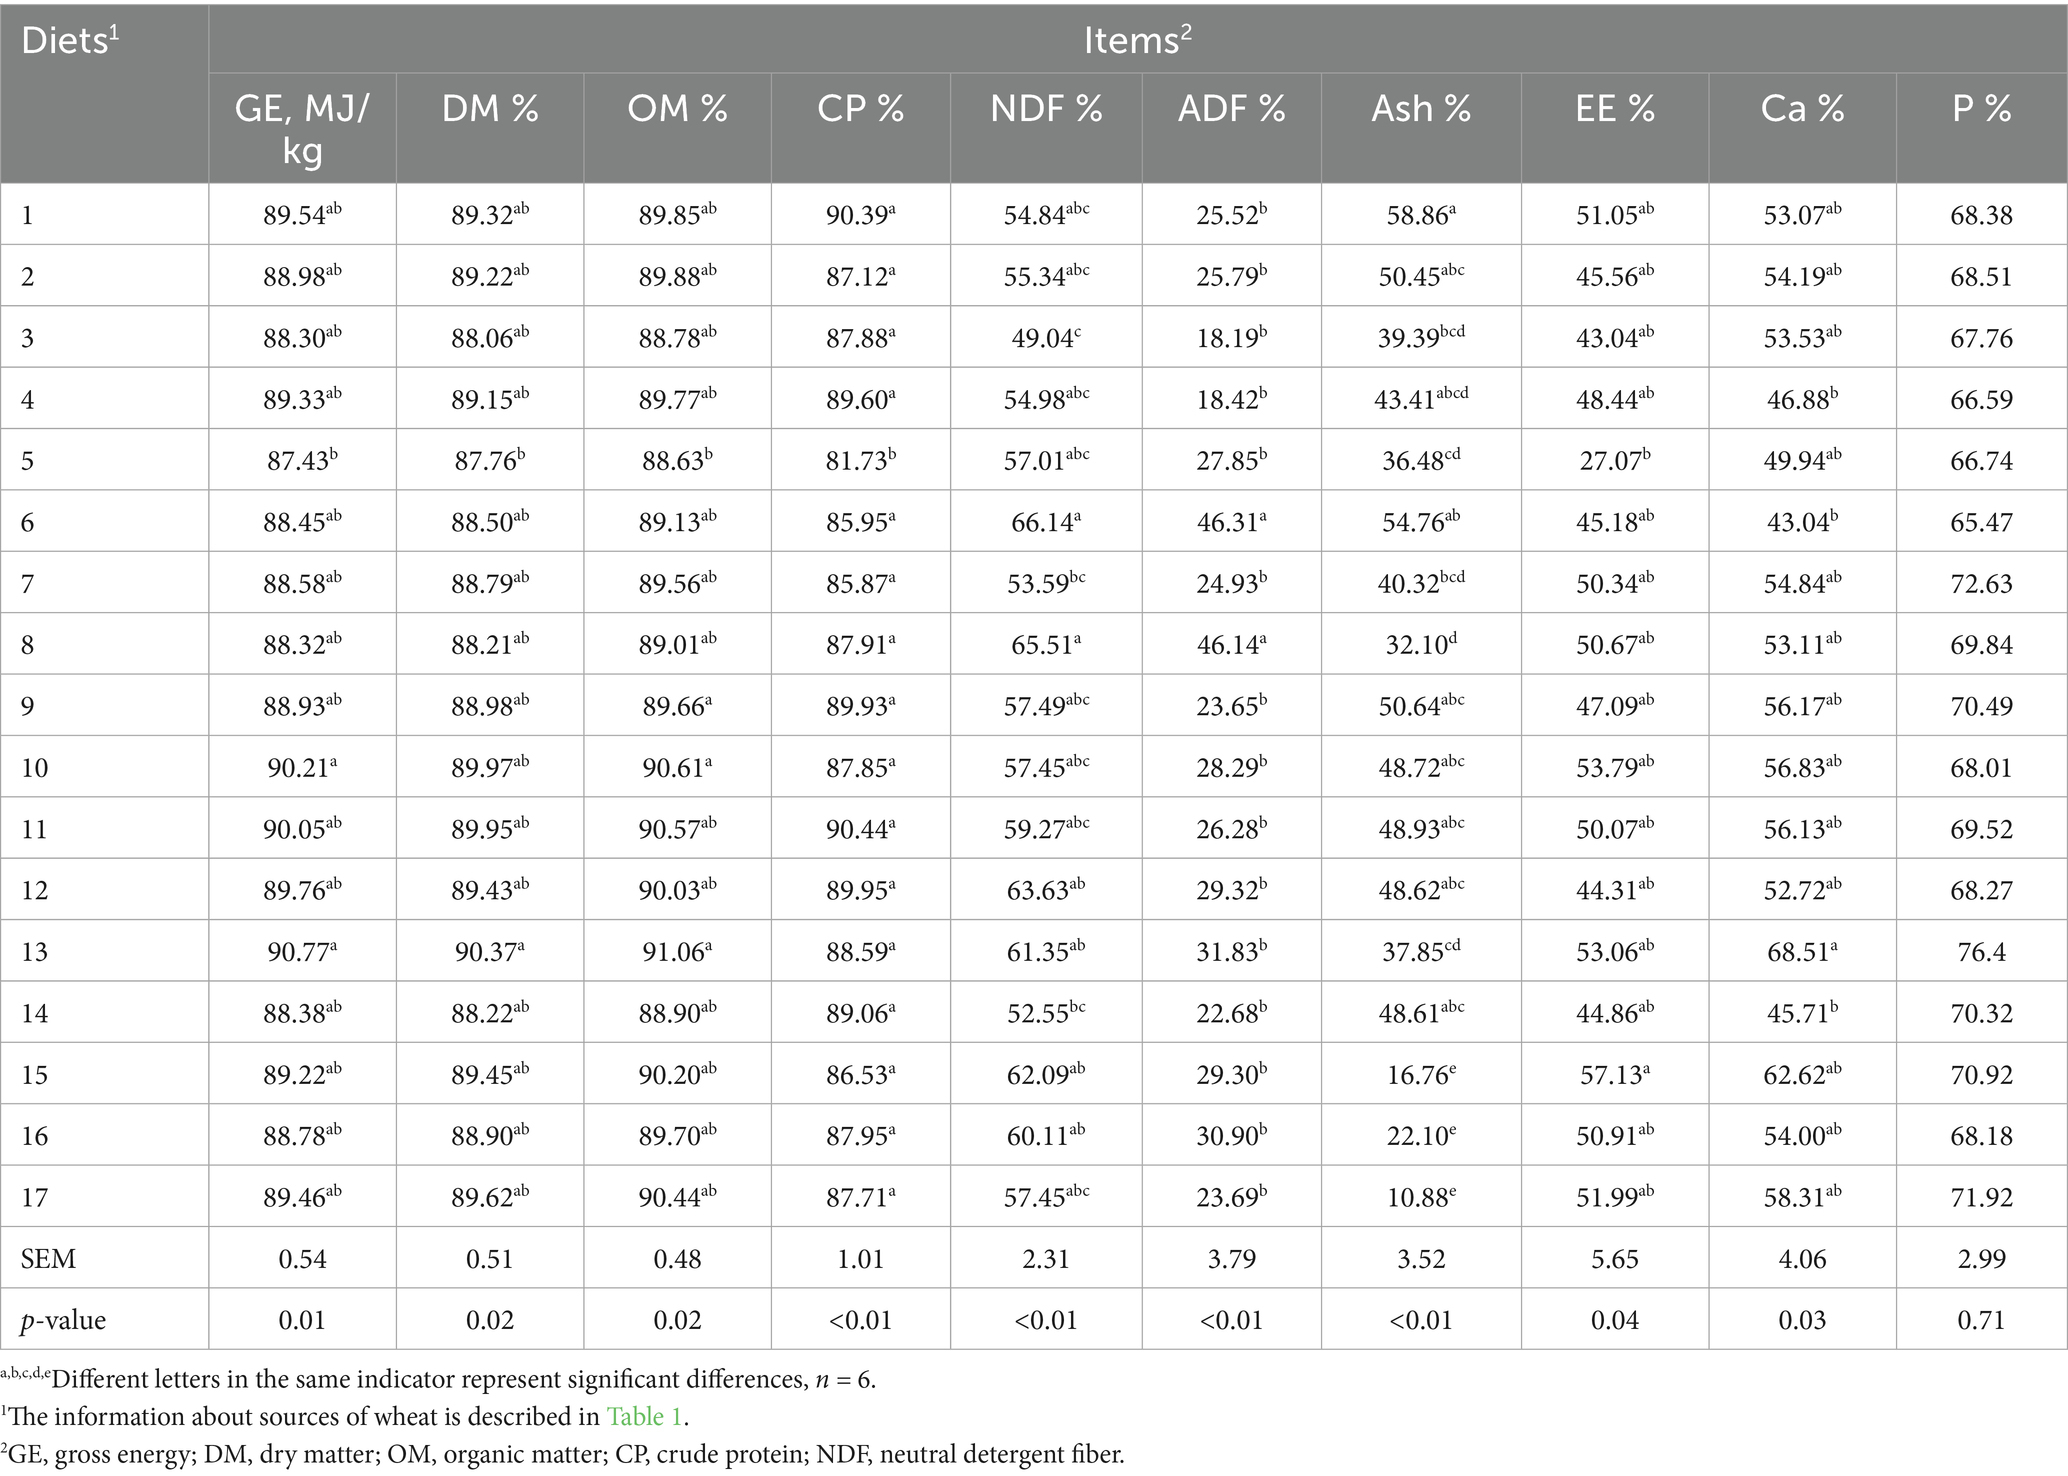
Table 6. The apparent total tract digestibility (ATTD) of nutrients in diets, %.
3.3 Differences in the DE and ME contents of 17 samples of wheat
In the present study, the DE and ME contents ranged from 16.06 to 16.88 MJ/kg DM and 15.65 to 16.36 MJ/kg DM in 17 wheat cultivars, respectively (Table 7). In agreement with our findings, previous study demonstrated that the DE and ME contents were ranged from 16.40 to 17.02 MJ/kg DM and 15.73 to 16.49 MJ/kg DM in 12 wheat cultivars (12). Other research demonstrated that the DE of 5 wheat cultivars was from 16.19 to 16.99 MJ/kg DM (15). Similarly to the above researches, another study indicated that the DE content of 50 wheat cultivars (10 varieties each grown at five sites) were ranged from 15.49–16.95 MJ/kg (24). The DE content of No. 5 wheat sample is lowest, which may be due to its lower GE and CP content. On the other hand, high starch content of No. 5 wheat sample hindered the interaction between digestive enzymes and substrates (29, 30). The ATTD of CP, GE, and DM in No. 10 and 11 wheat samples were higher, and NDF content was lower, which may mainly contribute to greater DE and ME. However, in this study, we found that the DE content was higher than the values (13.44 to 13.71 MJ/kg) reported by Zhao et al. (14). This may due to higher ATTD of GE and EE content. Because fats facilitate digestion and reduce the flow rate of chyme (31), meanwhile, lower NDF content decreases endogenous losses of protein and fat, resulting in increasing of the excretion of organic matter (32, 33). In addition, carbohydrates are the largest source of energy for wheat, and carbohydrate digestibility largely determines the DE and ME contents of wheat (11). The discrepant results of the DE and ME contents may attribute to the differences in chemical composition and physical characteristics resulting from different cultivars and growing environment of wheat (34, 35) (see Table 8).
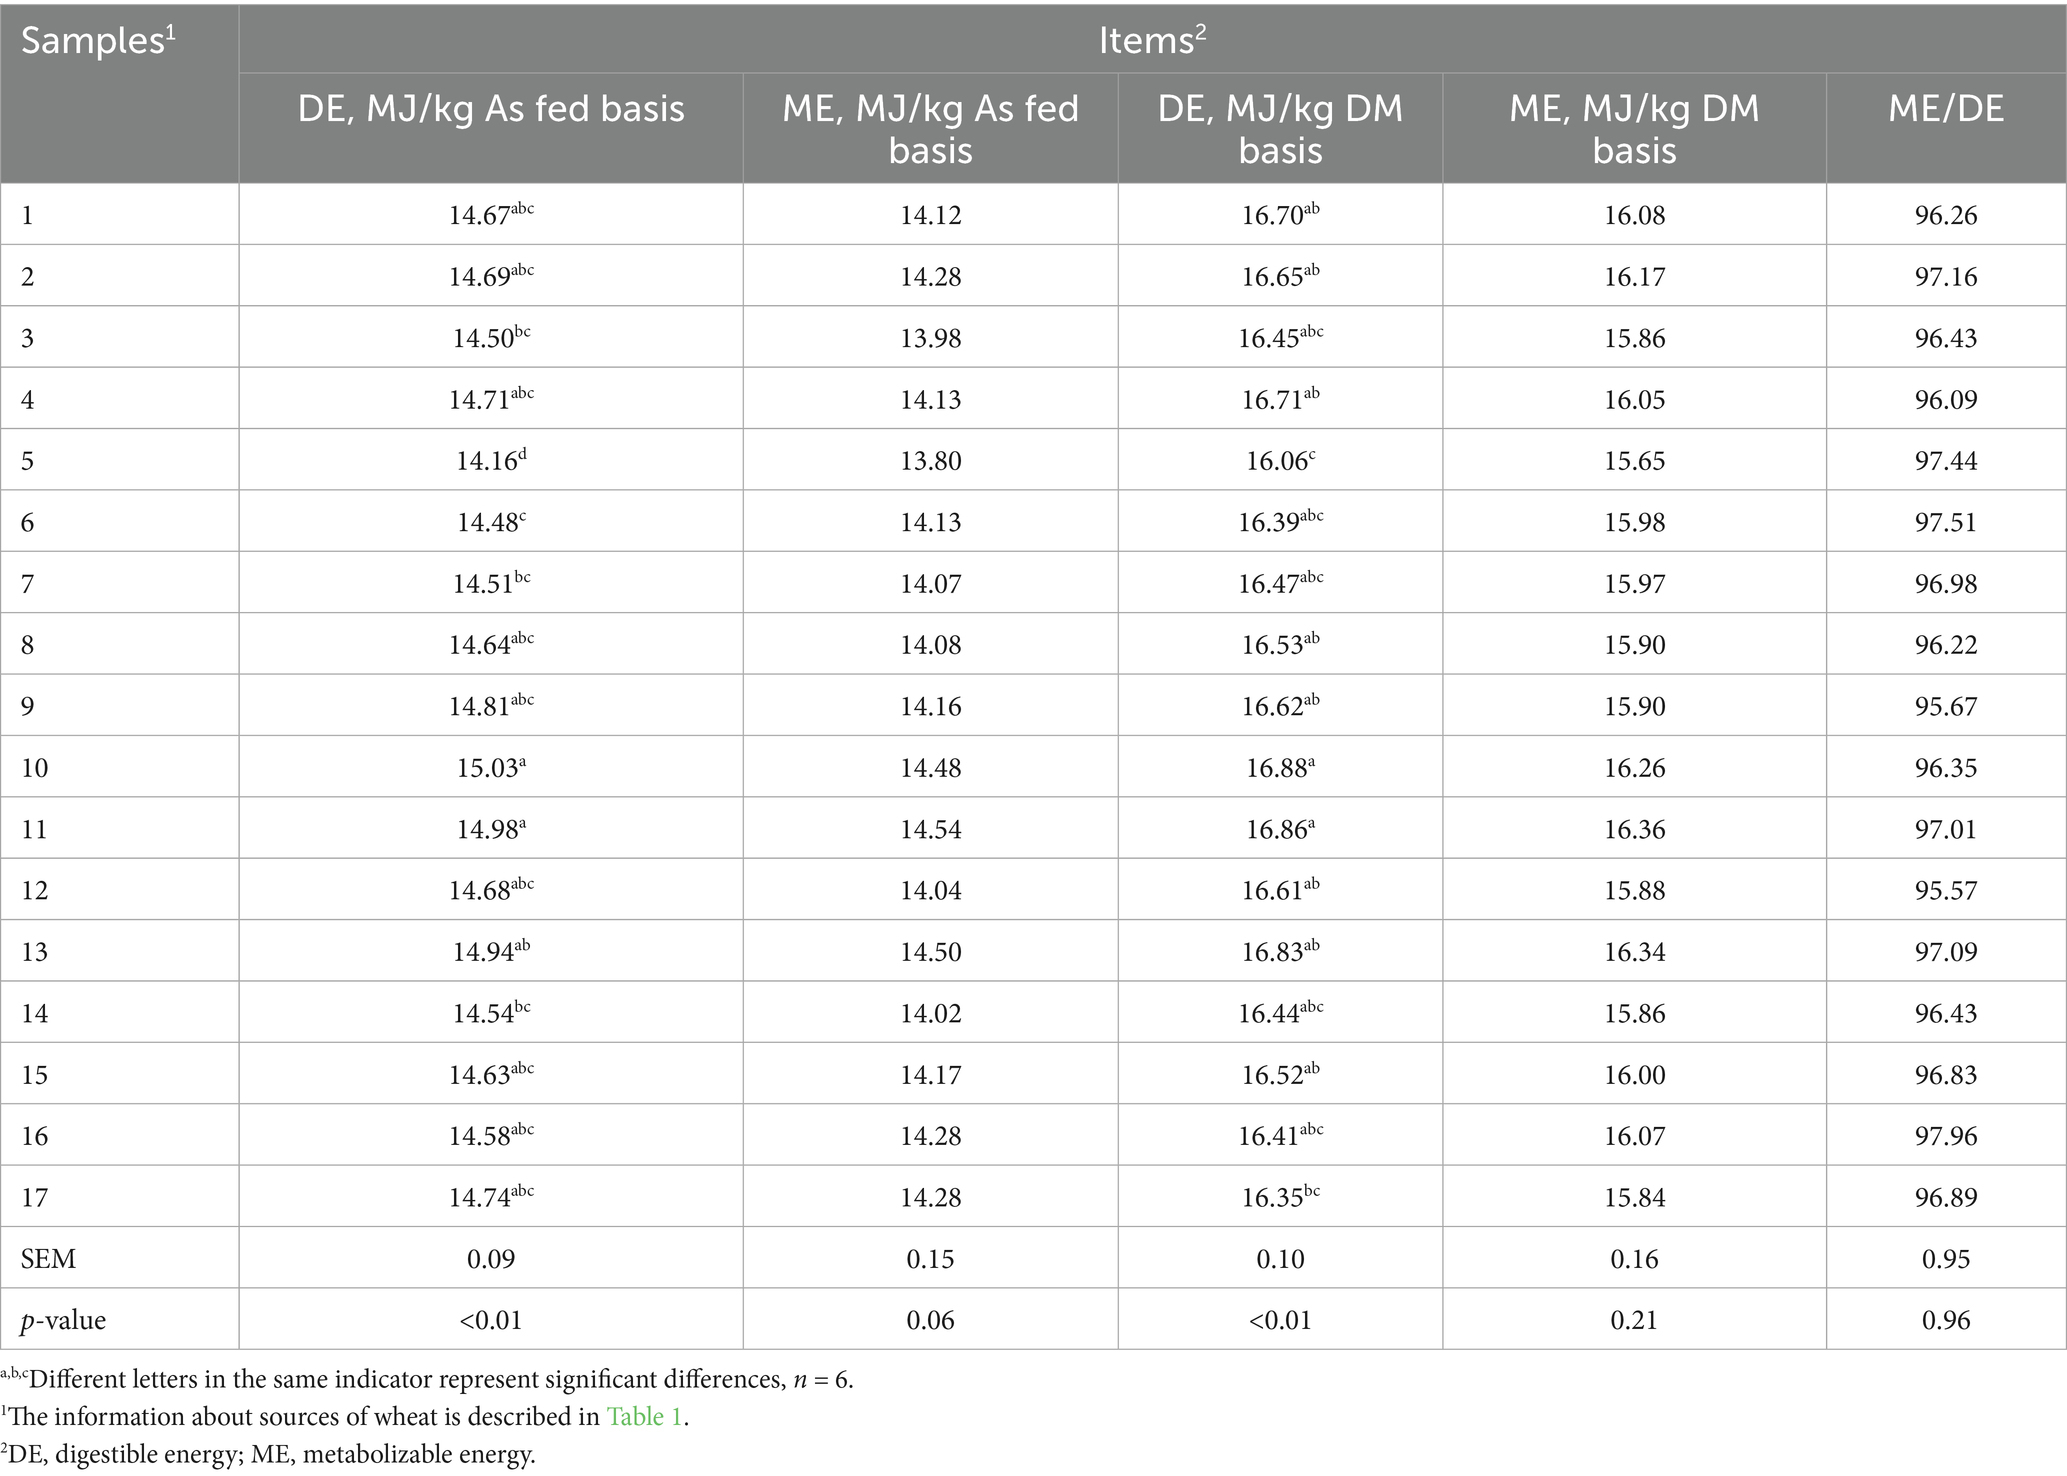
Table 7. The DE and ME of wheat samples.
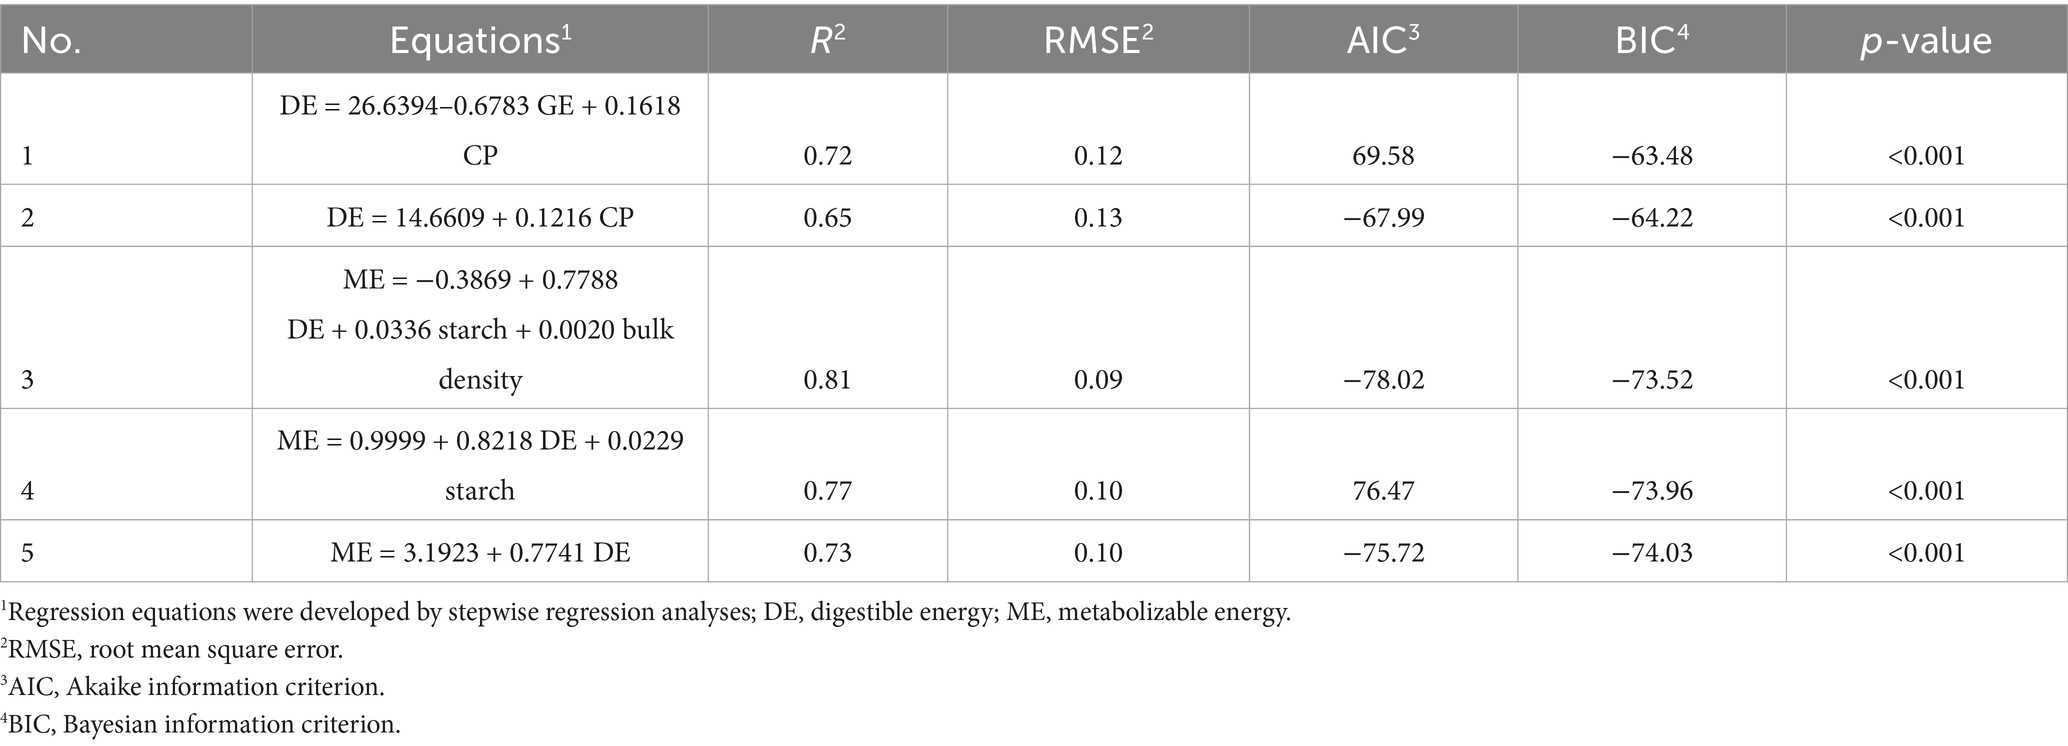
Table 8. Regression equations of DE and ME in wheat samples.
3.4 The development of regression equations for DE and ME contents of wheat
The metabolizable energy values derived from distinct wheat cultivars, heterogeneous experimental protocols, and divergent computational methodologies exhibit substantial variability. Regression models predicated on wheat chemical composition have been established as a recognized and standardized predictive paradigm. Previous studies have indicated that both ADF and NDF content are negatively correlated with DE of wheat, which is attributed to the reduced nutrient digestibility caused by the anti-nutritive properties of fibrous components (36, 37). Consequently, ADF and NDF are widely regarded as reliable predictors of available energy in wheat, due to their negative impact on the digestibility of nutrients (38, 39). Apart from macronutrients, wheat contains a diverse array of compounds such as phenolic acids, flavonoids, and carotenoids. Advanced analytical techniques can elucidate the variability in the content and composition of these compounds in different wheat varieties, growing environments, and processing methods (40). The variability of the compounds could be utilized to predict the nutritional quality and metabolic characteristics of wheat in animal diets. NDF and ADF contribute to a higher heat increment during fermentation or digestion processes and physically impede the digestion of other nutrients. Hence, they are routinely incorporated as negative predictors in net energy prediction equations (41). On the other hand, a prediction equation was developed by Son et al. (7) and Huang et al. (23) through nutritional composition analysis of the diet (including corn, soybean meal, and wheat), wherein NDF and ADF were identified as the principal predictive factors. Consequently, neutral detergent fiber (NDF) and acid detergent fiber (ADF) consistently serve as fundamental predictive variables in energy prediction models of diets with high fiber content. Previous research investigated the energy prediction model of high-fiber wheat bran and derived the prediction equation: NE = 11.16 − 0.09NDF (R2 = 0.71) and NE = 10.51 − 0.27ADF (R2 = 0.68), however, the regression equation is NE = −21.65 + 1.20 GE + 0.35 × CP (R2 = 0.94) and the R2 was elevated (0.65 vs. 0.94) when the GE and CP was regarded as predictors of regression equation (38). Therefore, CP and gross energy GE serve as the dominant predictors in energy prediction models. In this study, there were no significant correlations between ADF or NDF and DE content (Figure 1). This different results is likely because the samples were whole wheat grains in our study, which have a lower and less variable fiber content compared to bran. The limited range of fiber variation was insufficient to exert a dominant anti-nutritive effect on energy digestibility, allowing the positive effects of CP and GE to be the primary determinants. The result could be associated with a faint variation of NDF and ADF contents in wheat samples. In summary, ADF and NDF did not serve as predictive factors in our study.
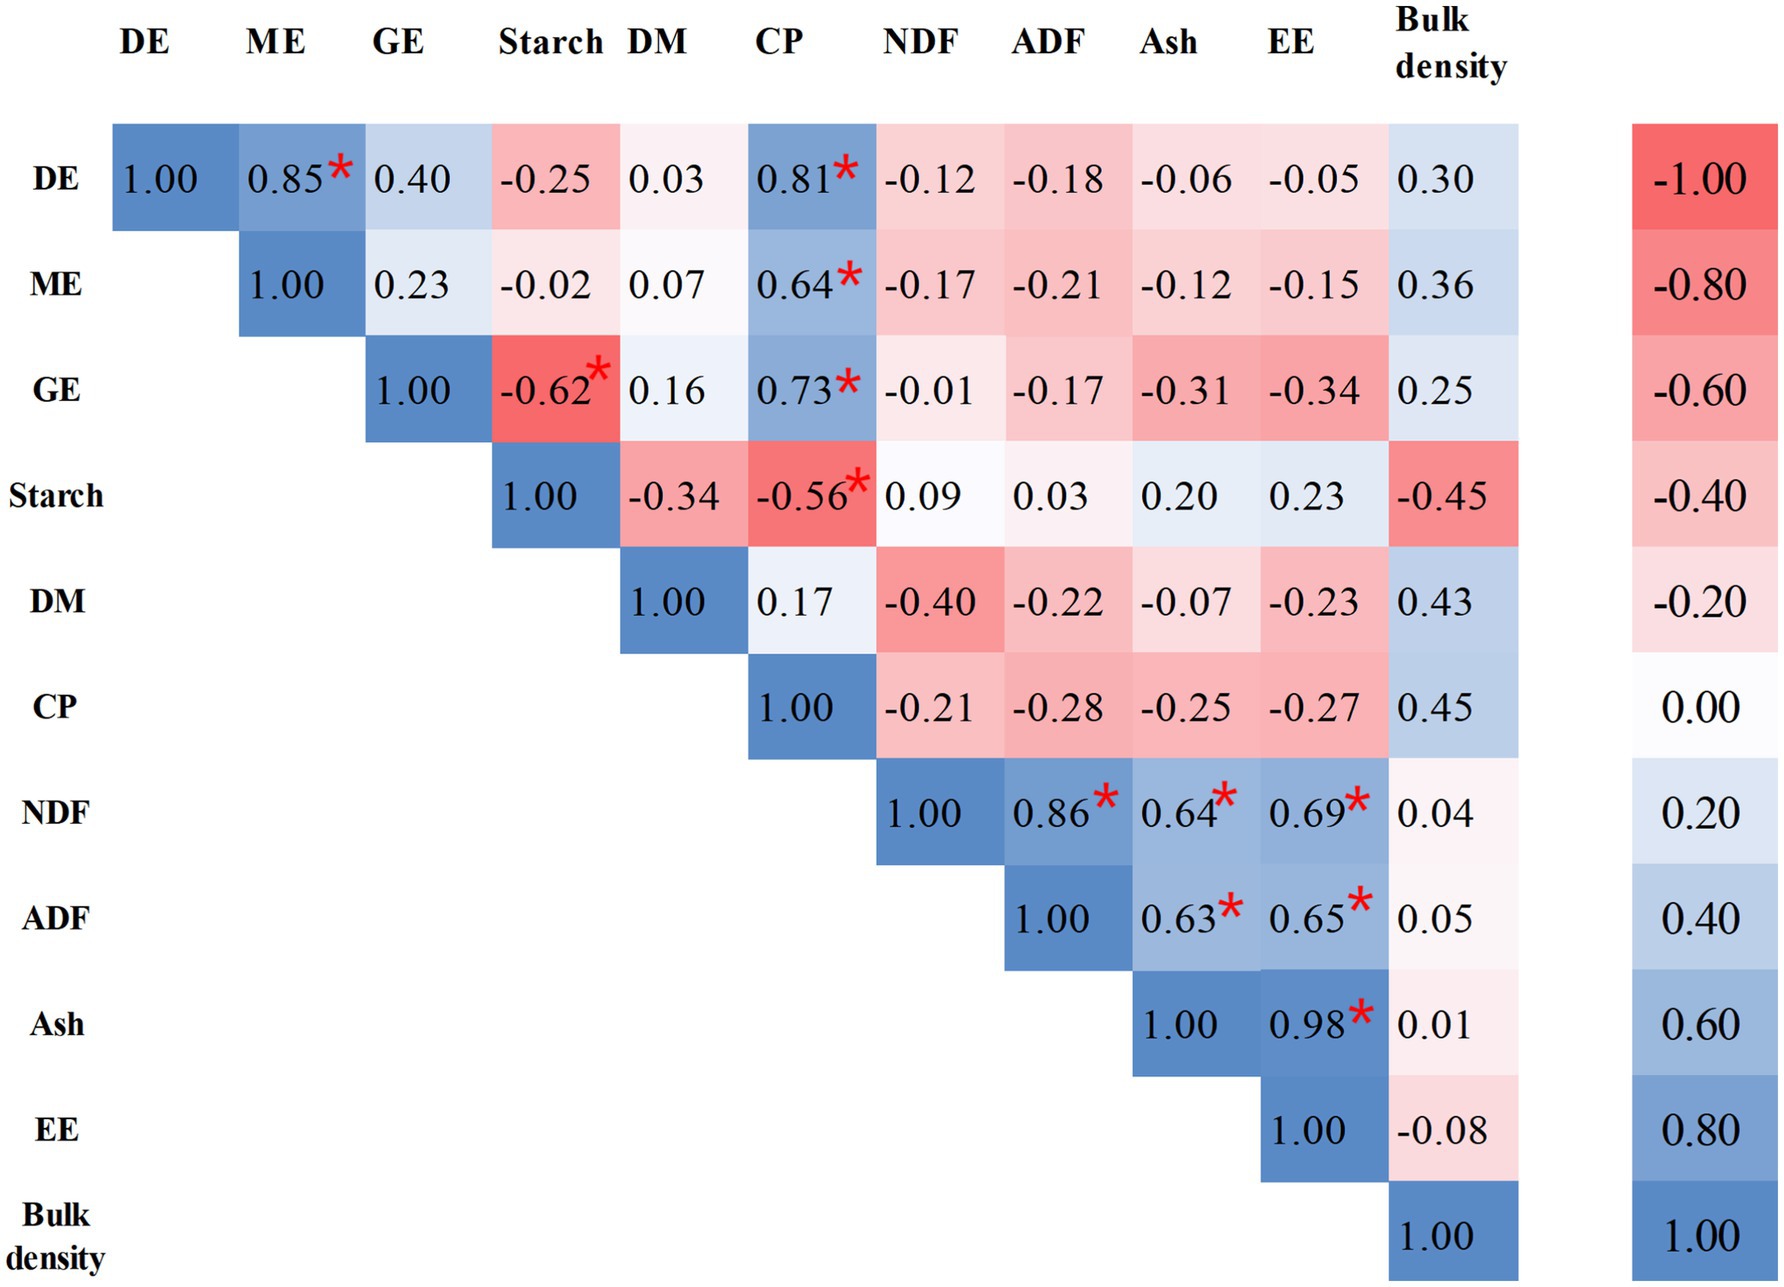
Figure 1. Correlation of DE, ME and chemical components of wheat samples. *Represent p < 0.05. DE, digestible energy; ME, metabolizable energy; GE, gross energy; DM, dry matter; CP, crude protein; NDF, neutral detergent fiber; ADF, acid detergent fiber; EE, ether extract.
GE was significantly negatively correlated with starch (p < 0.05). Compared to protein and fat, starch is the primary component in wheat with a relatively low energy density. When the starch content is high in wheat, the levels of other components are decline, particularly protein and fat, which has an extremely high GE. Meanwhile, the formation of starch-protein interactions contributes to reduction GE (42). The CP content was positively related (p < 0.05) to GE, DE, and ME concentrations in wheat. The most suitable predictor for DE was the combination of CP in the present study (Figure 1), which was consistent with a previous study that reported the variation of DE in different wheat samples was mainly caused by the content of CP (35). We analyzed data and gained a regression equation of DE = 14.6609 + 0.1216 CP. Previous research demonstrated that GE could precisely predict the DE content of wheat, and gained a regression equation of DE = −1,384 + 1.1 GE + 0.65 bulk weight (R2 = 0.83) (12). Thus, based on the equation, the GE was added as a predictor of regression equation on account of positive correlation between GE and CP content of wheat. We gained a regression equation of DE = 26.6394 − 0.6783 GE + 0.1618 CP and found that the R2 was elevated (0.65 vs. 0.72), and the analytical method referred to previous research (43). Differences in predictive factors and weighting coefficients could originate from seasonal variations and regional differences in wheat sample collection. The above findings validate the universality of crude protein, gross energy, and bulk density in predicting the energy value of wheat once again.
In this study, the most suitable predictor for ME was the DE content of wheat, which was consistent with some previous studies (44–46). In this study, regression equation is ME = 3.1923 + 0.7741 DE (R2 = 0.73). Huang et al. (23) demonstrated that regression equation is ME = 0.92 DE + 0.44 (R2 = 0.96) in mixed diet (include corn, soybean, and wheat shorts). In addition, Zhao et al. (14) found that regression equation is ME = 0.9716 × DE (MJ/kg) + 0.0636 (R2 = 0.99) in mixed diet (corn, wheat, and rice). The difference in R2 between the above results and our findings might be attributed to high corn content in diets. Corn, as a energy-dense ingredient with relatively uniform composition, minimizes variation in key predictors like starch content, delivering tighter statistical constraints and higher R2. Previous study reported starch was the main component for predicting energy metabolism (47). Thus, the starch and bulk density was added as predictors of regression equation in this study based on the above information. We gain regression equation of ME = −0.3869 + 0.7788 DE + 0.0336 starch + 0.0020 bulk density (R2 = 0.81). The prediction accuracy of ME was improved when starch and bulk density were incorporated into the prediction model as the second and third predictive factors.
4 Conclusion
There are apparent differences in the chemical constituents and energy contents among the 17 samples of wheat. The variability in available energy and nutrients digestibility of wheat samples was mainly associated with the differences in the chemical constituents. Chemical composition of wheat must be considered when wheat was used for formulating pig feeds. Predictive models of energy content were exploited. The optimal predictive model for the DE and ME were DE = 26.6394 − 0.6783 GE + 0.1618 CP and ME = −0.3869 + 0.7788 DE + 0.0336 starch + 0.0020 bulk density. Previous studies have demonstrated that the incorporation of wheat at a 60% inclusion rate in corn-soybean meal-based diets for pigs can reduce the usage of corn and soybean meal by approximately 55 and 7%, respectively, without compromising normal growth performance (2). The model have important practical significance in using wheat for precise diet configurations in pigs.
4.1 Potential future directions
Further research will focus on elucidating the interaction effect between fiber composition and other nutrients (e.g., arabinoxylans and β-glucans).
Data availability statement
The raw data supporting the conclusions of this article will be made available by the authors, without undue reservation.
Ethics statement
The animal studies were approved by the Institutional Animal Care and Use Committee of Shangqiu Normal University (2023-1109). The studies were conducted in accordance with the local legislation and institutional requirements. Written informed consent was obtained from the owners for the participation of their animals in this study.
Author contributions
CS: Conceptualization, Funding acquisition, Writing – original draft. QZ: Resources, Writing – review & editing. ZLu: Writing – review & editing, Resources. YY: Resources, Writing – review & editing. YD: Writing – review & editing, Data curation. JL: Project administration, Writing – review & editing. CZ: Writing – review & editing, Supervision. LX: Supervision, Writing – review & editing. XH: Supervision, Writing – review & editing. ZLi: Project administration, Writing – review & editing. JH: Writing – review & editing. GY: Validation, Writing – review & editing. YG: Writing – review & editing, Validation. BM: Conceptualization, Writing – original draft.
Funding
The author(s) declare that financial support was received for the research and/or publication of this article. This research was supported by the Doctoral Research Fund of Shangqiu Normal University, the Natural Science Foundation of Henan Province of China (252300420717), Key Scientific Research Project of Colleges and Universities in Henan Province (25CY029 and 24A310009), and the Henan Province Programs for Science and Technology Development (242102110037).
Conflict of interest
The authors declare that the research was conducted in the absence of any commercial or financial relationships that could be construed as a potential conflict of interest.
Generative AI statement
The authors declare that no Gen AI was used in the creation of this manuscript.
Any alternative text (alt text) provided alongside figures in this article has been generated by Frontiers with the support of artificial intelligence and reasonable efforts have been made to ensure accuracy, including review by the authors wherever possible. If you identify any issues, please contact us.
Publisher’s note
All claims expressed in this article are solely those of the authors and do not necessarily represent those of their affiliated organizations, or those of the publisher, the editors and the reviewers. Any product that may be evaluated in this article, or claim that may be made by its manufacturer, is not guaranteed or endorsed by the publisher.
References
1. Wei, Z, Xu, L, Yang, J, Schroyen, M, Jiang, X, Cui, S, et al. Evaluation of standardized ileal digestibility of amino acids in corn, barley, wheat bran fed to primiparous sows during gestation, lactation, and post-weaning period. J Anim Sci. (2025) 103:skaf277. doi: 10.1093/jas/skaf277
2. Han, TH, Hong, JS, Fang, LH, Do, SH, Kim, BO, and Kim, YY. Effects of wheat supplementation levels on growth performance, blood profiles, nutrient digestibility, and pork quality in growing-finishing pigs. Asian Australas J Anim Sci. (2017) 30:1150–9. doi: 10.5713/ajas.16.0838
3. Wilke, V, and Kamphues, J. Effects of substituting wheat by rye in diets for young fattening pigs on nutrient digestibility, performance, products of intestinal fermentation, and fecal characteristics. Front Vet Sci. (2023) 10:1199505. doi: 10.3389/fvets.2023.1199505
4. Zhang, G, He, X, Sun, Z, Wang, T, Liu, L, Zhao, J, et al. Effects of extrusion on the available energy and nutrient digestibility of wheat and its application in weaned piglets. Animals. (2025) 15:528. doi: 10.3390/ani15040528
5. Chen, F, Wang, Y, Wang, K, Chen, J, Jin, K, Peng, K, et al. Effects of Litsea cubeba essential oil on growth performance, blood antioxidation, immune function, apparent digestibility of nutrients, and fecal microflora of pigs. Front Pharmacol. (2023) 14:1166022. doi: 10.3389/fphar.2023.1166022
6. Wang, L, Shi, H, Hu, Q, Gao, W, Wang, L, Lai, C, et al. Modeling net energy partition patterns of growing-finishing pigs using nonlinear regression and artificial neural networks. J Anim Sci. (2023) 101:skac405. doi: 10.1093/jas/skac405
7. Son, J, Kim, J, Jo, H, and Kim, BG. Fecal amylase-treated neutral detergent fiber and ash contents as independent variables can predict metabolizable energy and coefficient of energy digestibility of diets for growing pigs without dietary information. Anim Feed Sci Tech. (2023) 305:115790. doi: 10.1016/j.anifeedsci.2023.115790
8. Regmi, PR, Ferguson, NS, and Zijlstra, RT. In vitro digestibility techniques to predict apparent total tract energy digestibility of wheat in grower pigs. J Anim Sci. (2009) 87:3620–9. doi: 10.2527/jas.2008-1739
9. Navarro, DMDL, Bruininx, EMAM, de Jong, L, and Stein, HH. The contribution of digestible and metabolizable energy from high-fiber dietary ingredients is not affected by inclusion rate in mixed diets fed to growing pigs. J Anim Sci. (2018) 96:1860–8. doi: 10.1093/jas/sky090
10. Macias Franco, A, Silva, AEM, Brody, T, Holton, G, Rockwell, M, De Paula, NF, et al. Investigating variability of craft microbreweries spent grains for classification and incorporation into precision diet formulation through multivariate analyses. Heliyon. (2025) 11:e41606. doi: 10.1016/j.heliyon.2024.e41606
11. McGhee, ML, and Stein, HH. The apparent ileal digestibility and the apparent total tract digestibility of carbohydrates and energy in hybrid rye are different from some other cereal grains when fed to growing pigs. J Anim Sci. (2020) 98:skaa218. doi: 10.1093/jas/skaa218
12. Zhao, J, Tang, S, Zhou, X, Dong, W, Zhang, S, and Huang, C. Determination of chemical composition, energy content, and amino acid digestibility in different wheat cultivars fed to growing pigs. J Anim Sci. (2019) 97:714–26. doi: 10.1093/jas/sky431
13. Ribeiro, FRB, Barcelos, B, Nuti, LC, Foxworth, WB, Lewis, SK, Jung, Y, et al. 1676 the relationship between body condition score and body weight, body linear measurements and real-time ultrasound body composition measurements in Alpine does before breeding and kidding. J Anim Sci. (2016) 94:816–7. doi: 10.2527/jam2016-1676
14. Zhao, J, Song, X, Yang, M, Zhang, G, and Liu, L. Determination and prediction of available energy in 13 cereal feed ingredients for growing pigs. Vet Sci. (2024) 11:648. doi: 10.3390/vetsci11120648
15. Jha, R, Overend, DN, Simmins, PH, Hickling, D, and Zijlstra, RT. Chemical characteristics, feed processing quality, growth performance and energy digestibility among wheat classes in pelleted diets fed to weaned pigs. Anim Feed Sci Technol. (2011) 170:78–90. doi: 10.1016/j.anifeedsci.2011.08.006
16. Kim, JC, Mullan, BP, Simmins, PH, and Pluske, JR. Variation in the chemical composition of wheats grown in Western Australia as influenced by variety, growing region, season, and post-harvest storage. Aust J Agric Res. (2003) 54:541–50. doi: 10.4319/lo.1983.28.4.0796
17. Jevtić, R, Župunski, V, Grčak, M, Živančev, D, and Knežević, D. Cereal-pea intercropping reveals variability in the relationships among yield, quality parameters, and obligate pathogens infection in wheat, rye, oat, and triticale, in a temperate environment. Plants. (2023) 12:2067. doi: 10.3390/plants12112067
18. Saini, A, Manuja, S, Singh, G, Bindra, AD, Sahoo, C, Singh, A, et al. Effect of cultivation practices on productivity and nutrient dynamics of wheat varieties under northern hill zone of India. BMC Plant Biol. (2025) 25:497. doi: 10.1186/s12870-025-06436-7
19. Lu, Y, Chae, M, Vasanthan, T, and Bressler, DC. The potential of fiber-depleted starch concentrate produced through air currents assisted particle separation of barley flour in bio-ethanol production. Bioresour Technol. (2020) 303:122942. doi: 10.1016/j.biortech.2020.122942
20. Wang, X, Liu, Y, Xu, Y, Gao, S, Xu, Q, Gong, H, et al. Structural characterization of a pectic polysaccharide from Rubus chingii Hu. Unripe fruits and its efficacy in inhibiting intestinal lipid absorption in vivo. Carbohydr Polym. (2025) 363:123728. doi: 10.1016/j.carbpol.2025.123728
21. Kindred, DR, Verhoeven, TMO, Weightman, RM, Swanston, JS, Agu, RC, Brosnan, JM, et al. Effects of variety and fertilizer nitrogen on alcohol yield, grain yield, starch and protein content, and protein composition of winter wheat. J Cereal Sci. (2008) 48:46–57. doi: 10.1016/j.jcs.2007.07.010
22. Zeng, D, Peng, J, Zhang, L, Hayden, MJ, Rathjen, TM, Li, X, et al. Twisted Sister1: an agravitropic mutant of bread wheat (Triticum aestivum) with altered root and shoot architectures. Plant J. (2025) 122:e70122. doi: 10.1111/tpj.70122
23. Huang, Q, Piao, XS, Ren, P, and Li, DF. Prediction of digestible and metabolizable energy content and standardized ileal amino acid digestibility in wheat shorts and red dog for growing pigs. Asian Australas J Anim Sci. (2012) 25:1748–58. doi: 10.5713/ajas.2012.12298
24. Zijlstra, RT, de Lange, CFM, and Patience, JF. Nutritional value of wheat for growing pigs: chemical composition and digestible energy content. Can J Anim Sci. (1999) 79:187–94. doi: 10.4141/A98-103
25. Widyaratne, GP, and Zijlstra, RT. Nutritional value of wheat and corn distiller’s dried grain with solubles: digestibility and digestible contents of energy, amino acids and phosphorus, nutrient excretion and growth performance of grower-finisher pigs. Can J Anim Sci. (2008) 87:103–14. doi: 10.4141/A05-070
26. Yun, XL, Liu, XB, Cheng, ZC, Ji, YR, Guo, YM, Yuan, JM, et al. Determination and prediction of standardized ileal amino acid digestibility of wheat in broilers. Poult Sci. (2023) 102:102383. doi: 10.1016/j.psj.2022.102383
27. Li, H, Zhao, J, Zhang, W, He, T, Meng, D, Lu, Y, et al. Comparative transcriptome analysis of two types of rye under low-temperature stress. Curr Issues Mol Biol. (2025) 47:171. doi: 10.3390/cimb47030171
28. Du, T, Li, P, Niu, Q, Pu, G, Wang, B, Liu, G, et al. Effects of varying levels of wheat bran dietary fiber on growth performance, fiber digestibility and gut microbiota in Erhualian and large white pigs. Microorganisms. (2023) 11:2474. doi: 10.3390/microorganisms11102474
29. Aderibigbe, AS, Park, CS, Johnson, T, Velayudhan, DE, Vinyeta, E, and Adeola, O. Efficacy of a novel multi-enzyme feed additive on growth performance, nutrient digestibility, and gut microbiome of weanling pigs fed corn-wheat or wheat-barley-based diet. J Anim Sci. (2024) 102:skae064. doi: 10.1093/jas/skae064
30. Li, Z, Zhao, Y, Wang, H, Zhang, W, Zhang, C, Xie, J, et al. High-fibre diets regulate antioxidative capacity and promote intestinal health by regulating bacterial microbiota in growing pigs. J Anim Physiol Anim Nutr. (2024) 108:357–65. doi: 10.1111/jpn.13897
31. Wealleans, AL, Bierinckx, K, and Benedetto, MD. Fats and oils in pig nutrition: factors affecting digestion and utilization. Anim Feed Sci Tech. (2021) 277:114950. doi: 10.1016/j.anifeedsci.2021.114950
32. Chen, Y, Wang, Z, Ding, J, Ming, D, Wang, W, Jiang, Z, et al. Effects of dietary fiber content and different fiber-rich ingredients on endogenous loss of fat and fatty acids in growing pigs. J Anim Sci Biotechnol. (2019) 10:42. doi: 10.1186/s40104-019-0348-3
33. Cai, Z, Wang, Y, Qin, X, Huang, D, Cao, N, and Li, J. Determination and prediction of the energy content and amino acid digestibility of brewer’s spent grain for growing pigs. J Anim Sci. (2025) 103:skaf070. doi: 10.1093/jas/skaf070
34. Kim, JC, Simmins, PH, Mullan, BP, and Pluske, JR. The digestible energy value of wheat for pigs, with special reference to the post-weaned animal. Anim Feed Sci Technol. (2005) 122:257–87. doi: 10.1016/j.anifeedsci.2005.02.022
35. Li, R, Tian, M, Feng, G, Hou, G, Jiang, X, Yang, G, et al. Determination and prediction of digestible energy, metabolizable energy, and standardized ileal digestibility of amino acids in barley for growing pig. Anim Feed Sci Technol. (2023) 298:115607. doi: 10.2139/ssrn.4277355
36. Kim, JC, Mullan, BP, Simmins, PH, and Pluske, JR. Effect of variety, growing region and growing season on digestible energy content of wheats grown in Western Australia for weaner pigs. Anim Sci. (2004) 78:53–60. doi: 10.1017/S1357729800053832
37. Fang, ZF, Liu, ZL, Dai, JJ, Qian, HY, Qi, ZL, Ma, LB, et al. Effects of enzyme addition on the nutritive value of broiler diets containing hulled or dehulled Chinese double-low rapeseed meals. J Anim Physiol Anim Nutr. (2009) 93:467–76. doi: 10.1111/j.1439-0396.2008.00829.x
38. Lyu, Z, Chen, Y, Wang, F, Liu, L, Zhang, S, and Lai, C. Net energy and its establishment of prediction equations for wheat bran in growing pigs. Anim Biosci. (2023) 36:108–18. doi: 10.5713/ab.22.0001
39. Liu, X, Yun, X, Cheng, Z, Guo, Y, Yuan, J, and Nie, W. Determination and prediction of standardized ileal amino acid digestibility of wheat bran in broiler chickens. Anim Biosci. (2024) 37:1788–98. doi: 10.5713/ab.24.0003
40. Peng, J, Ge, C, Shang, K, Liu, S, and Jiang, Y. Comprehensive profiling of the chemical constituents in Dayuanyin decoction using UPLC-QTOF-MS combined with molecular networking. Pharm Biol. (2024) 62:480–98. doi: 10.1080/13880209.2024.2354341
41. Liang, Y, Hou, Q, Yu, M, Chang, Y, Zhao, H, Liu, G, et al. Prediction of the net energy of wheat from chemical analysis for growing ducks. Animals. (2023) 13:1097. doi: 10.3390/ani13061097
42. Liu, M, Hu, H, Ouyang, K, Li, G, Chen, Y, Wang, S, et al. Effects of rice, soy, and whey protein additions on quality characteristics and in vitro digestibility of rice cakes. Int J Biol Macromol. (2025) 320:145775. doi: 10.1016/j.ijbiomac.2025.145775
43. Ma, H, Huang, S, Li, F, Pang, Z, Luo, J, Sun, D, et al. Development and validation of an automatic machine learning model to predict abnormal increase of transaminase in valproic acid-treated epilepsy. Arch Toxicol. (2024) 98:3049–61. doi: 10.1007/s00204-024-03803-5
44. Noblet, J, Fortune, H, Shi, XS, and Dubois, S. Prediction of net energy value of feeds for growing pigs. J Anim Sci. (1994) 72:344–54. doi: 10.2527/1994.722344x
45. Huang, Q, Shi, CX, Su, YB, Liu, ZY, Li, DF, Liu, L, et al. Prediction of the digestible and metabolizable energy content of wheat milling by-products for growing pigs from chemical composition. Anim Feed Sci Tech. (2014) 196:107–16. doi: 10.1016/j.anifeedsci.2014.06.009
46. Kim, JC, Mullan, BP, Heo, JM, Hernandez, A, and Pluske, JR. Variation in digestible energy content of Australian sweet lupins (Lupinus angustifolius L.) and the development of prediction equations for its estimation. J Anim Sci. (2009) 87:2565–73. doi: 10.2527/jas.2008-1545
Keywords: digestible energy, metabolizable energy, pig, prediction equation, wheat
Citation: Shi C, Zhu Q, Lu Z, Yang Y, Ding Y, Li J, Zhang C, Xi L, He X, Li Z, Han J, Yang G, Guo Y and Ma B (2025) Predictive models of digestible and metabolizable energy of wheat in growing pigs. Front. Nutr. 12:1662909. doi: 10.3389/fnut.2025.1662909
Edited by:
Amira M. Galal Darwish, Borg Al Arab Technological University, EgyptReviewed by:
Walaa Gomaa, Assiut University, EgyptShahid Ali Rajput, Muhammad Nawaz Shareef University of Agriculture, Pakistan
Yipin Lyu, Jiangnan University, China
Copyright © 2025 Shi, Zhu, Lu, Yang, Ding, Li, Zhang, Xi, He, Li, Han, Yang, Guo and Ma. This is an open-access article distributed under the terms of the Creative Commons Attribution License (CC BY). The use, distribution or reproduction in other forums is permitted, provided the original author(s) and the copyright owner(s) are credited and that the original publication in this journal is cited, in accordance with accepted academic practice. No use, distribution or reproduction is permitted which does not comply with these terms.
*Correspondence: Bingbing Ma, bWFiaW5nYmluZzMwNjJAMTYzLmNvbQ==