 Nouf A. Alghamdi
 Arwa S. Almasaudi
- 1Department of Community Health Sciences, College of Applied Medical Sciences, King Saud University, Riyadh, Saudi Arabia
- 2Department of Clinical Nutrition, Faculty of Applied Medical Sciences, King Abdulaziz University, Jeddah, Saudi Arabia
Introduction: Sleep plays a vital role in daily functioning and well-being, yet insufficient sleep is a growing global concern influenced by modern lifestyles.
Methods: This study examined the relationship between dietary habits, and sleep quality among 1,041 Saudi adults using self-administered questionnaires, including the Pittsburgh Sleep Quality Index (PSQI) and a nutrition behavior questionnaire.
Results: The key findings included that 77.4% of participants had poor sleep quality (PSQI > 6). Females reported worse sleep efficiency, more disturbances, and greater daytime dysfunction than males. Dietary patterns revealed low consumption of fruits (38.2%), vegetables (28%), fish (38.9%), and legumes (38%), and high consumption of starches (41%), poultry (26.4%), and sweets (29.9%). Positive associations were found between sleep efficiency and fruit, fish, and legume intake, while high starch, sweets, and dairy consumption correlated with poorer sleep quality, longer sleep latency, and increased daytime dysfunction. Gender-specific analysis showed distinct dietary effects. In males, fruits, vegetables, dairy, and legumes improved sleep quality, whereas starches and sweets negatively affected it. In females, sweets negatively affected sleep quality and latency, while fish consumption improved sleep efficiency and reduced dysfunction.
Discussion: The study highlights the connection between diet and sleep, suggesting that individualized dietary interventions could help enhance sleep quality. However, limitations, such as self-reported data and confounding factors, call for further research using objective measures.
1 Introduction
Sleep is essential for daily functioning and overall well-being. It is characterized by reduced activity, closed eyes, and unconsciousness (1, 2). Insufficient sleep has become a growing global concern; over the past four decades, average sleep duration has declined by 2 h (3). This decrease is likely driven by lifestyle shifts, including increased activity levels and the widespread use of technology (4). Even brief periods of sleep deprivation can impair cognitive functions such as attention and working memory (4), likely due to hormonal changes that affect physical recovery and renewal (4, 5).
Common strategies to improve sleep include reducing light and noise and practicing relaxation techniques (5). While medications may aid sleep, they carry potential side effects and should be used cautiously (5). Tools such as the Pittsburgh Sleep Quality Index (PSQI) help assess sleep quality. The PSQI is a self-report questionnaire that measures sleep quality and disturbances over 1 month across seven components: subjective sleep quality, latency, duration, efficiency, disturbances, use of medication, and daytime dysfunction (6).
Research shows that poor sleep quality and short duration are linked to metabolic disorders (7–9) and unhealthy dietary patterns, including skipped meals and late-night snacking (10). Individuals with poor sleep often consume more food, exhibit irregular eating habits, and go to bed late (11, 12). One study found that those with poor sleep tended to skip breakfast and replace meals with snacks (13). Another reported increased energy and protein intake among long sleepers and higher saturated fat intake among short sleepers (13). Moreover, short sleep duration was associated with greater fat intake in men and higher carbohydrate intake in women, even after accounting for variables like age, activity level, smoking, and alcohol use (12).
In terms of sleep quality, diets high in protein (14), fiber-rich carbohydrates (15)— fish, and vegetables are associated with better sleep outcomes (16, 17). A study of middle-aged female Japanese workers found that low intake of vegetables and fish, high intake of sweets and noodles, and skipping breakfast were linked to poorer sleep (17). However, not all studies report consistent findings. For example, a cohort study from the Netherlands found no strong association between diet and sleep quality, suggesting cultural and population differences may play a role (18).
Despite the global evidence linking diet and sleep, few studies have examined this relationship in the Middle East, and particularly in Saudi Arabia. The Saudi population is undergoing rapid lifestyle transitions, including increased urbanization, dietary westernization, and high prevalence of sleep disturbances, making it a unique context to investigate. To our knowledge, no large-scale study in Saudi Arabia has comprehensively assessed the association between dietary habits and sleep quality, while also considering gender-specific differences. By addressing this gap, the present study contributes region-specific evidence that may inform culturally tailored dietary and public health strategies.
Understanding dietary habits, particularly macronutrient intake, is important for public health. Identifying nutritional imbalances enables tailored interventions, education, and policy. This study aimed to examine the association between diet and sleep quality among adults in Saudi Arabia, with a focus on gender-based differences.
2 Materials and methods
2.1 Study design
This cross-sectional study was approved by the Institutional Review Board (IRB) of King Saud University Medical City, Riyadh, Saudi Arabia (Reference no. E-22-6778). A convenience sample of 1,041 participants asked to complete a self-administered online questionnaire after providing informed consent.
2.2 Participants and recruitment
The inclusion criteria were being a male or female citizen or resident across various regions of Saudi Arabia aged ≥18 years or older. Data collection for the study occurred through an online questionnaire completed by participants between May and October 2023. The Microsoft Forms platform was used to collect data (Microsoft Corporation, Redmond, WA, United States), and the link was distributed through popular social media platforms, including WhatsApp (Facebook, Inc., Menlo Park, CA, United States), X (X, Inc., San Francisco, CA, United States), and LinkedIn (Mountain View, CA, United States).
To ensure broader regional representation, trained data collectors were assigned from the five major regions of Saudi Arabia (North, South, West, East, and Central). Each data collector was responsible for distributing the questionnaire link within their respective region. This strategy facilitated wider outreach across the Kingdom, minimized geographic clustering, and enhanced the diversity of responses while maintaining a convenience sampling design.
2.3 Questionnaire
The online questionnaire comprised three main sections to assess dietary behavior and sleep quality among adults in Saudi Arabia. It was administered in Arabic and took about 18 min to complete. Participants were first provided with an informed consent form outlining the study’s purpose, eligibility criteria, confidentiality measures, and estimated duration.
The first section gathered sociodemographic data, including age, gender, nationality, marital status, city of residence, employment status, education level, monthly income, living situation, chronic disease status, and smoking habits. Participants also self-reported their weight (kg) and height (cm), allowing for the calculation of body mass index (BMI).
The second section assessed sleep quality and patterns over the past month using the Arabic version of the PSQI (19). The questionnaire. This self-administered questionnaire included 19 items, five of which were answered by bedmates or roommates. It evaluates seven components: sleep quality, latency, duration, habitual efficiency, disturbances, use of sleep medication, and daytime dysfunction. Each component is scored from 0 to 3 (0 = no disturbance, 3 = severe disturbance). The total score (0–21) indicates global sleep quality, with scores above 5 suggesting poor sleep quality.
In section three, a validated, previously translated nutrition behavior questionnaire was used to assess participants’ dietary habits. It examined the consumption of various food groups, including starches, fruits, vegetables, dairy products, red meat, poultry, fish, and legumes. Participants reported consumption frequency using options from “I do not eat it at all” to “6 times/week.” They then reported typical portion sizes for each food group, choosing from: “I do not eat it at all,” “<1 portion,” “1 portion,” “2 portions,” “3–4 portions,” or “5 or more portions.” For each food group, participants were provided with examples of food items, along with the estimated size of one portion. For instance:
• Starch: ½ cup of cereal, 1 slice of bread, or 1 potato.
• Fruit: 1 whole fruit, ½ cup of juice, or dried fruit.
• Vegetables: 1 cup fresh or ½ cup cooked.
• Milk and dairy products: 1 glass or cup, or 1 slice of cheese.
• Red meat, poultry, and fish: 30 g.
• Legumes: 1 cup.
2.4 Statistical analysis
Data were analyzed using SPSS version 21.0 (IBM SPSS, Chicago, United States). Continuous variables were expressed as mean ± standard deviation, and categorical variables as frequencies and percentages. Chi-square and independent t-tests were used to assess differences between categorical and continuous variables, respectively. Spearman’s and Kendall’s tau-b correlations evaluated bivariate associations among PSQI scores, components, demographics, and dietary intake. A general linear model univariate analysis assessed global PSQI score differences across demographics, adjusted for covariates. Results were reported as coefficients (R). Figures were created in MS Excel. Statistical significance was set at p < 0.05.
3 Results
3.1 Characteristics of respondents
Table 1 shows the demographic characteristics of the respondents. Males were significantly older than females (p < 0.001), with most males aged 31–40 years (32.6%) and most females aged 21–30 years (41.8%). Males also had significantly higher BMIs and a greater prevalence of overweight and obesity (p < 0.001). Saudis made up 96% of the sample, with no significant gender difference. About 80% lived in shared accommodation, though males were more likely to live alone (29.7%) than females (15.1%; p < 0.001). While over half of all respondents were from the Central Region, most males came from the Western Region, and most females from the Central Region (p < 0.001). A total of 71.6% held a university degree; higher education was more common among males (21.5%) than females (6.8%; p < 0.001). Nearly 75% of males were employed compared to 27.7% of females (p < 0.001). Marriage was also more prevalent among males (60%) than females (36.9%; p < 0.001). Regarding income, 65% of females had no income or earned under 4,000 SAR/month versus 19.5% of males (p < 0.001). Both genders had poor mean PSQI scores, with females showing significantly worse sleep quality (p < 0.001).
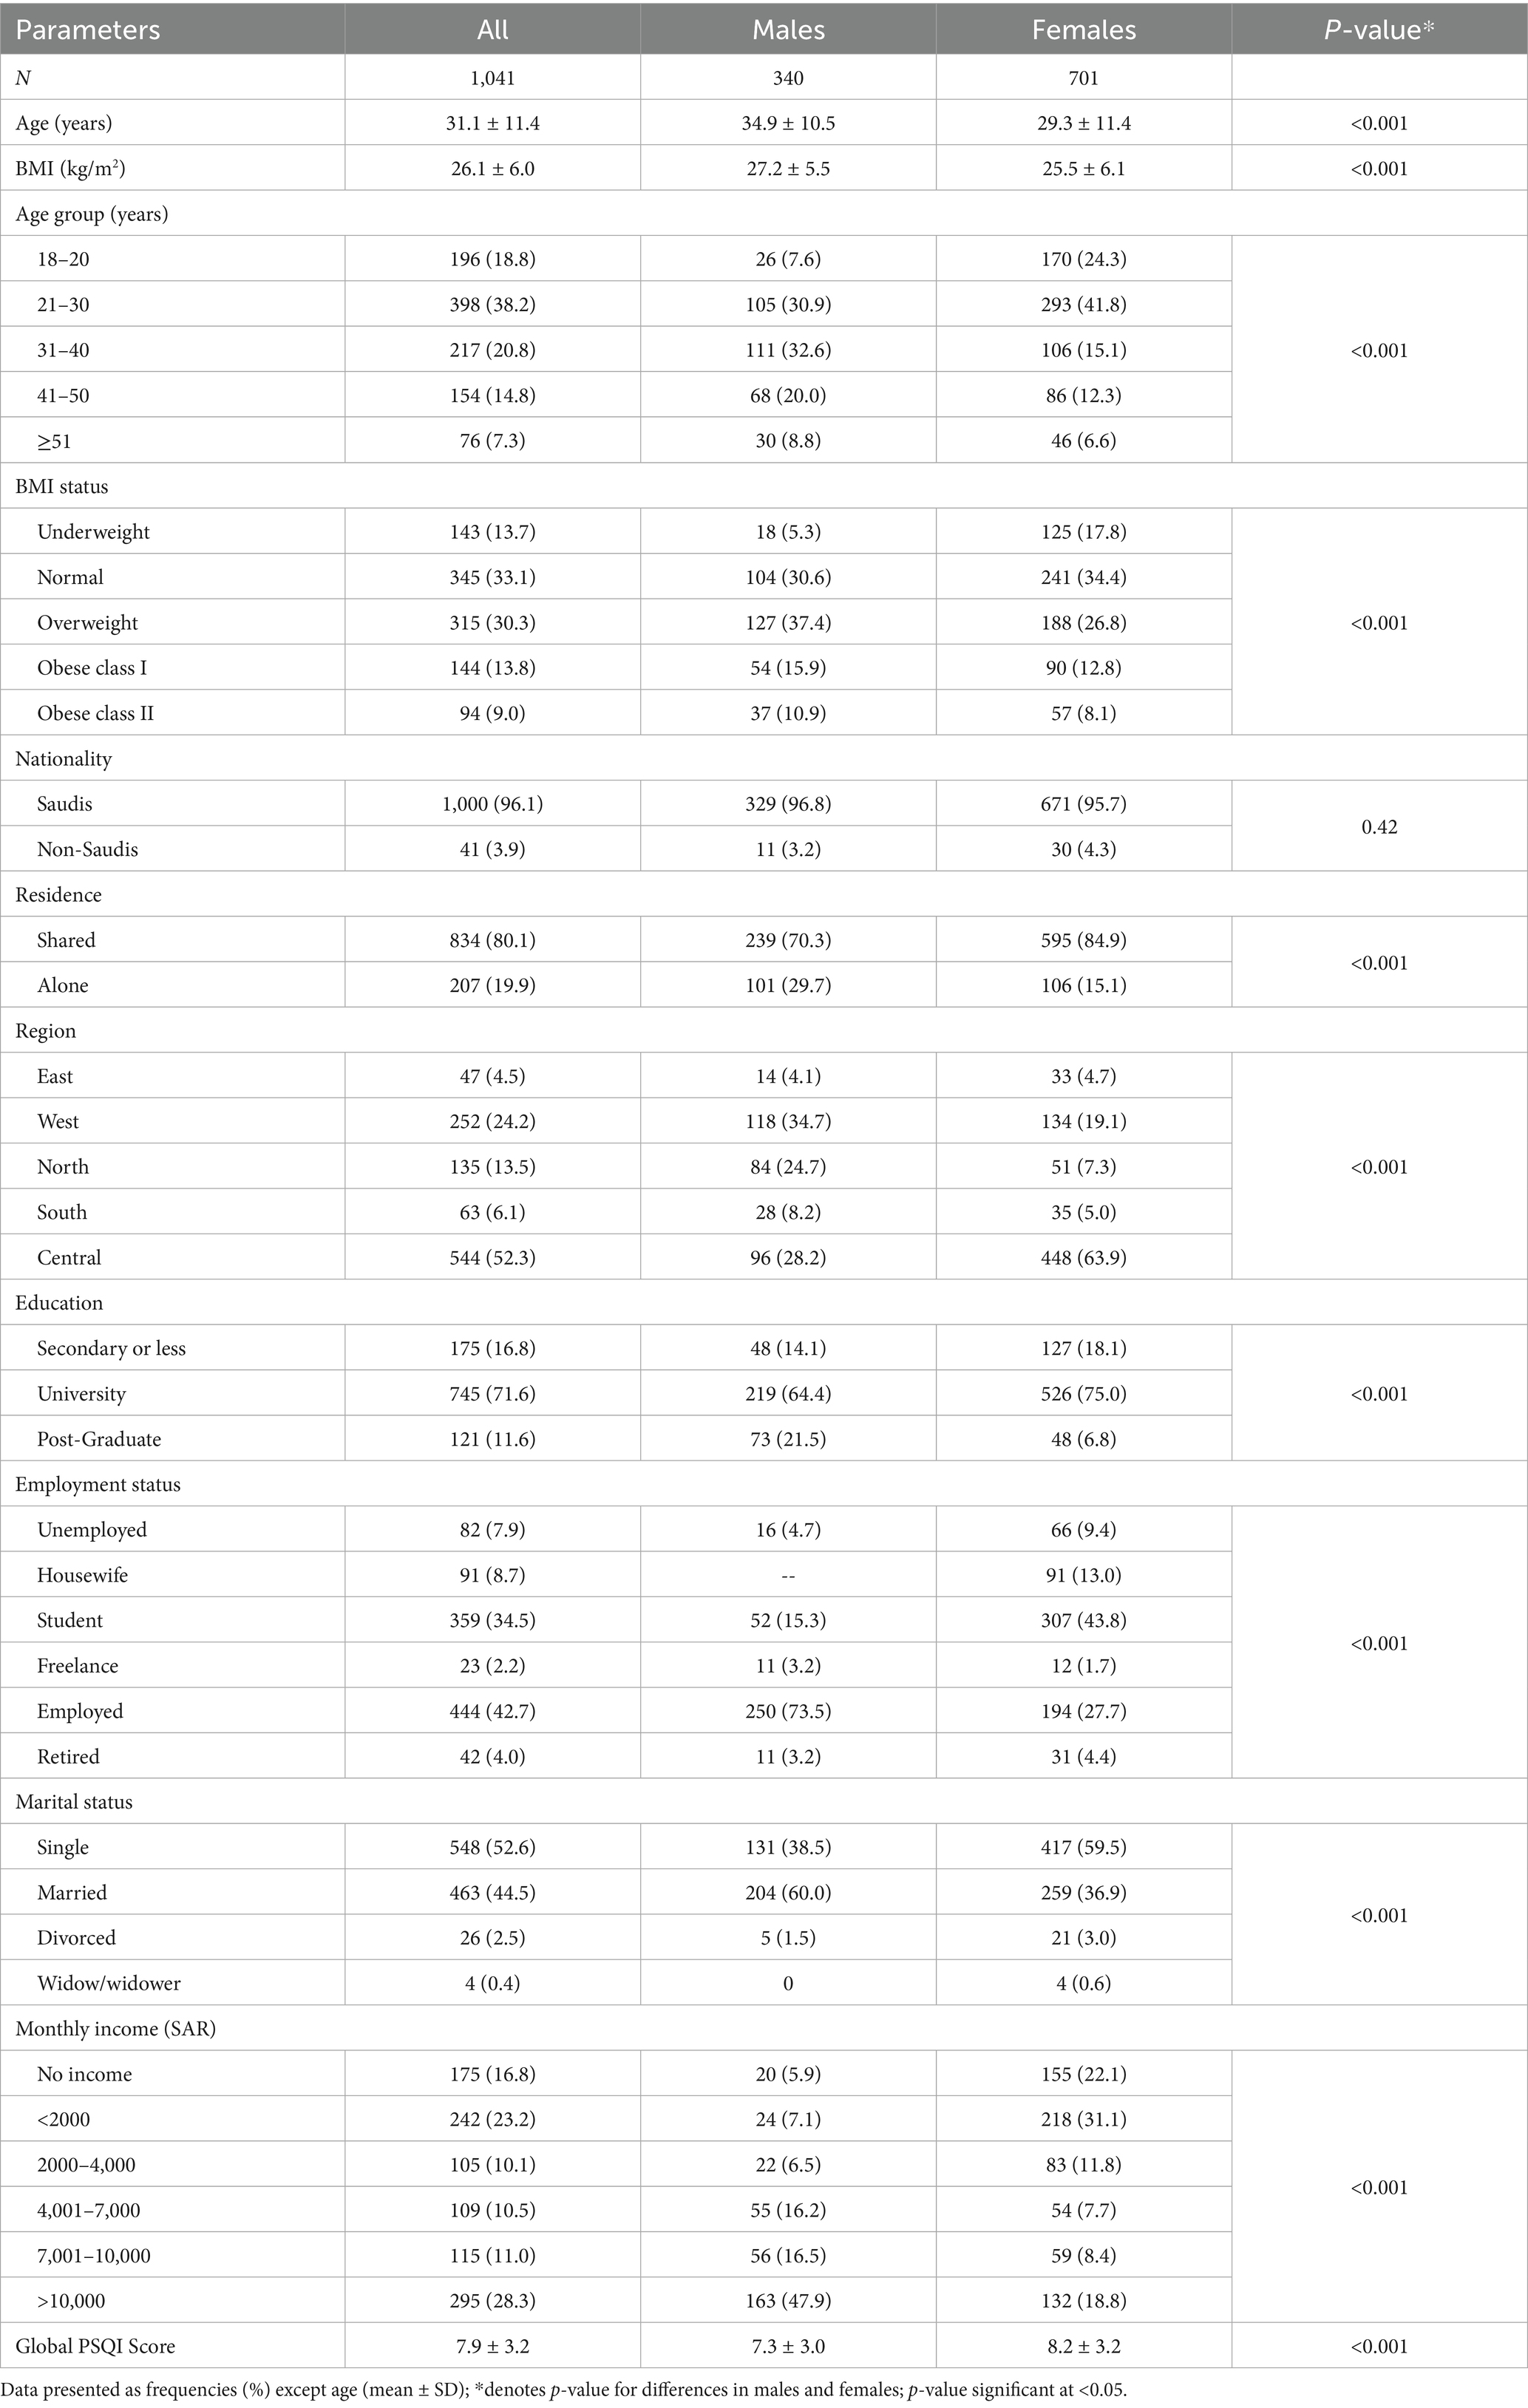
Table 1. Demographic characteristics of respondents.
3.2 Medical history characteristics of respondents
Table 2 presents the medical histories of the respondents. Multiple comorbidities were more common among females than males (p = 0.03). Dyslipidemia was the most frequent condition in both sexes (8.8% males, 9.1% females; p = 0.87). Among females, dyslipidemia was followed by depression (7.8%), anemia (7.7%), and gastrointestinal disorders (6.0%), all significantly higher than in males (4.1, 0.6, and 4.4%; p = 0.02, <0.001, and 0.29, respectively). Smoking prevalence was significantly higher in males (35.9%) than females (3.3%; p < 0.001). Hypertension was also more common in males (7.4%) than females (3.7%; p = 0.01). Anxiety was reported by nine participants, all females. Additionally, other unspecified diseases were more prevalent in females (p < 0.001).
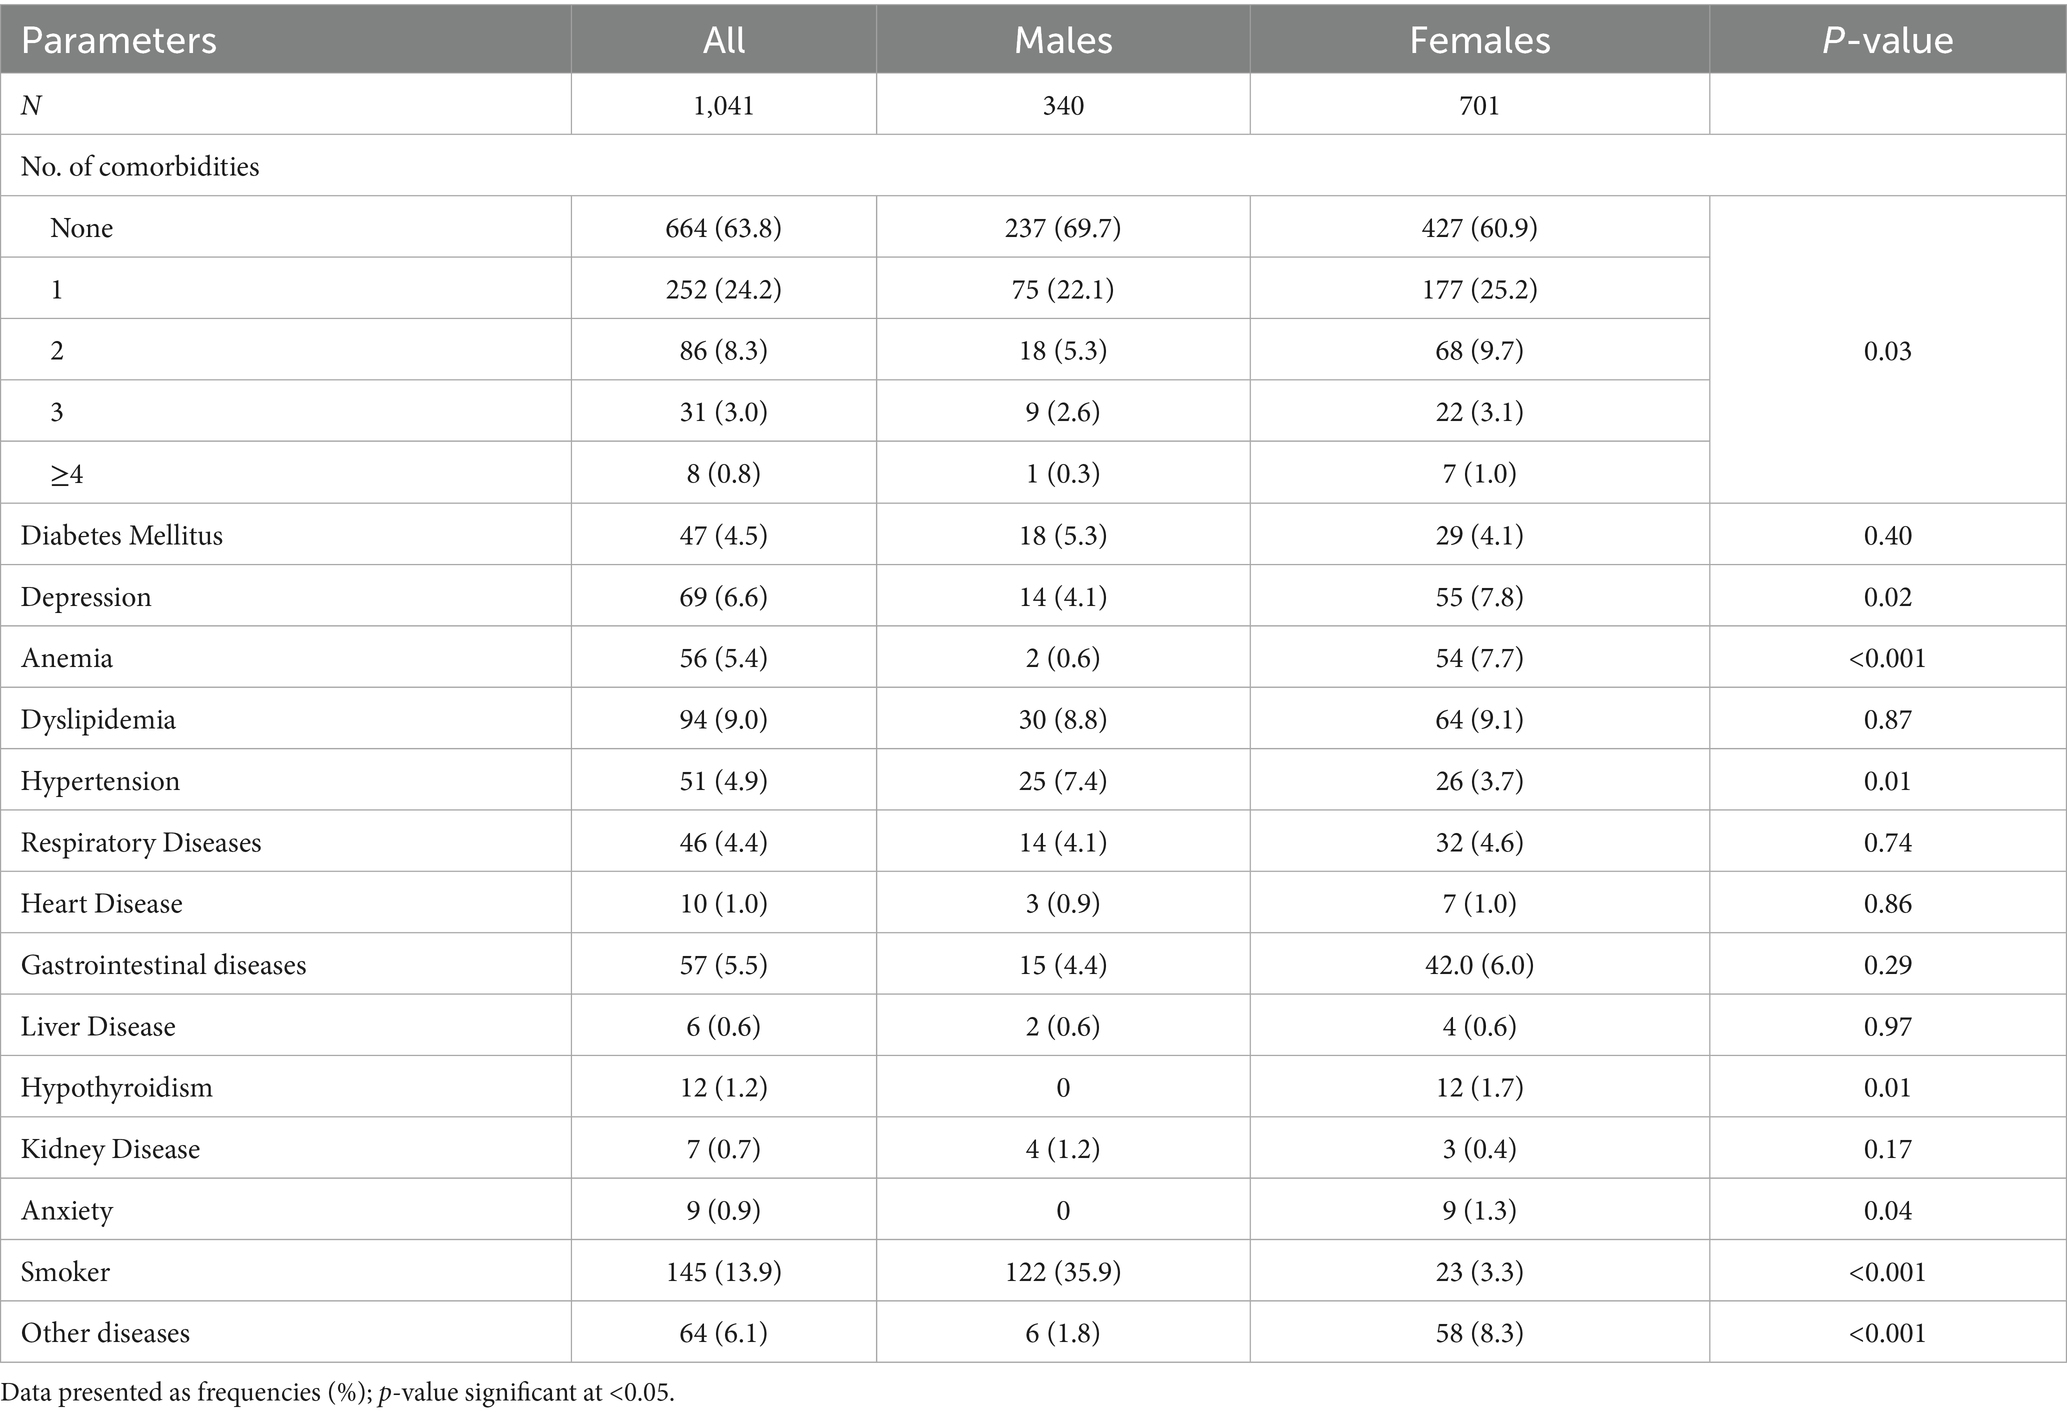
Table 2. Medical history characteristics of respondents.
3.3 PSQI components
An overwhelming 77.4% of respondents had PSQI scores above 6, while only 6% were categorized as having “good” sleep quality. Poor sleep was significantly more prevalent in females than males (79.7% vs. 72.6%; p = 0.027) (Figure 1).
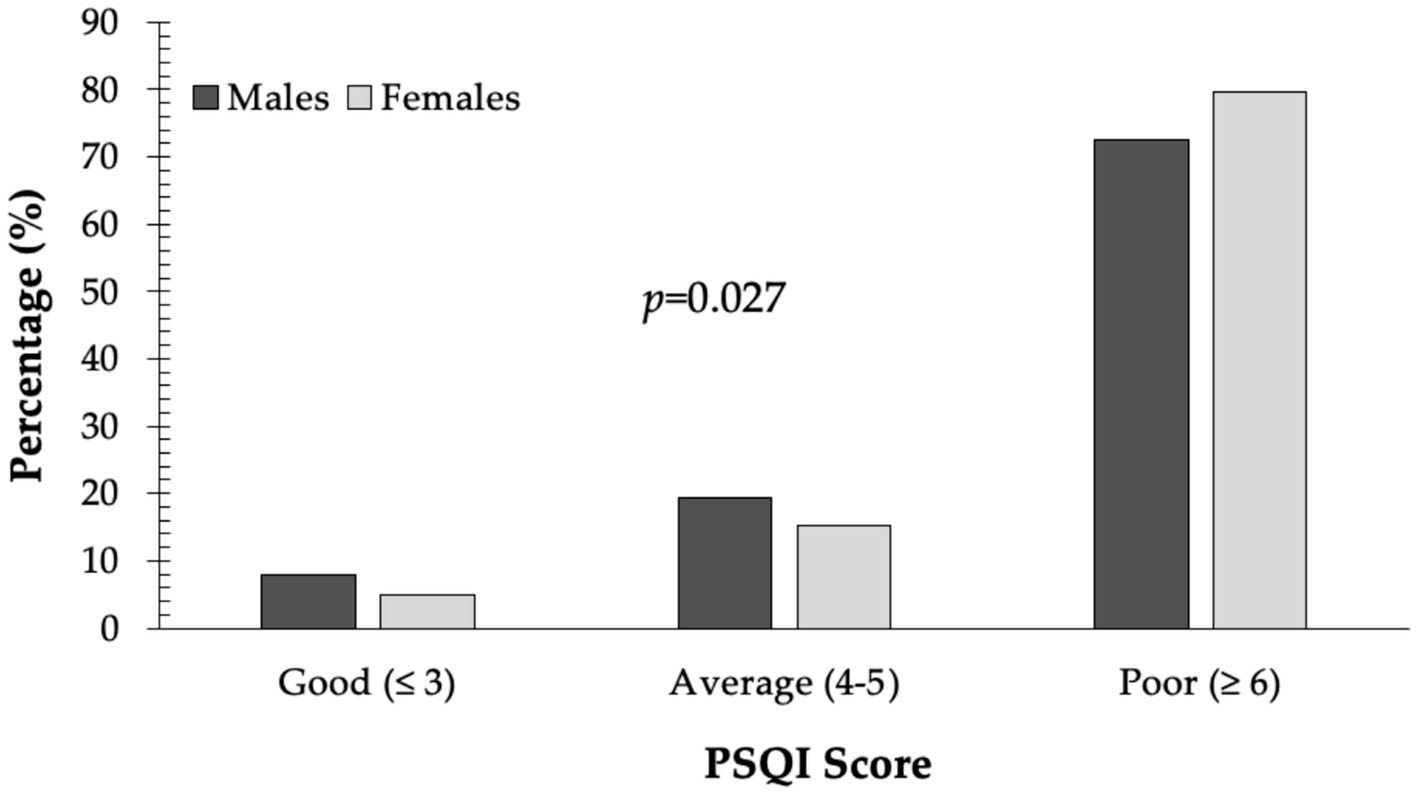
Figure 1. PSQI status in males and females.
Table 3 presents sleep characteristics based on the seven PSQI components. Only 26.4% reported very good subjective sleep quality, with males slightly better than females (31.2% vs. 24.1%; p = 0.08). About 12% reported very poor sleep quality. No gender differences were found in sleep latency, though 17.8% had severe latency. Over 75% slept 6+ h, but nearly half of males reported 6–7 h of sleep, compared to 36% of females (p = 0.007). Females had significantly higher rates of <65% sleep efficiency (51.8% vs. 45.6%; p = 0.01), moderate to severe sleep disturbances (35.6% vs. 26.9%; p < 0.001), and daytime dysfunction (31.1% vs. 19.4%; p < 0.001). Medication use was similar between genders, with over 80% reporting no use in the past month (Table 3).
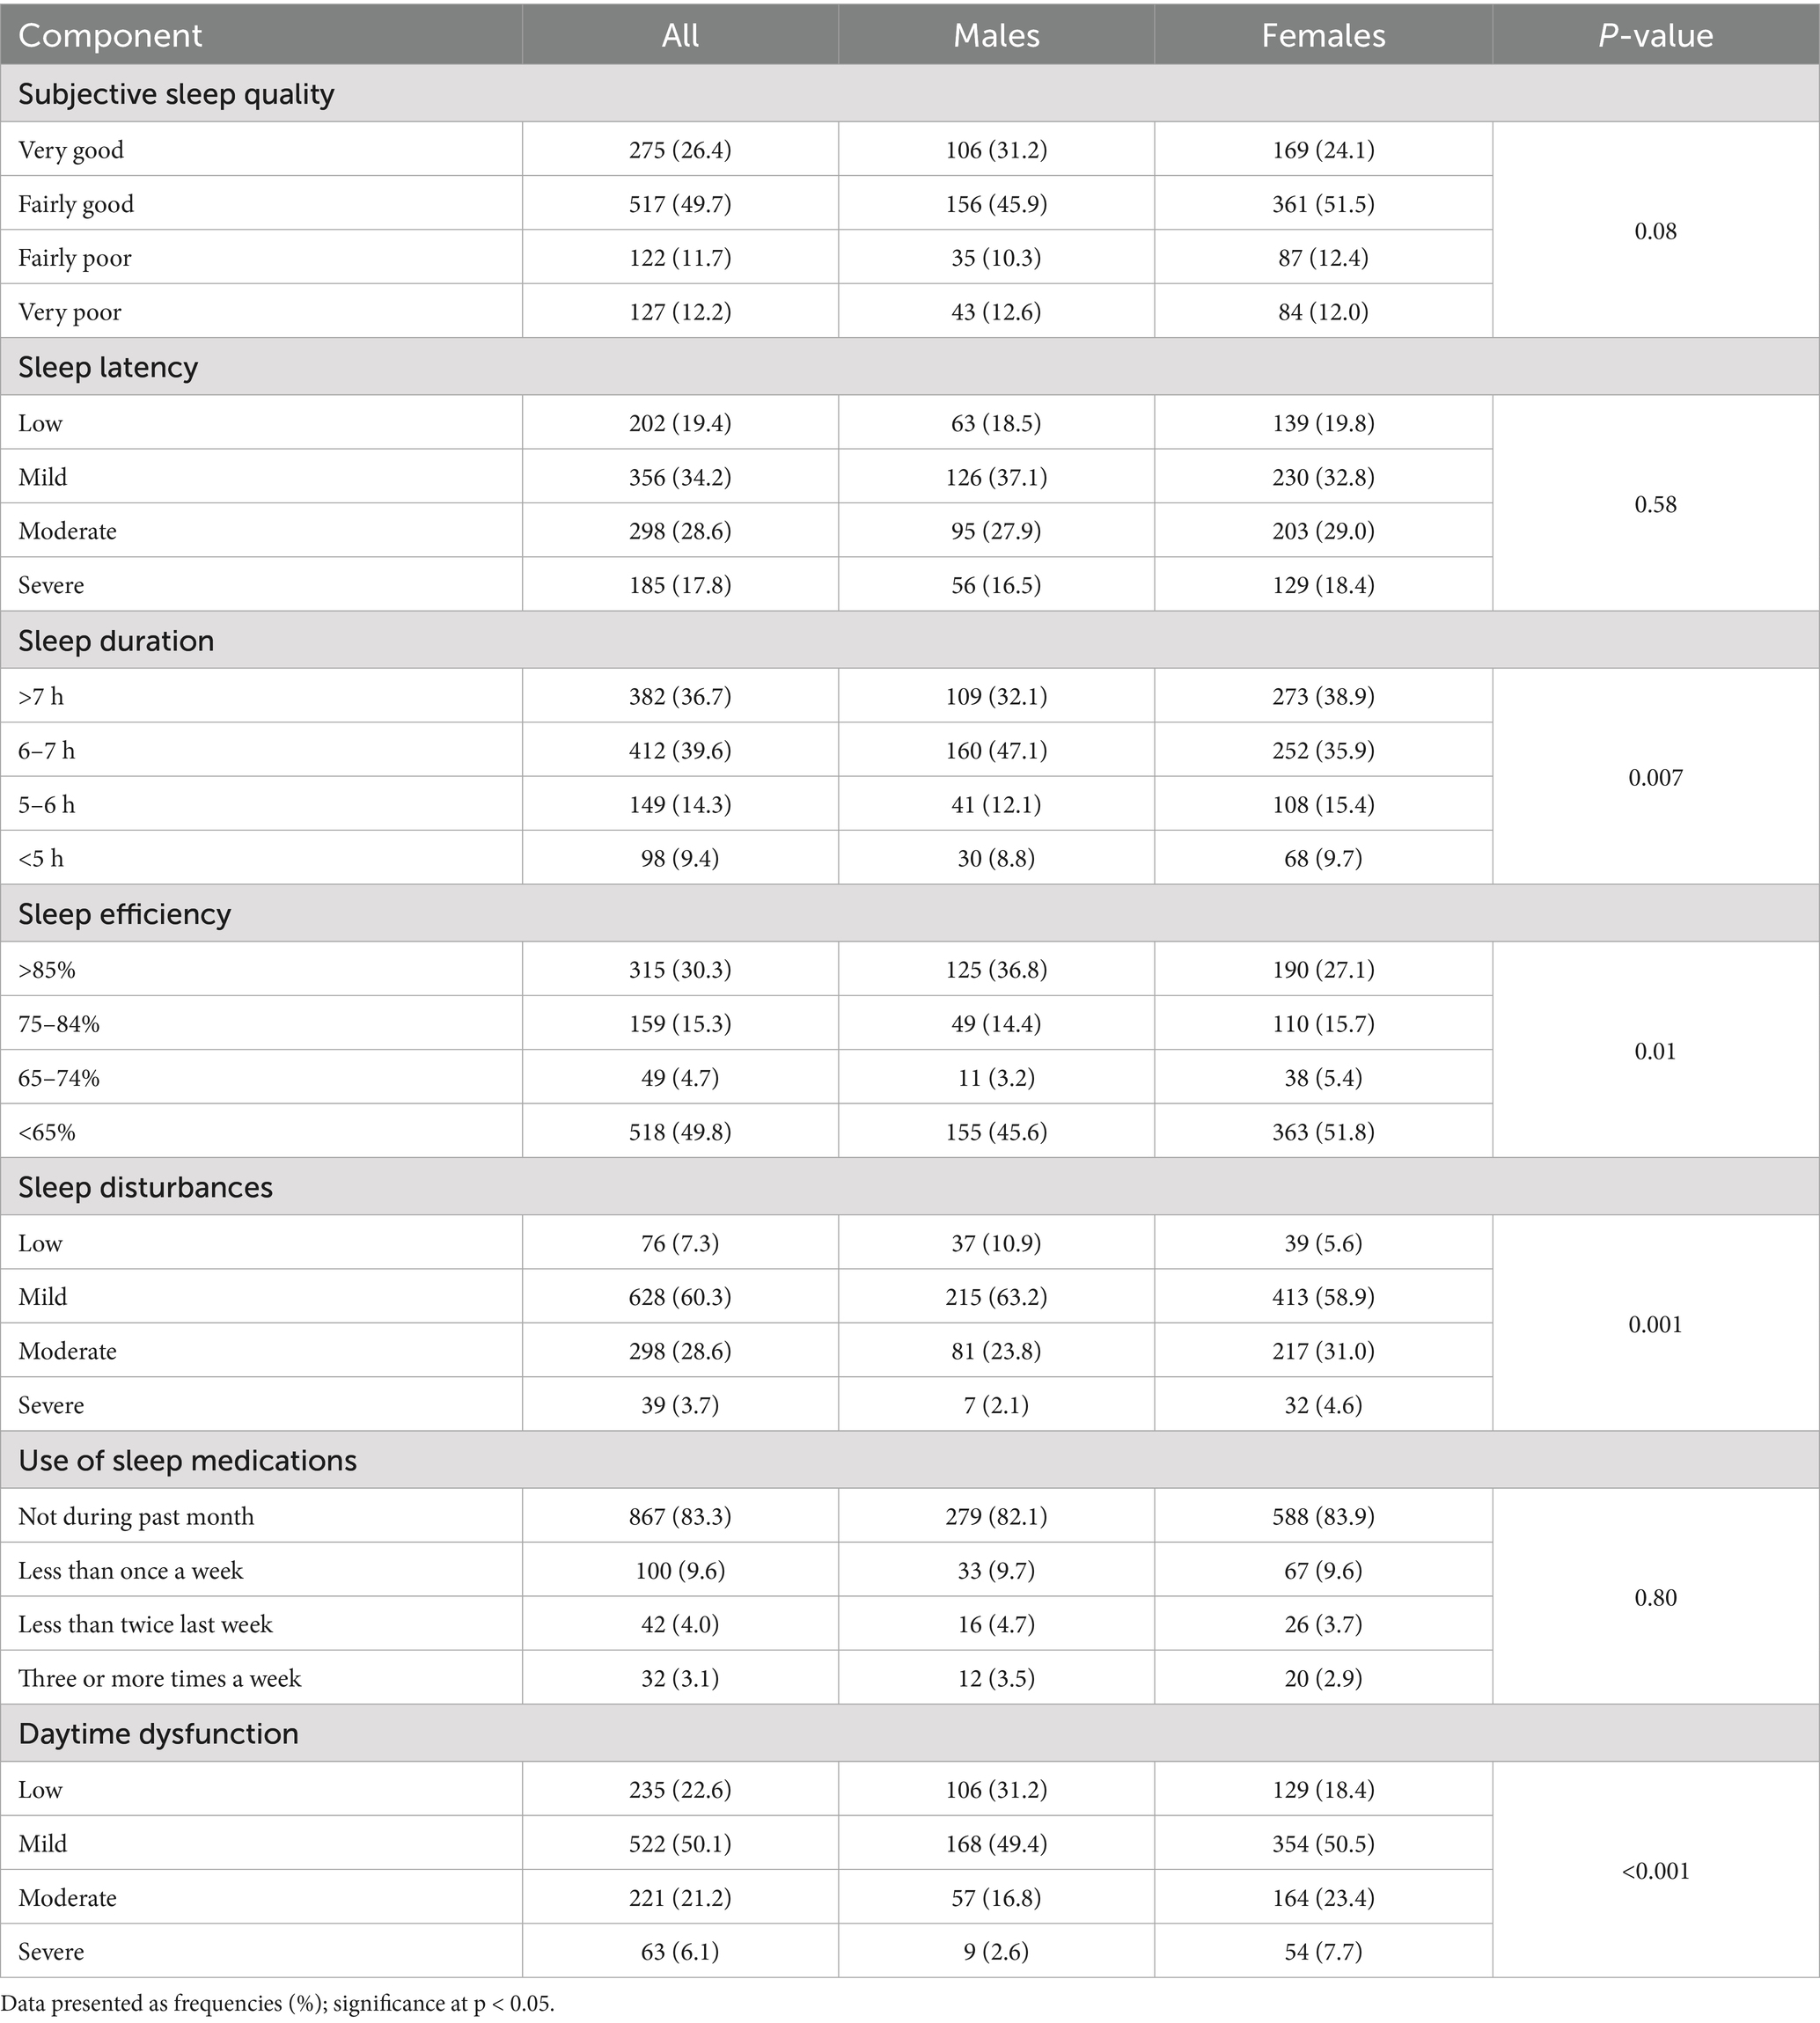
Table 3. PSQI components.
Interestingly, males from the Eastern Region reported the longest sleep durations compared to those from other regions, even after adjusting for age and BMI (Figure 2), a pattern not observed in females (p = 0.17).
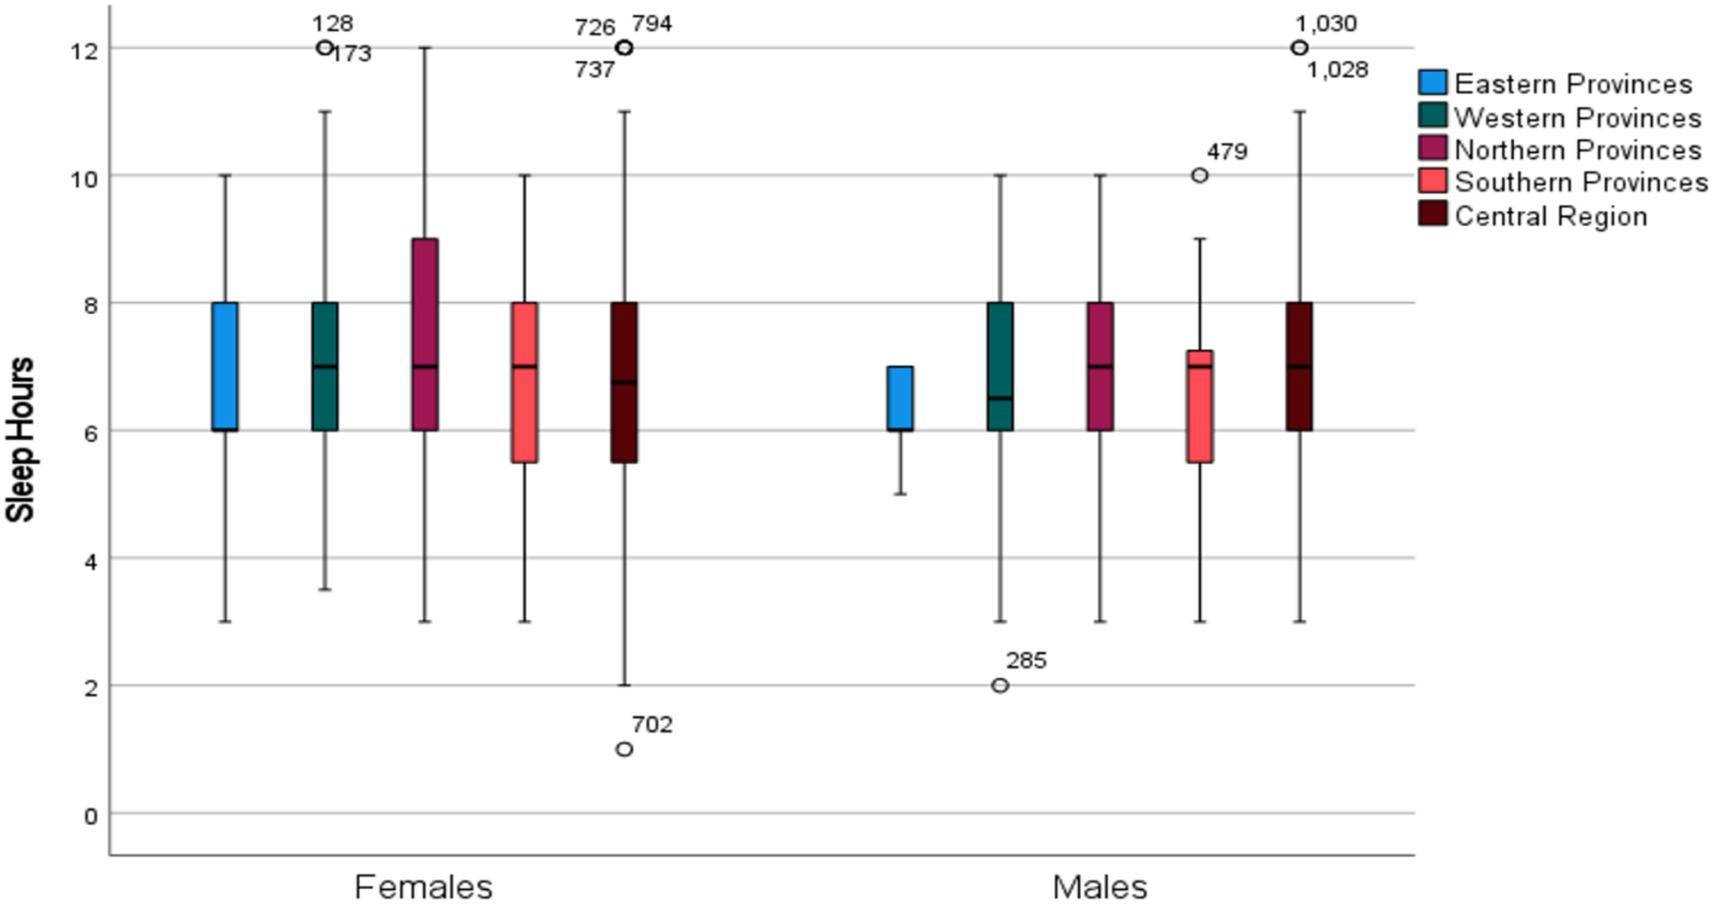
Figure 2. Over-all mean global PSQI Hours according to region in males and females.
3.4 Dietary intake of respondents
Table 4 presents weekly consumption frequencies of major food types. Most respondents consumed less than one portion per week of fruits (38.2%), vegetables (28%), fish (38.9%), and legumes (38%). Frequently consumed foods (≥7 portions/week) included starches (41%), poultry (26.4%), and sweets (29.9%). Significant gender differences emerged: males consumed fewer fruits, vegetables, and dairy, while females more frequently consumed starches, poultry, and sweets (Table 4).
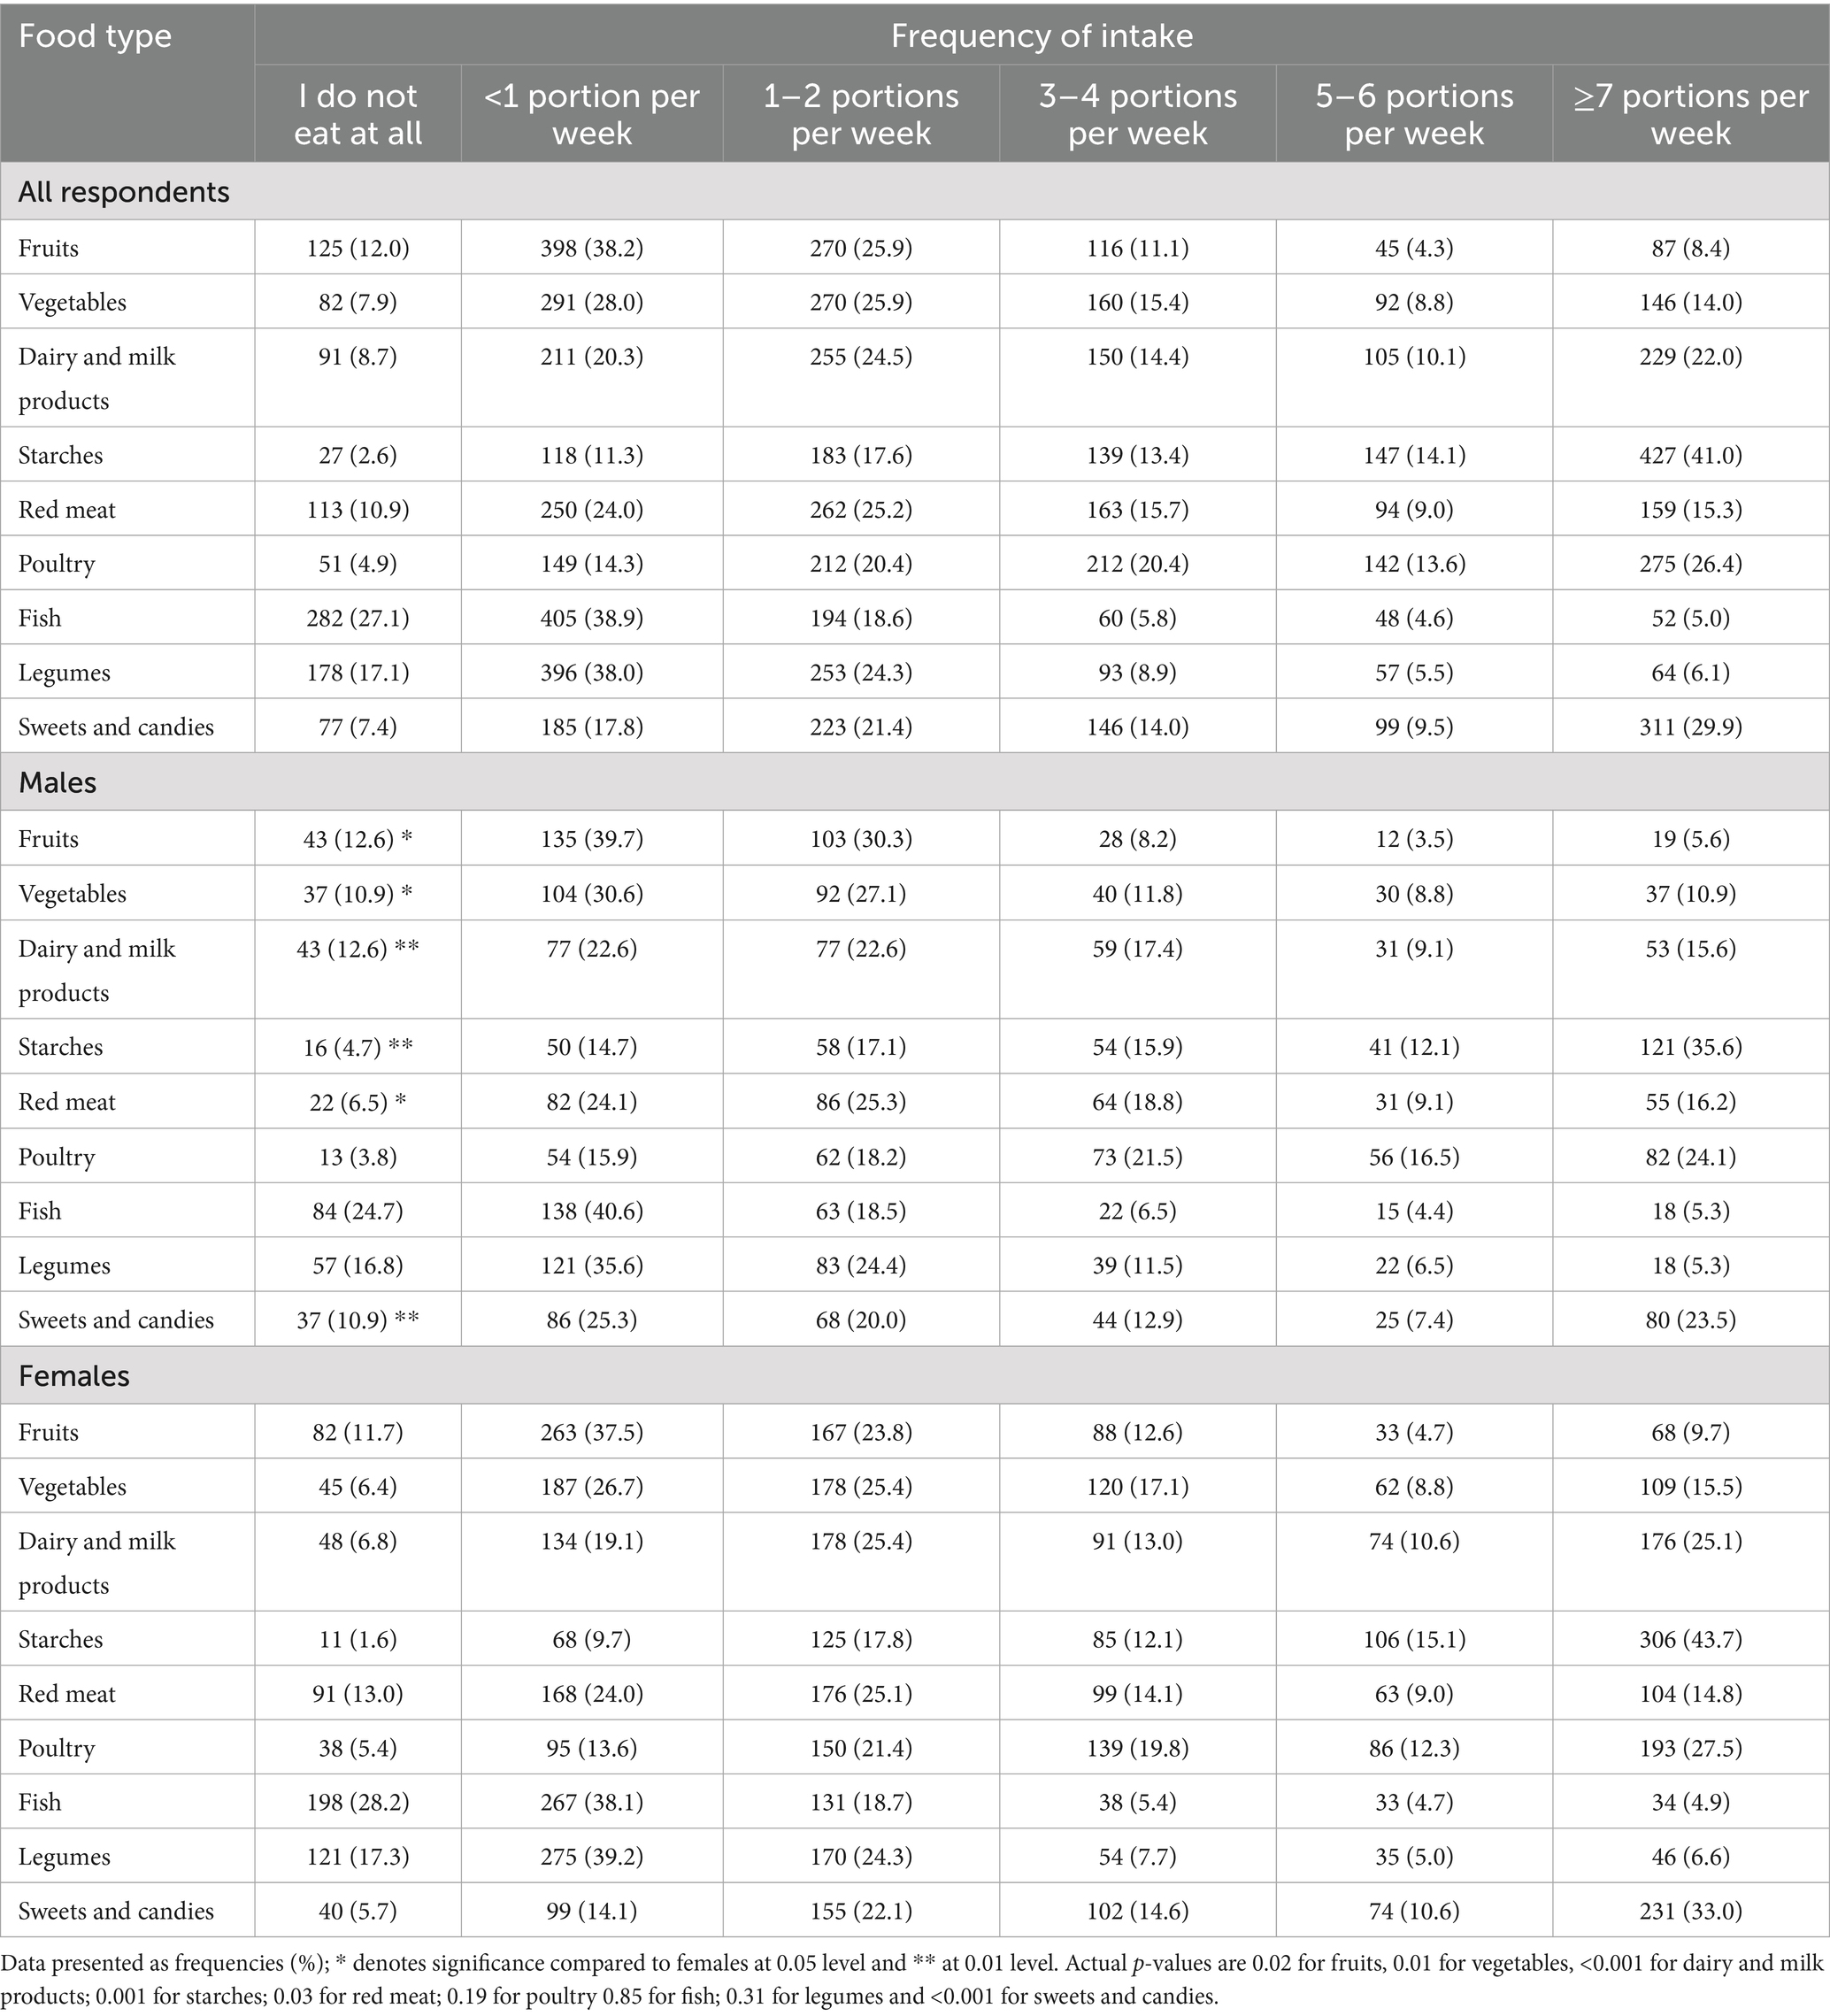
Table 4. Food intake of respondents.
3.5 Associations of PSQI components according to dietary habits
Kendall’s tau-b rank correlations revealed significant associations between dietary intake and PSQI score status among all respondents (Table 5). Specifically, starch intake (r = 0.06; p < 0.05) and sweets and candies (r = 0.08; p < 0.01) were positively associated with higher PSQI scores, indicating poorer sleep. When stratified by gender, these associations remained significant only in males, with red meat also significantly correlated with PSQI scores (r = 0.11; p < 0.05). No significant associations were found in females.
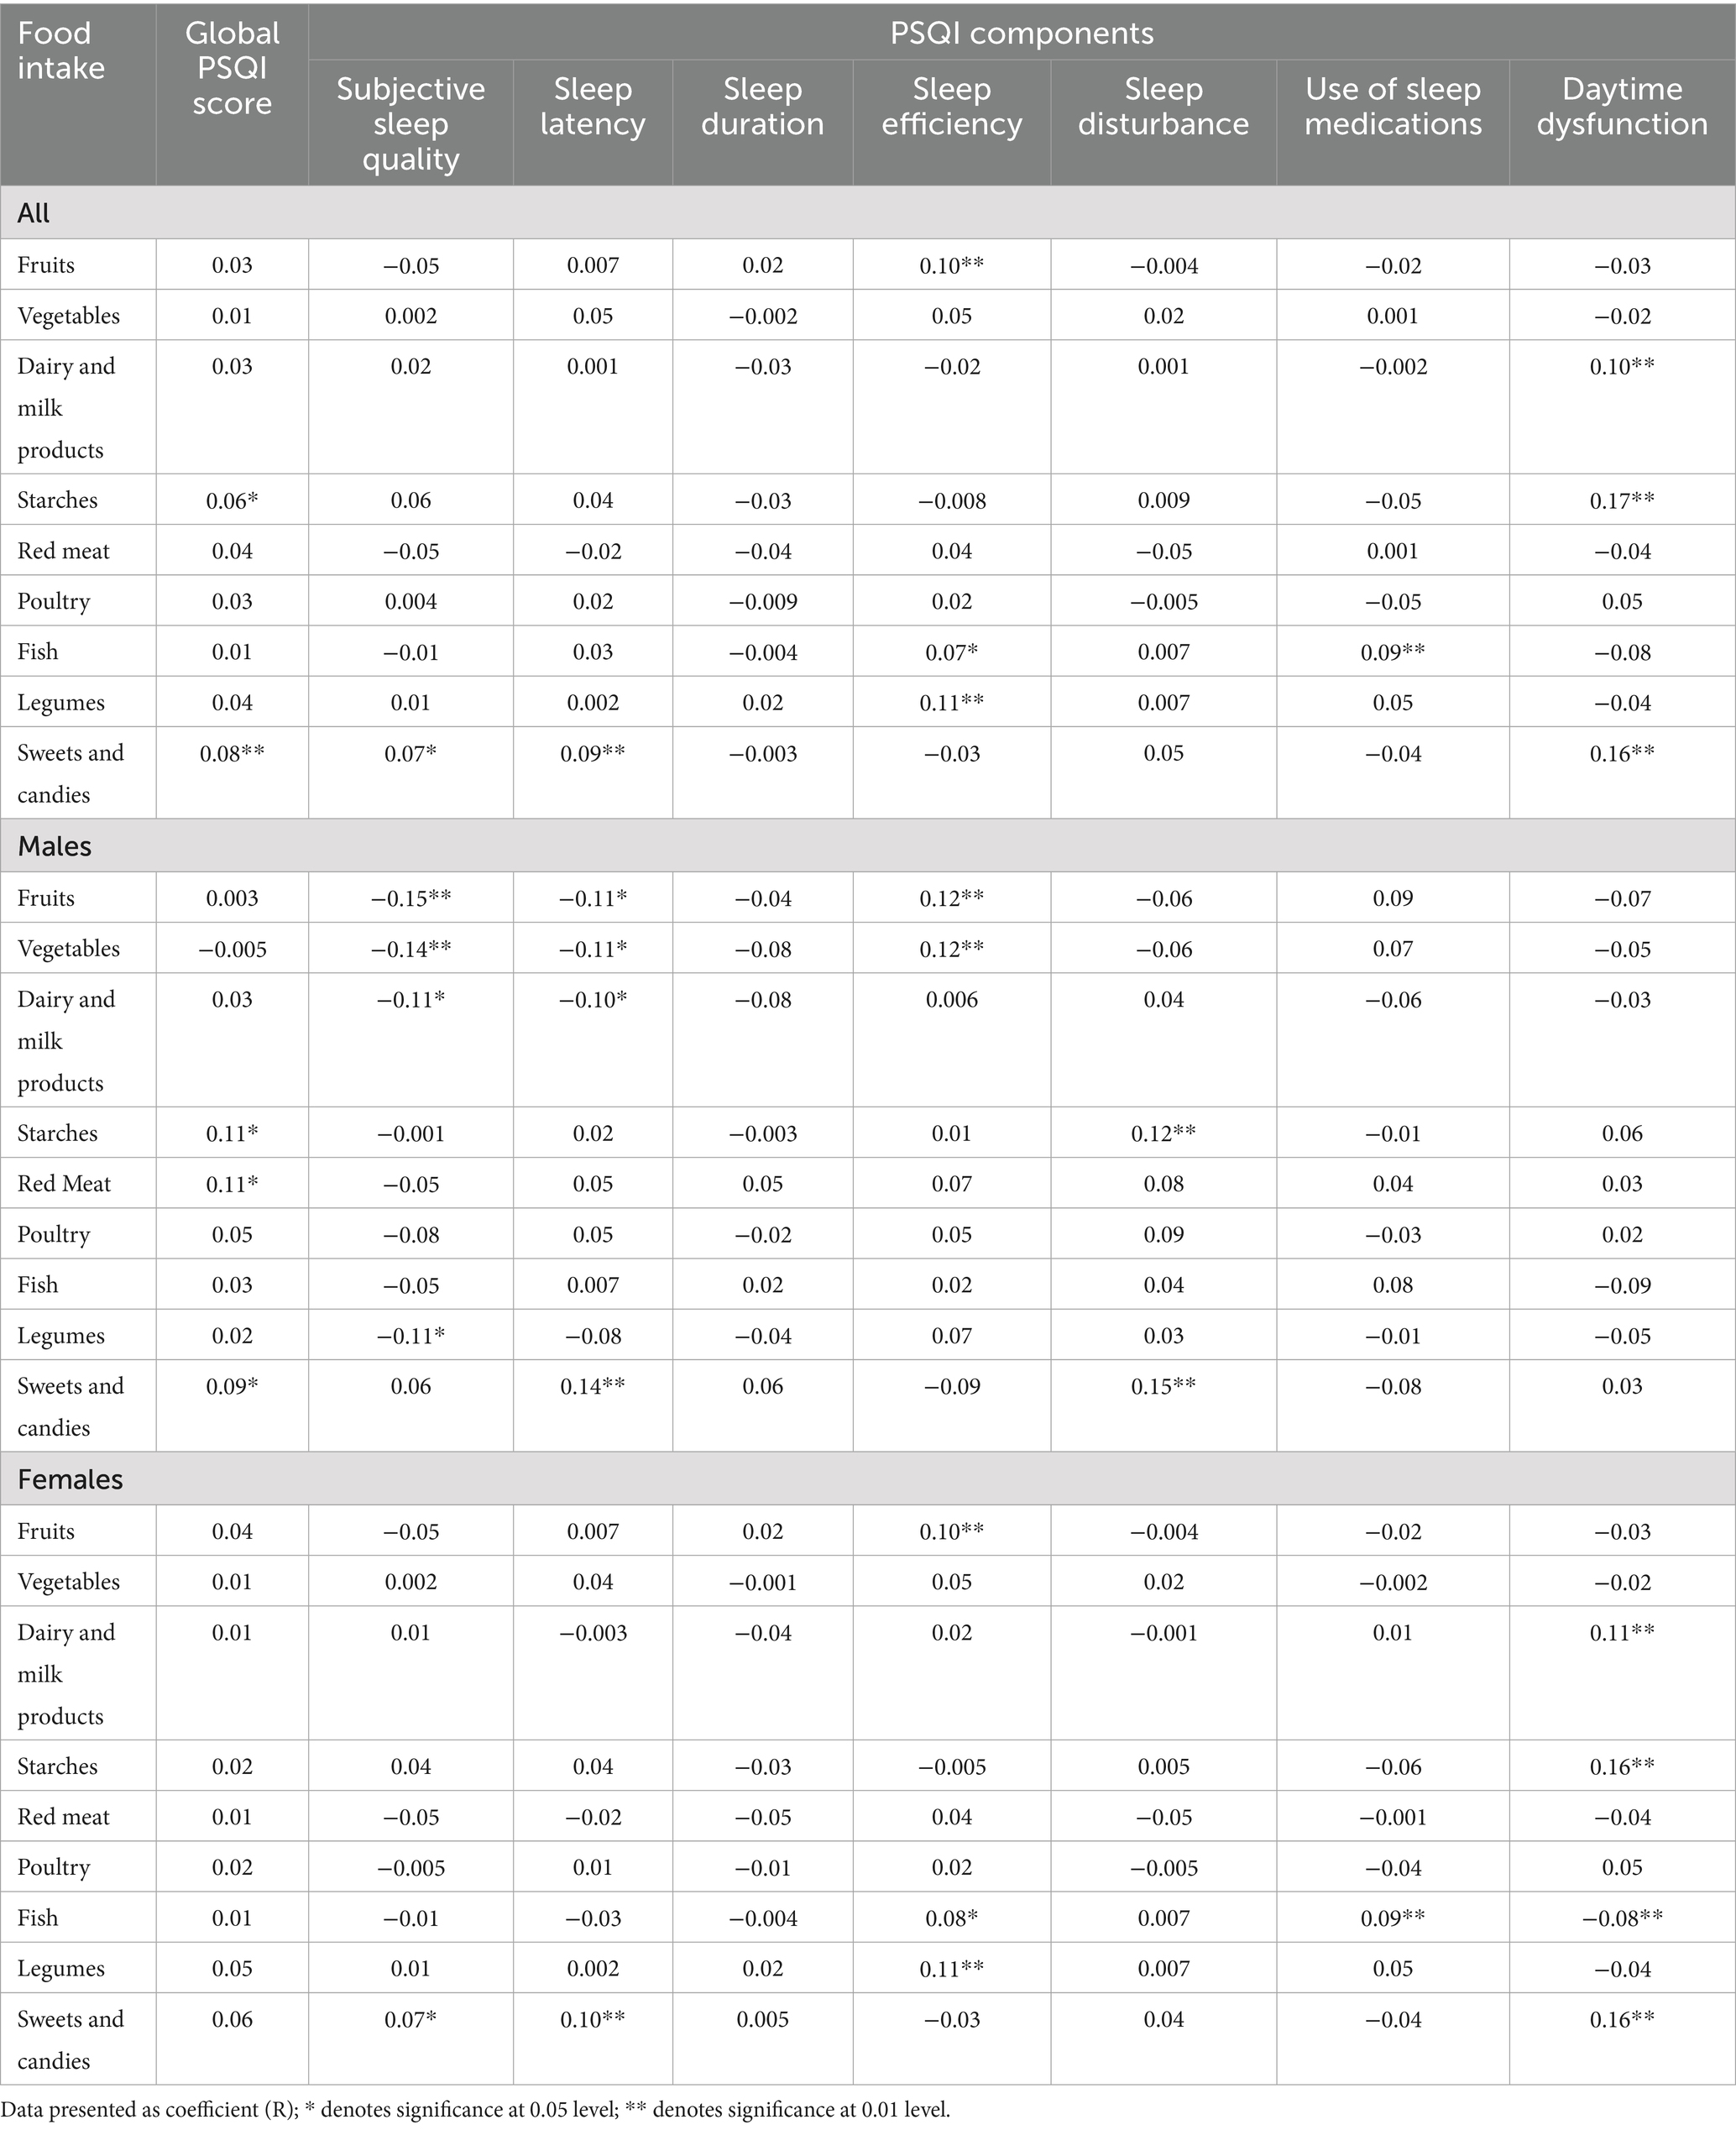
Table 5. Associations of PSQI components according to eating habits.
Analysis using PSQI components (Table 5) showed that, among all participants, fruit intake was significantly associated with sleep efficiency (r = 0.10; p < 0.01), as were dairy products (r = 0.10; p < 0.01), starches (r = 0.17; p < 0.01), sweets and candies (r = 0.16; p < 0.01), and daytime dysfunction. Fish intake was associated with better sleep efficiency (r = 0.07; p < 0.05) and greater use of sleep medications (r = 0.09; p < 0.01), while legumes were significantly associated with sleep efficiency (r = 0.11; p < 0.01). Sweets and candies were the only item linked to subjective sleep quality (r = 0.07; p < 0.05) and sleep latency (r = 0.09; p < 0.01). Vegetables, red meat, and poultry were not associated with any PSQI components.
Table 5 shows gender-specific correlations. In males, higher intake of fruits, vegetables, dairy, and legumes was significantly and inversely associated with subjective sleep quality. Fruits, vegetables, and dairy were also inversely related to sleep latency. Fruit and vegetable intake was significantly associated with better sleep efficiency. Conversely, higher intake of sweets and candies was significantly associated with longer sleep latency, and both sweets and starches were linked to more sleep disturbances (all p-values < 0.05).
In females, Table 5 shows higher intake of sweets and candies was associated with worse subjective sleep quality and sleep latency. Better sleep efficiency was significantly linked to intake of fruits, fish, and legumes. Fish intake was also related to greater use of sleep medications. Daytime dysfunction was associated with higher intake of dairy, starches, and sweets, and inversely with fish intake (all p-values < 0.05).
4 Discussion
This study examined the relationship between dietary patterns and sleep quality among Saudi adults, focusing on food group consumption frequency and its association with various sleep quality components. Gender-specific analyses were also conducted. Notably, 77.4% of participants had PSQI scores above 6, indicating poor sleep, while only 6% reported good sleep quality. This finding raises public health concerns, as poor sleep is linked to chronic conditions like cardiovascular disease and metabolic syndrome. For instance, meta-analyses suggest that both short and long sleep durations may increase obesity, hypertension, and hyperglycemia risks, emphasizing sleep as a critical, modifiable factor in metabolic health (20, 21).
When stratifying data by gender, we found that poor PSQI scores were significantly more prevalent in females than males. Women also scored worse on specific PSQI components, including sleep efficiency, sleep disturbances, and daytime dysfunction. Females were more likely to report lying awake for over 35% of the night and experiencing moderate to severe disruptions and impaired daytime performance due to poor sleep. These findings suggest that women in this population experience poorer overall sleep quality and functioning.
These results align with previous studies reporting gender differences in sleep. A population-based study in Hunan Province, China, found that women had higher PSQI component scores than men, indicating worse sleep quality (22). Another study similarly showed that women reported poorer sleep than men (23). These differences may be partly explained by biological and hormonal factors, such as fluctuations in estrogen and progesterone throughout the menstrual cycle, pregnancy, and menopause. Hormonal shifts can influence sleep quality, sleep latency, and sleep architecture. For example, declining estrogen levels during menopause are associated with sleep disturbances, including insomnia and night sweats. Hormonal fluctuations can also reduce rapid eye movement (REM) sleep and prolong sleep onset time, contributing to reduced overall sleep quality (24).
Beyond biological and hormonal factors, gender differences in stress response and environmental influences may also contribute to disparities in sleep patterns. Interestingly, medication use was low among both sexes, with over 80% not regularly using sleep aids, suggesting that pharmacological interventions are unlikely to explain the poor sleep quality observed.
Our findings also revealed a low intake frequency of health-promoting food groups. A substantial proportion of participants consumed fruits (38.2%), vegetables (28%), fish (38.9%), and legumes (38%) less than once per week. In contrast, the most frequently consumed food types, defined as seven or more servings per week, included starches (41%), poultry (26.4%), and sweets (29.9%). These trends are concerning, as a higher intake of nutrient-rich foods is linked to improved sleep and overall health outcomes (25). The observed dietary pattern suggests preferences that may be shaped by availability, cultural norms, and nutritional awareness.
Gender-based differences in dietary habits were also evident. Males consumed fewer fruits, vegetables, and dairy products than females. This is consistent with previous research showing that men tend to consume more total calories but favor energy-dense foods while eating fewer fruits and vegetables, reflecting differing eating styles and health behaviors (26, 27).
In this study, females reported more frequent consumption of starches, poultry, and sweets compared to males, a pattern that may reflect social and cultural influences on dietary habits. Previous studies suggest women are more likely to choose foods perceived as healthy and often take a leading role in household food choices (28). Their higher intake of fruits and vegetables and lower fat consumption has been linked to motivations around health and weight control, whereas men tend to prefer meat and energy-dense foods (26, 27). These gender-specific dietary behaviors influence nutritional status and health outcomes, with men’s higher intake of calorie-dense, nutrient-poor foods potentially contributing to elevated obesity and disease risk (26).
Diet plays a role in multiple sleep parameters. In this study, fruit intake was significantly associated with improved sleep efficiency. This aligns with research showing that fruits rich in antioxidants and melatonin precursors, such as tryptophan and serotonin, can enhance sleep quality (10). Kiwi fruit, for example, improves sleep duration and efficiency due to its serotonin content (29). Additionally, fish intake was associated with better sleep efficiency and greater sleep medication use, likely due to omega-3 and vitamin D’s role in melatonin regulation (30). Legumes, rich in magnesium and fiber, were also positively associated with sleep efficiency (31).
Milk and other dairy products, along with starches, sweets, and candies, were significantly associated with increased daytime dysfunction. High intake of sugars and starches can lead to postprandial blood sugar crashes, contributing to daytime fatigue and reduced cognitive performance (32). Dairy products contain tryptophan, which may improve sleep when consumed moderately, but their effect could be diminished or even negative when combined with high-calorie or sugary foods. Sweets and candies were uniquely linked to subjective sleep quality and sleep latency (33). Excessive sugar consumption may disrupt sleep onset and quality by causing blood sugar fluctuations and promoting inflammation, both detrimental to sleep (34).
Interestingly, intake of vegetables, red meat, and poultry showed no significant associations with any PSQI components. Although vegetables are generally health-promoting, their specific impact on sleep may vary based on type (e.g., leafy greens vs. starchy vegetables) and preparation methods (35). Similarly, the lack of associations for red meat and poultry may reflect complex dietary-metabolic interactions (36). Nonetheless, recent studies have reported significant links between vegetable intake and sleep duration (37), as well as red meat consumption and sleep quality (38, 39).
The relationship between dietary patterns and sleep quality varied notably between males and females, emphasizing the importance of sex-specific dietary influences on sleep. Across all respondents, higher PSQI scores (indicating poorer sleep quality) were significantly associated with the intake of starches, sweets, and candies. These findings align with previous research suggesting that diets high in refined carbohydrates and sugars disrupt sleep due to fluctuations in blood glucose and hormonal imbalances (10). However, gender stratification revealed notable differences, highlighting the complex interplay between diet, biological sex, and sleep.
In males, starch, sweets, candies, and red meat intake were significantly associated with PSQI scores. These results align with studies linking red meat consumption to poorer sleep quality, possibly due to saturated fat and energy density, which may affect sleep architecture. Intake of fruits, vegetables, dairy products, and legumes showed an inverse relationship with subjective sleep quality, with higher consumption linked to better sleep and shorter sleep latency. This likely reflects the vitamins, antioxidants, and tryptophan content that support serotonin and melatonin synthesis (40, 41). Fruits and vegetables were also associated with improved sleep efficiency. Conversely, sweets and candies correlated with increased sleep latency, delaying sleep onset. Additionally, starches and sweets were linked to sleep disturbances, supporting evidence that high-glycemic foods may cause nighttime awakenings (42).
In females, the consumption of sweets and candies significantly were associated with both subjective sleep quality and sleep latency. This suggests that higher intake of these foods worsens sleep parameters, consistent with evidence that high sugar consumption disrupts sleep continuity and increases nighttime arousal (43). Daytime dysfunction was significantly associated with higher intake of dairy products (44), starches (45), and sweets, whereas fish consumption showed an inverse association (17). Fish, rich in omega-3 fatty acids, is linked to improved sleep regulation due to its effects on melatonin secretion (46, 47).
These findings highlight the crucial role of dietary habits in sleep quality among Saudi adults and emphasize the need for targeted interventions. Public health programs should prioritize gender-specific strategies: encouraging men to increase consumption of fruits, vegetables, and legumes while reducing starches and sweets, and advising women to limit sweets and increase fish intake to enhance sleep efficiency. Clinicians should integrate dietary assessments into sleep evaluations, providing personalized recommendations based on nutritional patterns. Such dietary adjustments can be part of broader approaches to managing sleep disorders and improving overall health. Policymakers can support these initiatives through clearer food labeling and subsidies for nutrient-rich foods, such as fish and legumes, aligning with broader health goals under Saudi Vision 2030.
This study has limitations. First, reliance on self-administered online questionnaires introduces potential reporting bias. Participants might misreport dietary habits, sleep quality, weight, or height due to social desirability, recall errors, or misunderstanding questions. Although the PSQI is validated, some items require bedmate or roommate responses, which may not have been feasible for all. Portion size estimates in the nutrition questionnaire may not accurately reflect actual intake, as participants’ perceptions vary despite examples.
Another limitation is that no statistical correction was applied for multiple comparisons. Given the exploratory nature of this study, we aimed to identify potential associations; however, this increases the risk of type I error, and findings should be interpreted with caution. In addition, as this was a cross-sectional study, the observed associations cannot establish causality, and longitudinal or interventional studies are needed to confirm these relationships. An important limitation of this study is that potential confounding variables, including physical activity levels and psychological health, were not measured. Although we statistically adjusted for age, sex, BMI, and smoking, residual confounding may persist due to these unaccounted factors. For example, stress or sedentary behavior could independently influence both dietary habits and sleep quality. Future studies should incorporate these variables to strengthen causal inference.
Although our regionally stratified sampling enhanced geographic diversity, the social media-based convenience approach limits generalizability, particularly for rural populations and older adults with limited digital access.
In addition, emerging evidence suggests BMI and vitamin D status may mediate the diet-sleep relationship, particularly in Saudi Arabia, where vitamin D deficiency and obesity rates are high. These factors could interact with diet to affect sleep via metabolic, hormonal, and circadian pathways. Future studies should explore these mechanisms. Recent work by Gong et al. supports the importance of considering such pathways to advance innovation in this field (48). These limitations call for cautious interpretation and suggest areas for future research.
However, the study has several strengths, including a large sample size of 1,041 participants, which improves the reliability and generalizability of the findings. The use of validated tools, such as the PSQI and a nutrition behavior questionnaire, adds credibility since these are established methods for assessing sleep quality and dietary habits. The detailed sociodemographic data allows for an in-depth evaluation of various influencing factors. Additionally, the gender-specific analysis offers insights into how dietary impacts on sleep quality differ between males and females, enabling tailored recommendations.
5 Conclusion
This study highlights a significant link between dietary patterns and sleep quality in adults, with clear gender differences. It emphasizes the potential of targeted dietary interventions to improve sleep, especially for higher-risk groups like females. However, some food groups, such as vegetables, red meat, and poultry, showed no significant impact, indicating that not all foods affect sleep equally. Men and women respond differently to the same foods, demonstrating gender-specific effects of diet on sleep. These findings underscore the complex relationship between nutrition and sleep and call for further research to guide evidence-based dietary recommendations for better sleep and health.
Data availability statement
The original contributions presented in the study are included in the article/supplementary material, further inquiries can be directed to the corresponding author.
Ethics statement
This cross-sectional study was approved by the Institutional Review Board (IRB) of King Saud University Medical City, Riyadh, Saudi Arabia (Reference no. E-22-6778). Written informed consent from the patients/participants or patients/participants legal guardian/next of kin was not required to participate in this study in accordance with the national legislation and the institutional requirements.
Author contributions
NA: Conceptualization, Formal analysis, Funding acquisition, Investigation, Methodology, Project administration, Resources, Supervision, Validation, Visualization, Writing – original draft, Writing – review & editing. AA: Formal analysis, Investigation, Methodology, Visualization, Writing – original draft, Writing – review & editing.
Funding
The author(s) declare that financial support was received for the research and/or publication of this article. The authors would like to thank Ongoing Research Funding Program, (ORFFT-2025-089-1),King Saud University, Riyadh, Saudi Arabia for financial support.
Conflict of interest
The authors declare that the research was conducted in the absence of any commercial or financial relationships that could be construed as a potential conflict of interest.
Generative AI statement
The authors declare that no Gen AI was used in the creation of this manuscript.
Any alternative text (alt text) provided alongside figures in this article has been generated by Frontiers with the support of artificial intelligence and reasonable efforts have been made to ensure accuracy, including review by the authors wherever possible. If you identify any issues, please contact us.
Publisher’s note
All claims expressed in this article are solely those of the authors and do not necessarily represent those of their affiliated organizations, or those of the publisher, the editors and the reviewers. Any product that may be evaluated in this article, or claim that may be made by its manufacturer, is not guaranteed or endorsed by the publisher.
References
1. Hirshkowitz, M. Normal human sleep: an overview. Med Clin North Am. (2004) 88:551–65. doi: 10.1016/j.mcna.2004.01.001
2. Carskadon, MA, and Dement, WC. Nocturnal determinants of daytime sleepiness. Sleep. (1982) 5:S73–81. doi: 10.1093/sleep/5.S2.S73
3. Youngstedt, SD, Goff, EE, Reynolds, AM, Kripke, DF, Irwin, MR, Bootzin, RR, et al. Has adult sleep duration declined over the last 50+ years? Sleep Med Rev. (2016) 28:69–85. doi: 10.1016/j.smrv.2015.08.004
4. Lim, J, and Dinges, DF. A meta-analysis of the impact of short-term sleep deprivation on cognitive variables. Psychol Bull. (2010) 136:375–89. doi: 10.1037/a0018883
5. DuBose, JR, and Hadi, K. Improving inpatient environments to support patient sleep. Int J Qual Health Care. (2016) 28:540–53. doi: 10.1093/intqhc/mzw079
6. Buysse, DJ, Reynolds, CF, Monk, TH, Berman, SR, and Kupfer, DJ. The Pittsburgh Sleep Quality Index: a new instrument for psychiatric practice and research. Psychiatry Res. (1989), 28:193–213. doi: 10.1016/0165-1781(89)90047-4
7. Chasens, ER, Imes, CC, Kariuki, JK, Luyster, FS, Morris, JL, DiNardo, MM, et al. Sleep and metabolic syndrome. Nurs Clin North Am. (2021) 56:203–17. doi: 10.1016/j.cnur.2020.10.012
8. Chattu, VK, Chattu, SK, Burman, D, Spence, DW, and Pandi-Perumal, SR. The interlinked rising epidemic of insufficient sleep and diabetes mellitus. Healthcare. (2019) 7:37. doi: 10.3390/healthcare7010037
9. Cercato, C, and Fonseca, FA. Cardiovascular risk and obesity. Diabetol Metab Syndr. (2019) 11:74. doi: 10.1186/s13098-019-0468-0
10. St-Onge, MP, Mikic, A, and Pietrolungo, CE. Effects of diet on sleep quality. Adv Nutr. (2016) 7:938–49. doi: 10.3945/an.116.012336
11. Iao, SI, Jansen, E, Shedden, K, O’Brien, LM, Chervin, RD, Knutson, KL, et al. Associations between bedtime eating or drinking, sleep duration and wake after sleep onset: findings from the American time use survey. Br J Nutr. (2022) 127:1888–97. doi: 10.1017/S0007114521003597
12. Chaput, JP. Sleep patterns, diet quality and energy balance. Physiol Behav. (2014) 134:86–91. doi: 10.1016/j.physbeh.2013.09.006
13. Wirth, J, Hillesheim, E, and Brennan, L. Protein intake and its effect on sleep outcomes: a systematic review and meta-analysis of randomized controlled trials. Nutr Rev. (2023) 81:333–45. doi: 10.1093/nutrit/nuac061
14. Faris, MAIE, Vitiello, MV, Abdelrahim, DN, Cheikh Ismail, L, Jahrami, HA, Khaleel, S, et al. Eating habits are associated with subjective sleep quality outcomes among university students: findings of a cross-sectional study. Sleep and Breathing. (2021), 26:1365–76. doi: 10.1007/s11325-021-02506-w
15. Çakir, B, Nişancı Kılınç, F, Özata Uyar, G, Özenir, Ç, Ekici, EM, and Karaismailoğlu, E. The relationship between sleep duration, sleep quality and dietary intake in adults. Sleep Biol Rhythms. (2020) 18:49–57. doi: 10.1007/s41105-019-00244-x
16. Shimizu, K, Kuramochi, Y, and Hayamizu, K. Effect of omega-3 fatty acids on sleep: a systematic review and meta-analysis of randomized controlled trials. J Clin Biochem Nutr. (2024) 75:204–12. doi: 10.3164/jcbn.24-36
17. Katagiri, R, Asakura, K, Kobayashi, S, Suga, H, and Sasaki, S. Low intake of vegetables, high intake of confectionary, and unhealthy eating habits are associated with poor sleep quality among middle-aged female Japanese workers. J Occup Health. (2014) 56:359–68. doi: 10.1539/joh.14-0051-oa
18. Verkaar, AJCF, Winkels, RM, Kampman, E, Luik, AI, and Voortman, T. Associations of dietary patterns with objective and subjective sleep duration and sleep quality in a population-based cohort study. Sleep Med. (2024) 119:365–72. doi: 10.1016/j.sleep.2024.05.017
19. Suleiman, KH, Yates, BC, Berger, AM, Pozehl, B, and Meza, J. Translating the Pittsburgh sleep quality index into Arabic. West J Nurs Res. (2010) 32:250–68. doi: 10.1177/0193945909348230
20. Che, T, Yan, C, Tian, D, Zhang, X, Liu, X, and Wu, Z. The association between sleep and metabolic syndrome: a systematic review and meta-analysis. Front Endocrinol. (2021) 12:773646. doi: 10.3389/fendo.2021.773646
21. Nagai, M, Hoshide, S, and Kario, K. Sleep duration as a risk factor for cardiovascular disease- a review of the recent literature. Curr Cardiol Rev. (2010) 6:54–61. doi: 10.2174/157340310790231635
22. Tang, J, Liao, Y, Kelly, BC, Xie, L, Xiang, YT, Qi, C, et al. Gender and regional differences in sleep quality and insomnia: a general population-based study in Hunan Province of China. Sci Rep. (2017) 7:43690. doi: 10.1038/srep43690
23. Li, L, Sheehan, CM, and Thompson, MS. Measurement invariance and sleep quality differences between men and women in the Pittsburgh sleep quality index. J Clin Sleep Med. (2019) 15:1769–76. doi: 10.5664/jcsm.8082
24. Dorsey, A, de Lecea, L, and Jennings, KJ. Neurobiological and hormonal mechanisms regulating women’s sleep. Front Neurosci. (2021) 14:14. doi: 10.3389/fnins.2020.625397
25. Jansen, EC, Stern, D, Monge, A, O’Brien, LM, Lajous, M, Peterson, KE, et al. Healthier dietary patterns are associated with better sleep quality among midlife Mexican women. J Clin Sleep Med. (2020) 16:1321–30. doi: 10.5664/jcsm.8506
26. Nasreddine, L, Chamieh, MC, Ayoub, J, Hwalla, N, Sibai, AM, and Naja, F. Sex disparities in dietary intake across the lifespan: the case of Lebanon. Nutr J. (2020) 19:24. doi: 10.1186/s12937-020-00543-x
27. Westenhoefer, J. Age and gender dependent profile of food choice. (2005). 44–51. doi: 10.1159/000083753
28. Alkazemi, D. Gender differences in weight status, dietary habits, and health attitudes among college students in Kuwait: a cross-sectional study. Nutr Health. (2019) 25:75–84. doi: 10.1177/0260106018817410
29. Lin, HH, Fang, SC, Tsai, PS, and Liu, JF. Effect of kiwifruit consumption on sleep quality in adults with sleep problems. Asia Pac J Clin Nutr. (2011) 20:169–74.
30. Kautz, A, Meng, Y, Yeh, KL, Peck, R, Brunner, J, Best, M, et al. Dietary intake of nutrients involved in serotonin and melatonin synthesis and prenatal maternal sleep quality and affective symptoms. J Nutr Metab. (2024) 2024:6611169. doi: 10.1155/2024/6611169
31. Arslan, N, Bozkır, E, Koçak, T, Akin, M, and Yilmaz, B. From garden to pillow: understanding the relationship between plant-based nutrition and quality of sleep. Nutrients. (2024) 16:2683. doi: 10.3390/nu16162683
32. Xi, Y, Lin, Q, Yang, Q, Li, F, Liu, H, Luo, J, et al. Association between free sugars intake and excessive daytime sleepiness among Chinese adolescents. Nutrients. (2021) 13:3959. doi: 10.3390/nu13113959
33. Jayarajah, K, Radhakrishnan, M, Hoi, S, and Misra, A. Candy crushing your sleep. In: Proceedings of the 2015 ACM International Joint Conference on Pervasive and Ubiquitous Computing and Proceedings of the 2015 ACM International Symposium on Wearable Computers – UbiComp ‘15. New York, New York, USA: ACM Press; (2015). 753–762.
34. Maddahi, NS, Yarizadeh, H, Setayesh, L, Nasir, Y, Alizadeh, S, and Mirzaei, K. Association between dietary energy density with mental health and sleep quality in women with overweight/obesity. BMC Res Notes. (2020) 13:189. doi: 10.1186/s13104-020-05025-1
35. Noorwali, E, Hardie, L, and Cade, J. Bridging the reciprocal gap between sleep and fruit and vegetable consumption: a review of the evidence, potential mechanisms, implications, and directions for future work. Nutrients. (2019) 11:1382. doi: 10.3390/nu11061382
36. Rostami, H, Parastouei, K, Samadi, M, Taghdir, M, and Eskandari, E. Adherence to the MIND dietary pattern and sleep quality, sleep related outcomes and mental health in male adults: a cross-sectional study. BMC Psychiatry. (2022) 22:167. doi: 10.1186/s12888-022-03816-3
37. Thapa, A, Lahti, T, Maukonen, M, and Partonen, T. Consumption of fruits and vegetables and its association with sleep duration among Finnish adult population: a nationwide cross-sectional study. Front Nutr. (2024) 11:11. doi: 10.3389/fnut.2024.1319821
38. Lana, A, Struijk, EA, Arias-Fernandez, L, Graciani, A, Mesas, AE, Rodriguez-Artalejo, F, et al. Habitual meat consumption and changes in sleep duration and quality in older adults. Aging Dis. (2019) 10:267–77. doi: 10.14336/AD.2018.0503
39. Dayal, S, Huynh, N, and DelRosso, LM. Is consuming red meat associated with obstructive sleep apnea? A systematic review. Sleep Med Rev. (2024) 78:101998. doi: 10.1016/j.smrv.2024.101998
40. Peuhkuri, K, Sihvola, N, and Korpela, R. Diet promotes sleep duration and quality. Nutr Res. (2012) 32:309–19. doi: 10.1016/j.nutres.2012.03.009
41. Ikonte, CJ, Mun, JG, Reider, CA, Grant, RW, and Mitmesser, SH. Micronutrient inadequacy in short sleep: analysis of the NHANES 2005–2016. Nutrients. (2019) 11:2335. doi: 10.3390/nu11102335
42. Afaghi, A, O’Connor, H, and Chow, CM. High-glycemic-index carbohydrate meals shorten sleep onset. Am J Clin Nutr. (2007) 85:426–30.
43. Calcaterra, V, Rossi, V, Tagi, VM, Baldassarre, P, Grazi, R, Taranto, S, et al. Food intake and sleep disorders in children and adolescents with obesity. Nutrients. (2023) 15:4736. doi: 10.3390/nu15224736
44. Komada, Y, Okajima, I, and Kuwata, T. The effects of Milk and dairy products on sleep: a systematic review. Int J Environ Res Public Health. (2020) 17:9440. doi: 10.3390/ijerph17249440
45. Yoneyama, S, Sakurai, M, Nakamura, K, Morikawa, Y, Miura, K, Nakashima, M, et al. Associations between Rice, noodle, and bread intake and sleep quality in Japanese men and women. PLoS One. (2014) 9:e105198. doi: 10.1371/journal.pone.0105198
46. Hansen, AL, Dahl, L, Olson, G, Thornton, D, Graff, IE, Frøyland, L, et al. Fish consumption, sleep, daily functioning, and heart rate variability. J Clin Sleep Med. (2014) 10:567–75. doi: 10.5664/jcsm.3714
47. Dai, Y, and Liu, J. Omega-3 long-chain polyunsaturated fatty acid and sleep: a systematic review and meta-analysis of randomized controlled trials and longitudinal studies. Nutr Rev. (2021) 79:847–68. doi: 10.1093/nutrit/nuaa103
Keywords: sleep quality, dietary habits, PSQI, sleep duration, sleep latency
Citation: Alghamdi NA and Almasaudi AS (2025) Evaluating dietary habits of adults and their relationship with sleep quality in the Kingdom of Saudi Arabia. Front. Nutr. 12:1664739. doi: 10.3389/fnut.2025.1664739
Edited by:
Radwan Qasrawi, Al-Quds University, PalestineReviewed by:
Chaoban Wang, Sichuan University, ChinaLi Li, University of California, San Francisco, United States
Copyright © 2025 Alghamdi and Almasaudi. This is an open-access article distributed under the terms of the Creative Commons Attribution License (CC BY). The use, distribution or reproduction in other forums is permitted, provided the original author(s) and the copyright owner(s) are credited and that the original publication in this journal is cited, in accordance with accepted academic practice. No use, distribution or reproduction is permitted which does not comply with these terms.
*Correspondence: Nouf A. Alghamdi, bmFsZ2FtZGlAa3N1LmVkdS5zYQ==
†ORCID: Nouf A. Alghamdi, orcid.org/0009-0009-8182-1276
Arwa S. Almasaudi, orcid.org/0000-0002-8166-5754