 Srdjan Sokanovic
 Milica Prvulovic
 Valentina Simeunovic
 Smilja Pracer
 Aleksandra Mladenovic
- Laboratory for Molecular Neurobiology and Behavior, Department of Neurobiology, Institute for Biological Research “Sinisa Stankovic”—National Institute of the Republic of Serbia, University of Belgrade, Belgrade, Serbia
Testosterone (T) is a central androgen responsible for the maintenance of vegetative and reproductive functions and sexual behavior in males. T is mainly synthesized through the process of testicular steroidogenesis with cholesterol (CHOL) as the initial precursor. It is known that T levels gradually decrease, along with an increase in CHOL, LDL-C, triglycerides (TG), and a decrease in HDL-C in advanced stages of life. Dietary restriction (DR) ameliorates lipid status and raises T levels in obese and overweight men. Here, we investigated whether the beneficial effects of DR on serum lipid status consequently improve T production at advanced stages; therefore, we exposed male Wistar rats to long-term DR (LTDR, 18 months). We confirmed an age-related decrease in serum T levels, reduced expression of genes and proteins of steroidogenic machinery with a simultaneous increase in serum CHOL, LDL-C, and TG levels. LTDR additionally decreased T synthesis, expression of Star/StAR and Cyp11a1/CYP11A1, and testicular CHOL levels. At the same time, LTDR reduced serum CHOL, LDL-C, and TG levels and increased HDL-C levels. To confirm that the effects of DR are determined by the duration of the treatment, we also checked the effects of the short-term DR (STDR, 3 months) and demonstrated that STDR did not alter T levels and did not affect serum lipids. Our results indicate the importance of sustained systemic lipid homeostasis for T production in advanced life stages and show that the effects of restricted food intake on testicular androgen capacity depend on the duration of DR.
1 Introduction
Testosterone (T) is a pivotal male androgen responsible for maintenance of numerous physiological functions including spermatogenesis, secondary sexual characteristics (1) as well as sexual behavior (2). T is primarily synthesized and produced by testes Leydig cells (LCs) through the complex process of steroidogenesis, which involves enzymatic transformation of cholesterol (CHOL) to T. Steroidogenic cells take up CHOL from circulating high- and low-density lipoproteins (HDL-C, LDL-C) (3), or synthesize it de novo (4). In rat Leydig cells, the inner leaflet of the plasma membrane also represents a source of CHOL for steroidogenesis (5). The dominant source of CHOL may be species specific, but it is widely accepted that HDL-C represents the main extracellular source of CHOL for steroidogenesis in rodents. The process is mediated by membrane scavenger receptor B1 (SR-B1, SCARB1) (6). In the cells, lysosomal acid lipase (LAL), hormone-sensitive neutral lipase (HSL), together with Niemann–Pick disease type C1 and 2 (NPC1/2) proteins, account for the formation of free CHOL, making it available for steroidogenesis or (re)esterification by acyl-coenzyme A-cholesterol acyltransferase activity (ACAT/SOAT1) (7). During the initial steps of steroidogenesis, a complex protein machinery and its key component, steroidogenic acute regulatory protein (StAR) facilitates import of free CHOL into mitochondria (8, 9) where cytochrome P450 side chain cleavage enzyme (P450scc, CYP11A1) catalyzes formation of pregnenolone. Subsequent reactions occur in the endoplasmic reticulum, where 3 beta-hydroxysteroid dehydrogenase (HSD3B) converts pregnenolone to progesterone, and cytochrome P450 family 17 subfamily A member 1 (CYP17A1) transforms progesterone into androstenedione. In the final reaction, 17 beta-hydroxysteroid dehydrogenase (HSD17B) transforms androstenedione to T. The described pathway, known as the Δ4 steroidogenic pathway, is dominant in rodents (10). Testicular steroidogenesis is primarily regulated by the hypothalamic-pituitary-testicular loop and luteinizing hormone-cyclic adenosine monophosphate (LH-cAMP) signaling pathway. In this cascade, hypothalamic gonadotropin-releasing hormone (GnRH) stimulates pituitary gonadotrophs to synthesize and release luteinizing hormone (LH) (11), which activates LH receptors (LHR) expressed on the surface of LCs. Activation of the receptors promotes a rise in cAMP, which initiates steroidogenesis (12) and inhibits SOAT1 activity, making CHOL available for T synthesis (6). Increased circulation levels of T inhibit the loop activity and suppress its production.
Aging is a complex process associated with failure in multiple organ systems (13), including changes in T levels and CHOL homeostasis, and a gradual decline in T levels in both humans (14) and rats (15, 16) has been demonstrated. Plenty of data indicate that age-induced impairment in T production is a consequence of impaired functionality of LCs (17) rather than alteration in LCs numbers (18). Mechanisms responsible for the reduced functionality of aged LCs are far from elucidated, but it is known that aged LCs do not respond properly to LH (17, 19), show decreased expression and activity of steroidogenic enzymes (17), and weak expression of Insulin-like 3 peptide, its functionality marker (INSL3) (15). Regarding age-induced alterations in lipid homeostasis, increased levels of total CHOL, LDL-C, and decreased HDL-C have been documented in humans (20). Elevated levels of triglyceride (TG) and CHOL (21, 22) with reduced clearance of LDL-C (23) have been documented in rats. Advanced age is also accompanied by a frequent appearance of dyslipidemia, a condition characterized by increased levels of plasma TG and LDL-C with decreased levels of HDL-C, which represents major factors for the development of coronary artery disease (CAD) and cardiovascular diseases (CVD) (20).
Low T levels are associated with both sexual and non-sexual symptoms, which profoundly impact the quality of men’s lives. Non-sexual symptoms associated with low T concentrations include the appearance of obesity, type 2 diabetes mellitus, metabolic syndrome, etc. (24). In the context of low T levels and disrupted lipid homeostasis, there is a documented association between sub-physiological levels of T and atherogenic lipid formation, which promotes pathogenesis of atherosclerosis and CAD (25, 26). Parameter that is highly correlated with low T levels and CAD/CVD appearance is a high TG to HDL-C (TG/HDL-C) ratio. A high TG/HLD-C ratio has been proposed as a suitable parameter for CAD/CVD prediction (27), and it is also shown that TG/HLD-C ratio is inversely correlated with testosterone levels in the case of insulin resistance (28).
Dietary restriction (DR) is the most effective non-pharmacological intervention that enhances longevity and health span in numerous nonhuman species and generally refers to the reduction of calories without malnutrition (29). Numerous animal and clinical studies suggest that DR positively affects age-related neurodegenerative diseases (29), animal activity and spatial memory (30), metabolic disorders (31, 32), decreased systolic and diastolic blood pressure, and has a protective effect against atherosclerosis through decrement of total CHOL, LDL-C, TG and increment of HDL-C (33). DR showed dual effects on T production with beneficial effects in obese and overweight men, and negative effects in non-obese men (24) and rats (34–36). To examine the way DR impacts testicular steroidogenesis in advanced periods of life, we exposed male Wistar rats to 18- and 3-month-long DR. The effects of the treatments were assessed based on the T levels in circulation and testicular content, with concomitant lipid status profile. Molecular mechanisms were evaluated based on the expression of the genes and proteins involved in T synthesis as well as CHOL metabolism.
2 Materials and methods
2.1 Animals and treatments
Male Wistar rats were used in this study (n > 30, 5–10 animals per group). All animal handling procedures complied with the EU Directive 2010/63/EU for animal experiments and were approved by the Ethical Committee for the Use of Laboratory Animals of the Institute for Biological Research “Sinisa Stankovic”—The National Institute of the Republic of Serbia, University of Belgrade, and by The National Ethic Research Committee (No. 323-07-13, No. 536/2020-05, No. 05-06/14). Animals were housed in a 12-h light/dark cycle with constant temperature (21 ± 2 °C) and humidity (60–70%). Animals were fed with standard laboratory chow (chemical composition presented in the Table 1, manufacturer VZS Stocna hrana d.o.o, Subotica, Serbia) with free access to water. DR treatment used in this study represents a reduction of daily food intake by 40% based on average daily food consumption. This study included two DR regimes: long-term DR (LTDR), started at 6 months and lasted up to the 24th month of life (n = 10), and short-term DR (STDR), started at 21 months and lasted up to the 24th month of life (n = 10); the experiments were repeated two times. Intact 24-month-old males (aged, n = 10) with no limited access to food were used as controls for LTDR and STDR, the study also included intact 6-month-old males (adults, n = 5). Animals were regularly weighed and monitored for well-being during the entire study period. At the end of the treatments, animals were euthanized in deep anesthesia using Zoletil 100 (75 mg/kg), blood was collected from the heart, and transcardial perfusion with cold saline was performed, and tissues were collected and stored at −80 °C. The serum was prepared by centrifuging coagulated blood (300 × g/15 min/4 °C) and stored at −20 °C until analyzing.
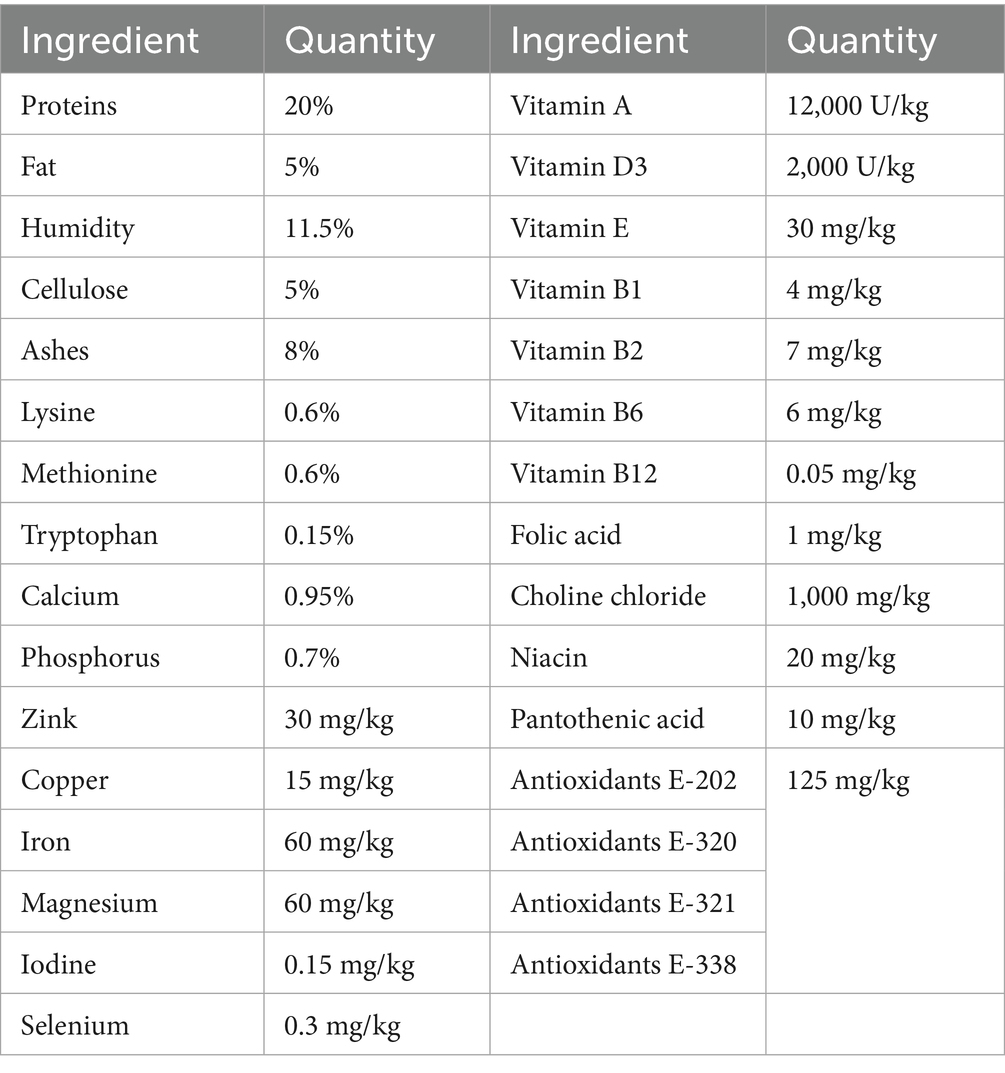
Table 1. Chemical composition of standard laboratory chow.
2.2 Serum lipid measurements
To assess serum lipid status, concentrations of CHOL, HDL-C, LDL-C, and TG were measured. All the reagents and standards were obtained from the same manufacturer (BioSystems S.A. Costa Brava, Barcelona, Spain), and measurements were performed according to the manufacturer’s instructions1 using a clinical chemistry analyzer BS-240 (Mindray, Shenzhen, China). Detection limits were: 0.008 mmoL/L for CHOL, 0.01 mmoL/L for HDL-C, 0.007 mmoL/L for LDL-C, 0.018 mmoL/L for TG; for all the parameters, intra/inter run variations were <5%.
2.3 Hormone assays and steroid extraction
Serum hormone levels were determined with appropriate ELISA kits according to the manufacturer’s instructions. For corticosterone measurement, we used Enzo corticosterone ELISA kit (ADI-900-097, Enzo Life Science, Farmingtone, NY, United States), and for T measurement, we used Cayman Testosterone ELISA kit (No. 582701, Cayman Chemical, Ann Arbor, MI, United States). To determine T levels in testes, pieces of testes were homogenized with 1 × PBS (137 mM NaCl, 2.7 mM KCl, 10 mM Na2HPO4, 1.8 mM KH2PO4, v/w = 10 μL/mg) and an equal volume of homogenate was used for steroid extraction by diethyl ether. After evaporation of diethyl ether, the dry pellet was resuspended with ELISA buffer, and T levels were determined by the same ELISA kit (15). All the relevant comparisons were made in the same assay; intra-assay variation for corticosterone was <10% and for T was <15%; minimal detectable hormone concentrations were 32 pg/mL and 3.9 pg/mL, respectively. To determine levels of testicular CHOL, the same procedure of extraction was applied, the dry pellet was resuspended in 1 × PBS enriched with bovine serum albumin fraction V (1 × PBS-0.1%-BSA), and CHOL levels were determined according to Biosystems protocol (see text footnote 1) and BS-240 analyzer (Mindray, Shenzhen, China).
2.4 RNA isolation and qRT-PCR analysis
Total RNA was isolated from pieces of testes, liver, and whole pituitary by Trizol reagent (300 μL/sample, Ambion, Austin, TX) with the addition of chloroform (60 μL/sample). After shaking and centrifugation (12,000 × g/15 min/4 °C) supernatant was collected, RNA was extracted by isopropyl alcohol (250 μL/sample) and centrifugation (12,000 × g/10 min/4 °C). Collected RNA was washed twice with 75% ethanol, resuspended in RNase-free water, and DNase I treatment was performed according to Invitrogen manufacturer’s protocol.2 The amount and purity of the total RNA were assessed by spectrophotometric measurement (Nanophotometer N60, Implen, Munchen, Germany), and 1 mg of RNA was used for cDNA synthesis. First-strand cDNA was synthesized by High-Capacity cDNA reverse transcription kit3 according to the manufacturer’s instructions. qPCR was performed by Taq-Man Gene- or SYBR Green-based technology (Applied Biotechnology, Waltham, Massachusetts, United States) in the presence of 10 ng cDNA using Quant Studio 3 (Applied Biotechnology). Target gene expression levels were determined by the comparative 2−ΔΔCT quantification method with Gapdh as the reference gene. Used Applied Biosystems predesigned TaqMan Gene Expression Assays: Abca1 (Rn00710172_m1), Apob (01499054_m1), Cyp46a1 (Rn01430187_g1), Gapdh (Rn01462662_g1), Hmgc (Rn 00565598_m1), Lrp1 (Rn01503901), Ldlr (Rn00598442_m1), Npc1 (Rn01531821_m1), Soat1 (Rn_00579605_m1), Srebf1 (Rn01495769_m1); sequences of used forward and reverse primers are listed in Supplementary Table 1.
2.5 Protein isolation and western blot method
Proteins were isolated from the pieces of testes and whole pituitary tissues using Ripa buffer (50 mM Tris-HCl, 150 mM NaCl, 1% NP-40, 0.1% SDS, 10 mM EDTA, 10 mM EGTA, 0.5% Triton X-100; V/W = 10 μL/mg) enriched with protease and phosphatase inhibitor cocktails (Roche, GmbH, Germany). After homogenization, the samples were centrifuged (15,000 × g/30 min/4 °C), supernatants were collected, and protein concentration measurement and uniformization of the samples were done by Pierce BSA Protein Assay Kit (ThermoFisher Scientific, Waltham, MA, United States). An equal amount of protein (50 μg/well) was loaded onto 10–15% SDS-polyacrylamide gels and separated by SDS-PAGE electrophoresis (Bio-Rad, Hercules, CA, United States). Transfer of proteins onto nitrocellulose (0.45 μm, Amersham, MA, United States) or PVDF (0.2 μm, Invitrogen, Waltham, MA, United States) membrane was done by wet transfer (30 V/4 °C, overnight) using Bio-Rad system. Membranes were stained with 0.1% Ponceau S (Serva Electrophoresis GmbH, Germany) or Pierce Reversible Protein Stain Kit for nitrocellulose membrane (ThermoFisher Scientific), scanned, and used as the loading control. Destaining was done by 0.1% Tween-TBS (0.05 M Tris, 0.15 M NaCl, 0.1% Twen; TBST) following membrane blocking with 5% non-fat dry milk (Bio-Rad) in TBST for 2 h at room temperature (RT). Membranes were incubated with primary antibodies overnight at 4 °C, multiple washed with TBST, and incubated with horseradish peroxidase conjugated secondary anti-rabbit antibody for 1 h/RT. After sufficient washing, chemiluminescent signal was induced by Luminol-H2O2 solution, and immunoblots were visualized using iBright 1500 system (Invitrogen). Quantification of the specific immunoblots, as well as loading control, was performed by Image quant software (version 5.2, GE Healthcare). Used antibodies with dilutions: anti-CYP11A1 antibody (13363-1-AP, Proteintech, Rosemont, IL, United States) 1:1000; anti-LhB antibody (PA5-102674, ThermoFisher Scientific) 1:1,000; anti-StAR antibody (D0H12, Cell Signaling Technology Inc., MA, United States) 1:500; Goat anti-Rabbit antibody (ab205718, Cambridge, United Kingdom) 1:10,000.
2.6 Statistical analysis
Results represent group mean ± SEM values of at least 5 animals per group. Multiple comparison groups were analyzed by one-way ANOVA followed by Tukey’s multiple comparison test; comparison between two groups was analyzed by Student’s t-test or unpaired Mann–Whitney nonparametric two-tailed tests; p < 0.05 was considered statistically significant. GraphPad Prism software (version 6, Dotmatics, MA, United States) was used for mean ± SEM values calculations, statistical analysis, and figure generation.
3 Results
3.1 LTDR changes BW, lipid status, and T levels in aged male Wistar rats
As BW, T levels, and lipid homeostasis are tightly connected, we first checked how aging and LTDR affect these parameters. Comparing 6-month-old (adult) and aged males, we observed that aging is accompanied with significant BW gain (adults: 342.5 ± 12.64 g; aged: 525 ± 47.87 g), and that LTDR abolished this effect (LTDR: 306.0 ± 14.70 g; aged: 525 ± 47.87 g) preserving BW to the values similar to the BW of adults (Figure 1A). Analyses of lipid status revealed significant alterations in aged animals in comparison to adults: elevated serum levels of CHOL (adults: 1.48 ± 0.10 mmoL/L; aged: 2.32 ± 0.15 mmoL/L), LDL-C (adults: 0.65 ± 0.05 mmoL/L; aged: 1.05 ± 0.14 mmoL/L), TG (adults: 0.87 ± 0.14 mmoL/L; aged: 1.49 ± 0.14 mmoL/L) and TG/HDL-C ratio (adult: 2.45 ± 0.54; aged: 4.15 ± 0.45). In all cases, LTDR effectively normalized levels of examined parameters to the levels detected in adults (CHOL: 1.85 ± 0.08 mmoL/L; LDL-C: 0.64 ± 0.03 mmoL/L; TG: 0.83 ± 0.12 mmoL/L) (Figures 1B,D–F). In addition, serum HDL-C level that remained unchanged during aging, was significantly increased by LTDR (adults: 0.24 ± 0.04 mmoL/L; aged: 0.19 ± 0.03 mmoL/L; LTDR: 0.38 ± 0.05 mmoL/L) (Figure 1C). As it was expected, aged males had significantly lower levels of serum T, which were additionally decreased by LTDR (adults: 2.012 ± 0.24 ng/mL; aged: 0.46 ± 0.11 ng/mL; LTDR: 0.10 ± 0.019 ng/mL) (Figure 1G).
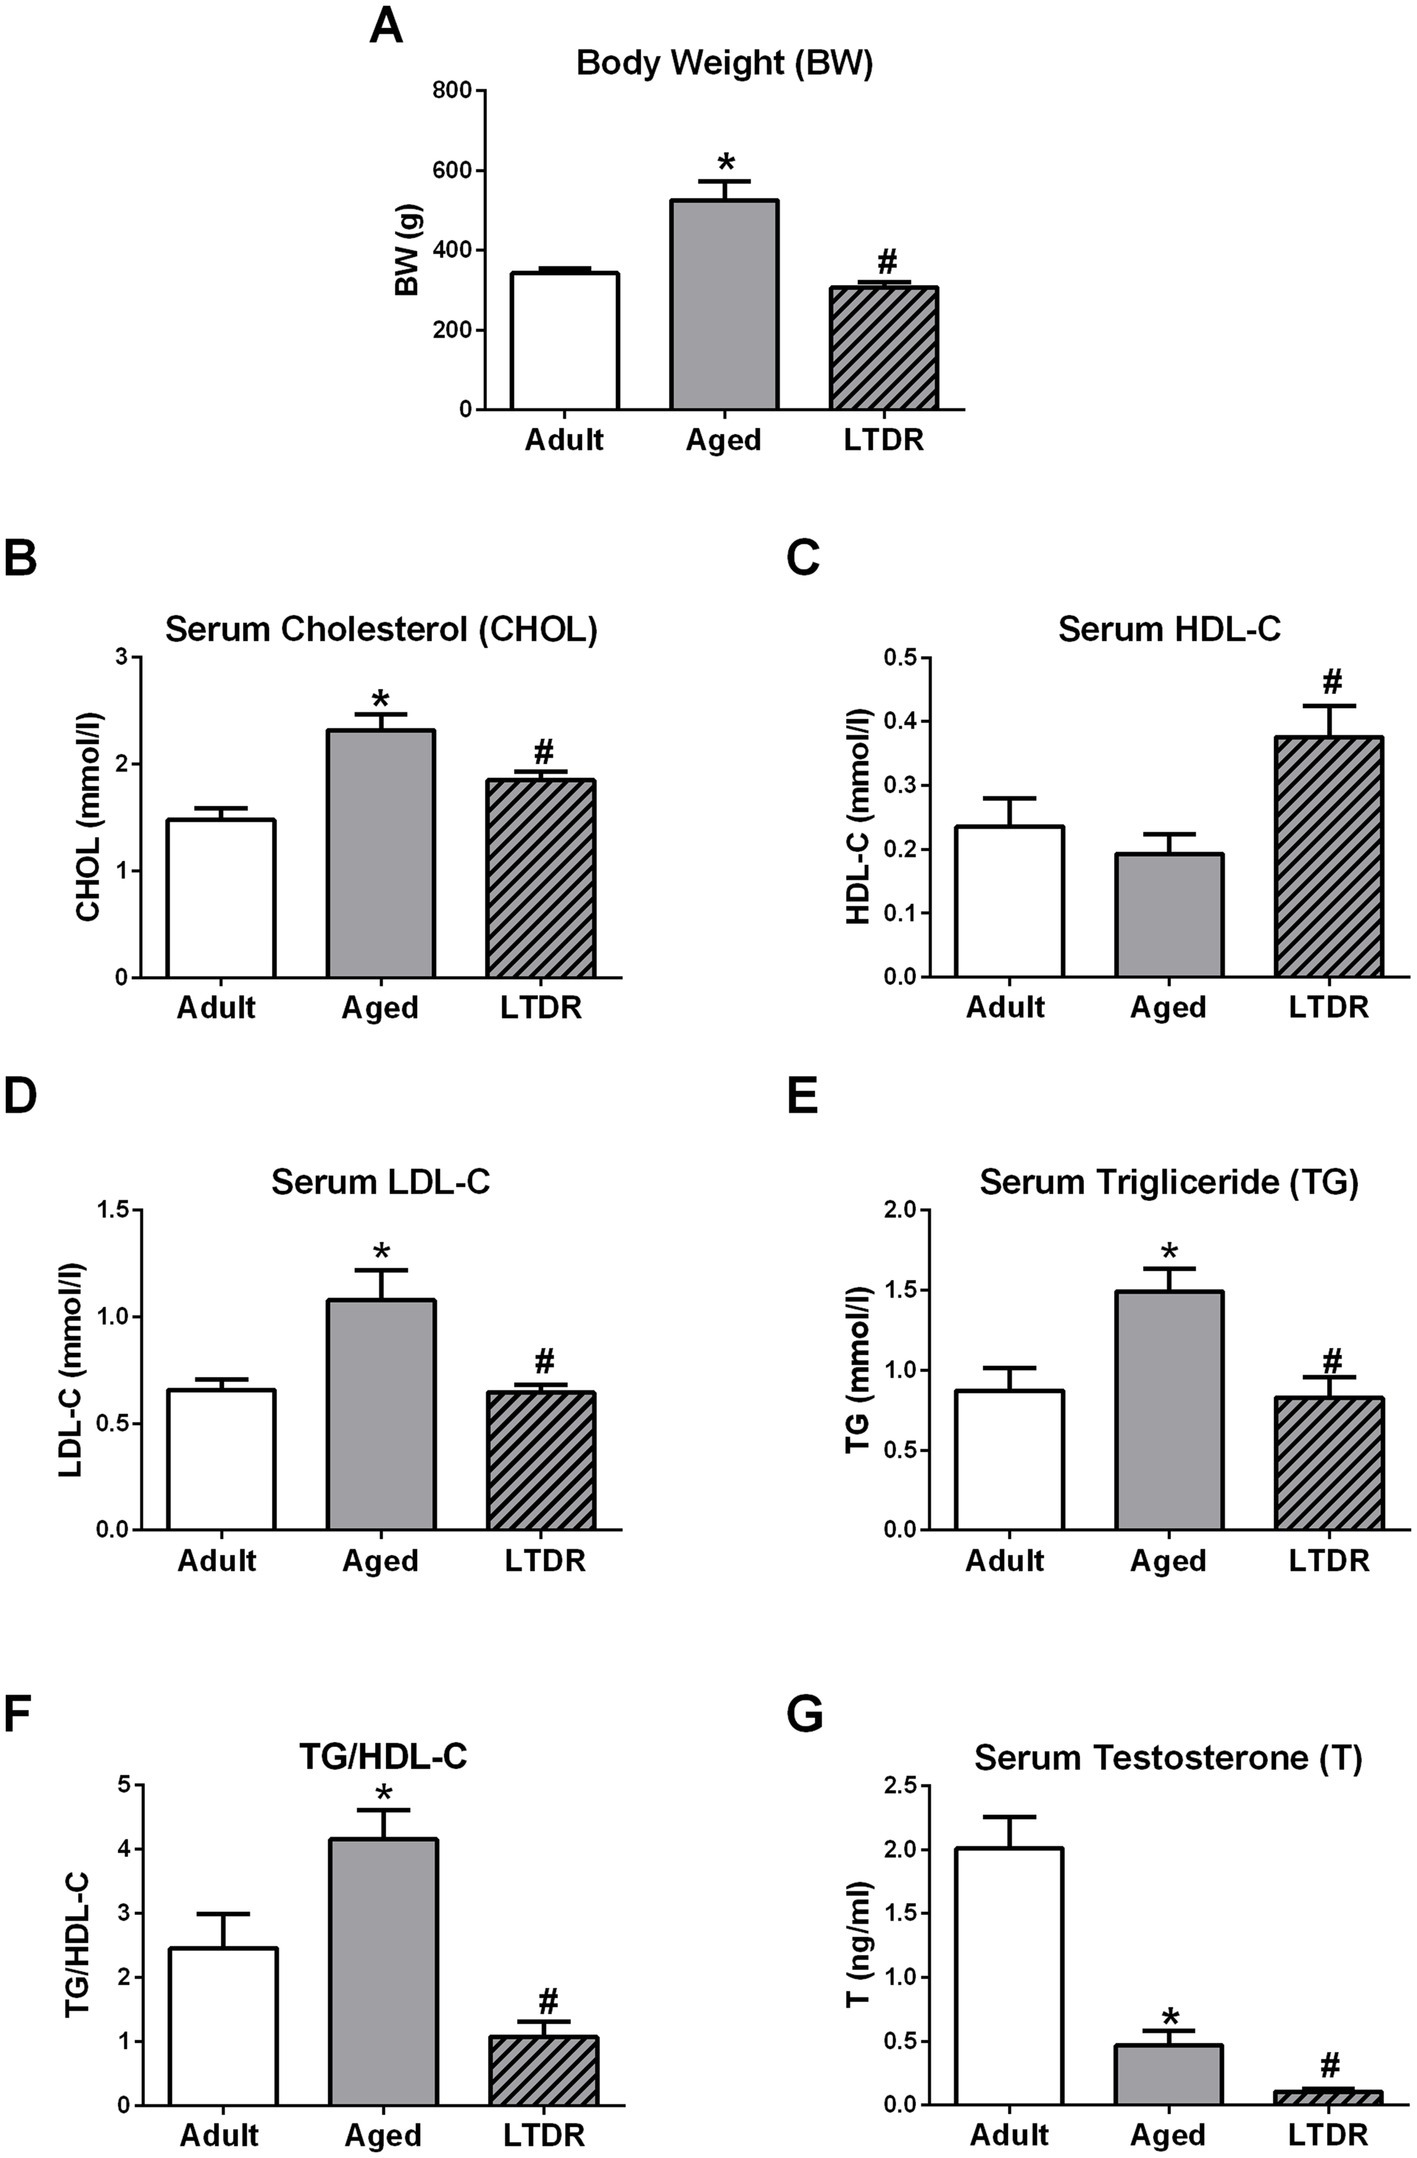
Figure 1. Effects of the aging and LTDR on the males BW, lipids profile and T levels. 6-month-old (adults), 24-month-old male Wistar rats (aged) and males subjected to long-term dietary restriction (18-month-long, 60% of daily food intake, LTDR) were followed to estimate time- and LTDR-induced changes in BW (A). Serum from all the groups was prepared and lipid status was characterized by photometric measurements of CHOL (B), HDL-C (C), LDL-C (D) and TG (E) levels, and TG/HDL-C ratio was calculated (F). T was determined by ELISA method revealing age induced decrement in T levels with deterioration after LTDR regime (G). The bars shown are mean ± SEM values; for all the analysis n ≥ 5; *indicates significant differences compared to adults; #indicates significant differences between aged animals and the LTDR group; p < 0.05.
3.2 LTDR changes the expression of genes involved in de novo synthesis of CHOL and LDL-C metabolism in the liver
To get a better insight into the alterations of the lipid status, we investigated the expression profile of the genes involved in CHOL synthesis, esterification, and transportation. Expression of 3-hydroxy-3-methylglutaryl-CoA reductase (Hmgcr, gene for rate-controlling enzyme in CHOL synthesis) was unaffected by aging, but its expression level increased more than twofold following LTDR exposure (adults: 6.85 ± 1.89%; aged: 4.22 ± 0.66%; LTDR: 14.63 ± 2.71%) (Figure 2A). Age-induced gene expression was detected in the case of sterol regulatory element binding transcription factor 1 (Srebf1) (Figure 2B), while age-decreased expression was detected in the case of Soat1 (Figure 2C). Compared to adults, trend of decreased expression of nuclear receptor subfamily 1 group H member 3 (Lxra) was recorded in aged animals without effect of LTDR (Figure 2D). Related to LDL mediated CHOL transportation and uptake, expression of ApoB was decreased in the aged group and additionally reduced after LTDR (Figure 2E). Expression of gene for LDL receptor (Ldlr) was decreased in aged animals, while LTDR reversed its expression to the levels detected in adults (adults: 1.7 ± 0.38%; aged: 0.8 ± 0.13%; LTDR: 1.73 ± 0.13%) (Figure 2F). Aging and LTDR did not affect the expression profiles of ApoA (Figure 2G) and Scarb1, both involved in HDL mediated CHOL transport and uptake, although a general trend of reduction was observed (Figure 2H). Changes were not detected in the expression profiles of Npc1 and the gene for LDL receptor-related protein (Lrp) (Figures 2I,J) involved in intracellular trafficking, and Abca1 responsible for CHOL efflux (Figure 2K).

Figure 2. LTDR changed expression of the genes involved in lipid metabolism in the liver. To assess the effects of LTDR on gene expression, pieces of the livers from the adult, aged and LTDR groups were collected, total RNA was extracted, and qPCR was performed. Target gene expression (%) was determined by the comparative 2−ΔΔCT quantification method with Gapdh as the reference gene. Time- and LTDR-induced changes in expression profile of Hmgcr, Srebf1, Soat1, Lxra, ApoB, Ldlr, ApoA, Scarb1, Npc1, Lrp, Abca1 are presented at panels A–K. The bars shown are mean ± SEM values; for all the analysis n ≥ 5; *indicates significant differences compared to adults; #indicates significant differences between aged animals and the LTDR group; p < 0.05.
3.3 LTDR-induced T decrement is not a consequence of disrupted pituitary function
Since low T levels in advanced periods of life may be accompanied by changes in LH levels (13, 37), we evaluated if LTDR affected pituitary functionality and gonadotropin synthesis. Gene expression profile and protein abundance of b subunits (mediator of biological activity) of LhB were unchanged in advanced periods of life, however, LTDR drastically increased their expression (approximately 3-fold) (Figures 3A,B). Expression profile of Fshb was unaffected by aging, but approximately twofold increased after the LTDR regime (Figure 3C). Trends of increased expression of alpha polipeptide (Cga) (Figure 3D) and trends of decreased expression of Gnrhr (Figure 3E) and prolactin (Prl) (Figure 3F) were recorded in aged groups. The expression profile of proopiomelanocortin (Pomc) was stable in advanced periods of life (Figure 3G); LTDR had no effects on expression levels of Cga, Gnrhr, Prl, and Pomc. Presented results indicate preserved gonadotroph functionality under LTDR, and prompted us to focus our research on the functionality of testes and changed lipid homeostasis.

Figure 3. LTDR does not alter gonadotrophs function and elevated gonadotropins b-subunits expression in the pituitary. Pituitaries from all the groups were collected (n = 5), total RNA was extracted, and qPCR was performed. Target gene expression (%) was determined by the comparative 2−ΔΔCT quantification method with Gapdh as the reference gene. Protein abundance was determined by western blot, relative fold of change was calculated based on the intensity of loading content and representative blot is shown. Panels show LTDR inducted expressions of Lhb/LhB (A,B) and Fshb (C). And, expression profiles of Cga (D), Gnrhr (E), Prl (F) and Pomc (G) in advanced periods of life and after the LTDR regime. The bars shown are mean ± SEM values; *indicates significant differences compared to adults; #indicates significant differences between aged animals and the LTDR group; p < 0.05.
3.4 LTDR compromises testis capacity for androgen synthesis
Following reduced serum T levels and preserved gonadotroph functionality after LTDR, we examined testes androgen capacity together with expression of key elements of steroidogenic machinery. According to obtained results, T content in the testes was significantly reduced in aged animals (adult: 1.48 ± 0.26 ng; aged: 0.47 ± 0.10 ng/10 mg tissue) and further decreased by LTDR (0.196 ± 0.02 ng) (Figure 4A). Compromised androgen capacity under LTDR was followed by unchanged expression of Lhr (Figure 4B) and reduced expression of Star (aged: 5.76 ± 0.54%; LTDR: 2.87 ± 0.34%) (Figure 4C) and Cyp11a1 (aged: 11.74 ± 1.99%; LTDR: 6.59 ± 1.23%) (Figure 4E). Age and LTDR induced reduction in gene expression was confirmed by concomitant reduction in proteins (StAR Figure 4D) and (CYP11A1 Figure 4F) abundance. All the other examined genes, including Hsd3b1 (Figure 4G), Cyp17a1 (Figure 4H), Hsd17b3 (Figure 4I), and Insl3 (Figure 4J) showed age-dependent decrease in expression without significant impact of LTDR.

Figure 4. Effects of aging and LTDR on testicular androgen capacity and expression profile of components of testicular steroidogenic machinery. Pieces of testes (n = 5) were homogenized by 1 × PBS (10 μL/mg), extraction of steroids was done by ethyl-ether, dry pellet was resuspended in ELISA buffer and T content was determined by ELISA method (A). Total RNA was extracted from pieces of testes (n = 5–6) and qPCR was performed. Expression profiles of Lhr (B), Star (C), Cyp11a1 (E), Hsd3b1 (G), Cyp17a1 (H), Hsd17b3 (I) and Insl3 (J) are shown. Protein abundance in the testes was determined by western blot, and representative blots of StAR (D) CYP11A1 (F) are shown. The bars shown are mean ± SEM values; *indicates significant differences compared to adults; #indicates significant differences between aged animals and the LTDR group; p < 0.05.
To better understand processes that mediate LTDR-induced reduction in testes androgen capacity, we checked levels of CHOL in testes together with the expression profiles of genes involved in cholesterol metabolism. Indeed, testicular extracts from the LTDR group contained less CHOL than their ad libitum fed, age matched peers (aged: 12.64 ± 2.06; LTDR: 6.89 ± 0.99 μg/10 mg tissue) (Figure 5A), as well as decreased expression levels of Ldlr (aged: 0.55 ± 0.06%; LTDR: 0.38 ± 0.04; p = 0.038) (Figure 5B). Expression of other genes involved in maintaining CHOL homeostasis including Scarb1, Npc1, Soat1, Hmgcr, Srebf1, Abca1, and Cyp46a1 was not affected by LTDR (Figures 5C–I).
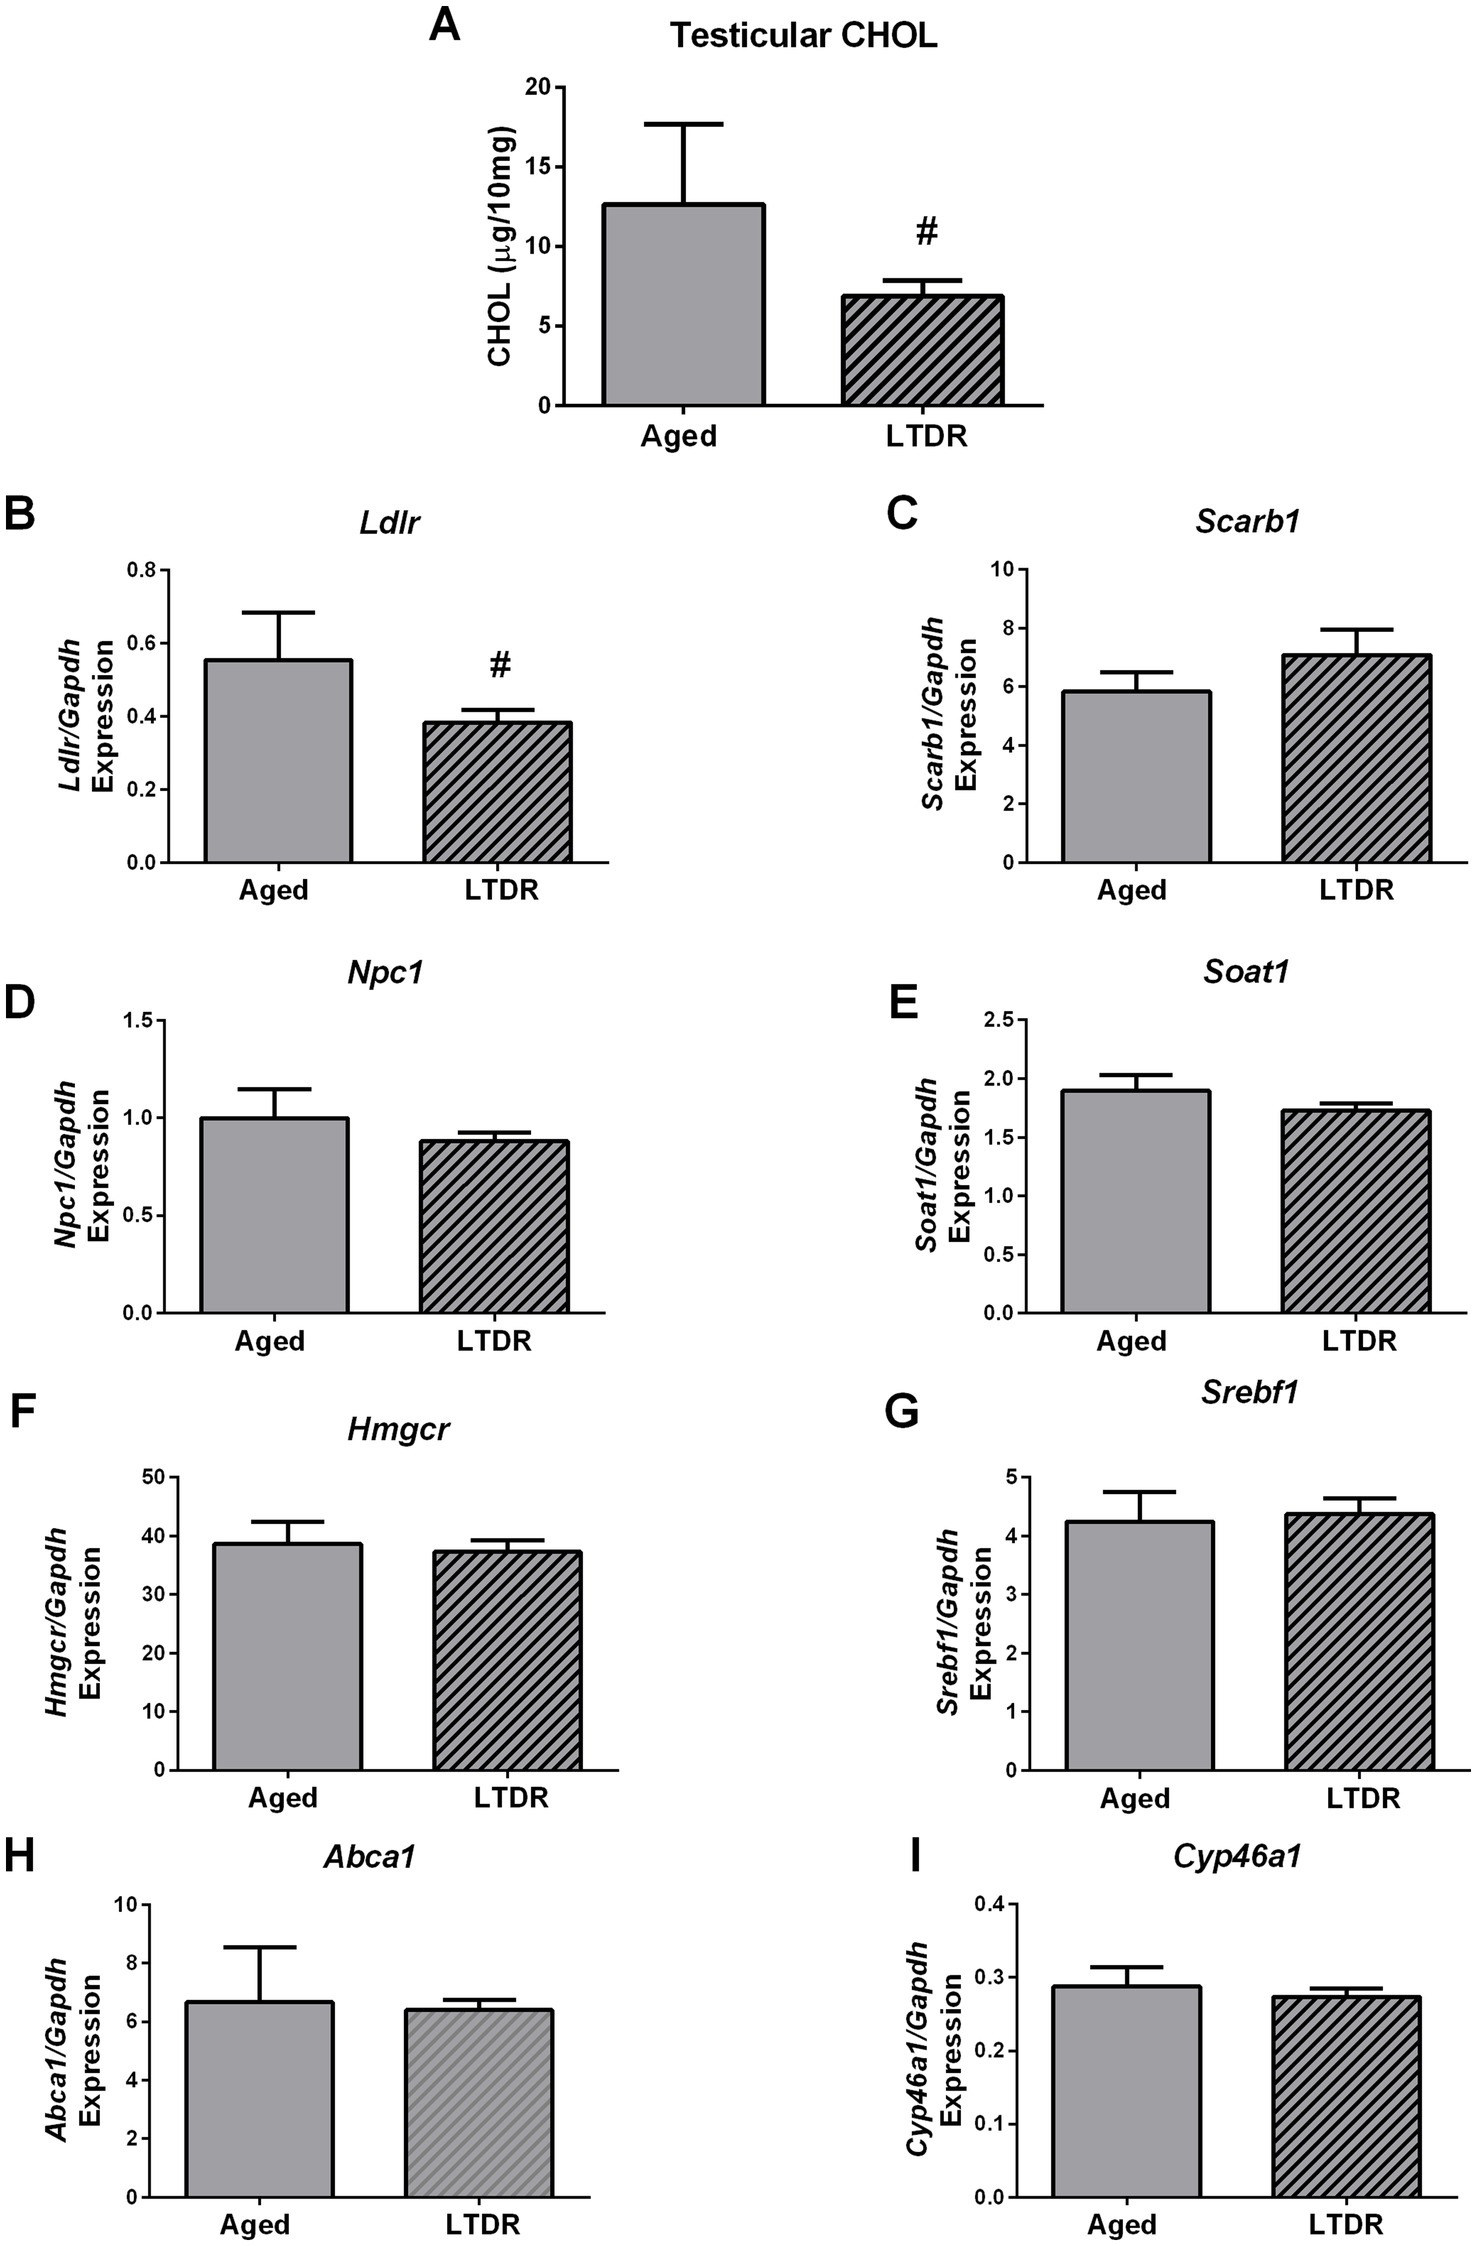
Figure 5. LTDR regime decreased Ldlr expression and CHOL in testes. Testicular tissue (n = 5–8) was homogenized with 1×PBS, extraction of lipids was done by ethyl-ether, dry pellet was resuspended in 0.1%-BSA-1×PBS, and CHOL content was photometrically measured (A). Effects of LTDR on expression of the genes involved in cholesterol metabolism and de novo synthesis were assessed with qPCR method, n = 5 (B–I). The bars shown are mean ± SEM values; #indicates significant differences between aged animals and the LTDR group; p < 0.05.
3.5 Duration of DR as the main factor of the treatment effects
In the final steps of the study, we checked if the duration of the dietary restriction represents the crucial factor responsible for lipid status alterations and consequently a drop in T levels. To get an answer to this question, we exposed 21-month-old males to the 3-month-long 40%-dietary reduction (STDR) and inspected BW, T production, and lipid profile. Compared to the intact aged group, STDR decreased BW but with less effectiveness than LTDR (aged: 525 g ± 47.87 g; STDR 423.8 g ± 12.8 g; LTDR: 306.0 g ± 14.70 g) (Figure 6A). Serum levels of T, CHOL, HDL-C, and LDL-C did not differ significantly between aged and STDR animals (Figures 6B–E). In line with the presented findings, CHOL and T content in the testes of the STDR group were similar to the content detected in age-matched controls (Figures 6F,G).
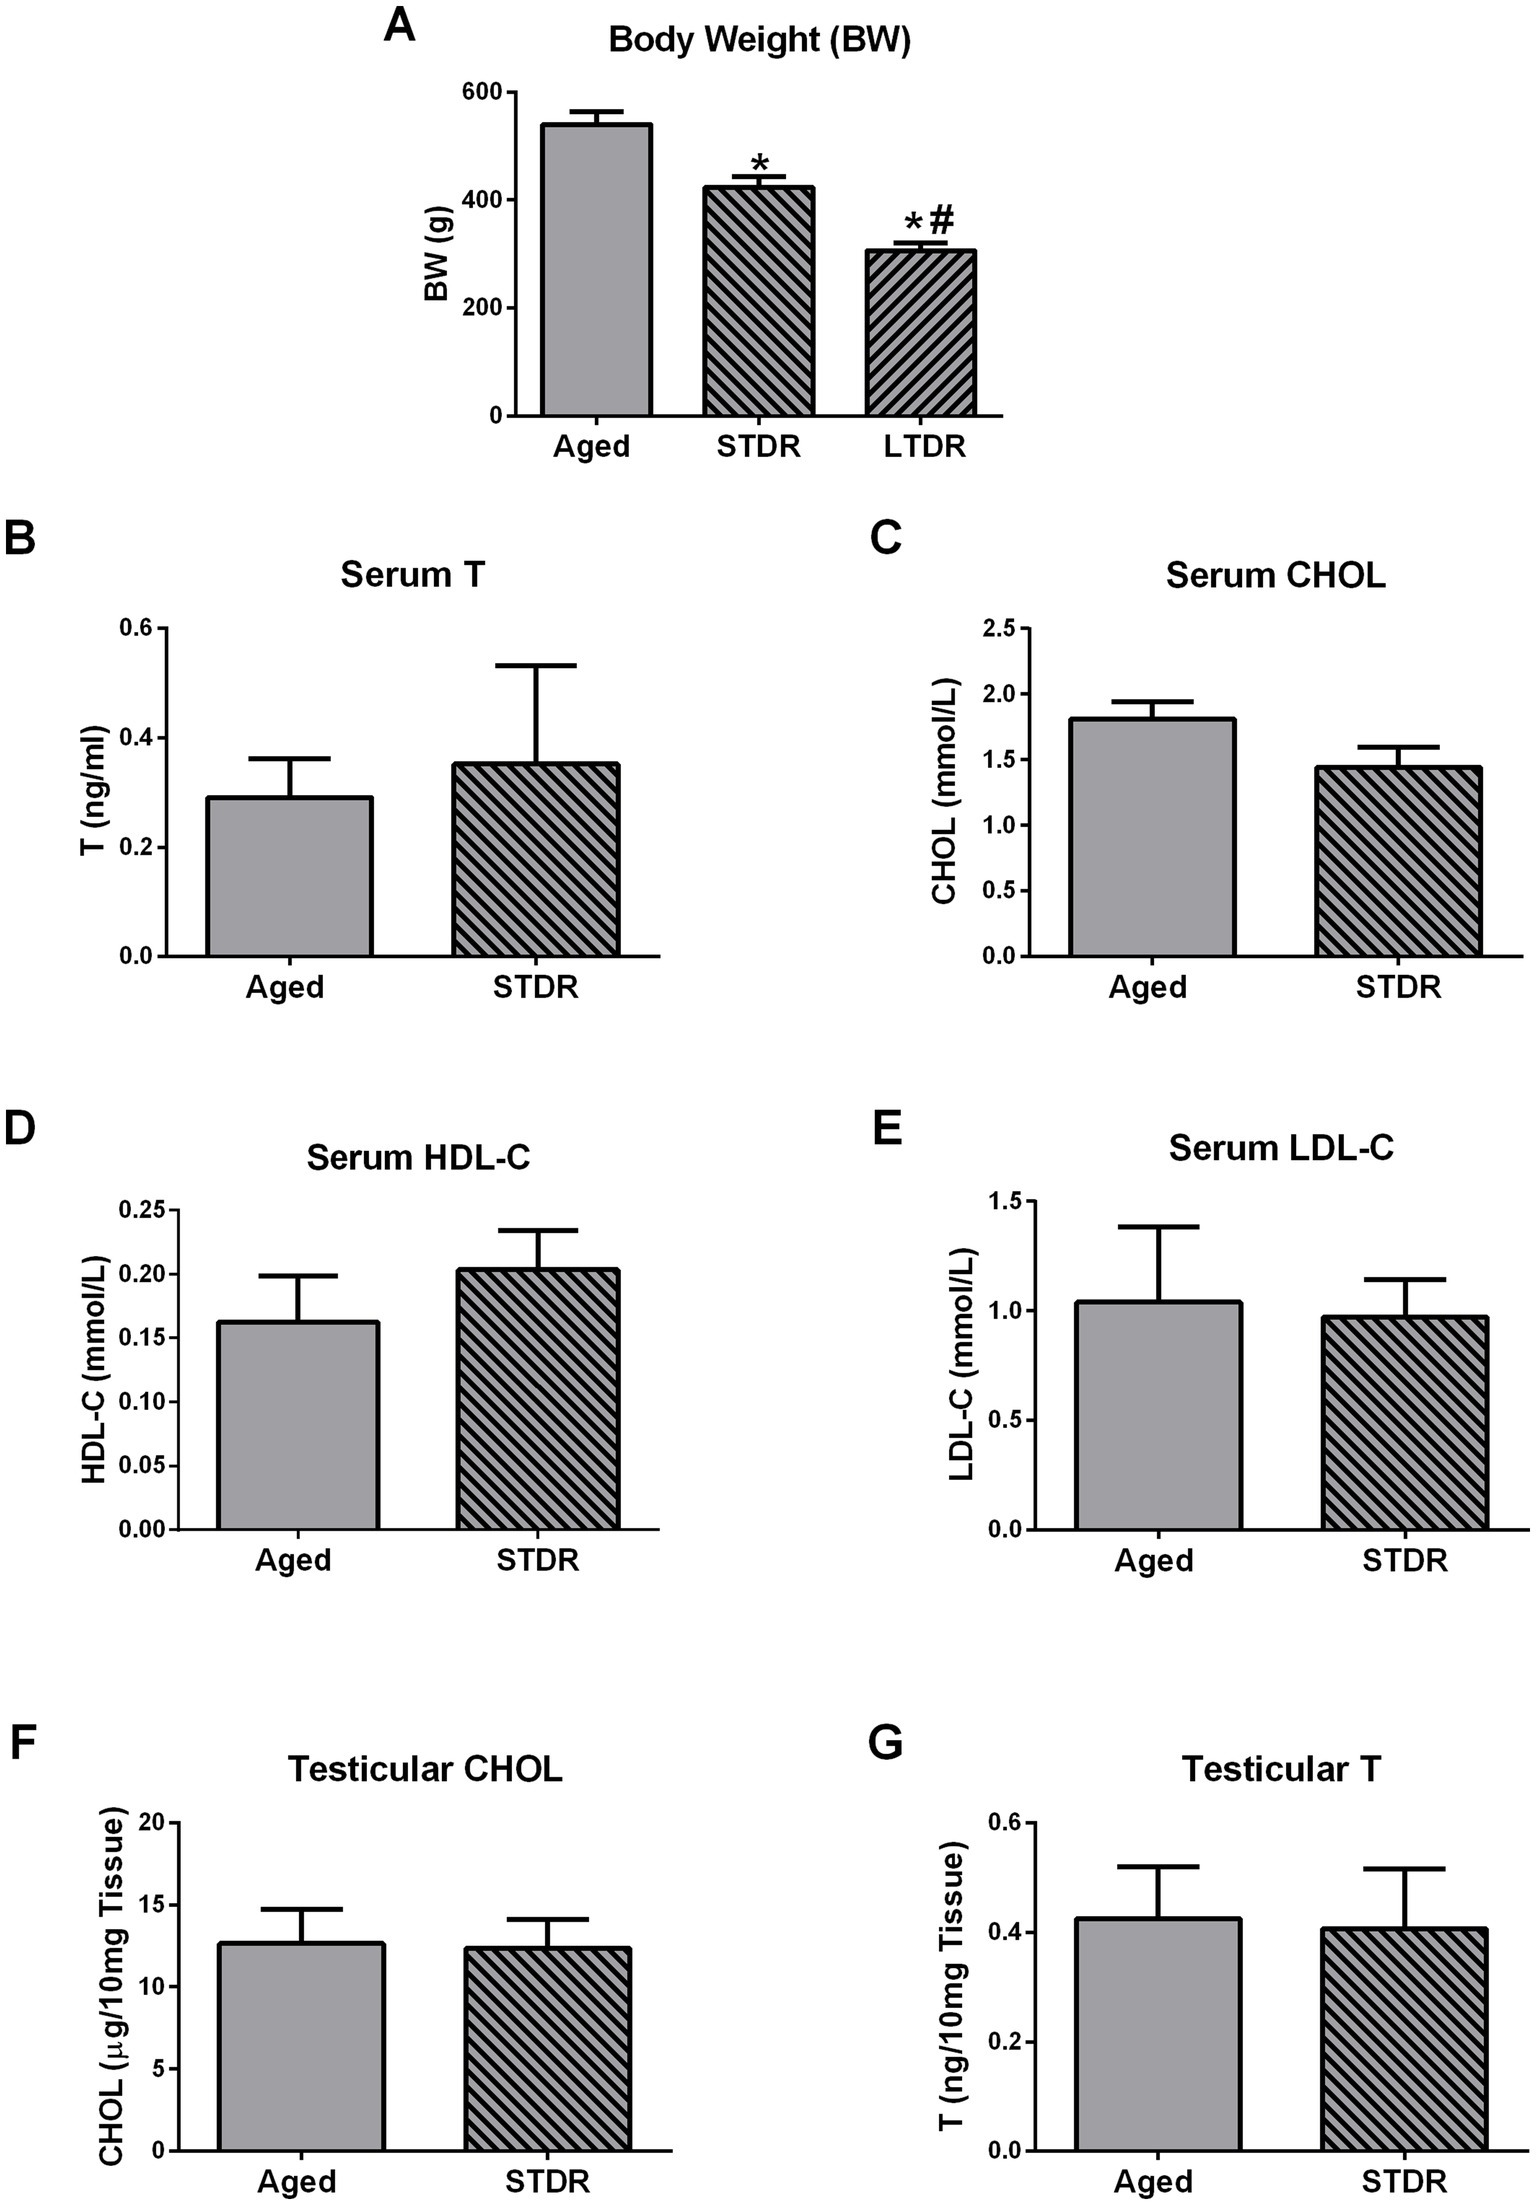
Figure 6. Short-term dietary restriction (STDR) changes BW but does not change T levels and lipid status in advanced periods of life. Aged male Wistar rats, males subjected to short-term dietary restriction (3-month-long, 60% of daily food intake, STDR), and males from LTDR group were monitored to estimate the effects of the regimes on the BW (A). Serum levels of T (B), CHOL (C), HDL-C (D), LDL-C (E), as well as testicular levels of CHOL (F) and T (G) were determined. The bars shown are mean ± SEM values; for all the analysis n ≥ 5; *indicates significant differences compared to aged animals; #indicates significant differences compared to the STDR group; p < 0.05.
4 Discussion
Aging is a complex process associated with the failure of multiple organ systems, including a decrease in T levels (14) and an altered lipid profile (20), both of which severely affect quality of life and correlate with a shorter lifespan and increased mortality (38, 39). Given that the elderly population is constantly growing (20), new treatments are needed for androgen deficiency and age-related perturbations in the lipidomic profile, suggesting lipid homeostasis disruption. In terms of reducing the amount of food without malnutrition, DR showed numerous beneficial effects, including normalizing total CHOL, LDL-C, and TG levels and increasing HDL-C levels (33). In obese and overweight men, DR significantly improved T levels, and weight loss was declared as the most appropriate intervention for obesity-related hypogonadism (40). Given the beneficial effects of DR on lipid status and T production, we wanted to investigate if those effects are related to similar changes in T production at advanced stages of life. We also wanted to investigate whether the duration of DR has any impact on those changes.
Here, we detected an increase in BW, serum CHOL, LDL-C, TG, and TG/HDL-C ratio in advanced stages of life without significant changes in HDL-C levels. LTDR effectively normalized all elevated parameters to the levels seen in adults, but also increased HDL-C levels. These results were expected and have been reported previously (33, 41, 42). The age-related increase in CHOL, LDL-C, and TG may be attributed to the increased expression of Srebf1 observed in the liver, as SREBF1 acts as a key transcription factor that can induce lipogenesis and LDL synthesis (43, 44). Since it is known that HMGCR is a master regulator of CHOL de novo synthesis and that the expression of Hmgcr and Ldlr is controlled by a negative loop (45, 46), it is expected that increased expression of these genes will be detected following the LTDR-induced drop in circulating lipids. The drop in serum LDL-C was also accompanied by decreased expression of ApoB, and this finding is consistent with the previously published results (47); in the same publication, authors also detected an impaired TG synthesis and suppressed de novo fatty acid synthesis following DR. Decreased expression of Lxra in the liver has been documented in non-alcoholic fatty liver disease (48), often seen in the aged population, and a decreased pattern of Soat1 might be related to dysregulation of cholesterol esters synthesis. Consequently, the results obtained on the expression of Soat1 and Lxra may be suggestive of parameters indicative of disturbed CHOL homeostasis and hepatic functionality during the process of aging. Due to complex relations between changed lipid homeostasis and liver functionality at the latter stages of life, further investigations are needed to elucidate the exact mechanisms promoting age- and DR-induced changes in lipid status.
To check the possibility that LTDR impairs the pituitary function and consequently attenuates T production, the functional status of pituitary cells was examined. Based on the unchanged expression of Cga, Fshb, and Lhb we estimated preserved gonadotrophs functionality in advanced periods of life, which was proposed by earlier studies (16, 17, 49). Furthermore, the LTDR-induced increased expression of Fshb and Lhb/LhB, additionally indicates preserved responsiveness of gonadotrophs (37, 50), and most probably is a consequence of reduced T levels and activation of the testicular-pituitary feedback loop. Relatively stable expression of Gnrhr after LTDR, suggests that impaired GnRH signaling does not account for decreased T production. As it is known that hyperprolactinemia (51, 52) and increased activity of the pituitary-adrenal axis (53, 54) disturb gonadotrophs functionality and decrease T production, we inspected the expression profile of Prl and Pomc. Our results revealed a trend of decreased expression of Prl and unchanged expression of Pomc following LTDR, and based on these results, we excluded hyperprolactinemia and increased activity of the pituitary-adrenal axis as factors responsible for decreased T production. Considering that fasting or glucose deprivation suppresses pulsatile LH release (55), more detailed studies are needed, but at this stage, our findings have led us to focus our research on testicular functionality after LTDR.
Based on the results presented herein, it can be concluded that testicular functionality was significantly impaired during aging, reflected in decreased T content along with reduced expression of key elements of the steroidogenic machinery, including Lhr, Star/StAR, Cyp11a1/CYP11A1, Hsd3b1, Cyp17a1, Hsd17b3, and LCs functional marker Insl3. LTDR additionally decreased T content in the testes and the levels of StAR and CYP11A1. These results are in consistency with our previous work (15, 49) and relate to age-induced dysfunctionality of LCs rather than their loss (18, 50). The reduced androgen capacity induced by reduced food intake has been previously demonstrated in men (24) and rats (34–36). More recent studies showed a negative effect of caloric restriction on the testicular metabolome and sperm head formation in rats (56) and negative effects of dietary energy restriction on the testicular transcriptome in rams (57). To gain better insight into the mechanisms responsible for impaired T synthesis after LTDR, we analyzed testicular CHOL content with concurrent expression profiles of genes involved in CHOL synthesis and transport. Our results pointed to reduced CHOL content and decreased expression of Ldlr in the testes of the LTDR group, while the expression profiles of the other genes examined were comparable to those of age-matched controls. Unlike in liver, expression of Hmgcr stayed unchanged in testes and point to tissues specific regulation of Hmgcr expression and in de novo synthesis of CHOL. Difference in Hmgcr expression as well as unchanged expression of the genes involved in CHOL de novo synthesis and its uptake from HDL-C could be a consequence of impaired LH-cAMP signaling in aged LCs. This opinion comes from the fact that both process are controlled by LH-cAMP signaling in LCs (58) and not in liver. Since CHOL is an important precursor for testicular steroidogenesis, the impaired T production in the LTDR group could be a consequence of CHOL deficiency. Since it is known that CHOL needed for steroidogenesis is generated both through endogenously de novo synthesis and via circulating lipoproteins (1, 59), decreased Ldlr gene expression and serum LDL-C levels should be considered as possible cause. Due to the extremely complex regulation of testicular lipid homeostasis, it is difficult to determine the exact source of cholesterol used for testosterone synthesis (1). HDL-C has been proposed as the major extracellular source of CHOL for LCs, while LDL-C is also known to support testicular steroidogenesis under certain conditions such as desensitization promoted by hCG/LH (60). It is also known that rat HDL contains apolipoprotein E and has a high affinity for LDLR, and presence of HDL with apolipoprotein E increases the T production of rat LCs (61). In vivo studies showed that simvastatin-treated rats had lower T and LDL-C levels (62), while Klinefelter et al. (63) demonstrated a statin-induced reduction in LH-stimulated T production in rat LCs. Population studies also showed a positive association between lower LDL-C levels and free T levels (64) and a reduction in total T, free T, and LDL-C after statin use (65). In the context of impaired LDLR signaling, it has been shown that ApoE−/−Ldlr−/− mice exhibited reduced T levels, sperm counts, and testicular tubule atrophy (66). It has also been shown that low T levels promote the reduction of LDLR and decreased uptake of CHOL in the liver of rats (67). Considering that we did not use purified LCs in this study, further mechanistic studies are needed to clarify the role of LDL-C in T production under LTDR. Since LDL-C is known to play a role in the development of atherosclerosis and consequently in inflammation, we excluded the possibility that inflammation in the testis is responsible for LTDR-promoted T reduction based on the expression profile of inflammatory cytokines (Supplementary Figure 1). Based on serum levels of corticosteroids and the expression of Nr3c1 and Hsd11b1/2, we excluded the involvement of stress in LTDR-mediated T decline (Supplementary Figure 2); non-elevated corticosterone levels are consistent with unchanged levels of pituitary expression of Pomc in the LTDR group. In contrast to the effects of LTDR, STDR reduced body weight, but to a lesser extent than LTDR, and had no adverse effects on serum and testicular T levels. The treatment also did not alter serum CHOL, HDL-C, LDL-C, and testicular CHOL levels.
In consideration of the results that have been presented, it can be concluded that LTDR, but not STDR, was able to reduce T production at advanced stages of life. Reduced testosterone levels may be a consequence of testicular CHOL deficiency, due to reduced serum CHOL and LDL-C levels after LTDR. The findings reported in this study indicate that the duration of restricted food intake is an essential factor responsible for alterations in lipid homeostasis and compromised androgen capacity of testes. In accordance with the results of this study, which demonstrate the adverse effects of LTDR, it is imperative that individuals practice extreme caution when considering its implementation in the advanced stage of life.
Data availability statement
The original contributions presented in the study are publicly available. This data can be found in the institutional repository: https://radar.ibiss.bg.ac.rs/.
Ethics statement
The animal study was approved by Ethical Committee for the Use of Laboratory Animals of the Institute for Biological Research “Sinisa Stankovic”—The National Institute of the Republic of Serbia, University of Belgrade, and by The National Ethic Research Committee (No. 323-07-13, No. 536/2020-05, No. 05-06/14). The study was conducted in accordance with the local legislation and institutional requirements.
Author contributions
SS: Conceptualization, Data curation, Investigation, Methodology, Visualization, Writing – original draft, Writing – review & editing. MP: Data curation, Investigation, Methodology, Writing – review & editing. VS: Data curation, Investigation, Methodology, Writing – review & editing. SP: Conceptualization, Data curation, Investigation, Methodology, Writing – review & editing. AM: Conceptualization, Funding acquisition, Supervision, Writing – review & editing.
Funding
The author(s) declare that financial support was received for the research and/or publication of this article. This work was supported by the Ministry of Education, Science and Technological Development of the Republic of Serbia (Contract Number 451-03-136/2025-03/200007).
Acknowledgments
The results presented in this manuscript are in line with Sustainable Development Goal 3 (Good Health and Well-being) of the United Nations 2030 Agenda. The authors are grateful to Dr. Stanko Stojilkovic (National Institutes of Health, United States) for the kind gift of StAR and CYP11A1 antibodies and to Dr. Bjelobaba Ivana and Dr. Janjic Marija (Institute for Biological Research “Sinisa Stankovic”) for the kind gift of primers.
Conflict of interest
The authors declare that the research was conducted in the absence of any commercial or financial relationships that could be construed as a potential conflict of interest.
The handling editor IŠ declared a shared affiliation with the author(s) at the time of review.
Generative AI statement
The authors declare that no Gen AI was used in the creation of this manuscript.
Any alternative text (alt text) provided alongside figures in this article has been generated by Frontiers with the support of artificial intelligence and reasonable efforts have been made to ensure accuracy, including review by the authors wherever possible. If you identify any issues, please contact us.
Publisher’s note
All claims expressed in this article are solely those of the authors and do not necessarily represent those of their affiliated organizations, or those of the publisher, the editors and the reviewers. Any product that may be evaluated in this article, or claim that may be made by its manufacturer, is not guaranteed or endorsed by the publisher.
Supplementary material
The Supplementary material for this article can be found online at: https://www.frontiersin.org/articles/10.3389/fnut.2025.1665682/full#supplementary-material
SUPPLEMENTARY FIGURE 1 | LTDR does not trigger testicular inflammation and the inflammation-related T reduction. Total RNA was extracted from pieces of testes (n = 5–6), and qPCR was performed. Target gene expression (%) was determined by the comparative 2−ΔΔCT quantification method with Gapdh as the reference gene. Expression profiles of Nos2 (A), Lif (B), Il1b (C), Il2 (D), Il6 (E), Il10 (F), Tnf (G), and Hif1a (H) are shown. The bars shown are mean ± SEM values; *indicates significant differences compared to adults; #indicates significant differences between aged animals and the LTDR group; p < 0.05.
SUPPLEMENTARY FIGURE 2 | Corticosterone and corticosterone-related signaling do not participate in LTDR-induced T reduction. Serum corticosterone was determined by Enzo Corticosterone ELISA kit (A). Total RNA was extracted from pieces of testes, and qPCR was performed. Expression profiles of Nr3c1 (B), Hsd11b1 (C), and Hsd11b2 (D) are shown. The bars shown are mean ± SEM values; for all the analysis n = 5–6; *indicates significant differences compared to adults; #indicates significant differences between aged animals and the LTDR group; p < 0.05.
Footnotes
References
1. Wang, Y, Chen, F, Ye, L, Zirkin, B, and Chen, H. Steroidogenesis in Leydig cells: effects of aging and environmental factors. Reproduction. (2017) 154:R111–22. doi: 10.1530/REP-17-0064
2. Hull, EM, and Dominguez, JM. Sexual behavior in male rodents. Horm Behav. (2007) 52:45–55. doi: 10.1016/j.yhbeh.2007.03.030
3. Gwynne, JT, and Strauss, JF. The role of lipoproteins in steroidogenesis and cholesterol metabolism in steroidogenic glands. Endocr Rev. (1982) 3:299–329. doi: 10.1210/edrv-3-3-299
4. Porter, FD, and Herman, GE. Malformation syndromes caused by disorders of cholesterol synthesis. J Lipid Res. (2011) 52:6–34. doi: 10.1194/jlr.R009548
5. Venugopal, S, Martinez-Arguelles, DB, Chebbi, S, Hullin-Matsuda, F, Kobayashi, T, and Papadopoulos, V. Plasma membrane origin of the steroidogenic pool of cholesterol used in hormone-induced acute steroid formation in Leydig cells. J Biol Chem. (2016) 291:26109–25. doi: 10.1074/jbc.M116.740928
6. Miller, WL. Steroid hormone synthesis in mitochondria. Mol Cell Endocrinol. (2013) 379:62–73. doi: 10.1016/j.mce.2013.04.014
7. Kraemer, FB, and Shen, WJ. Hormone-sensitive lipase: control of intracellular tri-(di-)acylglycerol and cholesteryl ester hydrolysis. J Lipid Res. (2002) 43:1585–94. doi: 10.1194/jlr.r200009-jlr200
8. Clark, BJ, Wells, J, King, SR, and Stocco, DM. The purification, cloning, and expression of a novel luteinizing hormone-induced mitochondrial protein in MA-10 mouse Leydig tumor cells. Characterization of the steroidogenic acute regulatory protein (StAR). J Biol Chem. (1994) 269:28314–22. doi: 10.1016/s0021-9258(18)46930-x
9. Midzak, AS, Chen, H, Papadopoulos, V, and Zirkin, BR. Leydig cell aging and the mechanisms of reduced testosterone synthesis. Mol Cell Endocrinol. (2009) 299:23–31. doi: 10.1016/j.mce.2008.07.016
10. Payne, AH, and Hales, DB. Overview of steroidogenic enzymes in the pathway from cholesterol to active steroid hormones. Endocr Rev. (2004) 25:947–70. doi: 10.1210/er.2003-0030
11. Marshall, JC, and Kelch, RP. Gonadotropin-releasing hormone: role of pulsatile secretion in the regulation of reproduction. N Engl J Med. (1986) 315:1459–68. doi: 10.1056/NEJM198612043152306
12. Dufau, ML. The luteinizing hormone receptor. Annu Rev Physiol. (1998) 60:461–96. doi: 10.1146/annurev.physiol.60.1.461
13. Araujo, AB, and Wittert, GA. Endocrinology of the aging male. Best Pract Res Clin Endocrinol Metab. (2011) 25:303–19. doi: 10.1016/j.beem.2010.11.004
14. Harman, SM, Metter, EJ, Tobin, JD, Pearson, J, and Blackman, MR. Longitudinal effects of aging on serum total and free testosterone levels in healthy men. J Clin Endocrinol Metab. (2001) 86:724–31. doi: 10.1210/jcem.86.2.7219
15. Sokanovic, SJ, Janjic, MM, Stojkov, NJ, Baburski, AZ, Bjelic, MM, Andric, SA, et al. Age related changes of cAMP and MAPK signaling in Leydig cells of Wistar rats. Exp Gerontol. (2014) 58:19–29. doi: 10.1016/j.exger.2014.07.004
16. Zirkin, BR, Santulli, R, Strandberg, JD, Wright, WW, and Ewing, LL. Testicular steroidogenesis in the aging brown Norway rat. J Androl. (1993) 14:118–23. doi: 10.1002/j.1939-4640.1993.tb01663.x
17. Chen, H, Hardy, MP, and Zirkin, BR. Age-related decreases in Leydig cell testosterone production are not restored by exposure to LH in vitro. Endocrinology. (2002) 143:1637–42. doi: 10.1210/endo.143.5.8802
18. Chen, H, Hardy, MP, Huhtaniemi, I, and Zirkin, BR. Age-related decreased Leydig cell testosterone production in the brown Norway rat. J Androl. (1994) 15:551–7. doi: 10.1002/j.1939-4640.1994.tb00498.x
19. Chen, H, Liu, J, Luo, L, and Zirkin, BR. Dibutyryl cyclic adenosine monophosphate restores the ability of aged Leydig cells to produce testosterone at the high levels characteristic of young cells. Endocrinology. (2004) 145:4441–6. doi: 10.1210/en.2004-0639
20. Liu, HH, and Li, JJ. Aging and dyslipidemia: a review of potential mechanisms. Ageing Res Rev. (2015) 19:43–52. doi: 10.1016/j.arr.2014.12.001
21. Carlile, SI, and Lacko, AG. Strain differences in the age related changes of rat lipoprotein metabolism. Comp. Biochem. Physiol. B. (1981) 70:753–8. doi: 10.1016/0305-0491(81)90012-2
22. Parini, P, Angelin, B, and Rudling, M. Cholesterol and lipoprotein metabolism in aging: reversal of hypercholesterolemia by growth hormone treatment in old rats. Arterioscler Thromb Vasc Biol. (1999) 19:832–9. doi: 10.1161/01.atv.19.4.832
23. Field, PA, and Gibbons, GF. Decreased hepatic expression of the low-density lipoprotein (LDL) receptor and LDL receptor-related protein in aging rats is associated with delayed clearance of chylomicrons from the circulation. Metabolism. (2000) 49:492–8. doi: 10.1016/s0026-0495(00)80014-1
24. Smith, SJ, Teo, SYM, Lopresti, AL, Heritage, B, and Fairchild, TJ. Examining the effects of calorie restriction on testosterone concentrations in men: a systematic review and meta-analysis. Nutr Rev. (2022) 80:1222–36. doi: 10.1093/nutrit/nuab072
25. Wickramatilake, CM, Mohideen, MR, and Pathirana, C. Association of serum testosterone with lipid abnormalities in patients with angiographically proven coronary artery disease. Indian J Endocrinol Metab. (2013) 17:1061–5. doi: 10.4103/2230-8210.122624
26. Yeap, BB. Androgens and cardiovascular disease. Curr Opin Endocrinol Diabetes Obes. (2010) 17:269–76. doi: 10.1097/MED.0b013e3283383031
27. Kosmas, CE, and Rodruguez Palanco, S. The triglyceride/high-density lipoprotein cholesterol (TG/HDL-C) ratio as a risk marker for metabolic syndrome and cardiovascular disease. Diagnostics. (2023) 13:929. doi: 10.3390/diagnostics13050929
28. Chung, TH, Kwon, YJ, and Lee, YJ. High triglyceride to HDL cholesterol ratio is associated with low testosterone and sex hormone-binding globulin levels in middle-aged and elderly men. Aging Male. (2020) 23:93–7. doi: 10.1080/13685538.2018.1501015
29. Lobo, F, Haase, J, and Brandhorst, S. The effects of dietary interventions on brain aging and neurological diseases. Nutrients. (2022) 14:5086. doi: 10.3390/nu14235086
30. Todorovic, ST, Smiljanic, KR, Ruzdijic, SD, Mladenovic Djordjevic, A, and Kanazir, SD. Effects of different dietary protocols on general activity and frailty of male Wistar rats during aging. J Gerontol A. (2018) 73:1036–44. doi: 10.1093/gerona/gly015
31. Wang, J, Laferrεre, B, Thornton, JC, Pierson, RN, and Pi-Sunyer, FX. Regional subcutaneous-fat loss induced by caloric restriction in obese women. Obes Res. (2002) 10:885–90. doi: 10.1038/oby.2002.121
32. Ye, J, and Keller, JN. Regulation of energy metabolism by inflammation: a feedback response in obesity and calorie restriction. Aging. (2010) 2:361–8. doi: 10.18632/aging.100155
33. Fontana, L, Meyer, TE, Klein, S, and Holloszy, JO. Long-term calorie restriction is highly effective in reducing the risk for atherosclerosis in humans. Proc Natl Acad Sci USA. (2004) 101:6659–63. doi: 10.1073/pnas.0308291101
34. Chacon, F, Cano, P, Jimenez, V, Cardinali, DP, Marcos, A, and Esquifino, AI. 24-hour changes in circulating prolactin, follicle-stimulating hormone, luteinizing hormone, and testosterone in young male rats subjected to calorie restriction. Chronobiol Int. (2004) 21:393–404. doi: 10.1081/cbi-120038607
35. Govic, A, Levay, EA, Hazi, A, Penman, J, Kent, S, and Paolini, AG. Alterations in male sexual behaviour, attractiveness and testosterone levels induced by an adult-onset calorie restriction regimen. Behav Brain Res. (2008) 190:140–6. doi: 10.1016/j.bbr.2008.02.013
36. Grewall, T, Mickelsen, O, and Hafs, HD. Androgen secretion and spermatogenesis in rats following semistarvation. Proc Soc Exp Biol Med. (1971) 138:723–7. doi: 10.3181/00379727-138-35976
37. Roelfsema, F, Liu, PY, Takahashi, PY, Yang, RJ, and Veldhuis, JD. Dynamic interactions between LH and testosterone in healthy community-dwelling men: impact of age and body composition. J Clin Endocrinol Metab. (2020) 105:e628–41. doi: 10.1210/clinem/dgz246
38. Holmboe, SA, Skakkebæk, NE, Juul, A, Scheike, T, Jansen, TK, Linneberg, A, et al. Individual testosterone decline and future mortality risk in men. Eur J Endocrinol. (2018) 178:123–30. doi: 10.1530/EJE-17-0280
39. Pirillo, A, Casula, M, and Olmastroni, E. Global epidemiology of dyslipidaemias. Nat Rev Cardiol. (2021) 18:689–700. doi: 10.1038/s41569-021-00541-4
40. Miller, C, Madden-Doyle, L, and Jayasena, C. Mechanisms in endocrinology: hypogonadism and metabolic health in men-novel insights into pathophysiology. Eur J Endocrinol. (2024) 191:R1–R17. doi: 10.1093/ejendo/lvae128
41. Šošić-Jurjević, B, and Lütjohann, D. Differences in cholesterol metabolism, hepato-intestinal aging, and hepatic endocrine milieu in rats as affected by the sex and age. Int J Mol Sci. (2023) 24:12624. doi: 10.3390/ijms241612624
42. Walter, M. Interrelationships among HDL metabolism, aging, and atherosclerosis. Arterioscler Thromb Vasc Biol. (2009) 29:1244–50. doi: 10.1161/ATVBAHA.108.181438
43. Geng, F, and Guo, D. SREBF1/SREBP-1 concurrently regulates lipid synthesis and lipophagy to maintain lipid homeostasis and tumor growth. Autophagy. (2024) 20:1183–5. doi: 10.1080/15548627.2023.2275501
44. Li, X, Li, Y, Yang, W, Xiao, C, Fu, S, Deng, Q, et al. SREBP-1c overexpression induces triglycerides accumulation through increasing lipid synthesis and decreasing lipid oxidation and VLDL assembly in bovine hepatocytes. J Steroid Biochem Mol Biol. (2014) 143:174–82. doi: 10.1016/j.jsbmb.2014.02.009
45. Duan, Y, Gong, K, Xu, S, Zhang, F, Meng, X, and Han, J. Regulation of cholesterol homeostasis in health and diseases: from mechanisms to targeted therapeutics. Signal Transduct Target Ther. (2022) 7:265. doi: 10.1038/s41392-022-01125-5
46. Hibbitt, OC, Mcneil, E, Lufino, MM, Seymour, L, Channon, K, and Wade-Martins, R. Long-term physiologically regulated expression of the low-density lipoprotein receptor in vivo using genomic DNA mini-gene constructs. Mol Ther. (2010) 18:317–26. doi: 10.1038/mt.2009.249
47. Teofilović, A, Vratarić, M, Veličković, N, Vojnovic Milutinovic, D, Mladenovic, A, Prvulovic, M, et al. Late-onset calorie restriction improves lipid metabolism and aggravates inflammation in the liver of old Wistar rats. Front Nutr. (2022) 9:899255. doi: 10.3389/fnut.2022.899255
48. Hajighasem, A, Farzanegi, P, Mazaheri, Z, Naghizadeh, M, and Salehi, G. Effects of resveratrol, exercises and their combination on Farnesoid X receptor, liver X receptor and Sirtuin 1 gene expression and apoptosis in the liver of elderly rats with nonalcoholic fatty liver. PeerJ. (2018) 6:e5522. doi: 10.7717/peerj.5522
49. Sokanovic, SJ, Baburski, AZ, Janjic, MM, Stojkov, NJ, Bjelic, MM, Lalosevic, D, et al. The opposing roles of nitric oxide and cGMP in the age-associated decline in rat testicular steroidogenesis. Endocrinology. (2013) 154:3914–24. doi: 10.1210/en.2013-1307
50. Chen, H, Huhtaniemi, I, and Zirkin, BR. Depletion and repopulation of Leydig cells in the testes of aging brown Norway rats. Endocrinology. (1996) 137:3447–52. doi: 10.1210/endo.137.8.8754773
51. Huang, WJ, Yeh, JY, Tsai, SC, Lin, H, Chiao, YC, Chen, JJ, et al. Regulation of testosterone secretion by prolactin in male rats. J Cell Biochem. (1999) 74:111–8. doi: 10.1002/(SICI)1097-4644(19990701)74:1%3C111::AID-JCB12%3E3.0.CO;2-I
52. Katovich, MJ, Cameron, DF, Murray, FT, and Gunsalus, GL. Alterations of testicular function induced by hyperprolactinemia in the rat. J Androl. (1985) 6:179–89. doi: 10.1002/j.1939-4640.1985.tb00834.x
53. Gao, HB, Shan, LX, Monder, C, and Hardy, MP. Suppression of endogenous corticosterone levels in vivo increases the steroidogenic capacity of purified rat Leydig cells in vitro. Endocrinology. (1996) 137:1714–8. doi: 10.1210/endo.137.5.8612506
54. Geraghty, AC, and Kaufer, D. Glucocorticoid regulation of reproduction. Adv Exp Med Biol. (2015) 872:253–78. doi: 10.1007/978-1-4939-2895-8_11
55. Martin, B, Golden, E, Carlson, OD, Egan, JM, Mattson, MP, and Maudsley, S. Caloric restriction: impact upon pituitary function and reproduction. Ageing Res Rev. (2008) 7:209–24. doi: 10.1016/j.arr.2008.01.002
56. Martins, AD, Jarak, I, Morais, T, Carvalho, RA, Oliveira, PF, Monteiro, MP, et al. Caloric restriction alters the hormonal profile and testicular metabolome, resulting in alterations of sperm head morphology. Am J Physiol Endocrinol Metab. (2020) 318:e33–43. doi: 10.1152/ajpendo.00355.2019
57. Fan, YX, Wang, Z, Ren, CF, Ma, TV, Deng, KP, Li, FZ, et al. Effect of dietary energy restriction and subsequent compensatory feeding on testicular transcriptome in developing rams. Theriogenology. (2018) 119:198–207. doi: 10.1016/j.theriogenology.2018.06.028
58. Hu, J, Zhang, Z, Shen, WJ, and Azhar, S. Cellular cholesterol delivery, intracellular processing and utilization for biosynthesis of steroid hormones. Nutr Metab. (2010) 7:47. doi: 10.1186/1743-7075-7-47
59. Eacker, SM, Agrawal, N, Qian, K, Dichek, LH, Gong, EY, Lee, K, et al. Hormonal regulation of testicular steroid and cholesterol homeostasis. Mol Endocrinol. (2008) 22:623–35. doi: 10.1210/me.2006-0534
60. Quinn, PG, Dombrausky, LJ, Chen, YD, and Payne, AH. Serum lipoproteins increase testosterone production in hCG-desensitized Leydig cells. Endocrinology. (1981) 109:1790–2. doi: 10.1210/endo-109-5-1790
61. Travert, C, Fofana, M, Carreau, S, and Goff, DL. Rat Leydig cells use apolipoprotein E depleted high density lipoprotein to regulate testosterone production. Mol Cell Biochem. (2000) 213:51–9. doi: 10.1023/a:1007178532236
62. Zhang, X, Li, J, Zhou, X, Guan, Q, Zhao, J, Gao, L, et al. Simvastatin decreases sex-hormone levels in male rats. Endocr Pract. (2017) 23:175–81. doi: 10.4158/EP161274, OR
63. Klinefelter, GR, Laskey, JW, and Amann, RP. Statin drugs markedly inhibit testosterone production by rat Leydig cells in vitro: implications for men. Reprod Toxicol. (2014) 45:52–8. doi: 10.1016/j.reprotox.2013.12.010
64. Chen, C, Zhai, H, Huang, G, Cheng, J, Xia, F, Zhao, L, et al. Is lower low-density lipoprotein cholesterol associated with lower androgen and erectile dysfunction in men? Nutr Metab Cardiovasc Dis. (2018) 28:1304–10. doi: 10.1016/j.numecd.2018.08.006
65. Baspinar, O, Bayram, F, Korkmaz, S, Aksu, M, Kocer, D, Sitiki Dizder, O, et al. The effects of statin treatment on adrenal and sexual function and nitric oxide levels in hypercholesterolemic male patients treated with a statin. J Clin Lipidol. (2016) 10:1452–61. doi: 10.1016/j.jacl.2016.09.004
66. Langheinrich, AC, Paradowska, A, Kilinski, R, Kampschulte, M, Steifeld, K, Altinkilic, B, et al. Mixed testicular atrophy related to atherosclerosis: first lessons from the ApoE−/−/LDL receptor−/− double knockout mouse model. Int J Androl. (2012) 35:562–71. doi: 10.1111/j.1365-2605.2011.01228.x
Keywords: testosterone, cholesterol, LDL-C, HDL-C, long-term dietary restriction, short-term dietary restriction
Citation: Sokanovic S, Prvulovic M, Simeunovic V, Pracer S and Mladenovic A (2025) Long-term dietary restriction changes lipid homeostasis and consequently impairs testosterone production in aged Wistar rats. Front. Nutr. 12:1665682. doi: 10.3389/fnut.2025.1665682
Edited by:
Ivana Šarac, Institute for Medical Research, University of Belgrade, SerbiaReviewed by:
Esma Menevse, Selçuk Üniversitesi Tıp Fakültesi Hastanesi, TürkiyeZhaowei Cai, Zhejiang Chinese Medical University, China
Copyright © 2025 Sokanovic, Prvulovic, Simeunovic, Pracer and Mladenovic. This is an open-access article distributed under the terms of the Creative Commons Attribution License (CC BY). The use, distribution or reproduction in other forums is permitted, provided the original author(s) and the copyright owner(s) are credited and that the original publication in this journal is cited, in accordance with accepted academic practice. No use, distribution or reproduction is permitted which does not comply with these terms.
*Correspondence: Srdjan Sokanovic, c3JkamFuLnNva2Fub3ZpY0BpYmlzcy5iZy5hYy5ycw==