 Li-Min Deng1
 Shi-Ping Liu1*Jian-Feng Long1Hui Mo2Min Liu3Ju-Ying Liu4Yun-Lin Zhang5Da-Feng Xu6Hui-Zhi Yu7Li Chen8Hua Cai9Shui-Bing Yang10Min Xiang11Min Liu12Yan Sun13Zhi-Juan Xie14Min-Ming Zeng15Guo-Xin Xie16
- 1Department of Clinical Nutrition, The Second Xiangya Hospital of Central South University, Changsha, Hunan, China
- 2Department of Nutrition, The First People’s Hospital of Changde City, Changde, Hunan, China
- 3Department of Clinical Nutrition, The Third Xiangya Hospital of Central South University, Changsha, Hunan, China
- 4Department of Clinical Nutrition, Xiangya Hospital of Central South University, Changsha, Hunan, China
- 5Department of Nutrition, The Second People’s Hospital of Xiangxiang City, Xiangtan, Hunan, China
- 6Department of Nutrition, The First People’s Hospital of Chenzhou City, Chenzhou, Hunan, China
- 7Department of Nutrition, The People’s Hospital of Yueyang City, Yueyang, Hunan, China
- 8Department of Nutrition, Zhuzhou Central Hospital, Zhuzhou, Hunan, China
- 9Department of Nutrition, The People’s Hospital of Hunan Province, Changsha, Hunan, China
- 10Department of Nutrition, The First People’s Hospital of Huaihua City, Huaihua, Hunan, China
- 11Department of Nutrition, The First People’s Hospital of Henyang City, Henyang, Hunan, China
- 12Department of Nutrition, Shaoyang Central Hospital, Shaoyang, Hunan, China
- 13Department of Nutrition, Changsha Central Hospital of University of South China, Changsha, Hunan, China
- 14Department of Nutrition, The First Affiliated Hospital of University of South China, Henyang, Hunan, China
- 15Department of Nutrition, The First Affiliated Hospital of Shaoyang University, Shaoyang, Hunan, China
- 16Department of Nutrition, Xiangtan Central Hospital, Xiangtan, Hunan, China
Background: To investigate the current status of nutritional risk, malnutrition, and nutritional therapy among hospitalized patients in Hunan Province, in order to provide evidence for optimizing clinical nutrition decision-making.
Methods: A multi-stage continuous sampling method was applied to survey hospitalized patients across 16 hospitals in Hunan Province from March 2022 to August 2023. Nutritional risk was assessed using the Nutritional Risk Screening 2002 (NRS2002), while malnutrition was diagnosed according to the Global Leadership Initiative on Malnutrition (GLIM) criteria. Nutritional intervention status during hospitalization was recorded.
Results: Among 3,189 participants, 36.4% (1,160/3,189) were identified as being at nutritional risk (NRS2002 ≥ 3), and of these, 68.2% (791/1,160) were diagnosed with malnutrition. Malnourished patients were older (65 ± 15 vs. 60 ± 13 years, p < 0.01), had lower BMI (20.2 ± 3.9 vs. 23.8 ± 3.5, p < 0.01), and incurred higher hospitalization costs (¥12,448.3 ± 12,064.3 vs. ¥10,070.3 ± 12,568.4, p = 0.038). High prevalence of nutritional risk and malnutrition was observed in infectious diseases, oncology, hematologic disorders, and respiratory diseases (prevalence>40%). Although 88.5% of malnourished patients received nutritional interventions, 10.9% received no support. Furthermore, 51.2% of patients without nutritional risk received unnecessary nutritional interventions.
Conclusion: This study underscores a dual challenge in clinical nutritional management: insufficient support for high-risk patients alongside the overuse of nutritional therapy in low-risk populations. There is an urgent need to implement standardized protocols for screening, assessment, diagnosis, intervention, and monitoring to improve clinical outcomes and promote the rational allocation of healthcare resources.
Clinical trial registration: https://www.clinicaltrials.gov/study/NCT05694104? term=NCT05694104&rank=1, Identifier NCT05694104.
Introduction
Nutritional risk is defined as the existing or potential likelihood of adverse clinical outcomes associated with nutrition-related factors. The Nutrition Risk Screening 2002 (NRS 2002), recommended by the European Society for Clinical Nutrition and Metabolism (ESPEN), is the first evidence-based nutritional assessment and screening tool developed for hospitalized patients (1, 2). In 2018, the Global Leadership Initiative on Malnutrition (GLIM), established by four major international nutrition societies, introduced standardized criteria for malnutrition assessment, which were subsequently updated in April 2025 (3, 4). The GLIM criteria represent a major advancement in malnutrition diagnosis by offering a standardized, evidence-based, and globally applicable framework. Their use improves the accuracy of diagnosis, enhances the prediction of clinical outcomes, and facilitates targeted interventions. In this study, NRS 2002 was employed to screen the nutritional risk of inpatients across 16 hospitals in Hunan Province in China. Patients identified at risk were further assessed using the GLIM criteria. Additionally, the current status of nutritional support was examined and analyzed. The findings aim to provide a reference for optimizing clinical nutritional decision-making in hospitalized patients.
A consecutive fixed-site sampling approach was adopted to survey newly admitted inpatients at 16 hospitals across Hunan Province, including Xiangya Hospital of Central South University, the Second Xiangya Hospital of Central South University, Hunan Provincial People’s Hospital, and the First People’s Hospital of Changde City et al., from March 2022 to August 2023. This study was conducted as part of the National Nutrition Data Survey project overseen by the National Health Commission.
Inclusion criteria: (1) patients aged 18–90 years old; (2) hospitalization within 24–48 h, non-emergency patients; (3) provision of informed consent.
Exclusion criteria: (1) inpatients with mental illnesses or memory disorders who were unabe to answer the questions correctly; (2) critically ill inpaients and those who lacked behavioral abilities.
Methods
A total of 16 secondary and tertiary hospitals were selected for the study. At each site, researchers employed a continuous convenience sampling approach from the initiation date until a predetermined sample size was achieved (total N = 200, with at least 25 cases per systemic disease category). Trained nutritionists or clinicians conducted structured face-to-face interviews with each participant using a validated case report form (CRF). Data collected encompassed patient demographics (gender, age, ethnicity, education level), admission and discharge dates, emergency admission status, primary diagnosis, anthropometric measures (height, weight, body mass index, waist and hip circumferences), laboratory test results, body composition analyses, NRS 2002 screening scores, GLIM-based nutritional diagnoses, types of in-hospital nutritional interventions, clinical outcomes at discharge, and total hospitalization costs. Nutritional interventions comprised standard hospital diet, oral nutritional supplements (ONS), enteral nutrition via tube feeding, and parenteral nutrition. The latter involved intravenous administration of amino acids, fat emulsions, dextrose, or total nutrient admixtures (TNA).
Statistics
Statistical analyses were performed using SPSS software (version 27.0). Categorical variables were summarized as frequencies and percentages, and group comparisons were made using the chi-square (χ2) test. Continuous variables were expressed as mean ± standard deviation (SD), and intergroup differences were assessed using the Student’s t-test. A p-value below 0.05 was considered statistically significant.
Results
Characteristics of the study population
A total of 3,189 hospitalized patients from across Hunan Province were included in this study. Among them, 1,160 patients (36.4%) were identified as being at nutritional risk, defined by an NRS-2002 score ≥3. According to the GLIM criteria, which require the presence of nutritional risk (NRS-2002 score ≥3) plus at least one phenotypic and one etiologic criterion, 791 patients (24.8%) were diagnosed with malnutrition. The study population had a mean age of 61 years, with 1863 participants (58.4%) being male and 1,326 (41.6%) female. Compared to non-malnourished patients, those in the malnourished group were older, had a lower body mass index (BMI), and showed significantly reduced hemoglobin and albumin levels. Additionally, total hospitalization costs were higher among malnourished patients. Nutritional interventions were provided to 88.5% of malnourished patients, while 10.9% received no form of nutritional support. Among non-malnourished patients, 51.2% also received nutritional interventions. Detailed results are presented in Table 1.
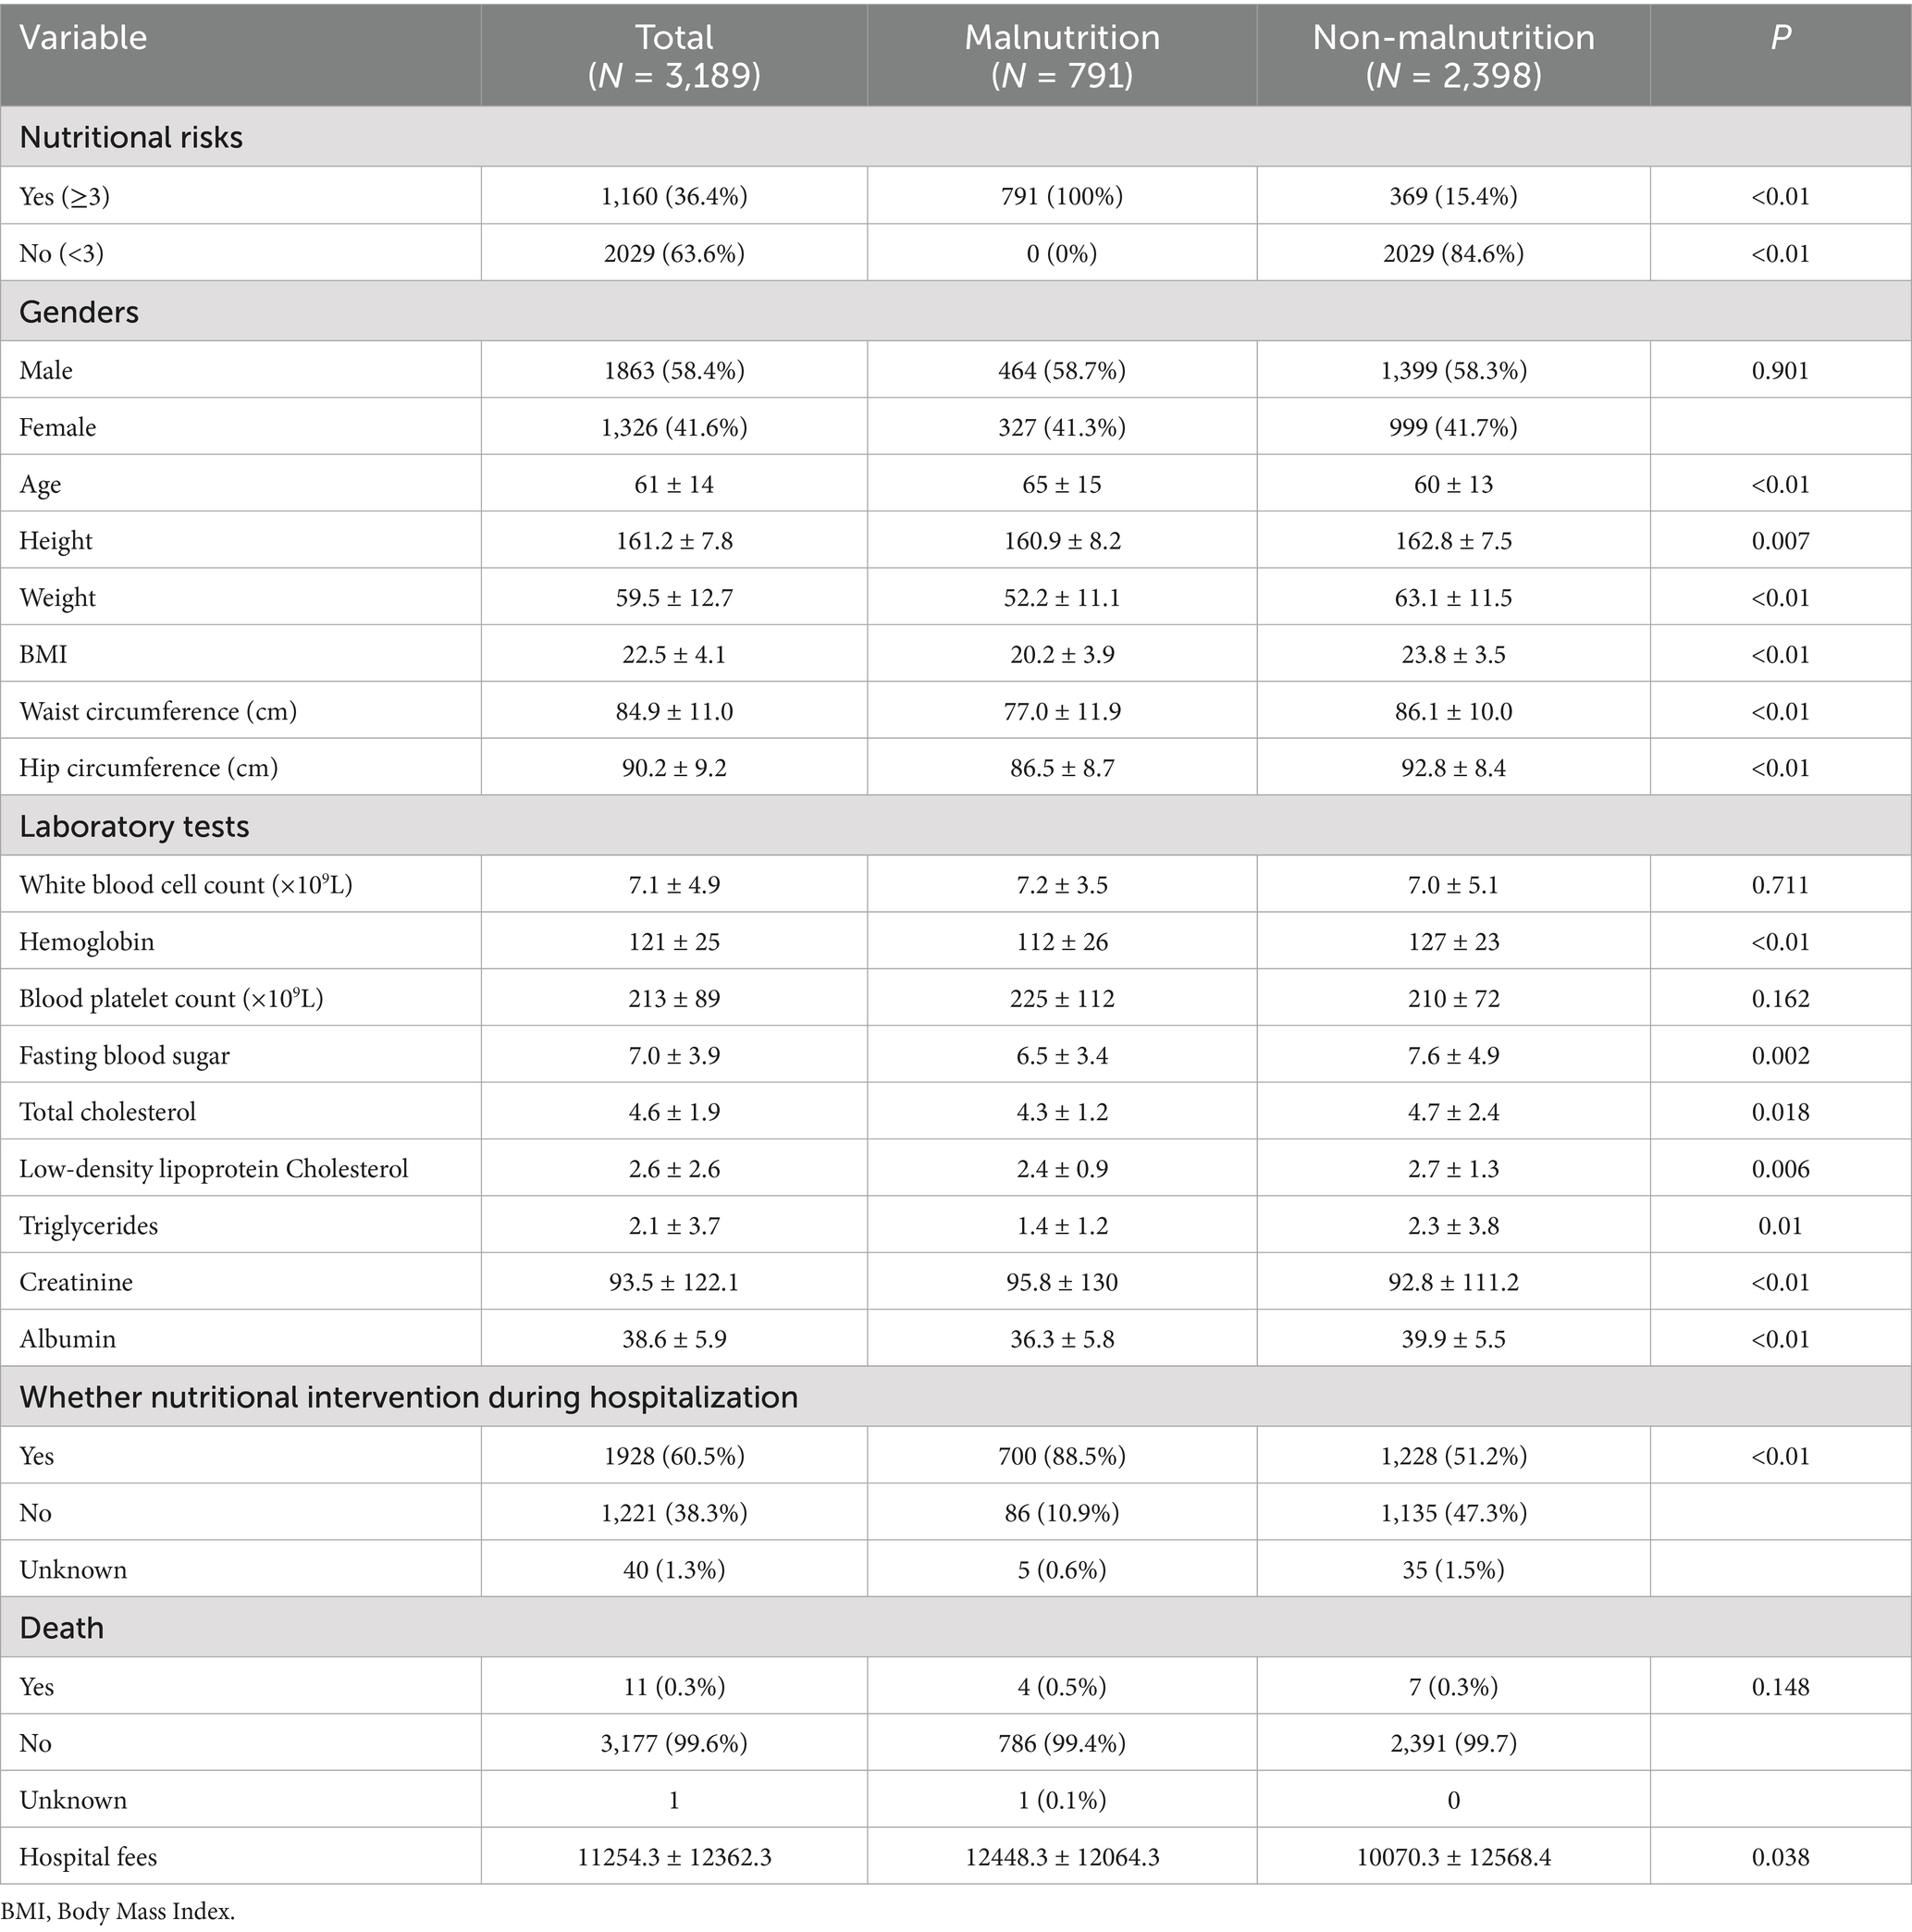
Table 1. Baseline characteristics of hospitalized patients in Hunan province.
Nutritional risk screening results
Among the patients surveyed in Hunan Province, 1,160 were identified as being at nutritional risk (NRS-2002 score≥3). The study population was stratified by primary disease diagnosis. Compared with patients not at nutritional risk, those identified as at risk showed significantly higher proportions of infectious and contagious diseases, malignancies, hematologic and hematopoietic disorders, respiratory diseases, digestive system diseases, musculoskeletal disorders, immune system diseases, and malnutrition-related conditions (all p < 0.05). Conversely, a significantly lower proportion of at-risk patients were diagnosed with endocrine, nutritional and metabolic disorders, as well as circulatory system diseases (all p < 0.05), as detailed in Table 2.
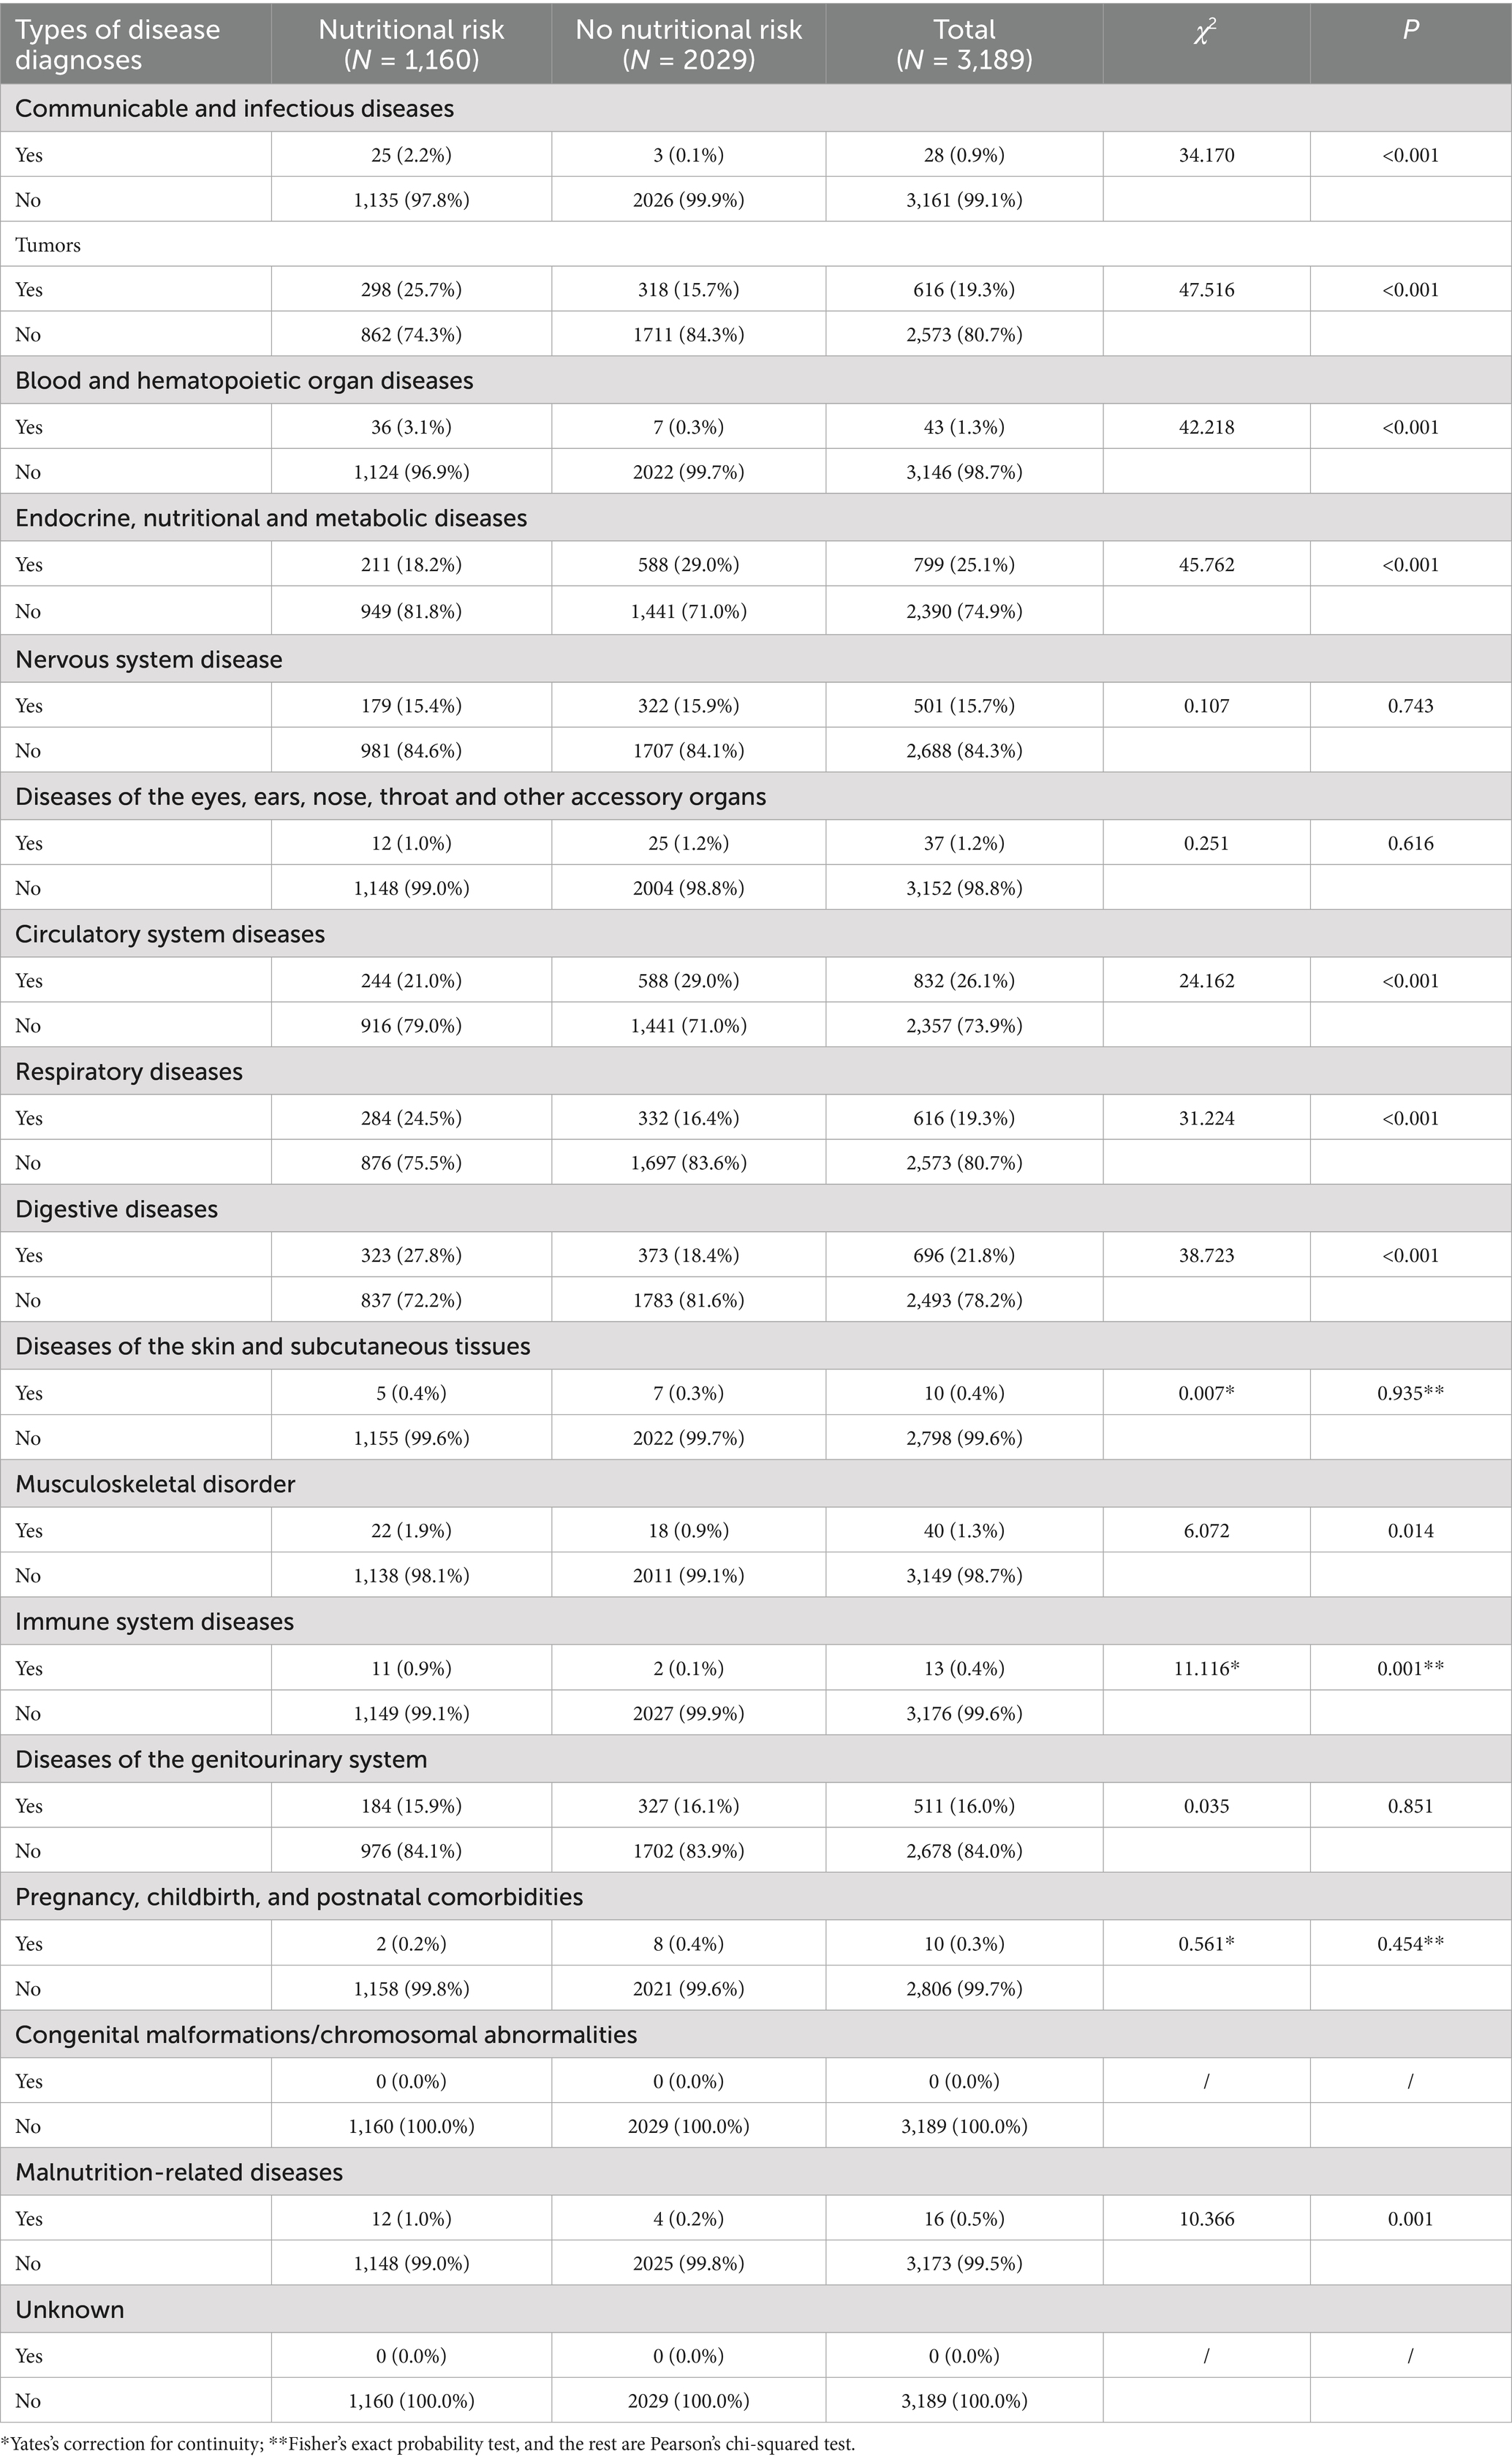
Table 2. Nutritional risk identified by NRS-2002 among patients with different disease diagnoses.
Furthermore, disease categories with a nutritional risk prevalence exceeding 40% included infectious and contagious diseases, immune system disorders, blood and hematopoietic organ diseases, malnutrition-related conditions, musculoskeletal disorders, malignancies, digestive diseases, respiratory diseases, and disorders of the skin and subcutaneous tissue, as illustrated in Figure 1.
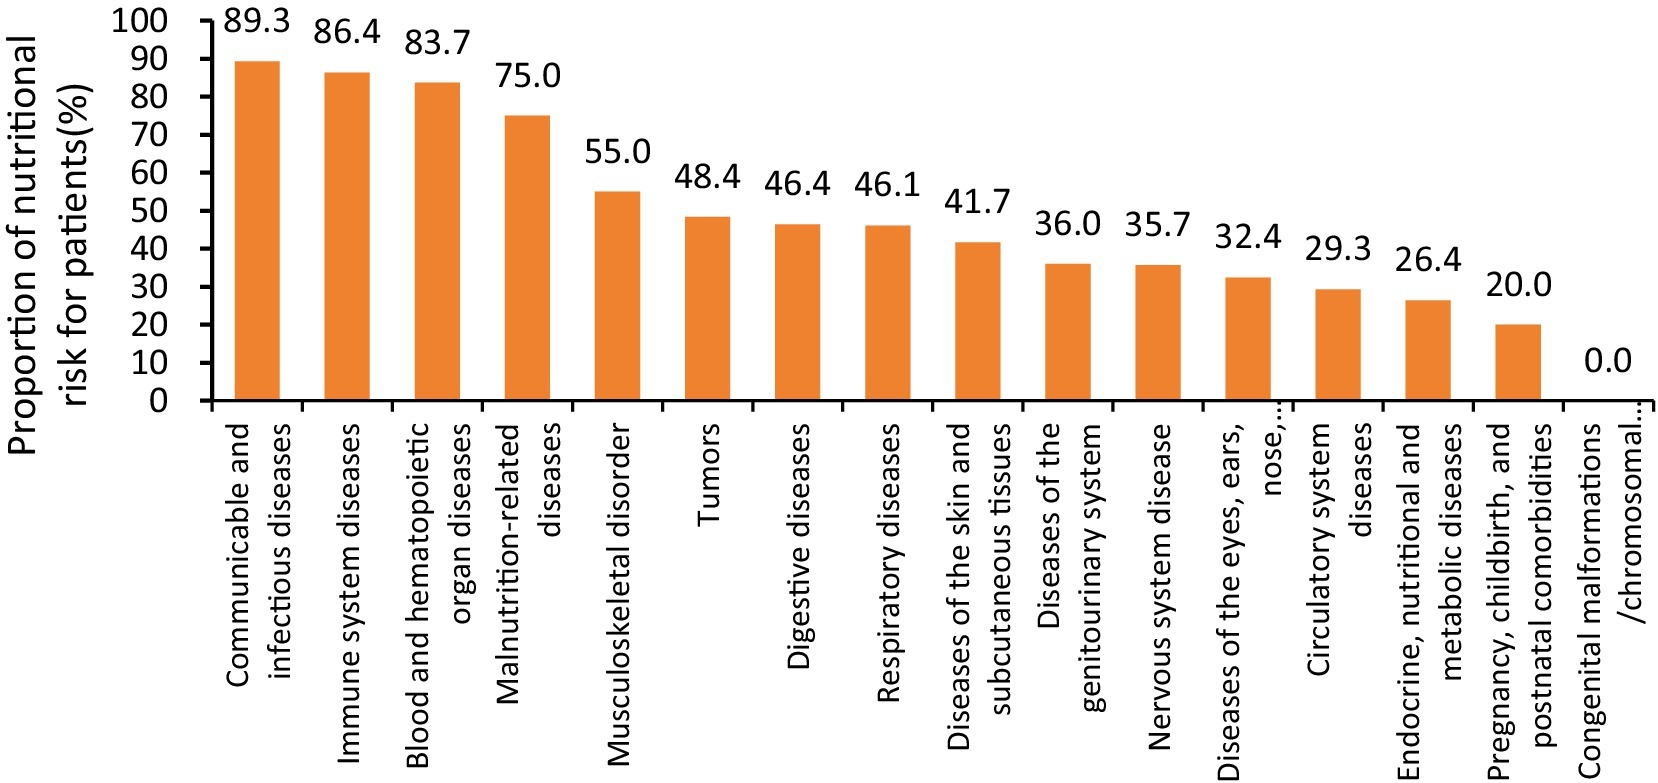
Figure 1. NRS 2002 nutritional risk among patients with different disease diagnosis types.
Malnutrition outcomes
According to the GLIM criteria for malnutrition diagnosis—which require the presence of nutritional risk (NRS-2002 score≥3), along with at least one phenotypic indicator and one etiologic indicator—a total of 791 patients (24.8%) in Hunan Province were diagnosed with malnutrition. The surveyed patients were stratified by primary disease diagnosis. Compared to patients without nutritional risk, those with nutritional risk were significantly more likely to be diagnosed with infectious and contagious diseases, malignancies, blood and hematopoietic organ diseases, respiratory diseases, digestive system diseases, immune system disorders, and malnutrition-related conditions (all p < 0.05). Conversely, lower proportions of nutritional risk were observed among patients with endocrine, nutritional and metabolic diseases, as well as circulatory system diseases (all p < 0.05), as shown in Table 3.
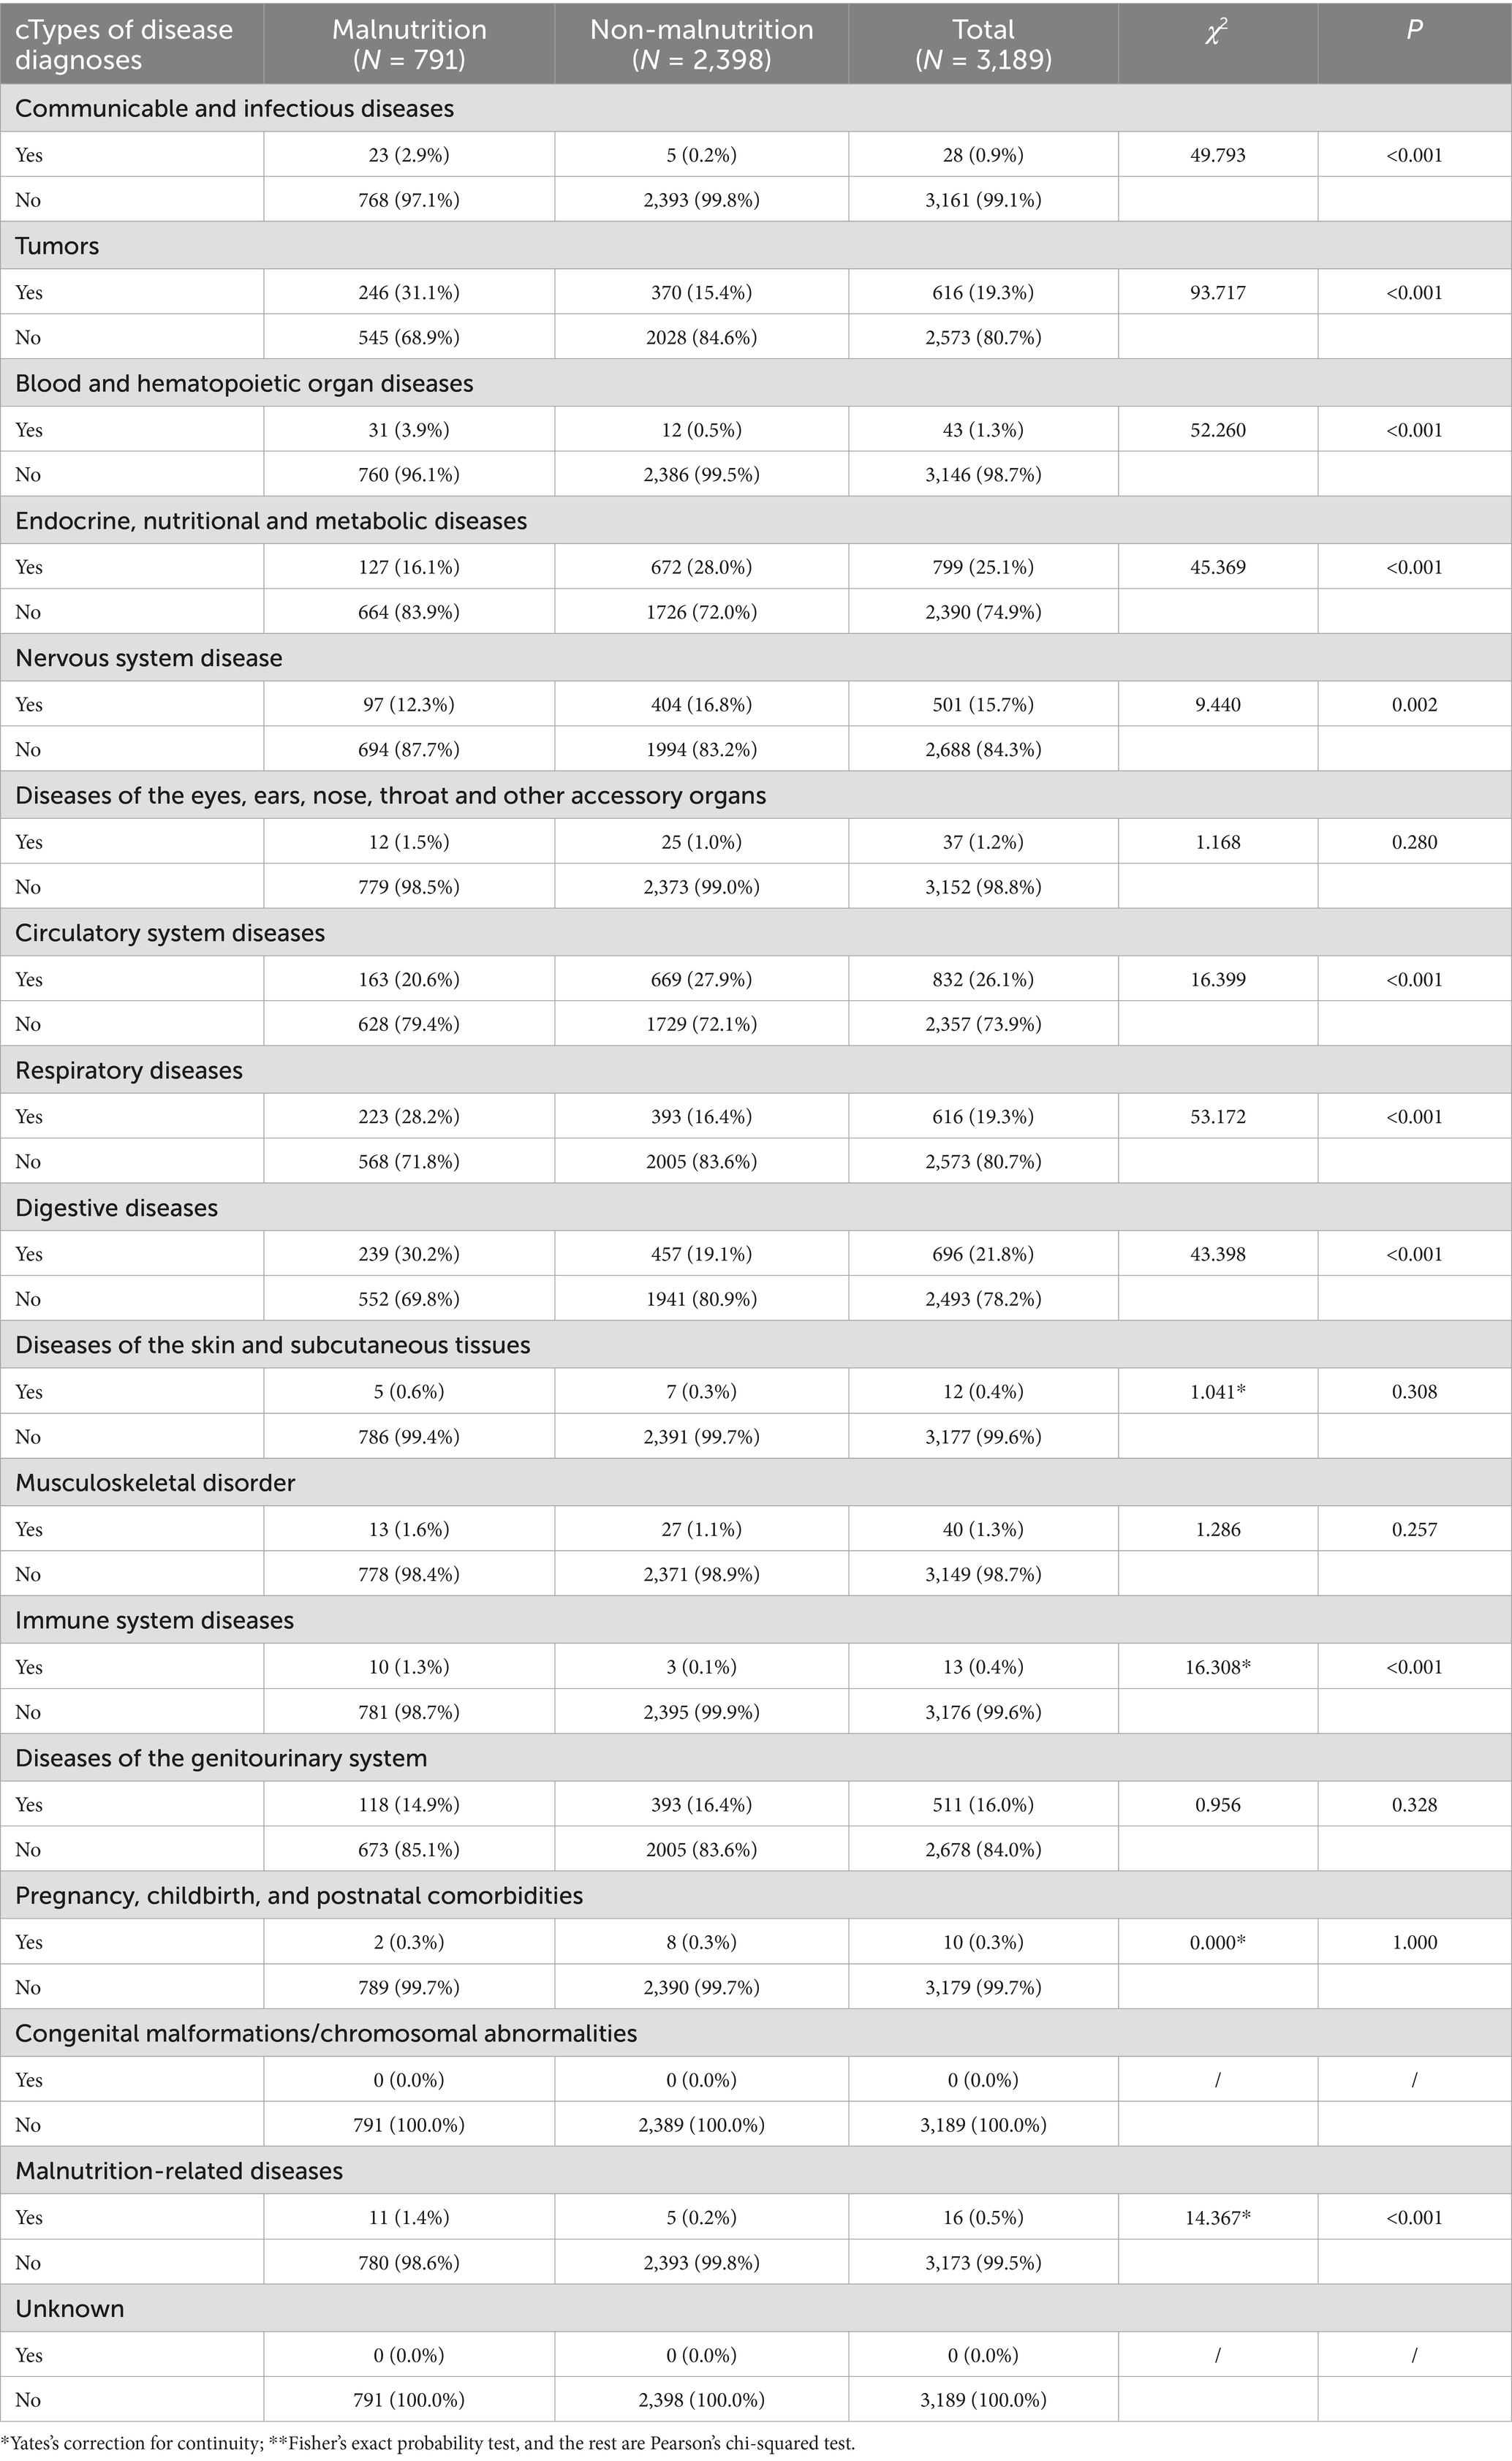
Table 3. Malnutrition of GLIM in patients with different disease diagnosis types.
Furthermore, disease types with a malnutrition prevalence exceeding 30% included: infectious and contagious diseases, immune system disorders, blood and hematopoietic organ diseases, malnutrition-related conditions, skin and subcutaneous tissue disorders, tumors, respiratory diseases, digestive system diseases, musculoskeletal disorders, and diseases of the eyes, ears, nose, throat, and other accessory organs, as illustrated in Figure 2.
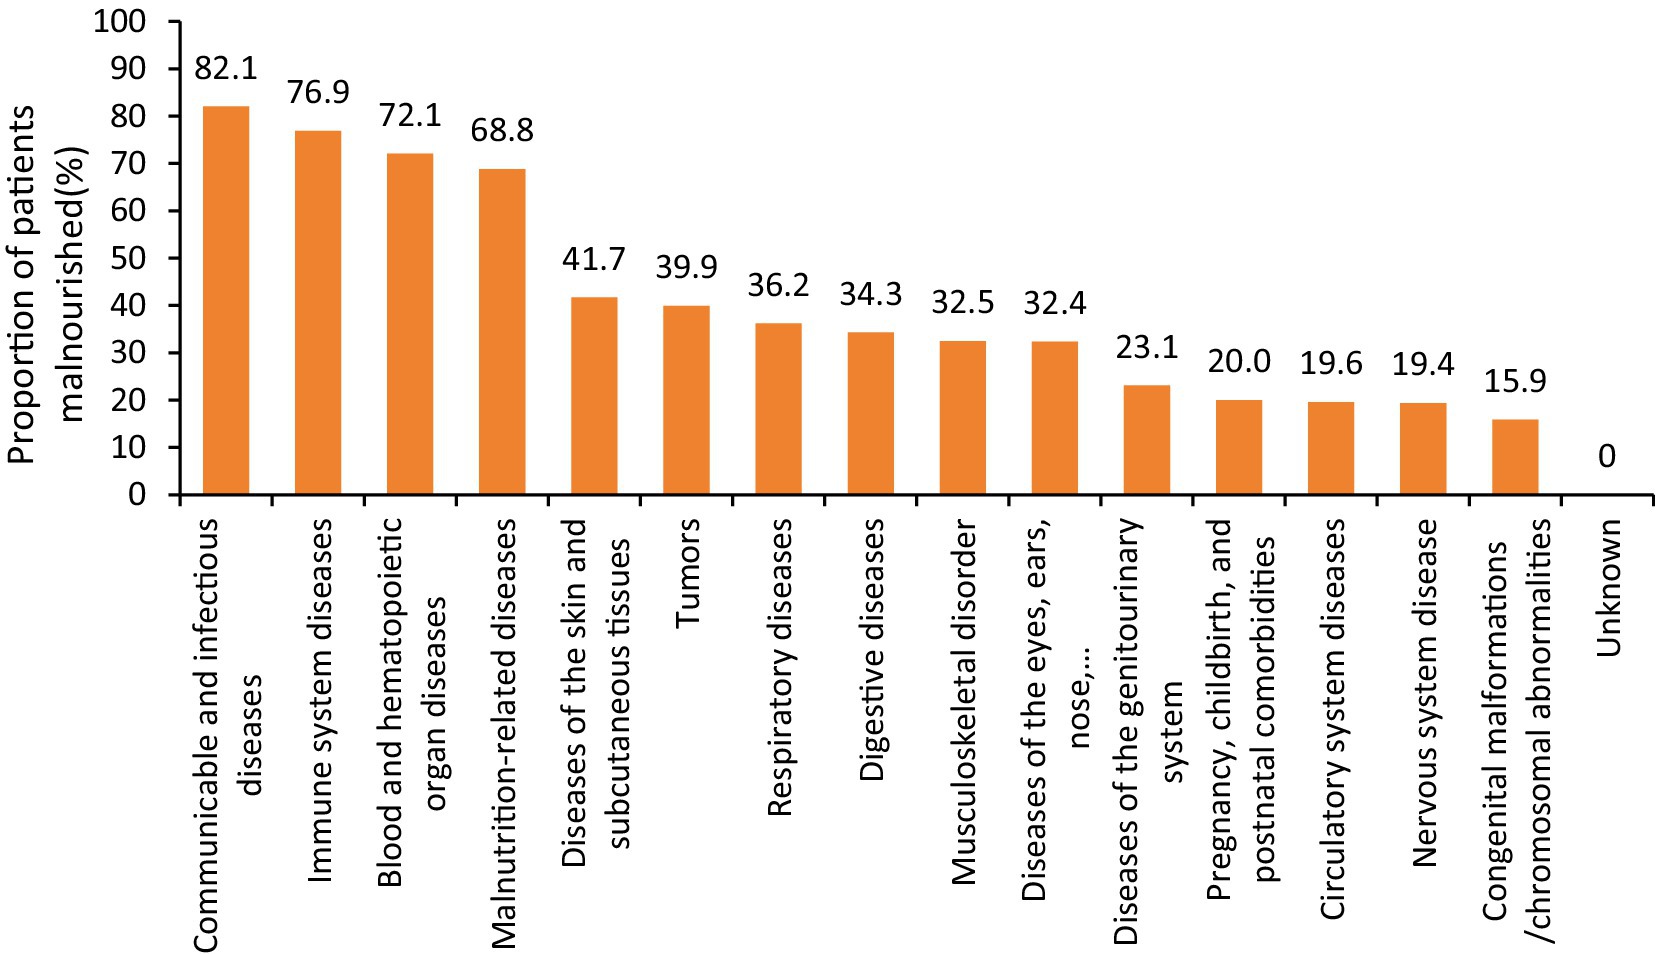
Figure 2. Malnutrition of GLIM in patients with different disease diagnosis types.
Status of nutritional therapy
During hospitalization, a total of 1,928 patients (60.5%) received nutritional therapy interventions, while 1,221 patients (38.2%) did not receive any nutritional intervention, and the intervention status was unknown for 40 patients. Among those identified as being at nutritional risk, 83.3% received nutritional therapy, while 16.7% did not. Additionally, 48.5% of patients without nutritional risk received nutritional interventions. Among patients diagnosed with malnutrition according to the GLIM criteria, 89.1% received nutritional therapy, whereas 10.9% did not receive any intervention. By contrast, 51.2% of non-malnourished patients received nutritional support. Detailed data are presented in Table 4.
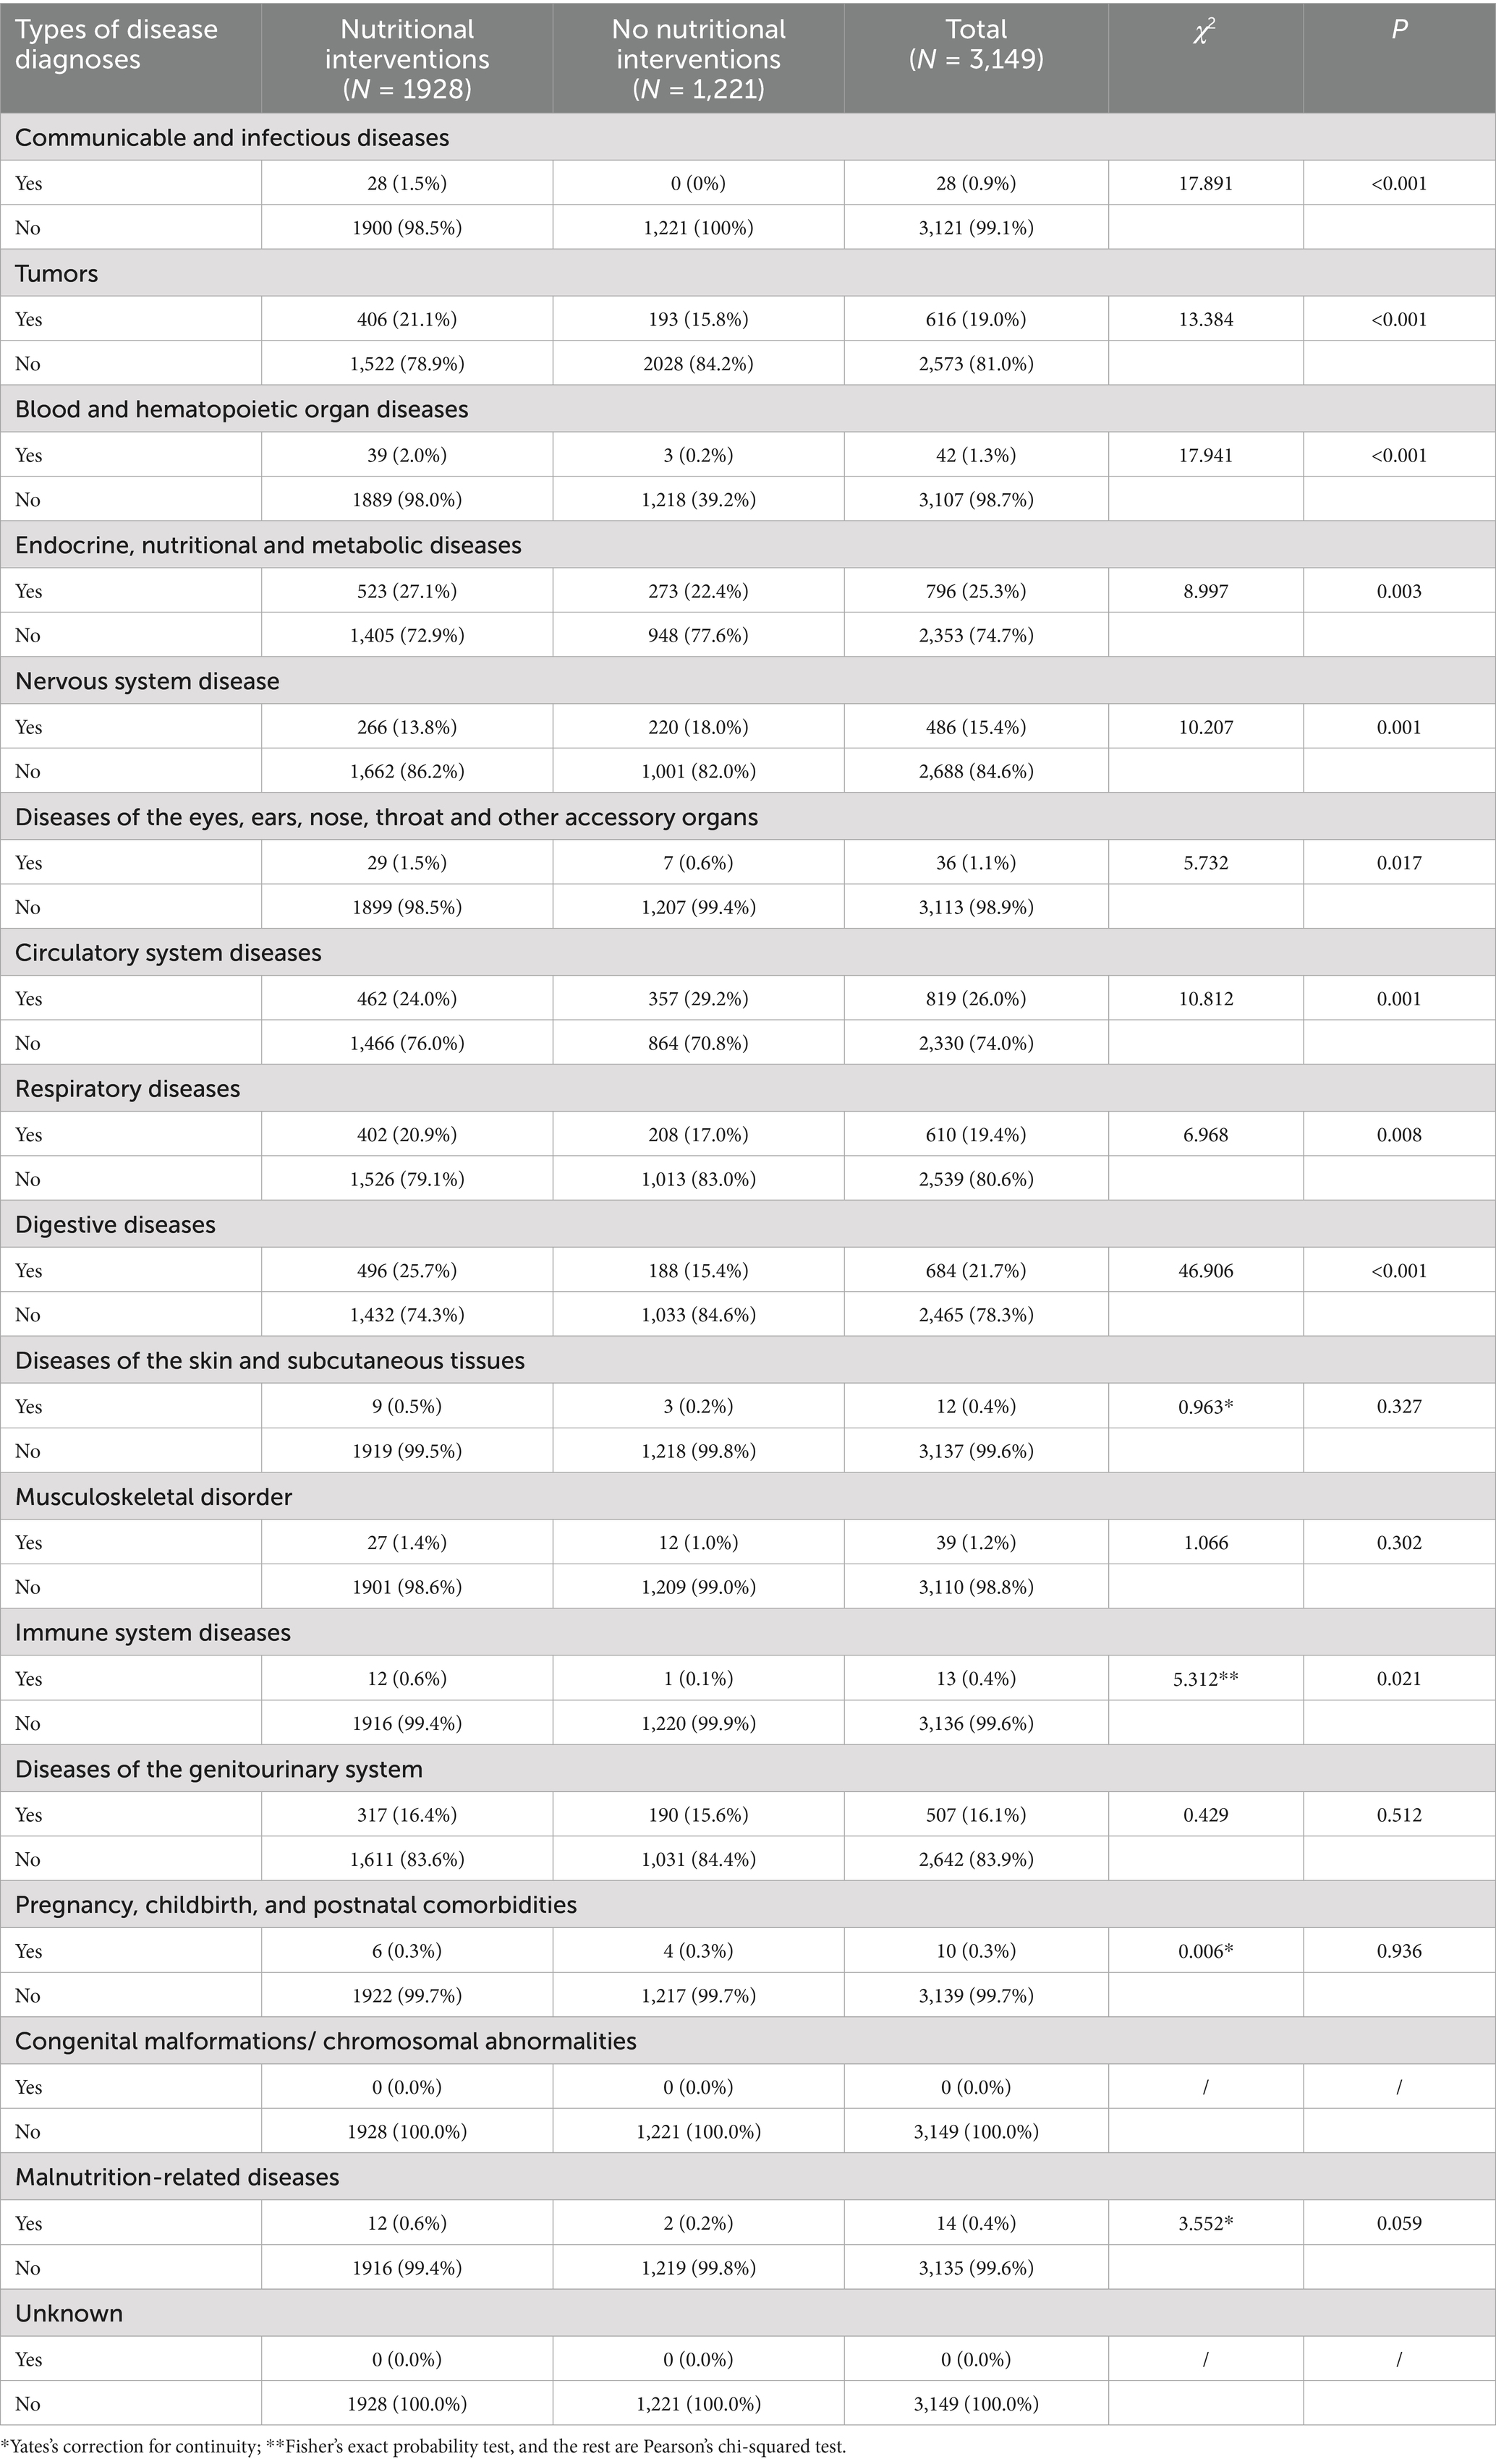
Table 4. Nutritional interventions for patients with different types of disease diagnosis.
A stratified analysis based on disease diagnosis type (excluding cases with unknown intervention status) revealed that, compared with patients who did not receive nutritional therapy, a significantly higher proportion of those who received nutritional interventions were diagnosed with infectious and contagious diseases, blood and hematopoietic organ diseases, immune system disorders, and diseases of the eyes, ears, nose, throat, and other accessory organs (all p < 0.05). In contrast, lower proportions of nutritional therapy were observed among patients with nervous system diseases and circulatory system diseases (both p < 0.05), as shown in Table 4. Moreover, disease categories with the highest rates of nutritional intervention (over 80%) included infectious and contagious diseases, blood and hematopoietic organ diseases, immune system diseases, malnutrition-related conditions, and diseases of the eyes, ears, nose, throat, and other accessory organs, as illustrated Figure 3.
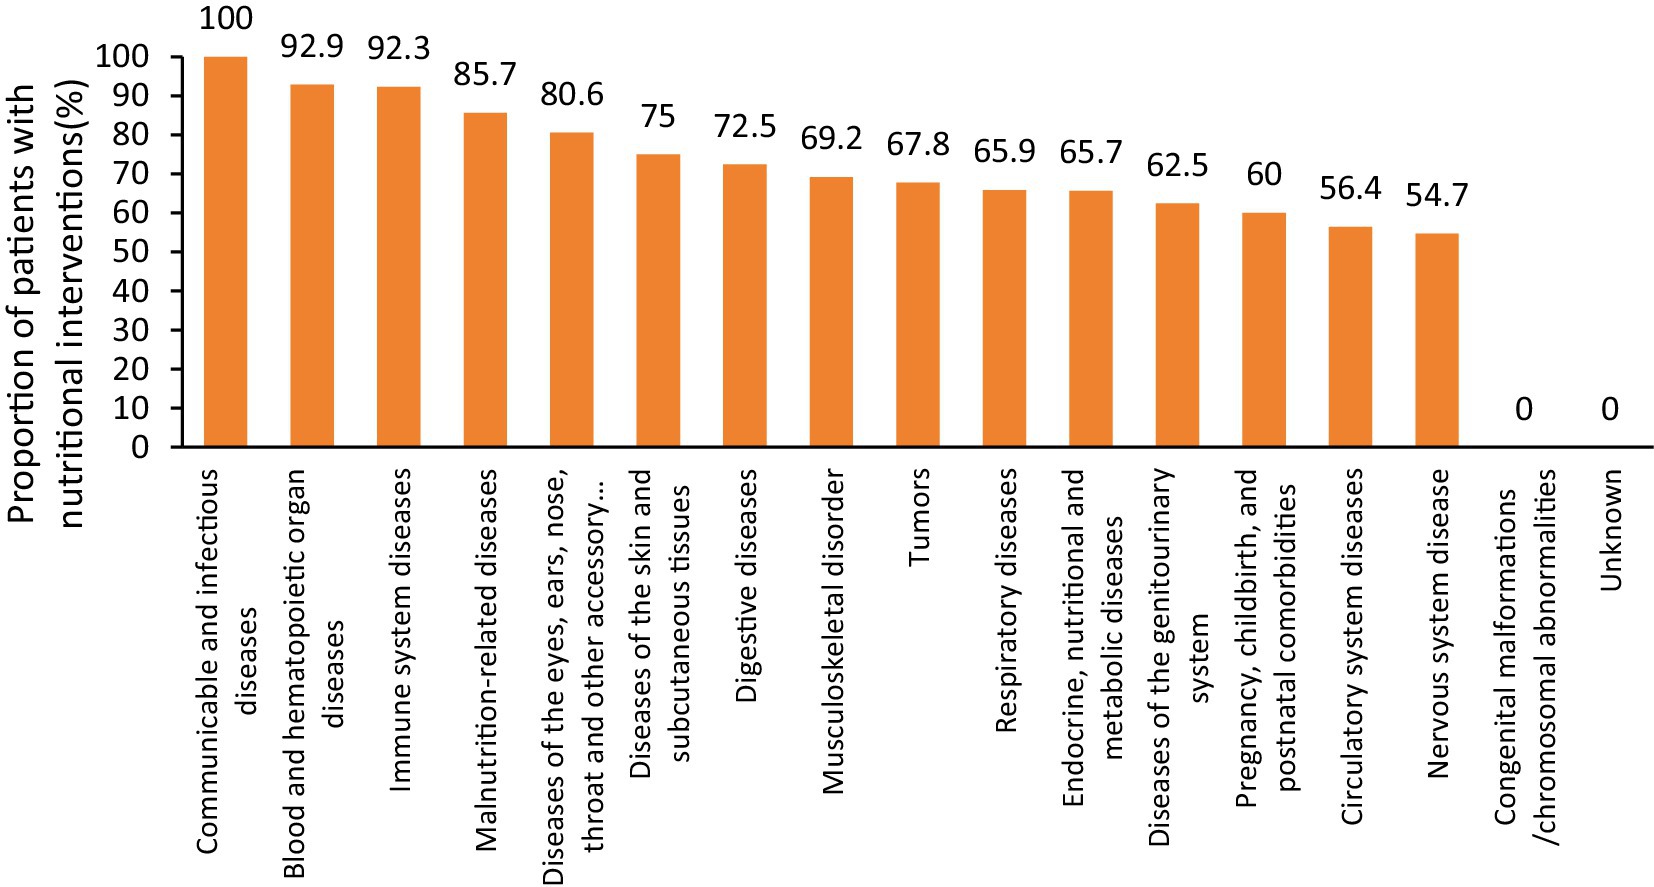
Figure 3. The proportion of nutritional intervention for patients with different disease diagnosis types.
Conclusion
The NRS2002 is applicable for large-scale clinical nutritional risk screening. However, it has limitations in patients who are unconscious, have communication difficulties, cannot stand, or have edema/ascites, as these conditions impede accurate body mass measurement. In such cases, biochemical indicators should be used to guide appropriate nutritional therapy. This study found that 36.4% of hospitalized patients in Hunan Province were at nutritional risk. Stratified analysis by primary disease diagnosis showed that patients with infectious diseases, malignancies, hematologic and hematopoietic disorders, respiratory diseases, digestive system diseases, musculoskeletal conditions, immune-related diseases, and diseases related to malnutrition had significantly higher rates of nutritional risk and were more frequently diagnosed with malnutrition.
The GLIM criteria, as a standardized diagnostic framework, have been validated in prior studies to possess high sensitivity and specificity in hospital settings. They effectively identifying malnutrition prevalence and severity while aligning with other validated screens, making them suitable for standardized diagnosis and predicting clinical outcomes (5). Shi et al. (6) found that the GLIM criteria can identify malnutrition in elderly cancer patients and predict survival more accurately than traditional TNM classification for 1–2 year estimates. Yilmaz et al. (7) reported 82% of hematological malignancy patients were at risk via NRS-2002, with 25.8% diagnosed as malnourished by GLIM; this group had a 41.7% 1-year mortality rate, and malnutrition was an independent mortality risk factor regardless of age or disease duration. These findings support the use of GLIM as a predictive tool for patients’ outcome. In our study, 68.2% of patients identified as being at nutritional risk were diagnosed with malnutrition, including 68.8% of those with blood and hematopoietic organ diseases—a proportion higher than reported by Yilmaz et al.
This study revealed that 60.5% of hospitalized patients received nutritional therapy, while 38.2% did not. Among patients diagnosed with malnutrition, 88.5% received nutritional support—reflecting clinical recognition of its importance in this high-risk group. However, the substantial underutilization in the broader patient population underscores the need to improve systematic nutritional risk screening. Furthermore, 51.2% of patients without nutritional risk still received nutritional interventions, suggesting possible overtreatment and inefficient allocation of medical resources. These findings reveal inconsistencies in nutritional care practices within hospitals in Hunan Province and emphasize the urgency of implementing standardized, evidence-based clinical protocols.
In summary, over one-third of hospitalized patients were identified as being at nutritional risk, with the majority meeting the diagnostic criteria for malnutrition. Providing timely nutritional support to these high-risk patients can help reduce complications, accelerate recovery, and decrease hospitalization costs. Conversely, the provision of nutritional therapy to more than half of patients without nutritional risk indicates a substantial misallocation of healthcare resources. It is essential to strengthen nutritional care quality control and enhance professional training at both institutional and provincial levels. Clinical staff working in high-risk departments should adhere to standardized protocols covering screening, assessment, diagnosis, intervention, and monitoring. Implementing evidence-based and individualized nutritional care plans will improve patient outcomes and increase the efficiency of medical resource utilization.
Data availability statement
The raw data supporting the conclusions of this article will be made available by the authors, without undue reservation.
Ethics statement
The studies involving humans were approved by Ethics Committee of Xiangya Hospital, Central South University. The studies were conducted in accordance with the local legislation and institutional requirements. The participants provided their written informed consent to participate in this study.
Author contributions
L-MD: Investigation, Methodology, Software, Supervision, Writing – original draft, Writing – review & editing. S-PL: Conceptualization, Data curation, Writing – original draft. J-FL: Investigation, Methodology, Project administration, Writing – review & editing. HM: Resources, Software, Supervision, Writing – review & editing. ML (Third author): Data curation, Funding acquisition, Visualization, Writing – review & editing. J-YL: Formal analysis, Funding acquisition, Resources, Writing – review & editing. Y-LZ: Funding acquisition, Project administration, Writing – review & editing. D-FX: Supervision, Validation, Writing – review & editing. H-ZY: Data curation, Formal analysis, Writing – review & editing. LC: Methodology, Project administration, Writing – review & editing. HC: Formal analysis, Project administration, Writing – review & editing. S-BY: Conceptualization, Supervision, Writing – review & editing. MX: Data curation, Writing – review & editing. ML (Twelfth author): Data curation, Writing – review & editing. YS: Formal analysis, Funding acquisition, Writing – review & editing. Z-JX: Formal analysis, Project administration, Writing – review & editing. M-MZ: Methodology, Project administration, Writing – review & editing. G-XX: Conceptualization, Funding acquisition, Writing – review & editing.
Funding
The author(s) declare that financial support was received for the research and/or publication of this article. This work was supported by Project (Grant no. 2023JJ40813) supported by the Natural Science Foundation of Hunan Province; the Scientific Research Launch Project for new employees of the Second Xiangya Hospital of Central South University.
Conflict of interest
The authors declare that the research was conducted in the absence of any commercial or financial relationships that could be construed as a potential conflict of interest.
Generative AI statement
The authors declare that no Gen AI was used in the creation of this manuscript.
Any alternative text (alt text) provided alongside figures in this article has been generated by Frontiers with the support of artificial intelligence and reasonable efforts have been made to ensure accuracy, including review by the authors wherever possible. If you identify any issues, please contact us.
Publisher’s note
All claims expressed in this article are solely those of the authors and do not necessarily represent those of their affiliated organizations, or those of the publisher, the editors and the reviewers. Any product that may be evaluated in this article, or claim that may be made by its manufacturer, is not guaranteed or endorsed by the publisher.
References
1. Tang, W, Li, C, Huang, D, Zhou, S, Zheng, H, Wang, Q, et al. NRS2002 score as a prognostic factor in solid tumors treated with immune checkpoint inhibitor therapy: a real-world evidence analysis. Cancer Biol Ther. (2024) 25:2358551. doi: 10.1080/15384047.2024.2358551
2. Chinese Society for Parenteral and Enteral Nutrition, Chinese Society of Clinical Nutrition, China International Healthcare. Guidelines for the diagnosis and application of malnutrition in adult patients (2025 edition). Natl Med J China. (2025) 105:953–80. doi: 10.3760/cma.j.cn112137-20241212-02810
3. Cederholm, T, Jensen, GL, Correia, MITD, Gonzalez, MC, Fukushima, R, Pisprasert, V, et al. The GLIM consensus approach to diagnosis of malnutrition: a 5-year update. Clin Nutr. (2025) 49:11–20. doi: 10.1016/j.clnu.2025.03.018
4. Cederholm, T, Jensen, GL, Correia, MITD, Gonzalez, MC, Fukushima, R, Higashiguchi, T, et al. Glim criteria for the diagnosis of malnutrition – a consensus report from the global clinical nutrition community. Clin Nutr. (2019) 38:1–9. doi: 10.1016/j.clnu.2018.08.002
5. Cederholm, T, Jensen, GL, Correia, MITD, Gonzalez, MC, Fukushima, R, Higashiguchi, T, et al. Glim criteria to identify malnutrition in patients in hospital settings: a systematic review. J Parenter Enter Nutr. (2023) 47:702–9. doi: 10.1002/jpen.2533
6. Zhang, X, Tang, M, Zhang, Q, Zhang, K-P, Guo, Z-Q, Xu, H-X, et al. The GLIM criteria as an effective tool for nutrition assessment and survival prediction in older adult cancer patients. Clin Nutr. (2021) 40:1224–32. doi: 10.1016/j.clnu.2020.08.004
Keywords: hospitalized patients, nutritional risk, malnutrition, nutritional therapy, GLIM criteria
Citation: Deng L-M, Liu S-P, Long J-F, Mo H, Liu M, Liu J-Y, Zhang Y-L, Xu D-F, Yu H-Z, Chen L, Cai H, Yang S-B, Xiang M, Liu M, Sun Y, Xie Z-J, Zeng M-M and Xie G-X (2025) Prevalence of malnutrition and appropriateness of nutritional support in hospitalized patients: a GLIM-based study. Front. Nutr. 12:1667821. doi: 10.3389/fnut.2025.1667821
Edited by:
Thomai Karagiozoglou-Lampoudi, International Hellenic University, GreeceReviewed by:
Nurul Ratna Mutu Manikam, University of Indonesia, IndonesiaBatoul Khoundabi, Iranian Red Crescent Society, Iran
Copyright © 2025 Deng, Liu, Long, Mo, Liu, Liu, Zhang, Xu, Yu, Chen, Cai, Yang, Xiang, Liu, Sun, Xie, Zeng and Xie. This is an open-access article distributed under the terms of the Creative Commons Attribution License (CC BY). The use, distribution or reproduction in other forums is permitted, provided the original author(s) and the copyright owner(s) are credited and that the original publication in this journal is cited, in accordance with accepted academic practice. No use, distribution or reproduction is permitted which does not comply with these terms.
*Correspondence: Shi-Ping Liu, c2hpcGluZ2xpdTExOUAxMjYuY29t