 Qiulu Huang
 Haifang Zhou1
- 1Department of Nursing, Hangzhou TCM Hospital Affiliated to Zhejiang Chinese Medical University, Xihu District, Hangzhou, Zhejiang Province, China
- 2Department of Clinical Psychology, Hangzhou TCM Hospital Affiliated to Zhejiang Chinese Medical University, Xihu District, Hangzhou, Zhejiang Province, China
- 3Department of Nursing School, Anhui University of Chinese Medicine, Hefei, China
Background: This study investigated the relationship between depression and constipation and examined potential mediating roles of dietary inflammatory index (DII) and socioeconomic status using data from NHANES 2005–2010.
Methods: We analyzed 12,854 adults with complete data on depression (PHQ-9), constipation (self-report/Bristol Stool Scale), DII (27 nutrients), and poverty-to-income ratio (PIR). Statistical analyses included multivariable logistic regression with appropriate reference categories, restricted cubic splines (RCS), mediation analysis, and subgroup assessments.
Results: Constipated individuals exhibited significantly higher depression severity (mean PHQ-9: 4.25 vs. 3.00), higher DII (2.00 vs. 1.37), and lower PIR (all p < 0.0001). After adjustments, PHQ-9 scores were independently associated with constipation risk (OR: 1.04, 95% CI: 1.03–1.06), with a non-linear relationship showing an inflection point at PHQ-9 = 10 (scores <10: OR = 1.08; scores ≥10: OR = 0.98). Statistical mediation analysis revealed that DII mediated 6.03% and PIR mediated 12.46% of the depression–constipation association. Subgroup analyses demonstrated consistent associations across all demographic and clinical subgroups (OR range: 1.04–1.14).
Conclusion: This cross-sectional study demonstrates a significant non-linear relationship between depression and constipation, partially mediated by dietary inflammation and socioeconomic status. Longitudinal studies are needed to establish causality and directionality between these variables.
1 Introduction
Gastrointestinal disorders impose substantial burdens on global healthcare systems, with chronic constipation representing a prevalent yet mechanistically complex condition that affects approximately 10–16% of adults worldwide (64). Its bidirectional relationship with depression is increasingly recognized as a critical public health concern (1). While cross-sectional studies consistently show associations between depression and functional gastrointestinal disturbances (2, 3), longitudinal research provides stronger evidence for causality. For instance, prospective cohort studies have shown that depression increases the risk of incident constipation [e.g., Liu et al. (4): HR = 1.72, 95% CI: 1.42–2.08] (2, 3). Conversely, constipation has also been shown to predict subsequent depression [Koloski et al. (5): OR = 2.36, 95% CI: 1.58–3.51]. Thus, neuroendocrine dysregulation and autonomic dysfunction may play a role in the relationship between depression and constipation (6, 7), while chronic distress from constipation may be linked to depression through reduced quality of life and impaired social functioning (8). The current evidence suggests a reinforcing cycle, though intervention studies indicate that depression treatment more often improves constipation than vice versa (3, 9).
Despite established correlations, mechanistic insights into the depression–constipation nexus remain fragmented. Existing research primarily implicates factors such as reduced colonic motility under stress-axis activation and disruptions in serotonergic pathways, such as pivotal elements linking these conditions (10, 11). Moreover, evidence suggests that alterations in gut microbiota and systemic inflammation may play critical roles in mediating this relationship, although further exploration is necessary to clarify their impact (7, 12). However, critical gaps persist in understanding intermediary mechanisms associated with both psychological distress and gastrointestinal pathology. The roles of lifestyle-modifiable mediators—specifically diet-driven systemic inflammation and socioeconomic disparities—are inadequately characterized within this relationship (13), limiting the development of targeted interventions aimed at addressing both conditions simultaneously.
Recent research highlights a compelling association between inflammation, depression, and gastrointestinal dysfunction, with particular focus on the role of pro-inflammatory cytokines associated with changes in gut neuromuscular coordination and visceral sensitivity (7, 10). This relationship is underscored by findings indicating that diet-derived inflammation, as operationalized by the DII, may be statistically associated with these relationships. Existing literature shows a positive correlation between higher DII scores and the incidence of depression, alongside gastrointestinal symptoms such as constipation (14). Despite these insights, studies specifically quantifying DII’s potential statistical mediation in the depression–constipation context remain scarce.
Moreover, the influence of socioeconomic status (SES) on depression and gastrointestinal health is significant, yet often underexplored (15, 16). Low SES has been correlated with heightened risks of depressive symptoms and comorbid conditions such as constipation, as individuals facing economic hardships frequently have limited access to quality healthcare and nutritious food (17, 18). Recent studies indicate that SES might be associated with dietary factors, both independently and interactively, in relation to the risk of constipation (19). However, comprehensive models integrating psychological, dietary–inflammatory, and socioeconomic mediators in large-scale human studies are largely lacking, which calls for further research to fill these critical gaps.
While it is generally observed that depression severity may exhibit linear relationships with somatic outcomes, the potential for non-linear dynamics—such as threshold effects in the association with constipation—is an area ripe for exploration using flexible epidemiological tools, including restricted cubic splines (20). In light of these factors, addressing these complex interrelations is crucial for developing targeted interventions for high-risk populations plagued by depression and gastrointestinal complications.
Leveraging NHANES data (2005–2010) from 12,854 U.S. adults, this study addresses these critical gaps by: (1) quantifying independent associations between depression severity, DII, and PIR with constipation risk; (2) identifying potential threshold effects using non-linear modeling; and (3) empirically decomposing the statistical mediation of diet-induced inflammation and socioeconomic disparities. Our findings suggest associations between depression, pro-inflammatory diets, and increased constipation risk, while also identifying a potential protective association with higher SES. Building upon established associations between individual factors and constipation risk, we provide the first formal statistical mediation analysis examining the relationships between depression, dietary inflammation, and socioeconomic status within a unified analytical framework using multi-mediator structural equation modeling.
2 Methods
2.1 Study population
The present study utilized data from the National Health and Nutrition Examination Survey (NHANES) 2005–2010 cycles because these three 2-year cycles included relevant questionnaire data on bowel health. NHANES is a comprehensive nationwide survey conducted by the National Center for Health Statistics (NCHS) to assess the health and nutritional status of the U.S. population (65, 66). It employs a complex, multistage probability sampling design to represent the non-institutionalized U.S. civilian population, with strategic oversampling of specific subgroups (elderly, African Americans, and Hispanics) to enhance estimate precision (21). Our study’s participant selection workflow is depicted in Figure 1. All procedures were approved by the NCHS Ethics Review Board, and all participants provided written informed consent. Detailed methodological information is available on the NHANES website (22). From an initial sample of 31,034 participants, we excluded 13,902 individuals younger than 20 years of age, as they did not complete the bowel health questionnaire. Among the remaining 17,132 adult participants (aged 20–85 years), we further excluded those with missing data on depression (n = 2,315), constipation (n = 63), and DII (n = 1,900). The final analytical cohort comprised 12,854 adults with complete data on all key variables of interest.
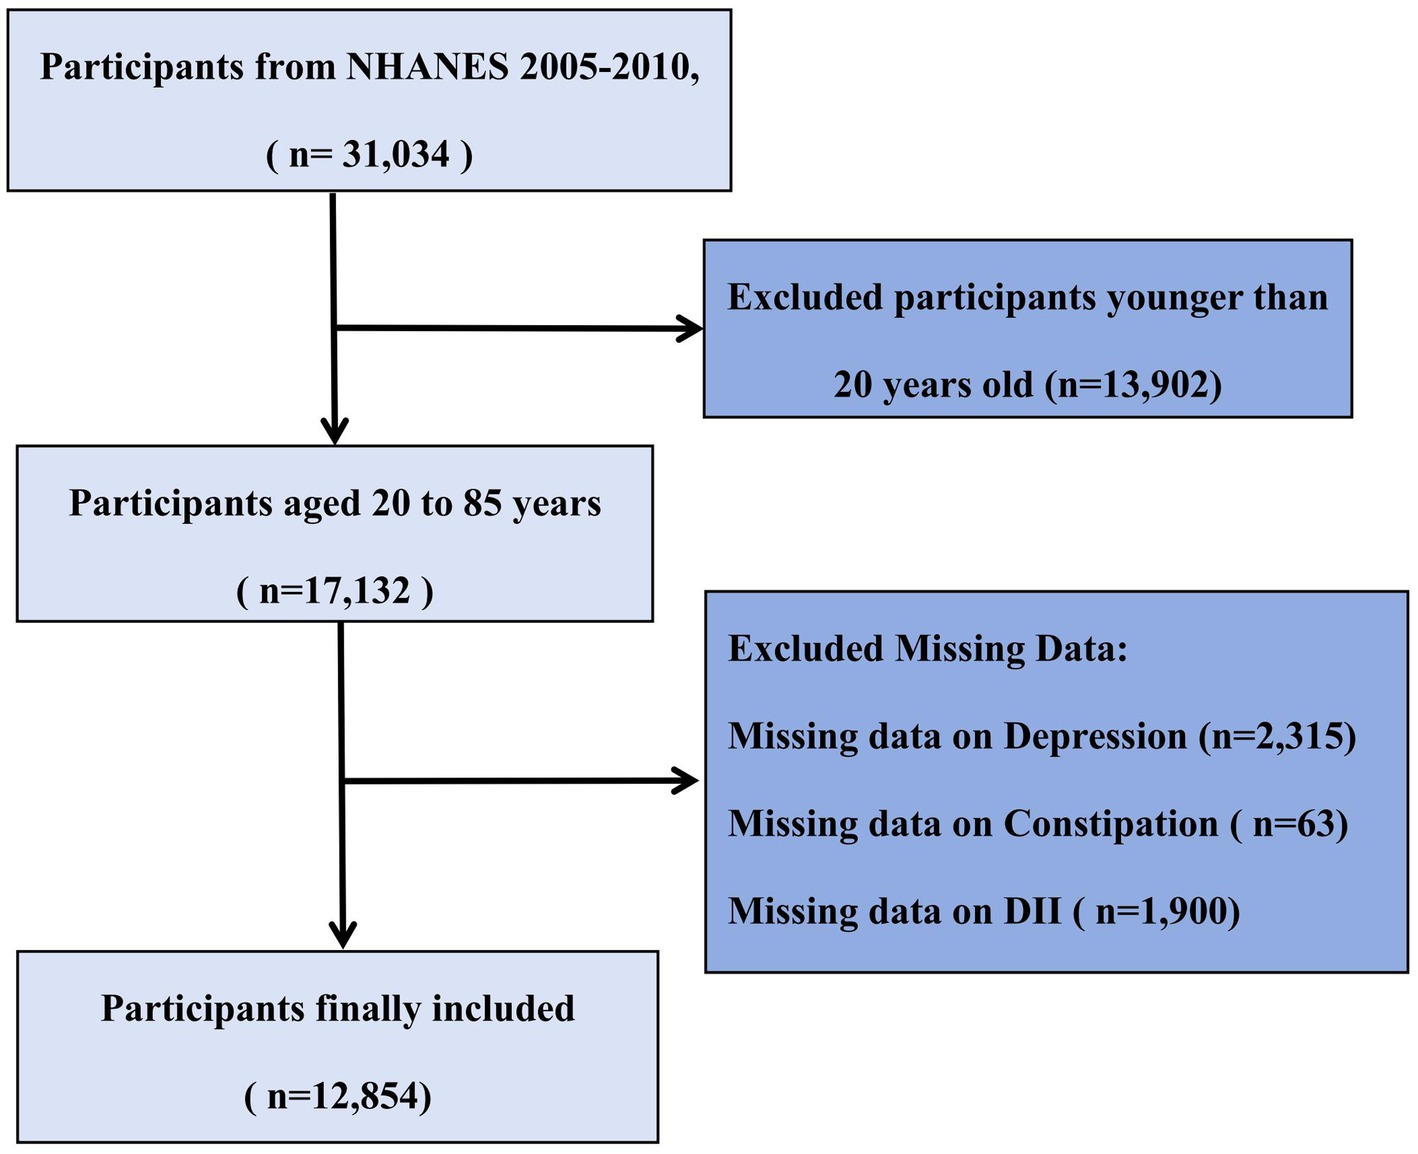
Figure 1. Flowchart of participant selection from NHANES 2005–2010.
2.2 Assessment of depression
Depression was assessed using the PHQ-9 (23, 24). This nine-item questionnaire employs a 4-point rating scale (0 = not at all; 1 = several days; 2 = more than half the days; and 3 = nearly every day), with total scores ranging from 0 to 27 (25). The PHQ-9 demonstrates high sensitivity (86%) and specificity (85%) in depression screening, with a clinical cutoff score of 1,020. According to validated severity classifications 21, total scores of 0–4 indicate no depression, 5–9 indicate mild depression, 10–14 indicate moderate depression, and ≥15 indicate moderately severe to severe depression (26).
2.3 Assessment of constipation
Constipation assessment was based on self-reported questionnaires and the Bristol Stool Form Scale (BSFS). Following previous studies, constipation was diagnosed based on two criteria: (1) self-reported bowel movements less than three times per week and (2) stool consistency corresponding to BSFS types 1 or 2. The BSFS classifies stools into seven types, with types 1–2 categorized as constipation, types 3–5 as normal, and types 6–7 as diarrhea (27, 28). In the NHANES database, constipation was assessed by asking, “Have you experienced constipation in the past 12 months?” For analytical purposes, frequency descriptors were operationalized as follows: “often” was defined as symptoms occurring ≥3 days/week but <6 days/week, and “always” was defined as symptoms occurring ≥6 days/week, consistent with functional gastrointestinal disorder diagnostic criteria from Rome IV (29). Respondents who answered “always” or “often” were classified as having constipation (28, 30). This combined diagnostic approach (BSFS and self-report) has demonstrated good specificity (85%) with moderate sensitivity (72%) in previous validation studies when compared to clinical evaluations (31).
2.4 Assessment of DII
The DII was calculated based on the average dietary data obtained from two 24-h dietary recall interviews in NHANES. This index, developed by Shivappa et al. (32), assesses the inflammatory potential of diet through nutrient composition analysis, with detailed information available elsewhere (15). While the complete DII incorporates 45 nutrients, our study utilized 27 available parameters due to data availability constraints in the NHANES database, a common limitation acknowledged in studies using secondary dietary datasets (33, 34). The 27 parameters included carbohydrates; energy; protein; fat; fiber; cholesterol; saturated fatty acids; monounsaturated fatty acids; polyunsaturated fatty acids; β-carotene; vitamins A, B1, B2, B6, B12, C, D, and E; folate; iron; magnesium (Mg); zinc; selenium; omega-3 and omega-6 polyunsaturated fatty acids; alcohol; and caffeine. Importantly, this reduced version of the DII has been validated in prior research. For instance, a study by Wirth et al. (35) demonstrated that a DII based on 28 components significantly correlated with inflammatory biomarkers (CRP and IL-6) in a similar magnitude as the full DII. Similarly, Tabung et al. (36) reported consistent associations between a reduced DII and health outcomes. Therefore, the 27-component DII used in our study is considered a valid measure of dietary inflammatory potential. Scores ≥0 indicate pro-inflammatory diets, while scores <0 represent anti-inflammatory dietary patterns (37).
2.5 Assessment of PIR
PIR reflects household income relative to poverty thresholds, accounting for household size, composition, member ages, and annual inflation adjustments. These values, derived from the Department of Health and Human Services guidelines, provide precise poverty status assessments across years and states (38). For analytical purposes, income level was categorized into tertiles: low (PIR < 1.3), middle (PIR 1.3–3.5), and high (PIR ≥ 3.5) (39, 40). These cutoff points were determined based on both policy-relevant thresholds and data distribution: the lower cutoff (1.3) approximates the Supplemental Nutrition Assistance Program (SNAP) eligibility threshold (130% of the poverty line) in many states (41), while the upper cutoff (3.5) is supported by research indicating that it represents a significant threshold in health disparities analysis (42) and aligns with prevalent income classifications used in health studies (42). This categorization is consistent with several NHANES-based studies examining health disparities across socioeconomic groups (42–44).
2.6 Covariables
NHANES-trained interviewers used a well-designed questionnaire to collect demographic, health, and biomarker data. Covariates were selected based on previous research findings and clinical expertise (45). The covariates we gathered included age, sex, ethnicity, marital status, education level, body mass index (BMI), smoking status, alcohol consumption status, hypertension, and diabetes. Ethnicity was categorized as Mexican American, non-Hispanic White, non-Hispanic Black, other Hispanic, and other ethnicities. Marital status was classified as married/living with partner, widowed/divorced/separated, and never married. Education level was divided into less than high school, high school, and above high school. BMI was categorized as <25.0, 25.0–29.9, and ≥30.0 kg/m2. Smoking status was assessed using two questions from the NHANES questionnaire, with participants classified as never smokers, former smokers, and current smokers. Alcohol consumption status was categorized based on the average number of drinks per drinking day in the past 12 months as never drinkers, former drinkers, light drinkers, moderate drinkers, and heavy drinkers. Hypertension was defined as follows: (1) self-reported physician diagnosis; (2) mean diastolic blood pressure (DBP) ≥ 90 mmHg; (3) mean systolic blood pressure (SBP) ≥ 140 mmHg; or (4) current use of antihypertensive medication. Diabetes was defined as follows: (1) self-reported physician diagnosis; (2) laboratory indicators: glycated hemoglobin (HbA1c) ≥ 6.5%, fasting plasma glucose ≥7.0 mmol/L, random plasma glucose ≥11.1 mmol/L, or 2-h plasma glucose in oral glucose tolerance test (OGTT) ≥ 11.1 mmol/L; or (3) current use of diabetes medication or insulin therapy. Hyperlipidemia was determined based on self-reported medical history. Laboratory data, including total cholesterol and parameters for Fatty Liver Index (FLI) calculation, were extracted from the NHANES dataset. Total cholesterol and high-density lipoprotein cholesterol (HDL-C) were measured from fasting venous blood (≥9 h) according to NHANES protocols: enzymatically for cholesterol and via immunoinhibition/precipitation for HDL-C. The results were converted to mmol/L using a 0.02586 factor with strict quality control. Data, including these and FLI parameters, were extracted from the NHANES.
2.7 Statistical analysis
Between-group baseline differences were assessed using independent t-tests for continuous variables and chi-square tests for categorical variables. For the comparison of baseline characteristics between groups with and without constipation, we used the standard significance level (α = 0.05) without correction for multiple comparisons, as these analyses were exploratory in nature and intended to describe the sample characteristics rather than test formal hypotheses. Continuous variables were presented as mean ± standard deviation, and categorical variables were presented as frequencies and percentages. Missing data for key variables (<5%) were handled using multiple imputation. The associations between depression and constipation risk were evaluated using multivariable logistic regression models with three progressive models: Model 1 was unadjusted; Model 2 was adjusted for age, sex, ethnicity, and education level; and Model 3 was further adjusted for marital status, PIR, BMI, smoking status, alcohol consumption, physical activity, DII, diabetes, hyperlipidemia, hypertension, total cholesterol, HDL-C, fiber, polyunsaturated fatty acids (PUFA), vitamin D, and magnesium (Mg). The associations between DII and constipation risk and between P and constipation risk were analyzed using the same models.
To explore potential non-linear dose-response relationships between depression and constipation risk, restricted cubic spline models were applied with smooth curve fitting. A threshold effect analysis was subsequently conducted to identify the inflection point (PHQ-9 score = 10) and evaluate the presence of non-linearity, with a two-piecewise linear regression model constructed at the identified point and model fitness compared via log-likelihood ratio tests. Stratified analyses were conducted according to sex, age group (20–39, 40–59, and ≥60 years), ethnicity, education level, marital status, BMI categories (<25, 25–30, and ≥30 kg/m2), and PIR levels (<1.3, 1.3–3.5, and >3.5) to evaluate whether these factors modified the association between depression and constipation risk.
For the mediation analysis assessing the intermediary roles of DII and PIR in the depression–constipation relationship, we used R version 4.2.2 and implemented a counterfactual framework-based causal mediation analysis via the ‘mediation’ package. The existence of a significant mediation effect was defined by satisfying all of the following criteria: (1) a statistically significant indirect effect (average causal mediation effect, ACME; p < 0.05), (2) a statistically significant total effect (p < 0.05), and (3) a positive proportion mediated effect (ACME/total effect). To account for the complex survey design of the NHANES (including clustering, stratification, and sampling weights), we performed the statistical mediation analysis within the survey framework using the ‘survey’ package. Specifically, we created a survey design object incorporating sampling weights, primary sampling units, and strata. Bootstrap resampling (1,000 replicates) was applied to estimate 95% confidence intervals for mediation effects, ensuring consistent handling of the complex design features. All mediation analyses were adjusted for the same covariates included in Model 3 of the logistic regression analyses.
All analyses were conducted using the NHANES complex multistage sampling framework. Analyses were performed using R software (version 4.2.2) for primary analyses and mediation modeling, EmpowerStats (version 2.0) with the rms package for restricted cubic spline models, and Stata for supplementary analyses. Statistical significance was defined as a p-value of <0.05 (two-sided).
3 Results
3.1 Baseline characteristics
Table 1 presents the baseline characteristics of 12,854 participants stratified by constipation status. Participants with constipation (n = 1,334, 10.4% of total) were significantly younger (46.95 ± 18.59 vs. 50.28 ± 17.84 years, p < 0.001) and predominantly women (73.54% vs. 49.44%, p < 0.001). The constipated group included a higher proportion of non-Hispanic Black (25.86% vs. 18.68%, p < 0.001) participants and showed lower educational attainment (41.10% vs. 49.93% above high school, p < 0.001), were less likely to be married (56.97% vs. 62.96%, p < 0.001), and had a greater proportion in the lowest family poverty-to-income ratio category (36.81% vs. 27.67%, p < 0.001). Regarding lifestyle and clinical factors, participants with constipation were more likely to be never-smokers (58.10% vs. 52.18%, p < 0.001) and never-drinkers (18.44% vs. 12.91%, p < 0.001) and had a lower prevalence of hypertension (37.11% vs. 42.47%, p < 0.001), diabetes (16.63% vs. 18.32%, p < 0.001), and hyperlipidemia (69.34% vs. 72.74%, p = 0.008). Nutritional assessments revealed that the constipation group had significantly higher dietary inflammatory index scores (2.00 ± 1.60 vs. 1.37 ± 1.81, p < 0.001), fiber intake (0.32 ± 0.41 vs. 0.19 ± 0.46, p < 0.001), PUFA (0.02 ± 0.25 vs. −0.04 ± 0.25, p < 0.001), vitamin D (0.23 ± 0.27 vs. 0.19 ± 0.30, p < 0.001), magnesium (0.15 ± 0.22 vs. 0.06 ± 0.25, p < 0.001), and HDL-C (1.42 ± 0.43 vs. 1.37 ± 0.42 mmol/L, p < 0.001). Consistently, participants with constipation exhibited greater depression severity (mean PHQ-9 score: 4.25 ± 4.88 vs. 3.00 ± 4.10, p < 0.001) and a higher percentage of severe depression (5.55% vs. 2.89%, p < 0.001).
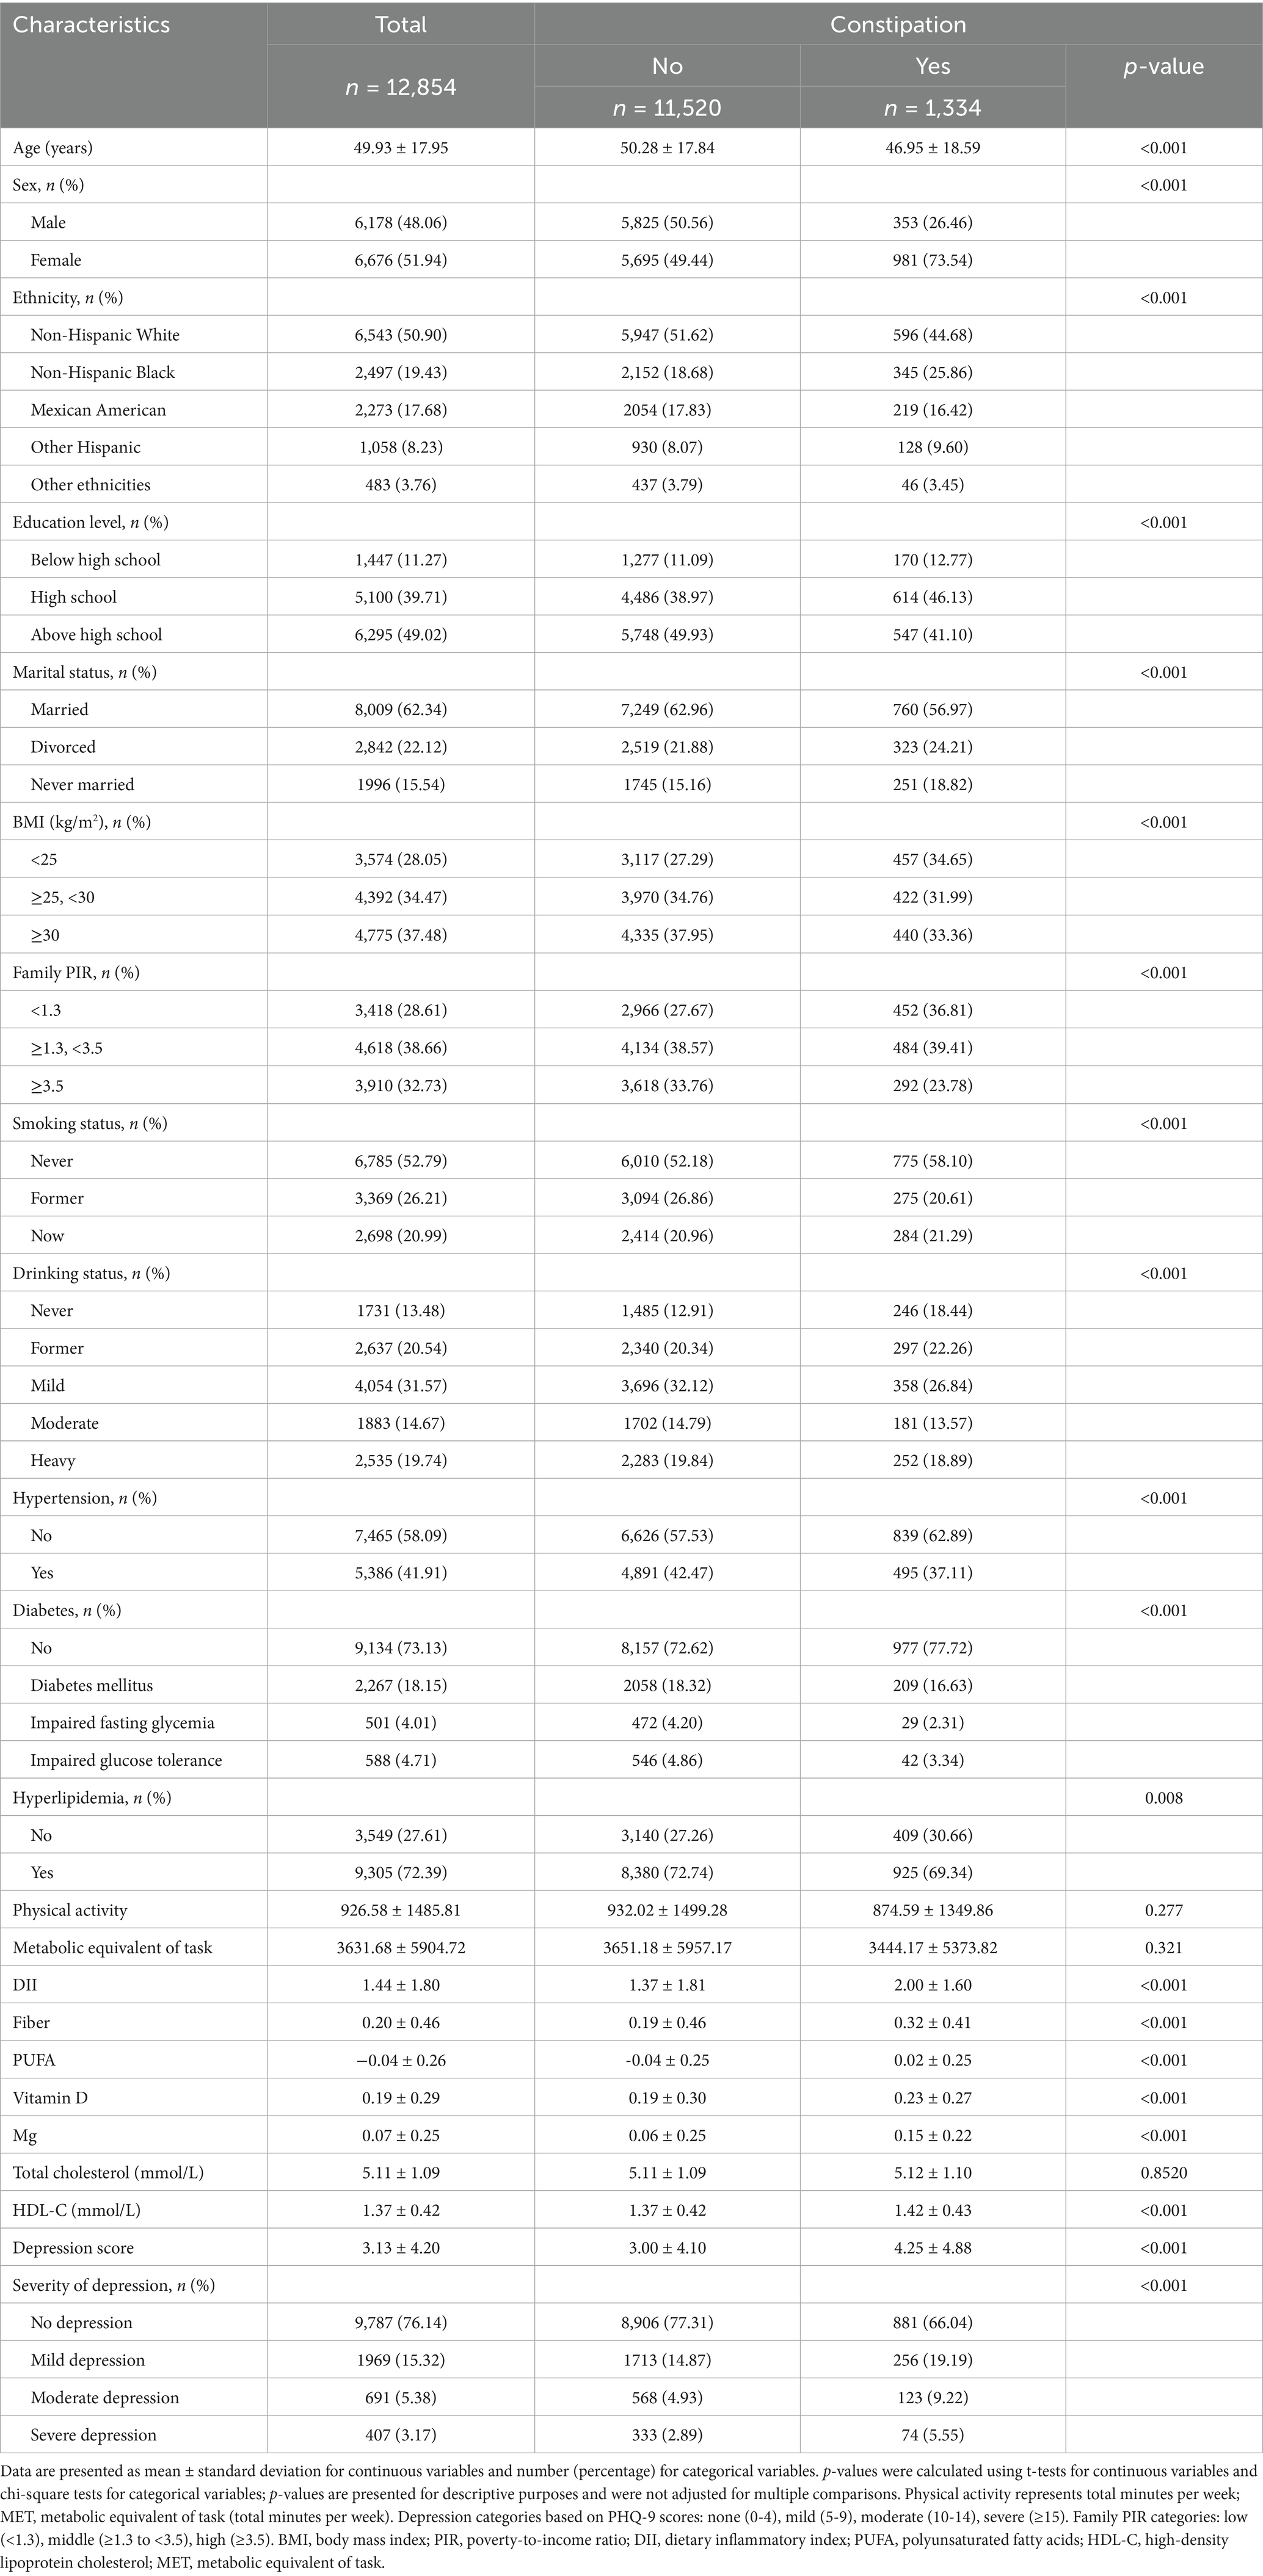
Table 1. Baseline characteristics of participants with or without constipation.
3.2 Logistic regression analysis
Table 2 presents the associations between depression, DII, PIR, and constipation across three regression models. In the fully adjusted model (Model 3), higher depression scores were independently associated with increased constipation risk (OR: 1.04, 95% CI: 1.03–1.06, p < 0.0001). Compared to individuals without depression, those with mild, moderate, and severe depression exhibited progressively elevated odds of constipation, with odds ratios of 1.49 (95% CI: 1.23–1.82), 1.81 (95% CI: 1.37–2.40), and 1.72 (95% CI: 1.22–2.44), respectively (p for trend <0.0001). Similarly, DII levels were positively correlated with constipation risk. Each unit increase in DII was associated with a 15% higher odds of constipation (OR: 1.15, 95% CI: 1.04–1.27, p = 0.0064). Participants in the second, third, and highest DII quartiles showed significantly greater risk with odds ratios of 1.45 (95% CI: 1.07–1.95), 1.47 (95% CI: 1.03–2.11), and 1.73 (95% CI: 1.13–2.64), respectively, compared to the lowest quartile (p for trend = 0.035). For PIR, individuals in the highest group (≥3.5) had a significantly lower constipation risk (OR: 0.77, 95% CI: 0.62–0.97, p = 0.0292) than those in the lowest group, with a significant inverse trend (p for trend = 0.0329). These associations remained robust after extensive adjustment for demographic factors, socioeconomic status, comorbidities, lifestyle variables, and nutritional parameters.
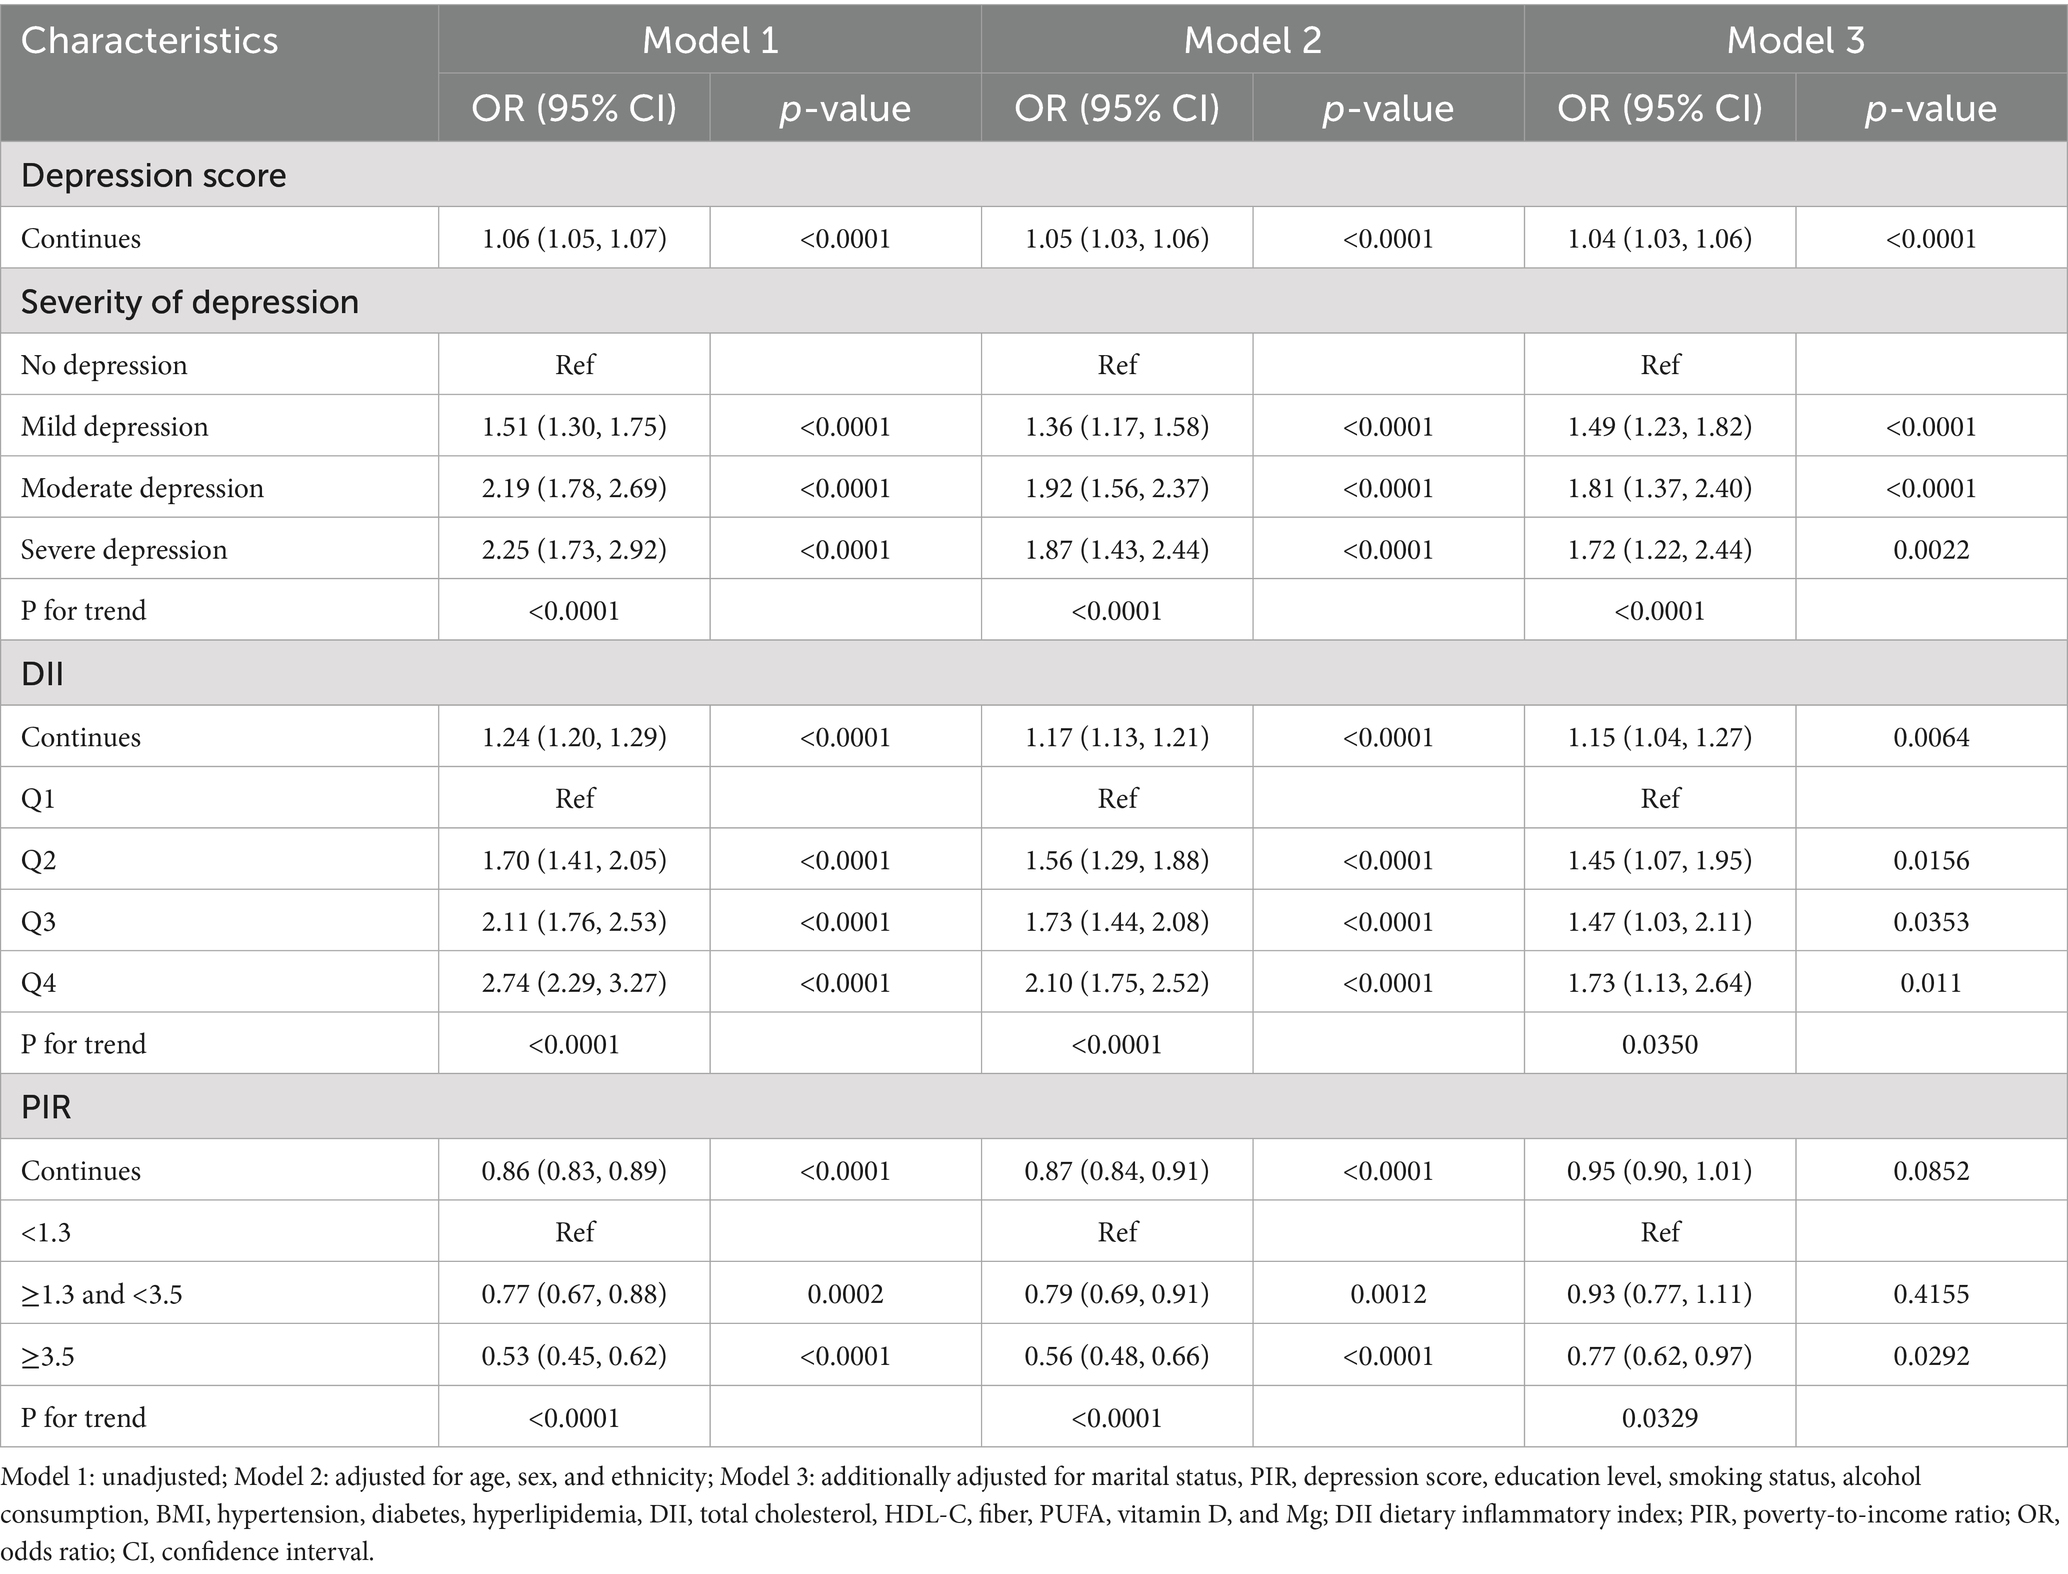
Table 2. Association between depression, DII, PIR, and constipation.
3.3 Dose-response relationship between depression and constipation risk
Restricted cubic spline (RCS) regression identified a non-linear dose-response relationship between depression and constipation risk (Figure 2), featuring an inflection point at a depression score of 10 (P for non-linearity = 0.001). For PHQ-9 scores below 10, increasing depression severity was significantly associated with higher constipation risk (OR: 1.08, 95% CI: 1.05–1.11, p < 0.0001), indicating an 8% increase in risk per one-point rise in PHQ-9 score. Importantly, the risk plateaued at scores above 10, with no significant additional risk observed with further increases in depression severity (OR: 0.98, 95% CI: 0.93–1.02, p = 0.3018). The significant slope difference (OR: 0.90, 95% CI: 0.85–0.96, p = 0.0014) confirmed the threshold model’s superior fit over linear alternatives, with the likelihood ratio test demonstrating significant improvement compared to the linear model (p = 0.001) (Table 3).
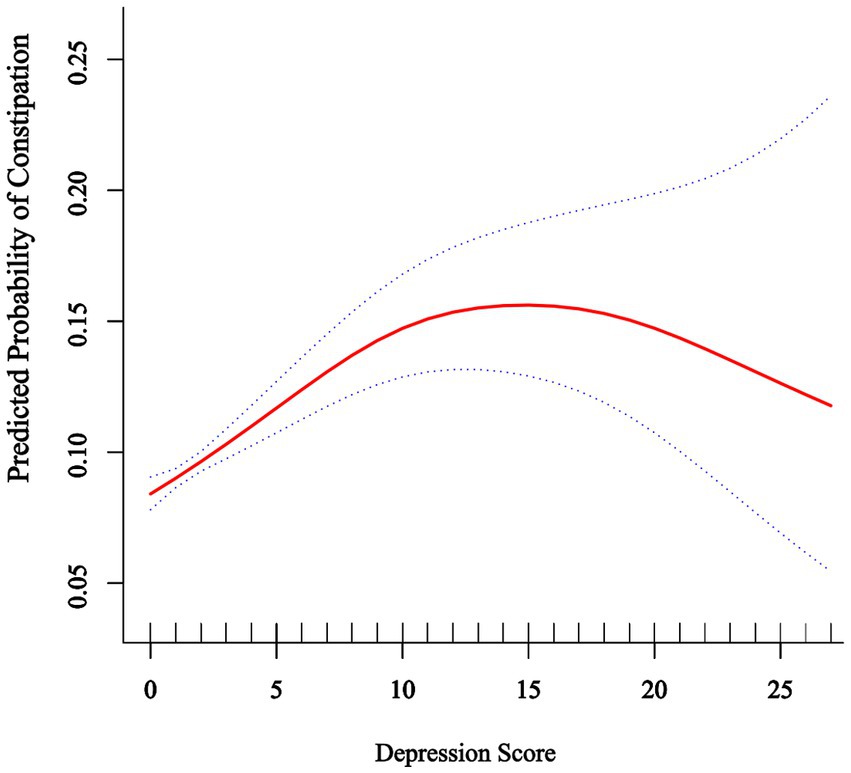
Figure 2. Association between depression score and predicted probability of constipation. The solid red line represents the predicted probability of constipation across the range of depression scores (0–27) based on a restricted cubic spline model with four knots. The dotted lines represent the 95% confidence intervals. The model was adjusted for age, sex, ethnicity, marital status, poverty income ratio, education level, smoking status, alcohol consumption, BMI, hypertension, diabetes mellitus, hyperlipidemia, DII, total cholesterol, HDL-C, fiber, PUFA, vitamin D, and Mg.
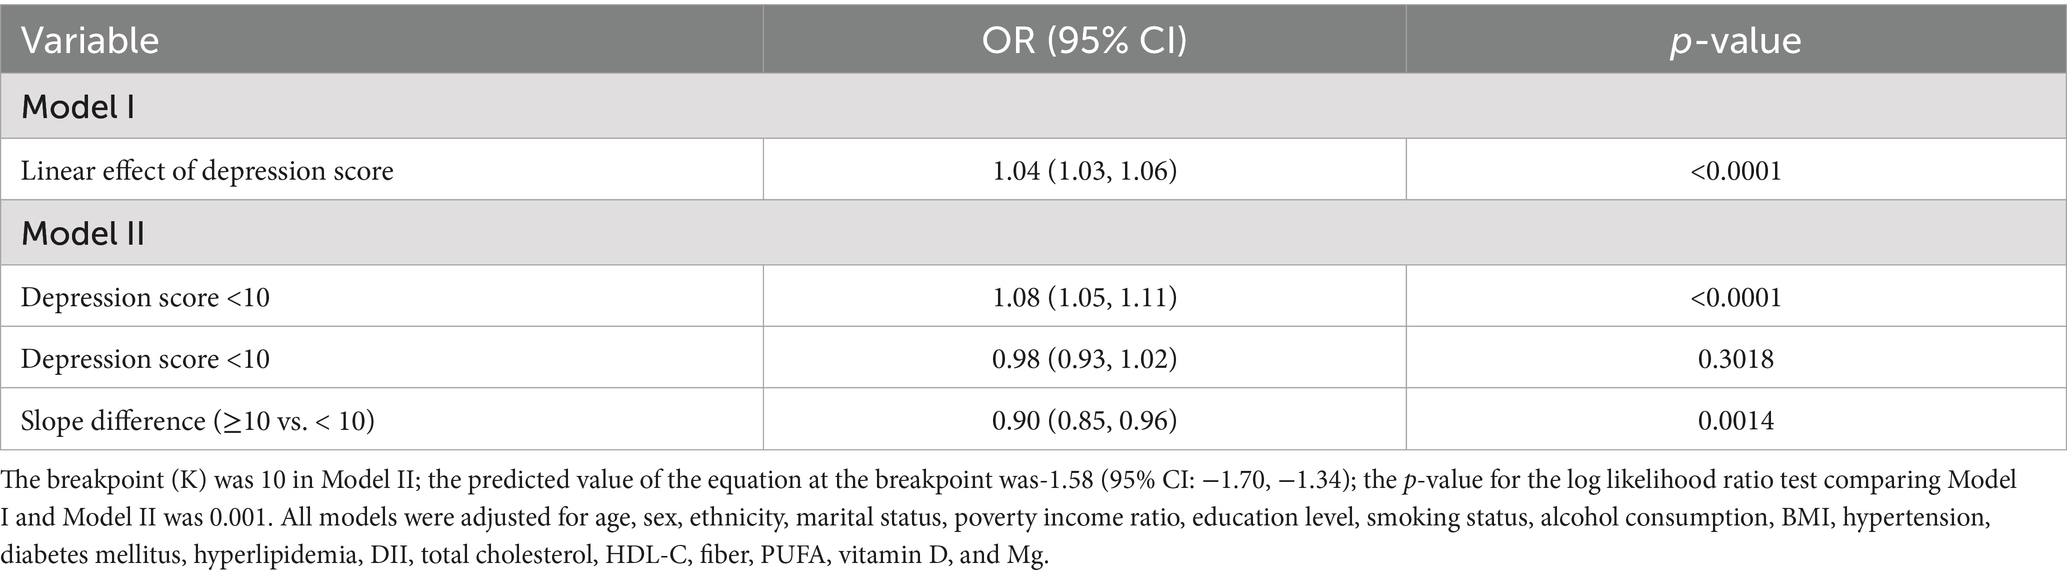
Table 3. Threshold effect analysis of depression score on constipation risk.
3.4 Statistical mediation analysis
Statistical mediation analysis revealed that DII statistically mediated 6.03% and PIR statistically mediated 12.46% of the observed association between depression and constipation after covariate adjustment (Figure 3).
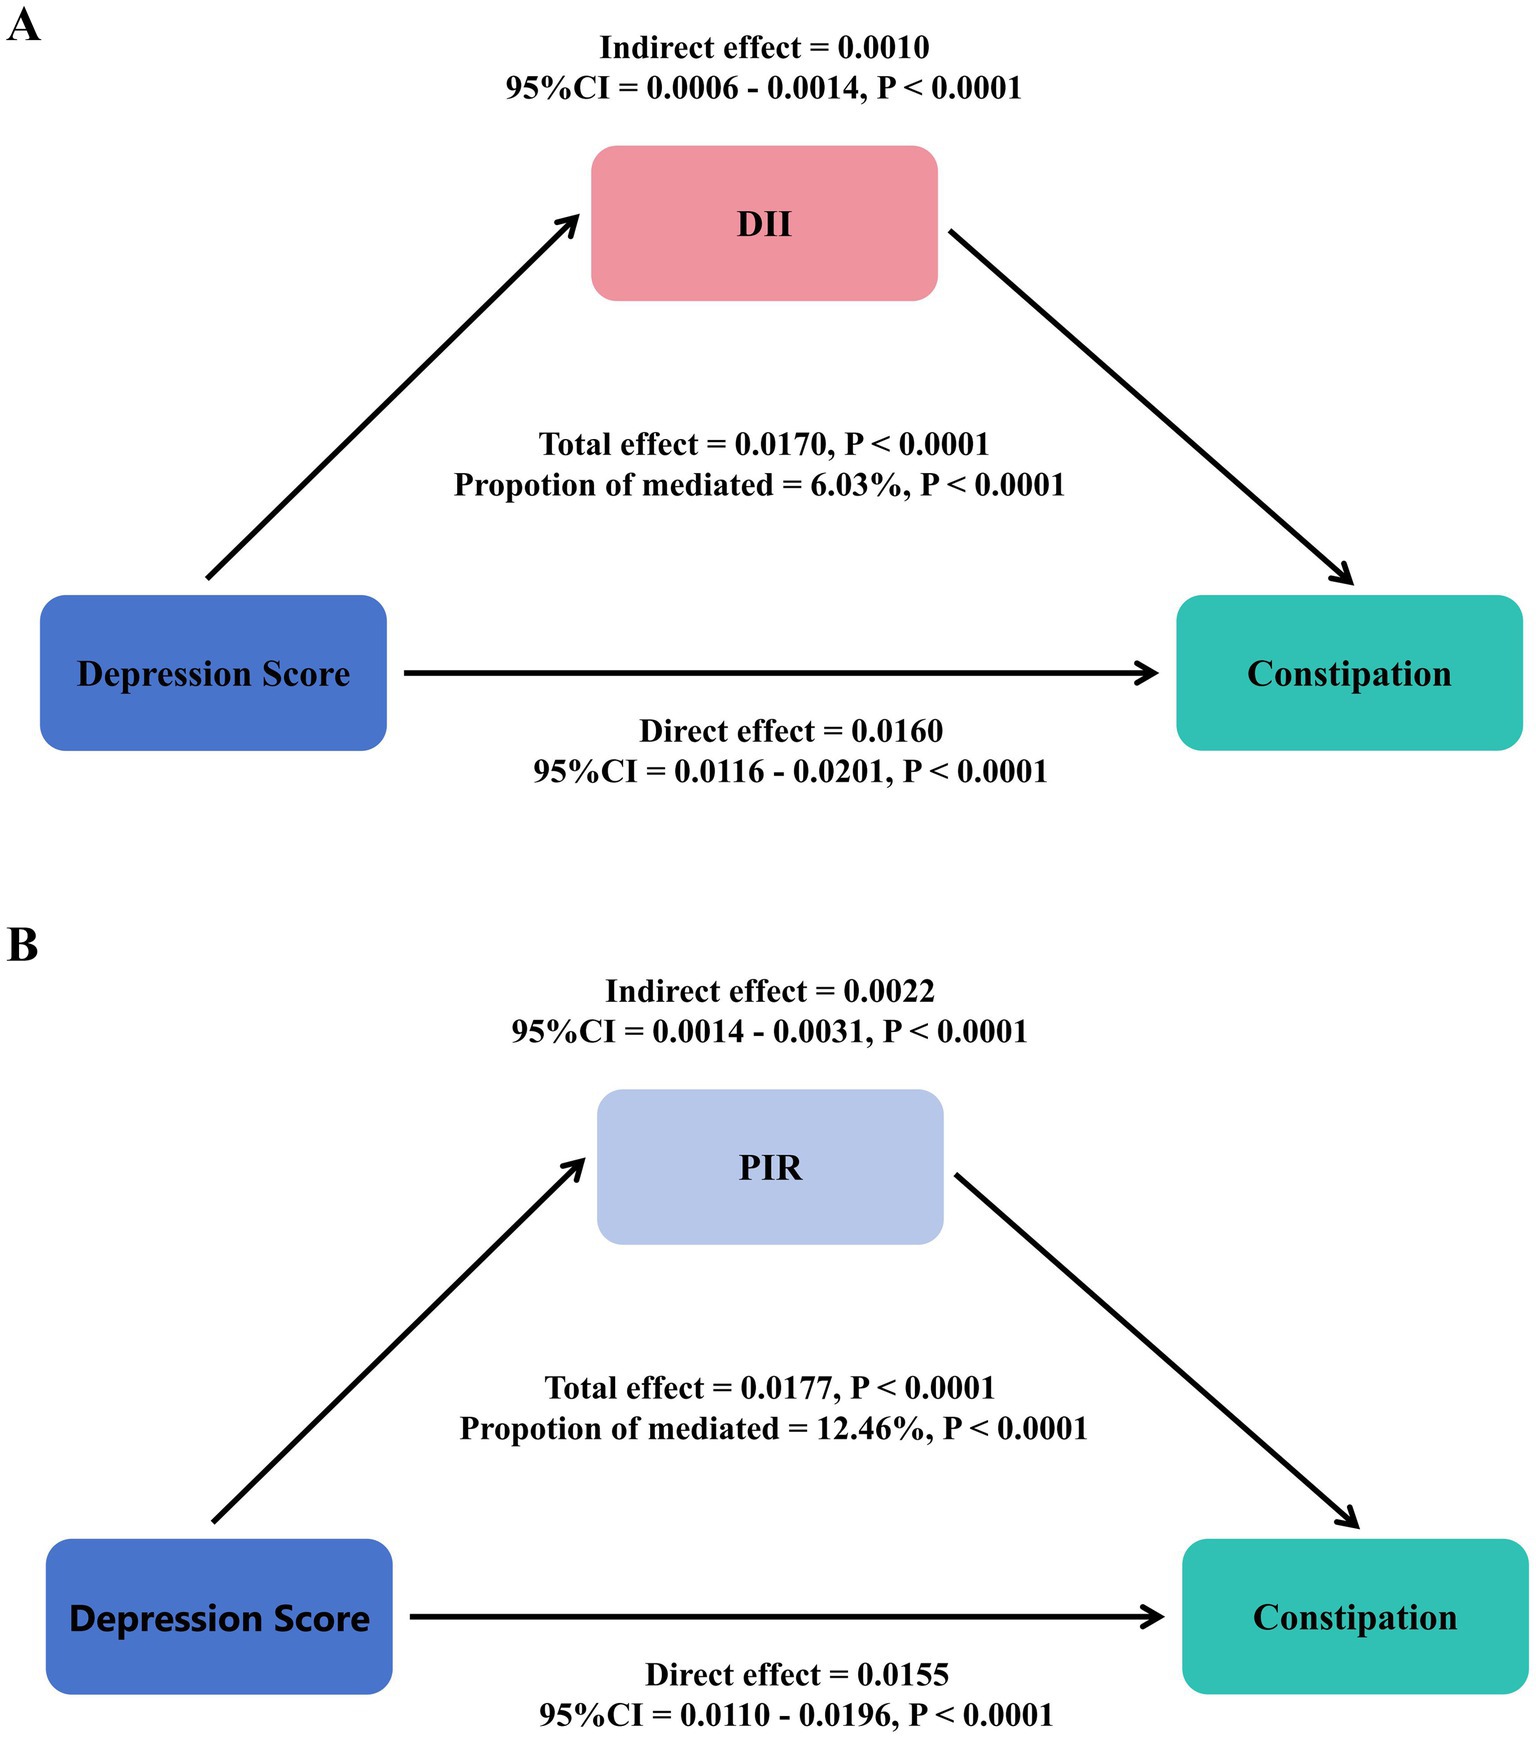
Figure 3. Statistical mediation analysis examining the relationship between depression, DII (A), PIR (B), and constipation.
3.5 Subgroup analysis
Subgroup analyses consistently demonstrated depression–constipation associations across all demographic and clinical subgroups (OR range: 1.04–1.14, all p < 0.05), with no significant effect modification by covariates, including age, sex, ethnicity, marital status, education level, BMI, smoking status, drinking status, hypertension, or hyperlipidemia (all interaction p > 0.05), highlighting robust universal applicability (Figure 4).
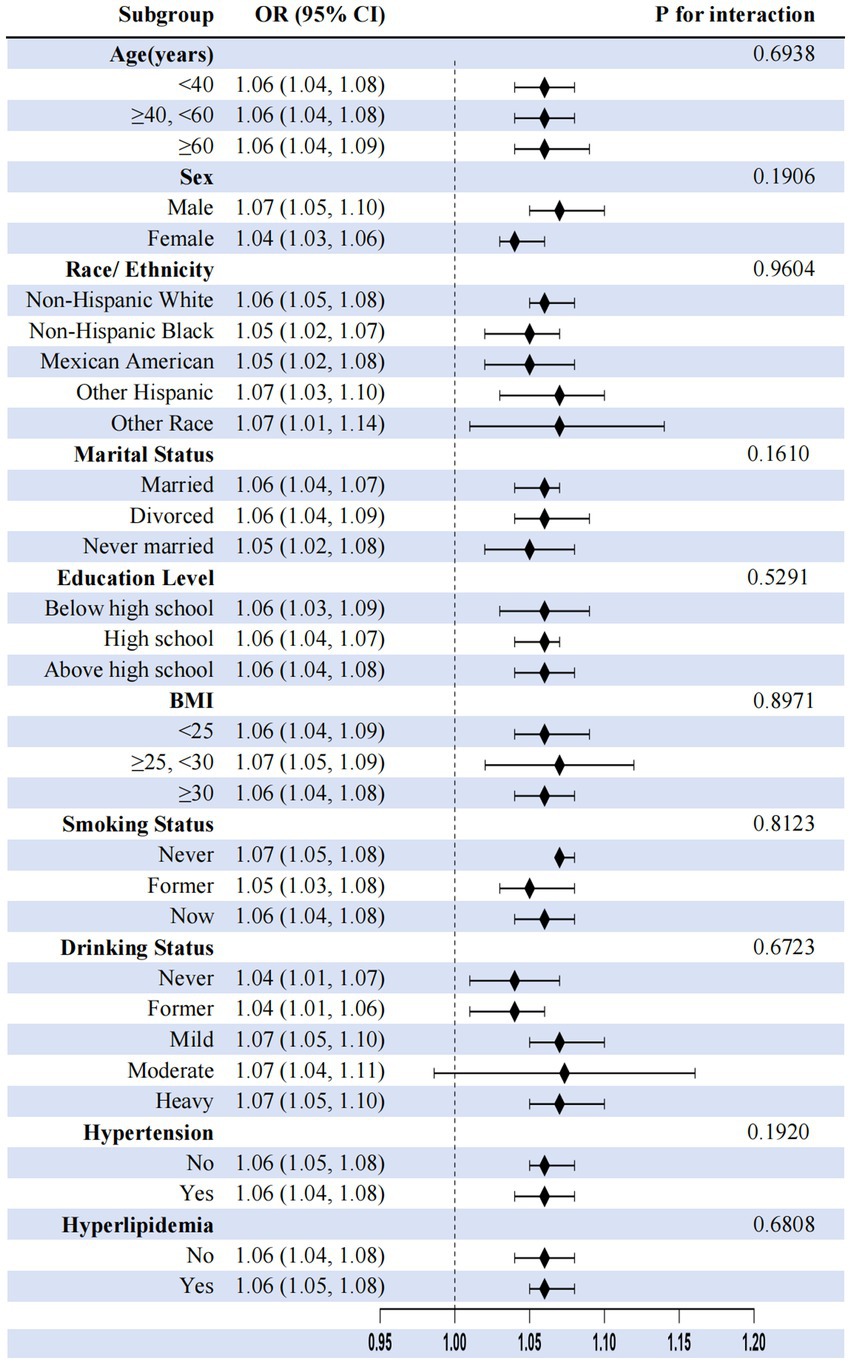
Figure 4. Subgroup analysis of associations between depression and constipation.
4 Discussion
This cross-sectional study revealed a non-linear threshold association between depression and constipation risk using restricted cubic spline models. Each 1-unit increase in PHQ-9 score was associated with a 4% increase in constipation risk (OR = 1.04, 95% CI: 1.03–1.06). Specifically, for PHQ-9 scores below 10, each unit increase conferred an 8% risk elevation (OR = 1.08, 95% CI: 1.05–1.11), while scores above this threshold showed no additional significant risk (OR = 0.98, 95% CI: 0.93–1.02, p = 0.3018), indicating a plateau effect. Individuals with severe depression demonstrated significantly elevated constipation odds (OR = 1.72, 95% CI: 1.22–2.44). Meanwhile, pro-inflammatory diets (highest DII quartile: OR = 1.73, 95% CI: 1.13–2.64) were positively associated with constipation, while higher socioeconomic status (highest PIR category: OR = 0.77, 95% CI: 0.62–0.97) was inversely associated. Mediation analysis further indicated that DII and PIR statistically explained 6.03 and 12.46%, respectively, of the association between depression and constipation.
Our findings of a significant positive association between depression and constipation (OR: 1.04 per PHQ-9 point) align with previous NHANES studies (OR = 2.20, 95% CI: 1.68–2.87) (46). The novel contribution of our analysis is identifying the non-linear threshold effect at PHQ-9 = 10, corresponding to moderate depression severity. This threshold likely reflects converging biological mechanisms: from a neuroendocrine perspective, it may indicate the maximum impact of cortisol’s inhibitory effects on gastrointestinal motility (47, 48); from an inflammatory standpoint, moderate depression (PHQ-9 ≥ 10) is associated with significantly elevated inflammatory markers including CRP, IL-6, and TNF-α (49, 50); and from a neurophysiological perspective, PHQ-9 = 10 often marks pronounced autonomic nervous system dysfunction affecting vagal tone and gut motility (51). Additionally, individuals with moderate depression often experience substantial changes in physical activity, medication use, and dietary habits that collectively contribute to constipation without proportional increases at higher severity levels (52).
The depression–constipation relationship appears to operate through multiple interconnected pathways, with our mediation analysis revealing partial roles for both dietary inflammation (DII: 6.03%) and socioeconomic factors (PIR: 12.46%). These “modest” mediation proportions highlight the multifactorial nature of this relationship. Mechanistically, depression and constipation are linked through the central nervous system–gut axis: depression modulates vagal tone and serotonin balance, affecting intestinal motility (53), while dysregulated corticotropin-releasing factor and disrupted gut microbiota alter short-chain fatty acid production and gut health (54). Inflammatory pathways further connect these conditions, with DII influencing both depression (through inflammatory markers affecting neurotransmitter metabolism and neuroplasticity) (55, 56) and constipation (by reducing beneficial gut bacteria, increasing intestinal permeability, and inhibiting motility) (57, 58). This creates a bidirectional cycle where gut microbiota alterations affect neurotransmitters and inflammatory mediators, exacerbating depressive symptoms, while depression further aggravates constipation through altered intestinal autonomic function (67, 68). Socioeconomic factors compound these effects, with low-income individuals facing nutritional inequity and limited access to anti-inflammatory foods (59, 60) while experiencing chronic stress-induced glucocorticoid resistance and heightened inflammatory responses (61, 62). Our observed DII mediation proportion (6.03%) is lower than the 71.43% reported for specific saturated fatty acids in depression models (63), likely reflecting methodological differences between controlled nutrient studies versus our population-based approach capturing holistic dietary patterns.
This study has several methodological strengths that enhance result reliability. We utilized a large nationally representative sample (NHANES 2005–2010; n = 12,854), employed restricted cubic spline modeling to identify non-linear relationships, and used mediation analysis to examine the potential mediating relationships involving DII and PIR, elucidating the relative contributions of dual mediation mechanisms within a single study for the first time. Furthermore, we implemented progressive multivariable adjustment strategies controlling for an extensive array of potential confounders across demographic (age, sex, and ethnicity), socioeconomic (education, marital status, and PIR), lifestyle (smoking, alcohol consumption, and physical activity), clinical (BMI, diabetes, hypertension, and hyperlipidemia), and nutritional (total cholesterol, HDL-C, fiber, polyunsaturated fatty acids, vitamin D, and magnesium) factors and performed comprehensive subgroup analyses verifying result robustness across different populations.
While this study makes significant contributions, several limitations should be acknowledged: (1) the cross-sectional design precludes establishing causality between depression and constipation; (2) results based on U.S. adults may not generalize to populations from other regions; (3) constipation and dietary data obtained from questionnaires could be affected by recall bias, with our operational definitions of frequency terms representing reasonable but arbitrary thresholds that influence case identification; (4) despite adjusting for numerous confounders, unmeasured factors (particularly antidepressant use and comorbid irritable bowel syndrome) may influence the observed associations; (5) depression assessment using PHQ-9 at a single time point may not capture symptom fluctuations; and (6) the absence of objective inflammatory biomarkers (such as C-reactive protein, interleukin-6, or tumor necrosis factor-α) limits our ability to validate the biological relevance of DII scores and may introduce measurement error in assessing dietary inflammatory potential.
In conclusion, this study identified a non-linear threshold association between depression and constipation, with a significant inflection point at a PHQ-9 score of 10. Below this threshold, each unit increase in depression score conferred an 8% elevation in constipation risk, while scores above 10 demonstrated a plateau effect with no additional significant risk increase. Dietary inflammation and socioeconomic factors partially mediated this relationship, suggesting potential intervention targets. These findings emphasize the importance of constipation risk screening in patients with depression, particularly those with moderate depression symptoms (PHQ-9 ≥ 10), as this represents the threshold where maximal risk is achieved. As our findings are derived from a cross-sectional design, we cannot establish temporal ordering or causality between depression and constipation. Future research should explore causal relationships through longitudinal designs; implement methodological approaches to address unmeasured confounding, such as collecting comprehensive medication data and conducting sensitivity analyses; and incorporate objective inflammatory biomarkers and gastrointestinal function measures to reduce measurement bias and validate self-reported assessments.
5 Conclusion
Higher depression severity was linked to greater constipation risk (particularly for PHQ-9 ≥ 10), partially mediated by DII and PIR.
Data availability statement
Publicly available datasets were analyzed in this study. This data can be found at: https://wwwn.cdc.gov/nchs/nhanes/default.aspx.
Ethics statement
This study utilized publicly available, de-identified data from the National Health and Nutrition Examination Survey (NHANES). The NHANES protocol was approved by the National Center for Health Statistics Research Ethics Review Board. As this analysis used de-identified, publicly available data, additional institutional review board approval was not required.
Author contributions
QH: Data curation, Conceptualization, Writing – review & editing, Funding acquisition, Writing – original draft. HZ: Writing – review & editing, Project administration. MY: Validation, Writing – review & editing, Supervision. YM: Writing – review & editing, Data curation, Methodology. LW: Visualization, Formal analysis, Writing – review & editing.
Funding
The author(s) declare that financial support was received for the research and/or publication of this article. This work was supported by Zhejiang Provincial Traditional Chinese Medicine Science and Technology Program Funds (No. 2024ZL665).
Acknowledgments
We thank the NHANES for making their data publicly available for this study.
Conflict of interest
The authors declare that the research was conducted in the absence of any commercial or financial relationships that could be construed as a potential conflict of interest.
Generative AI statement
The authors declare that no Gen AI was used in the creation of this manuscript.
Any alternative text (alt text) provided alongside figures in this article has been generated by Frontiers with the support of artificial intelligence and reasonable efforts have been made to ensure accuracy, including review by the authors wherever possible. If you identify any issues, please contact us.
Publisher’s note
All claims expressed in this article are solely those of the authors and do not necessarily represent those of their affiliated organizations, or those of the publisher, the editors and the reviewers. Any product that may be evaluated in this article, or claim that may be made by its manufacturer, is not guaranteed or endorsed by the publisher.
References
1. Zeng, X, Zhu, L, and Yang, X. Exploration of the complex origins of primary constipation. World J Clin Cases. (2024) 12:5476–82. doi: 10.12998/wjcc.v12.i24.5476
2. Friedrich, MJ. Depression is the leading cause of disability around the world. JAMA. (2017) 317:1517. doi: 10.1001/jama.2017.3826
3. Yun, Q, Wang, S, Chen, S, Luo, H, Li, B, Yip, P, et al. Constipation preceding depression: a population-based cohort study. EClinicalmedicine. (2024) 67:102371. doi: 10.1016/j.eclinm.2023.102371
4. Liu, T, Wang, Z, Kang, X, Wang, X, Ren, G, Lv, Y, et al. Causal relationships between psychological disorders and functional gastrointestinal disorders: a bidirectional two-sample Mendelian randomization study. Eur J Gastroenterol Hepatol. (2024) 36:1267–74. doi: 10.1097/meg.0000000000002825
5. Koloski, NA, Jones, M, Kalantar, JS, Weltman, M, Zaguirre, J, and Talley, NJ. The brain–gut pathway in functional gastrointestinal disorders is bidirectional: a 12-year prospective population-based study. Gut. (2012) 61:1284–90. doi: 10.1136/gutjnl-2011-300474
6. Niu, T, Zhou, X, Li, X, Liu, T, Liu, Q, Li, R, et al. Development and validation of a dynamic risk prediction system for constipation in patients with amyotrophic lateral sclerosis. Front Neurol. (2022) 13:13. doi: 10.3389/fneur.2022.1060715
7. Liu, X, Zhao, Z, Fan, Y, Zhao, D, Wang, Y, Lv, M, et al. Microbiome and metabolome reveal the metabolic and microbial variations induced by depression and constipation. Psychogeriatrics. (2023) 23:319–36. doi: 10.1111/psyg.12934
8. Karasawa, Y, Nozawa, K, Nomoto, K, and Fukudo, S. Constipation among workers with depression/anxiety: a retrospective study using a claims database and survey data in Japan. BMJ Open. (2024) 14:e083668. doi: 10.1136/bmjopen-2023-083668
9. Miao, X, Yan, Z, Huang, X, and Jiang, H. Effective process quality control management for constipation prevention in hospitalized patients with acute coronary syndrome: an observational study. Health Sci Rep. (2024) 7:e2248. doi: 10.1002/hsr2.2248
10. Adibi, P, Abdoli, M, Daghaghzadeh, H, Keshteli, AH, Afshar, H, Roohafza, H, et al. The relationship between depression and constipation: results from a large cross-sectional study in adults. Preprint. (2021). doi: 10.21203/rs.3.rs-786407/v1
11. Hwang, YK, and Oh, JS. Interaction of the vagus nerve and serotonin in the gut–brain axis. Int J Mol Sci. (2025) 26:1160. doi: 10.3390/ijms26031160
12. Mehta, I, Juneja, K, Nimmakayala, T, Bansal, LR, Pulekar, S, Duggineni, D, et al. Gut microbiota and mental health: a comprehensive review of gut-brain interactions in mood disorders. Cureus. (2025) 17:e81447. doi: 10.7759/cureus.81447
13. Adibi, P, Abdoli, M, Daghaghzadeh, H, Keshteli, AH, Afshar, H, Roohafza, H, et al. Relationship between depression and constipation: results from a large cross-sectional study in adults. Korean J Gastroenterol. (2022) 80:77–84. doi: 10.4166/kjg.2022.038
14. Wang, B, Liu, C, Guo, Z, Li, R, Wang, YC, Dong, C, et al. Association of Dietary Inflammatory Index with Constipation: evidence from the National Health and nutrition examination survey. Food Sci Nutr. (2024) 12:2122–30. doi: 10.1002/fsn3.3914
15. Zhang, G, Cai, C, Zou, W, Lu, J, and Wu, S. Depressive symptoms and socioeconomic status among the labor force: evidence from China’s representative sample. PLoS One. (2022) 17:e0272199. doi: 10.1371/journal.pone.0272199
16. Fragakis, A, Zhou, J, Mannan, H, and Ho, V. Association between drug usage and constipation in the elderly population of greater Western Sydney Australia. Int J Environ Res Public Health. (2018) 15:226. doi: 10.3390/ijerph15020226
17. Pôrto, AMJF, Pôrto, EF, Filoni, E, Vasques, TP, Pereira, RH, Castro, AAMD, et al. The effectiveness of osteopathic treatment in bowel constipation patients: a clinical perspective. Rev Contexto Saúde. (2023) 23:e13557. doi: 10.21527/2176-7114.2023.47.13557
18. Jeong, J, Kim, SA, Yang, J, and Shin, MH. Urban-rural differences in the prevalence of depressive symptoms in Korean adults. Chonnam Med J. (2023) 59:128–33. doi: 10.4068/cmj.2023.59.2.128
19. Islam, A, Siddique, S, Fatima, T, Imran, Y, Nazar, T, Shabbir, S, et al. Relationship of socioeconomic status, depression and disease activity in patients with systemic lupus erythematosus. Pak J Med Health Sci. (2022) 16:644–7. doi: 10.53350/pjmhs22168644
20. You, Y, Chen, Y, Yin, J, Zhang, Z, Zhang, K, Zhou, J, et al. Relationship between leisure-time physical activity and depressive symptoms under different levels of dietary inflammatory index. Front Nutr. (2022) 9:9. doi: 10.3389/fnut.2022.983511
21. Wu, X, Yin, F, Wang, G, Lu, Y, Jin, R, and Jin, D. Healthy eating index-2015 and its association with the prevalence of stroke among US adults. Sci Rep. (2024) 14:3516. doi: 10.1038/s41598-024-54087-9
22. Qu, H, and Zhang, S. Association of cardiovascular health and periodontitis: a population-based study. BMC Public Health. (2024) 24:438. doi: 10.1186/s12889-024-18001-2
23. Maten, N, Kroehl, ME, Loeb, DF, Bhat, S, Ota, T, Billups, SJ, et al. An evaluation of clinical decision support tools for patient health Questionnaire-9 administration. Ment Health Clin. (2021) 11:267–73. doi: 10.9740/mhc.2021.09.267
24. Udedi, M, Muula, AS, Stewart, RC, and Pence, BW. The validity of the patient health Questionnaire-9 to screen for depression in patients with type-2 diabetes mellitus in non-communicable diseases clinics in Malawi. BMC Psychiatry. (2019) 19:81. doi: 10.1186/s12888-019-2062-2
25. Sun, Y, Fu, Z, Bo, Q, Mao, Z, Ma, X, and Wang, C. The reliability and validity of PHQ-9 in patients with major depressive disorder in psychiatric hospital. BMC Psychiatry. (2020) 20:474. doi: 10.1186/s12888-020-02885-6
26. Wang, L, Lin, L, Chen, Y, Wang, T, and Lin, J. Correlates of depressive symptoms among middle-aged and older homeless adults using the 9-item patient health questionnaire. Int J Environ Res Public Health. (2020) 17:4754. doi: 10.3390/ijerph17134754
27. Liu, X, Wang, Y, Shen, L, Sun, Y, Zeng, B, Zhu, B, et al. Association between frailty and chronic constipation and chronic diarrhea among American older adults: National Health and nutrition examination survey. BMC Geriatr. (2023) 23:745. doi: 10.1186/s12877-023-04438-4
28. Shokouhi, N, Mohammadi, S, Ghanbari, Z, and Montazeri, A. Development of a new version of the Bristol stool form scale: translation, content validity, face validity, and reliability of the Persian version. BMJ Open Gastroenterol. (2022) 9:e001017. doi: 10.1136/bmjgast-2022-001017
29. Sinopoulou, V, Gordon, M, Rajindrajith, S, Hathagoda, W, Rane, A, Sedghi, A, et al. How do we define therapy-resistant constipation in children aged 4–18 years old? A systematic review with meta-narrative synthesis. BMJ Paediatr Open. (2024) 8:e002380. doi: 10.1136/bmjpo-2023-002380
30. Ogasawara, N, Kasugai, K, Funaki, Y, Ebi, M, Izawa, S, Tamura, Y, et al. Relationships between body mass index and constipation, gastroesophageal reflux disease, stool forms based on the Bristol stool form scale, and education level: results from an internet survey in Japan. J Clin Biochem Nutr. (2023) 73:84–90. doi: 10.3164/jcbn.22-143
31. Aziz, I, Whitehead, WE, Palsson, OS, Törnblom, H, and Simrén, M. An approach to the diagnosis and management of Rome IV functional disorders of chronic constipation. Expert Rev Gastroenterol Hepatol. (2020) 14:39–46. doi: 10.1080/17474124.2020.1708718
32. Shivappa, N, Steck, SE, Hurley, TG, Hussey, JR, and Hébert, JR. Designing and developing a literature-derived, population-based dietary inflammatory index. Public Health Nutr. (2014) 17:1689–96. doi: 10.1017/S1368980013002115
33. van Duijnhoven, FJB, Brouwer, JGM, van Woudenbergh, GJ, Kampman, E, and Feskens, EJM. Comment on "perspective: the dietary inflammatory index (DII)-lessons learned, improvements made, and future directions". Adv Nutr. (2020) 11:177–8. doi: 10.1093/advances/nmz087
34. Han, Y, Jiang, X, Qin, Y, Zhao, Y, Zhang, G, and Liu, C. A cross-sectional study exploring the relationship between the dietary inflammatory index and hyperlipidemia based on the National Health and nutrition examination survey (2005-2018). Lipids Health Dis. (2023) 22:140. doi: 10.1186/s12944-023-01908-x
35. Wirth, MD, Shivappa, N, Davis, L, Hurley, TG, Ortaglia, A, Drayton, R, et al. Construct validation of the dietary inflammatory index among African Americans. J Nutr Health Aging. (2017) 21:487–91. doi: 10.1007/s12603-016-0775-1
36. Tabung, FK, Smith-Warner, SA, Chavarro, JE, Wu, K, Fuchs, CS, Hu, FB, et al. Development and validation of an empirical dietary inflammatory index. J Nutr. (2016) 146:1560–70. doi: 10.3945/jn.115.228718
37. Sang, Z, Wang, H, Leng, Y, Huang, X, Sun, P, Wang, R, et al. Association of dietary inflammatory index with liver fibrosis and fatty liver index in a population with metabolic dysfunction-associated steatotic liver disease: a cross-sectional study. Front Nutr. (2025) 12:1594192. doi: 10.3389/fnut.2025.1594192
38. Wang, J, Qiu, Y, and Zhu, X. Trends of mental health care utilization among US adults from 1999 to 2018. BMC Psychiatry. (2023) 23:665. doi: 10.1186/s12888-023-05156-2
39. Jiang, C, Zhu, L, Yang, W, Yu, Z, Yang, W, Jin, X, et al. Evaluating the relationship between familial poverty, Helicobacter pylori seropositivity, and all-cause mortality in the general US population. Front Public Health. (2025) 13:1578257. doi: 10.3389/fpubh.2025.1578257
40. Kim, D, Glazier, RH, Zagorski, B, Kawachi, I, and Oreopoulos, P. Neighbourhood socioeconomic position and risks of major chronic diseases and all-cause mortality: a quasi-experimental study. BMJ Open. (2018) 8:e018793. doi: 10.1136/bmjopen-2017-018793
41. Restrepo, B. The protective effect of SNAP during economic downturns: Evidence from the COVID‐19 pandemic. Appl Econ Perspect Policy. (2023) 45:2141–60. doi: 10.1002/aepp.13345
42. Abdalla, SM, Yu, S, and Galea, S. Trends in cardiovascular disease prevalence by income level in the United States. JAMA Netw Open. (2020) 3:e2018150. doi: 10.1001/jamanetworkopen.2020.18150
43. Yogeswaran, V, Kim, Y, Franco, RL, Lucas, AR, Sutton, AL, LaRose, JG, et al. Association of Poverty-Income Ratio with Cardiovascular Disease and Mortality in Cancer survivors in the United States. PLoS One. (2024) 19:e0300154. doi: 10.1371/journal.pone.0300154
44. Tang, M, Liu, M, Zhang, Y, and Xie, R. Association of family income to poverty ratio and vibration-controlled transient elastography quantified degree of hepatic steatosis in U.S. adolescents. Front Endocrinol. (2023):14:1160625. doi: 10.3389/fendo.2023.1160625
45. Ding, L, Duan, J, Hou, J, Yang, T, Yuan, M, Ma, AH, et al. Association between dietary live microbe intake and chronic diarrhea and fecal incontinence: a cross-sectional NHANES 2005–2010 study. J Am Nutr Assoc. (2025) 44:342–52. doi: 10.1080/27697061.2024.2434585
46. Wang, P, Shen, X, Wang, Y, and Jia, X. Association between constipation and major depression in adult Americans: evidence from NHANES 2005-2010. Front Psych. (2023) 14:1152435. doi: 10.3389/fpsyt.2023.1152435
47. Juruena, MF, Bocharova, M, Agustini, B, and Young, AH. Atypical depression and non-atypical depression: is HPA axis function a biomarker? A systematic review. J Affect Disord. (2018) 233:45–67. doi: 10.1016/j.jad.2017.09.052
48. Gaffey, AE, Bergeman, CS, Clark, LA, and Wirth, MM. Aging and the HPA axis: stress and resilience in older adults. Neurosci Biobehav Rev. (2016) 68:928–45. doi: 10.1016/j.neubiorev.2016.05.036
49. Milaneschi, Y, Lamers, F, Berk, M, and Penninx, BWJH. Depression heterogeneity and its biological underpinnings: toward Immunometabolic depression. Biol Psychiatry. (2020) 88:369–80. doi: 10.1016/j.biopsych.2020.01.014
50. Majd, M, Saunders, EFH, and Engeland, CG. Inflammation and the dimensions of depression: a review. Front Neuroendocrinol. (2020) 56:100800. doi: 10.1016/j.yfrne.2019.100800
51. Koch, C, Wilhelm, M, Salzmann, S, Rief, W, and Euteneuer, F. A meta-analysis of heart rate variability in major depression. Psychol Med. (2019) 49:1948–57. doi: 10.1017/S0033291719001351
52. Marx, W, Lane, M, Hockey, M, Aslam, H, Berk, M, Walder, K, et al. Diet and depression: exploring the biological mechanisms of action. Mol Psychiatry. (2021) 26:134–50. doi: 10.1038/s41380-020-00925-x
53. Vuotto, C, Battistini, L, Caltagirone, C, and Borsellino, G. Gut microbiota and disorders of the central nervous system. Neuroscientist. (2020) 26:487–502. doi: 10.1177/1073858420918826
54. Li, J, Yu, R, Zhang, L, Wen, S, Wang, S, Zhang, X, et al. Dietary fructose-induced gut dysbiosis promotes mouse hippocampal neuroinflammation: a benefit of short-chain fatty acids. Microbiome. (2019) 7:98. doi: 10.1186/s40168-019-0713-7
55. Sun, M, Wang, L, Hu, Y, Wang, X, Yan, S, Guo, Y, et al. Cognitive impairment mediates the association between dietary inflammation and depressive symptoms in the elderly. Nutrients. (2022) 14:14. doi: 10.3390/nu14235118
56. Shivappa, N, Hébert, JR, Veronese, N, Caruso, MG, Notarnicola, M, Maggi, S, et al. The relationship between the dietary inflammatory index (DII(®)) and incident depressive symptoms: a longitudinal cohort study. J Affect Disord. (2018) 235:39–44. doi: 10.1016/j.jad.2018.04.014
57. Chen, G, Peng, C, Lian, Y, Wang, B, Chen, P, and Wang, G. Association between dietary inflammatory index and mental health: a systematic review and dose-response meta-analysis. Front Nutr. (2021) 8:662357. doi: 10.3389/fnut.2021.662357
58. Tang, M, Chang, X, Zheng, H, Zeng, F, Zhang, G, He, M, et al. Association of dietary inflammatory index and systemic inflammatory markers with mortality risk in depressed adults: a mediation analysis of NHANES data. Front Nutr. (2024) 11:1472616. doi: 10.3389/fnut.2024.1472616
59. Zhou, ZI, Li, X, Xiong, M, He, Y, Cheng, X, Deng, J, et al. Association between the dietary inflammatory index, bowel habits, and systemic serum inflammatory markers: insights from NHANES (2005–2010). Front Nutr. (2025) 12:1543715. doi: 10.3389/fnut.2025.1543715
60. Yang, S, Wu, X, W, S-q, Guo, X, Guo, F, and Sun, XF. Association of dietary energy intake with constipation among men and women: results from the national health and nutrition examination survey. Front Nutr. (2022) 9:856138. doi: 10.3389/fnut.2022.856138
61. Chen, L, Wang, X, Zhang, Y, Zhong, H, Wang, C, Gao, P, et al. Daidzein alleviates hypothalamic-pituitary-adrenal axis hyperactivity, ameliorates depression-like behavior, and partly rectifies circulating cytokine imbalance in two rodent models of depression. Front Behav Neurosci. (2021) 15:671864. doi: 10.3389/fnbeh.2021.671864
62. Craig, CF, Filippone, RT, Stavely, R, Bornstein, JC, Apostolopoulos, V, and Nurgali, K. Neuroinflammation as an etiological trigger for depression comorbid with inflammatory bowel disease. J Neuroinflammation. (2022) 19:4. doi: 10.1186/s12974-021-02354-1
63. Qi, C, and Gou, R. Association of dietary saturated fatty acid intake with depression: mediating effects of the dietary inflammation index. Front Nutr. (2024) 11:1396029. doi: 10.3389/fnut.2024.1396029
64. Bharucha, AE, and Lacy, BE. Mechanisms, evaluation, and Management of Chronic Constipation. Gastroenterology. (2020) 158:1232–1249.e3. doi: 10.1053/j.gastro.2019.12.034
65. Tavares, CD, Bell, CN, Zare, H, Hudson, D, and Thorpe, RJJ. Allostatic load, income, and race among black and white men in the United States. Am J Mens Health. (2022) 16:15579883221092290. doi: 10.1177/15579883221092290
66. Liu, J, Song, Y, Luo, R, Wang, S, Pan, P, and Han, L. Association between urinary heavy metals and cardiovascular-kidney-metabolic syndrome: mediating roles of TyG, WWI, and eGFR. Front Nutr. (2025) 12:1613721. doi: 10.3389/fnut.2025.1613721
67. Ma, Y, Li, R, Zhan, W, Huang, X, Zhang, Z, Lv, S, et al. Role of BMI in the relationship between dietary inflammatory index and depression: an intermediary analysis. Front Med. (2021) 8:748788. doi: 10.3389/fmed.2021.748788
Keywords: depression, constipation, NHANES, mediation analysis, DII, PIR
Citation: Huang Q, Zhou H, Yang M, Meng Y and Wang L (2025) Dietary inflammation and socioeconomic status mediate depression–constipation link: a cross-sectional analysis of NHANES 2005–2010. Front. Nutr. 12:1668654. doi: 10.3389/fnut.2025.1668654
Edited by:
Desirée Victoria-Montesinos, UCAM Universidad Católica de Murcia, SpainReviewed by:
Ezequiel Pinto, University of Algarve, PortugalFatemeh Pourteymour Fard Tabrizi, Tabriz University of Medical Sciences, Iran
Copyright © 2025 Huang, Zhou, Yang, Meng and Wang. This is an open-access article distributed under the terms of the Creative Commons Attribution License (CC BY). The use, distribution or reproduction in other forums is permitted, provided the original author(s) and the copyright owner(s) are credited and that the original publication in this journal is cited, in accordance with accepted academic practice. No use, distribution or reproduction is permitted which does not comply with these terms.
*Correspondence: Qiulu Huang, MTgwNjk4NTI3MzNAMTYzLmNvbQ==; Lina Wang, MTc3NTg4MjU0NkBxcS5jb20=