 Yuejie Lu
 Yinuo Wang
 Renjie Huang
 Hejing Pan
 Zhijun Xie
 Chengping Wen
 Lin Huang
 Xuanlin Li
- 1The First Affiliated Hospital of Zhejiang Chinese Medical University (Zhejiang Provincial Hospital of Chinese Medicine), Hangzhou, China
- 2The Second Clinical Medical School, Zhejiang Chinese Medical University, Hangzhou, China
- 3School of Basic Medicine Sciences, Zhejiang Chinese Medical University, Hangzhou, China
Objective: This meta-analysis aimed to investigate the association between sugar-sweetened beverages (SSBs), fructose, and the risk of gout and hyperuricemia.
Methods: Following PRISMA guidelines, we systematically searched PubMed, EMBASE, and Cochrane Library for observational studies from inception to March 2025. Adjusted odds ratios (ORs) with 95% confidence intervals (CIs) were pooled using random/fixed-effects models. Subgroup analyses explored sex. Heterogeneity (I2) and publication bias were assessed.
Results: A total of 22 studies (235,790 participants) were included. SSB intake significantly increased the risk of hyperuricemia (OR = 1.33, 95% CI: 1.23–1.44) and gout (OR = 1.21; 95% CI 1.11–1.32). Fruit juice (FJ) showed a modest association with hyperuricemia (OR = 1.15, 95% CI: 1.02–1.29) and an increased risk of gout (OR = 1.28; 95% CI 0.96–1.72). Fructose consumption was strongly associated with increased gout risk (OR = 1.66, 95% CI: 1.27–2.18), but its relationship with hyperuricemia was inconsistent (OR = 1.12, 95% CI: 0.85–1.46). DSD showed a modest association with gout (OR = 1.14; 95% CI 0.95–1.35). Subgroup analysis revealed SSB and FJ consumption associated with elevated risks of hyperuricemia in males (SSBs: 1.37; FJ: 1.15) compared to females (SSBs: 1.29; FJ: 1.13).
Conclusions: SSB consumption is associated with increased risks of hyperuricemia and gout, particularly in males.
Systematic review registration: https://www.crd.york.ac.uk/PROSPERO/display_record.php?RecordID=1040227, PROSPERO (Unique Identifier: CRD420251040227).
1 Introduction
Gout is a metabolic disorder characterized by hyperuricemia which is defined as a serum urate level exceeding 7.0 mg/dl in men and 5.7 mg/dl in women (1). This condition leads to the formation of monosodium urate crystals, resulting in painful recurrent flares and tissue damage (2–4). The prevalence of gout varies globally, ranging from < 1 to 6.8%, with an incidence of 0.58−2.89 cases per 1,000 person-years (5). In addition to its acute symptoms, gout and hyperuricemia are strongly associated with a range of comorbidities, including hypertension, diabetes mellitus, metabolic syndrome, and cardiovascular diseases (6). Whilst gout can be eradicated with urate-lowering therapy and reduce the risk of recurrence by controlled diet, treatment options remain suboptimal (7, 8). Various factors contribute to the development of gout, including comorbidities, genetic pre-disposition, obesity, environmental influences, and dietary habits (6, 7, 9). Among these, diet plays a critical role in the onset and progression of the disease. Excessive consumption of sugar, particularly fructose, places an additional strain on the kidneys and has been linked to the development of chronic kidney disease, which in turn increases the risk of gout and hyperuricemia (10).
Sugar-sweetened beverages (SSBs) are a major source of added sugars in the diet (11). From 1990 to 2018, the global consumption of SSBs among children and adolescents increased by 23% (12), and a model estimated that 184,000 deaths/year worldwide attributable to SSB consumption (13). There is compelling evidence that the consumption of SSBs is directly associated with the risk of cardiovascular disease, cancer, neurological disorders, ectopic fat accumulation, and endocrine/metabolic outcomes (14, 15).
SSB consumption is increasingly recognized to increase the risk of gout and hyperuricemia. A meta-analysis of prospective studies noted an adverse association between SSB and juice intake and incident gout. However, the scope of the analysis was limited to a smaller number of studies (16). Another meta-analysis established a significant positive association between SSB intake and the risk of gout and hyperuricemia, though its inclusion of literature remains constrained (17). To address these limitations, we therefore performed the updated meta-analysis additional study with a new collection of 11 newly published studies after 2017, aimed to overcomes the challenges of small study inclusion, thereby enhancing the reliability and comprehensiveness of the findings, and to fill the gap in quantitative evidence regarding the impact of SSBs and dietary fructose as modifiable risk factors for hyperuricemia and gout.
2 Method
The meta-analysis followed the guidelines of the Preferred Reporting Items for Systematic Reviews and Meta-Analyses (PRISMA) (18). The protocol was pre-registered with the International Prospective Register of Systematic Reviews (PROSPERO) under the approval number CRD420251040227.
2.1 Data sources
A comprehensive search of PubMed, EMBASE, and the Cochrane Library databases was conducted up to March 7, 2025. The search was performed by two independent investigators using both Medical Subject Headings (MeSH) and keywords. The terms included “Sugar-Sweetened Beverages,” “Artificially Sweetened Beverages,” “Fructose,” “Gout,” and related outcomes such as “Hyperuricemia” and “Uric Acid.” Search details are provided in Supplementary Tables S1–S3.
2.2 Eligibility criteria
We included observational studies that were (1) case-control, cohort, or cross-sectional in design, and (2) investigated the relationship between sugar-sweetened beverages (SSBs) or fructose and the risk of gout or hyperuricemia.
Studies were excluded if they did not report relative risks (RRs), hazard ratios (HRs), or odds ratios (ORs) with corresponding 95% confidence intervals (CIs), as well as reviews, conference abstracts, case reports, editor letters, duplicate publications, and studies without relevant outcomes.
2.3 Study selection
Two reviewers (YN Wang and YJ Lu) independently screened the titles and abstracts of articles, excluding duplicates and irrelevant studies. Full texts of potentially eligible studies were retrieved and assessed for eligibility. Disagreements were resolved by a third reviewer (XL Li).
2.4 Data extraction
Data extraction was performed independently by the two aforementioned reviewers (YN Wang and YJ Lu), following systematic review guidelines (19). Pre-designed forms were used to extract data on the first author, year of publication, country, age, sex, sample size, study type, exposure and outcome assessments, and follow-up duration. Any discrepancies were resolved through discussion with XL Li.
2.5 Risk of bias
The Agency for Healthcare Research and Quality (AHRQ) checklist (https://www.ncbi.nlm.nih.gov/books/NBK35156/) was used to assess the quality of cross-sectional studies, categorizing them as low (< 4 “yes” responses), medium (4–6 “yes” responses), or high (>7 “yes” responses).
For longitudinal studies, the Newcastle-Ottawa Scale (NOS; http://www.ohri.ca/programs/clinical_epidemiology/oxford.asp) was used, with studies classified as low (0–3), moderate (4–6), or high (7–9) quality based on their star ratings.
2.6 Statistical analysis
We extracted adjusted ORs, RRs, HRs, and 95% CIs to evaluate the associations between exposures and outcomes. Given design heterogeneity, we treated HR/RR as relative risk proxies and OR as a prevalence ratio under low-prevalence assumptions (20, 21). Heterogeneity was assessed using Cochran' χ2 test (P < 0.1) and I2 statistic (I2 > 50% indicating substantial heterogeneity). For low heterogeneity (P ≥ 0.1, I2 ≤ 50%), fixed-effects models (Mantel–Haenszel) were used, while random-effects models (DerSimonian–Laird) were applied for moderate/high heterogeneity. Sensitivity analyses excluded studies based on design to test robustness, and subgroup analyses were performed by sex and design to explore heterogeneity. Publication bias was evaluated using funnel plot inspection and Egger's regression (P < 0.05). Statistical analyses were conducted using Stata 14.0 (Stata Corp, TX, USA).
3 Result
3.1 Study selection
Our search strategy identified 4,143 articles. After removing 1,152 duplicates, 2,991 abstracts were reviewed in detail. Of these, 2,960 were excluded based on title and abstract screening. Among the remaining 31 studies, nine were further excluded for the following reasons: one study reported an incorrect population, four lacked effect values or CIs, one did not analyze the target exposure independently, and three did not meet the eligibility criteria. Ultimately, 22 studies were included in the systematic review (22–43). A flowchart of the selection process is shown in Figure 1. Excluded studies and their reasons are listed in Supplementary Table S4.
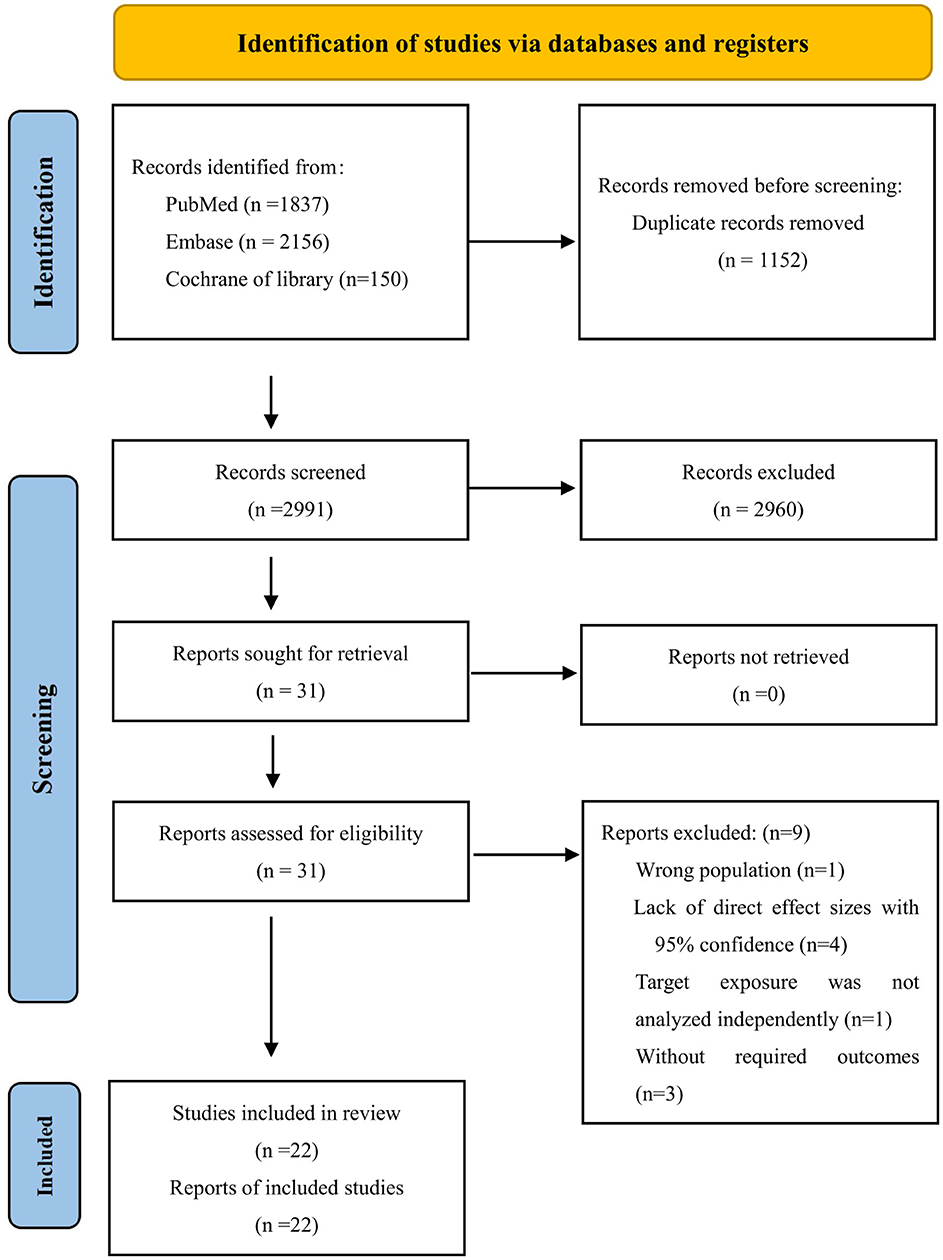
Figure 1. PRISMA flowchart of study selection.
3.2 Study characteristics
This meta-analysis included 22 studies, with a total of 235,790 participants, published up to January 12, 2025. The studies were diverse: 14 cross-sectional, seven prospective cohort, and one case-control. Most assessed SSB and fructose intake using validated FFQs, while some relied on 24-h recalls or self-reported questionnaires. Diagnostic criteria for hyperuricemia and gout were well-defined across most studies. Follow-up durations ranged from 2 to 22 years. Key confounders adjusted for included age, sex, BMI, energy intake, alcohol, hypertension, diabetes, and dietary factors. The studies represented a global population, with participants from Asia (China, South Korea, and Singapore), North America (USA, Mexico), South America (Brazil), and Oceania (New Zealand). Key study characteristics are summarized in Table 1.
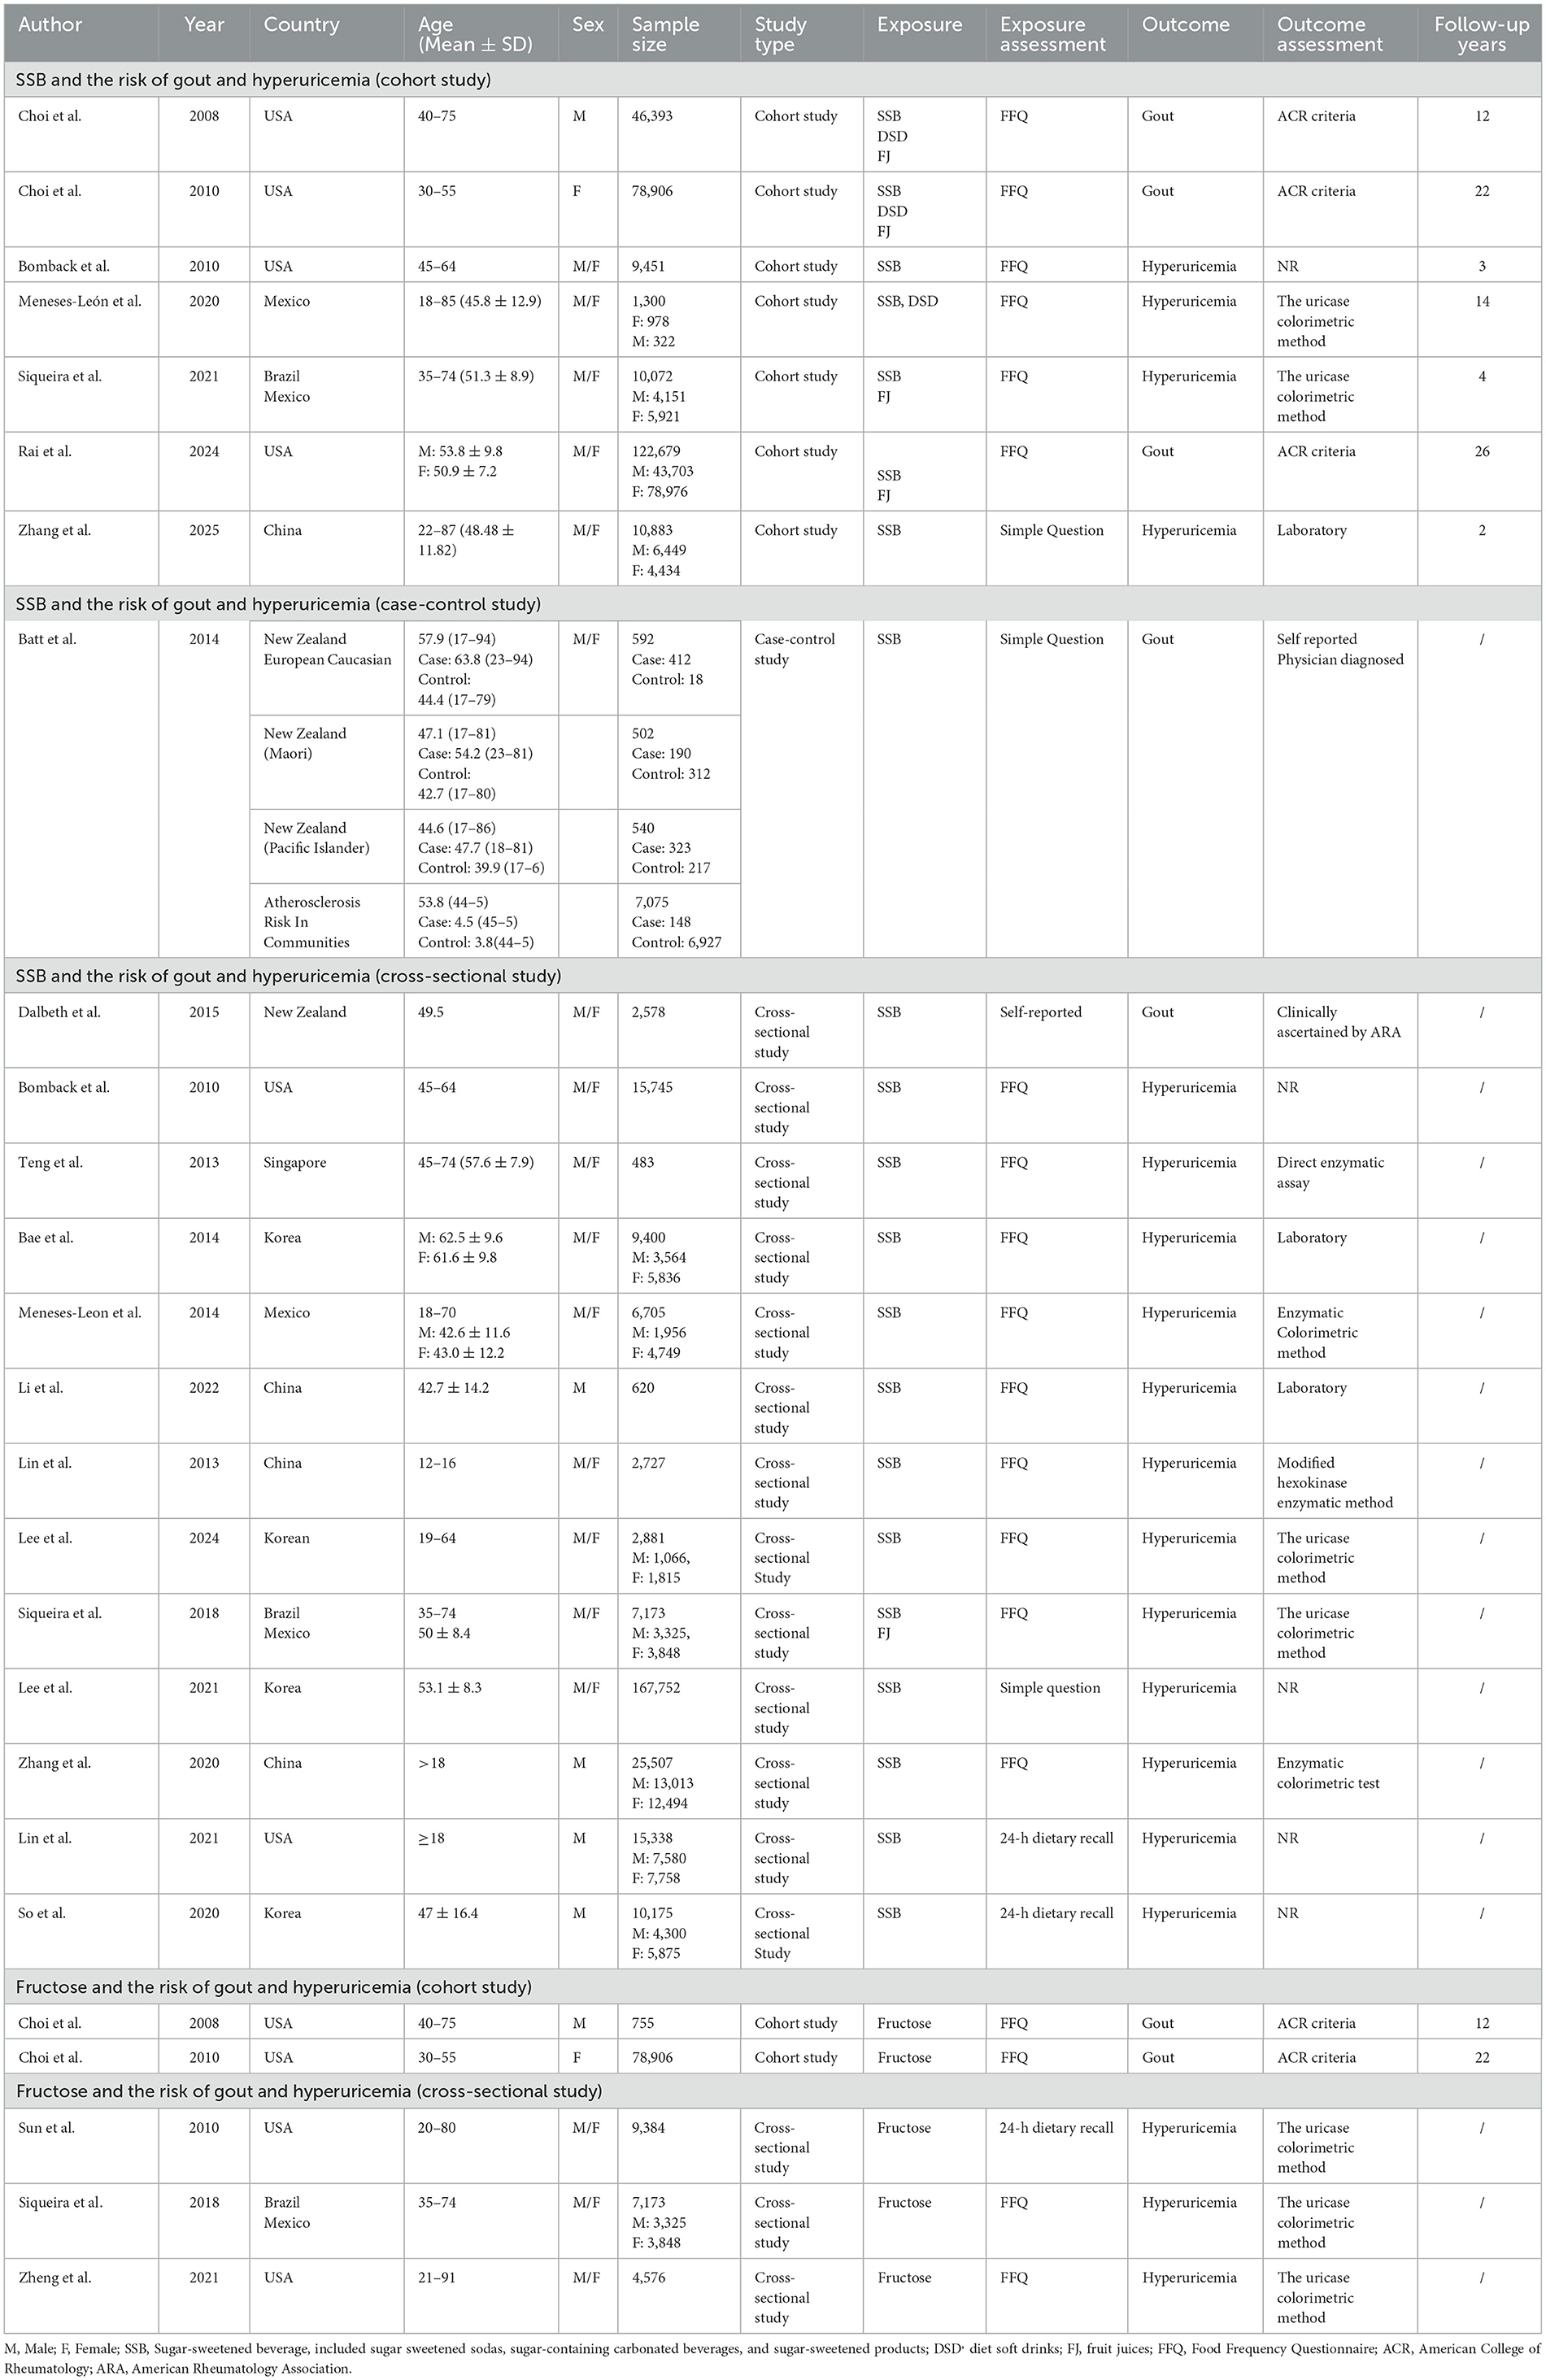
Table 1. Characteristics of the included studies.
3.3 Quality assessment
Cross-sectional studies had an average AHRQ score of 7.81/11 (Supplementary Table S5), and longitudinal studies scored 7.63/9 on the NOS, indicating overall good quality (Supplementary Table S6).
3.4 SSB and hyperuricemia risk
The meta-analysis of 15 studies found a significant association between SSB consumption and increased hyperuricemia risk [OR = 1.33, 95% CI (1.23, 1.44), I2 = 72.4%, P = 0.000] (Figure 2). Despite high heterogeneity, sensitivity analysis confirms result stability (Supplementary Figure S1).
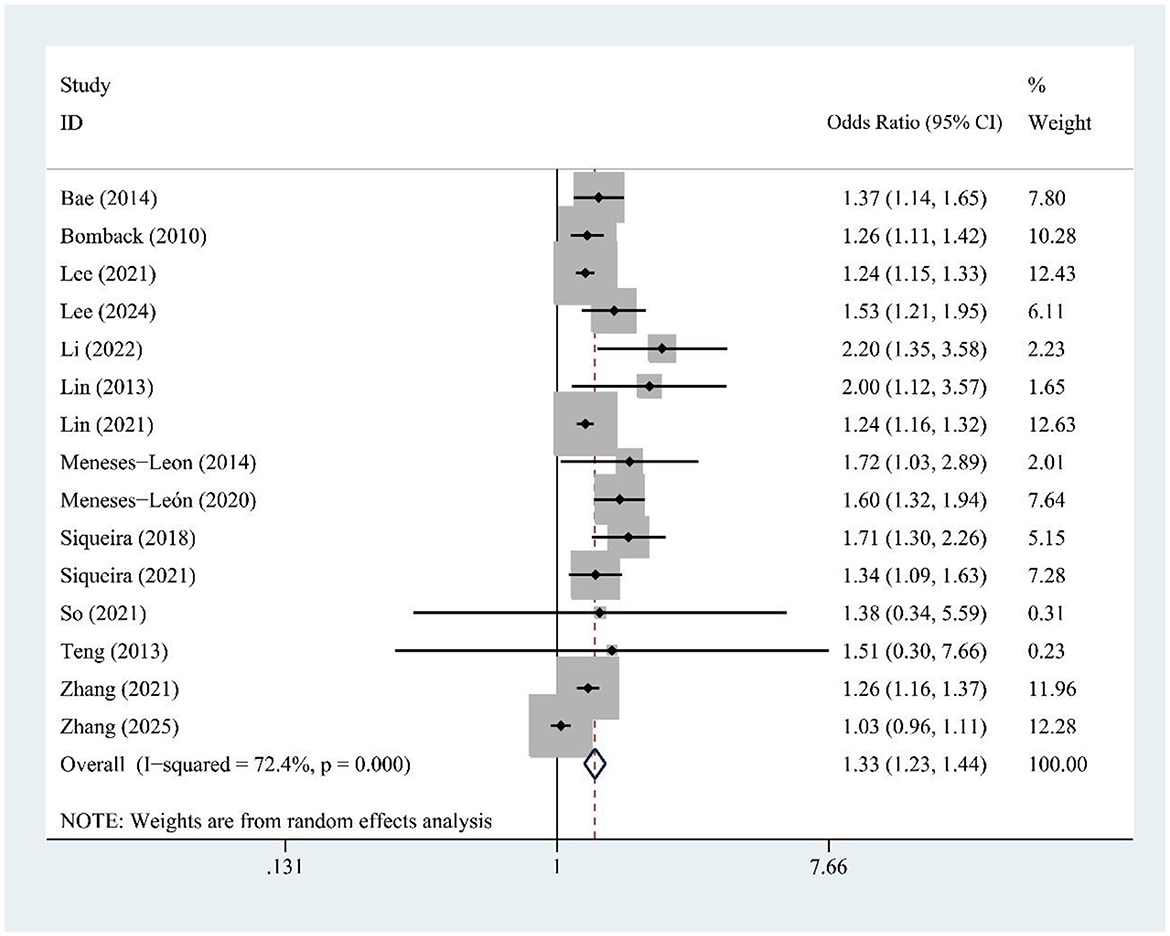
Figure 2. Forest plot of the association between sugar-sweetened beverage (SSB) consumption and hyperuricemia risk.
3.5 FJ and hyperuricemia risk
Fruit juice (FJ) intake (four studies) was modestly associated with hyperuricemia risk [OR = 1.15, 95% CI (1.02, 1.29), I2 = 0.0%, P = 0.732] (Figure 3).
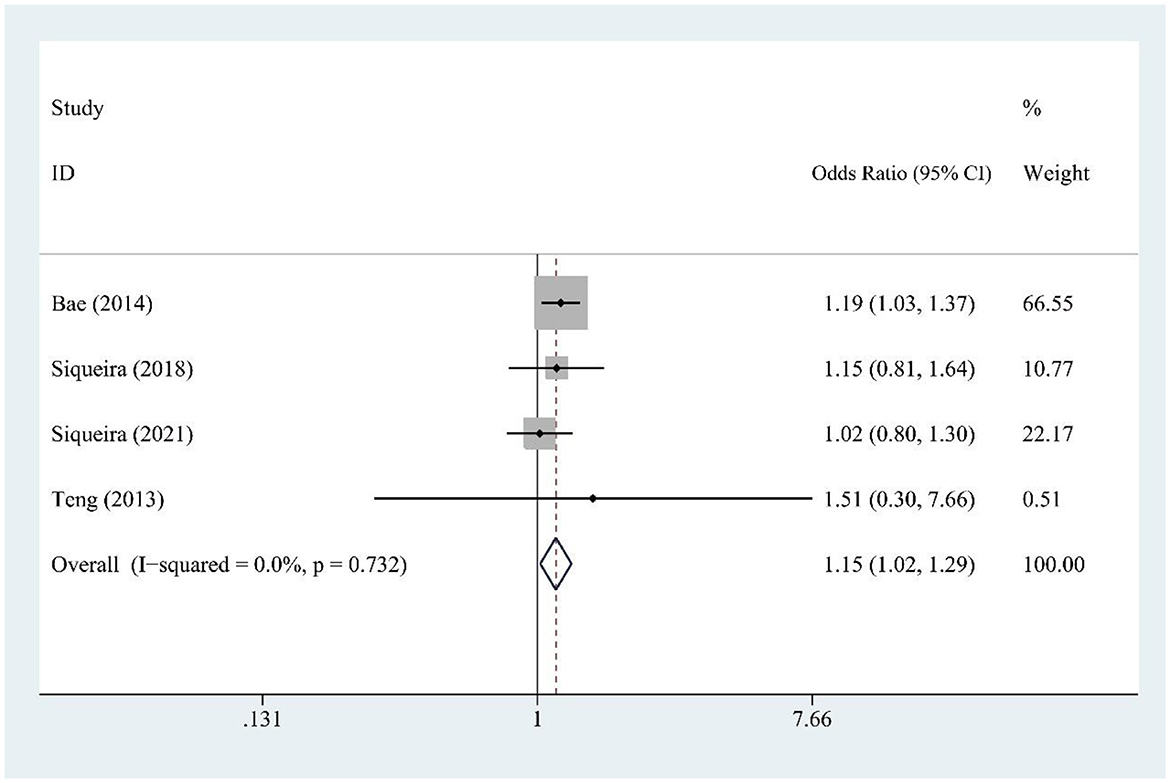
Figure 3. Forest plot of the association between fruit juice (FJ) consumption and hyperuricemia risk.
3.6 Fructose and hyperuricemia risk
Fructose consumption (three studies) was not significantly associated with hyperuricemia risk [OR = 1.12, 95% CI (0.93, 1.85), I2 = 74.1%, P = 0.021] (Figure 4). Moderate heterogeneity indicates some variability. Sensitivity testing showed no substantial changes in the findings (Supplementary Figure S2).
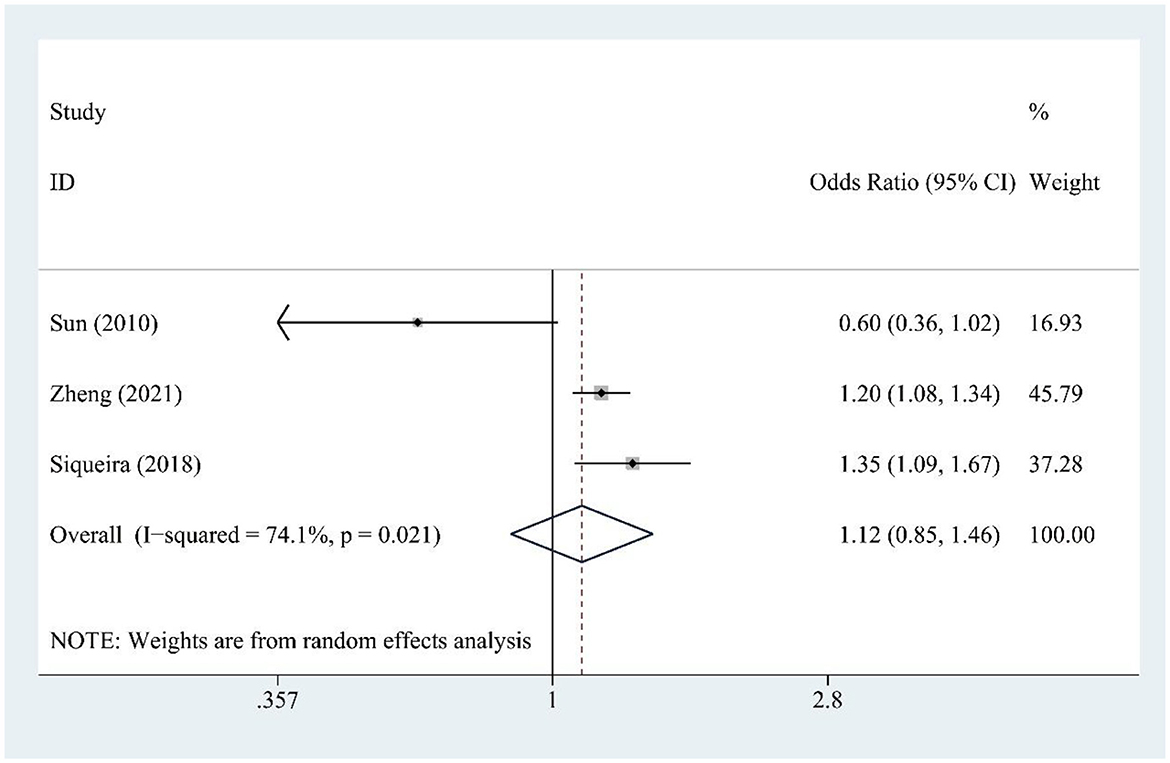
Figure 4. Forest plot of the association between fructose consumption and hyperuricemia risk.
3.7 SSB and gout risk
SSB consumption (five studies) was significantly associated with increased gout risk [OR = 1.21, 95% CI (1.11, 1.32), I2 = 21.7%, P = 0.276] (Figure 5), with low heterogeneity supporting consistent findings.
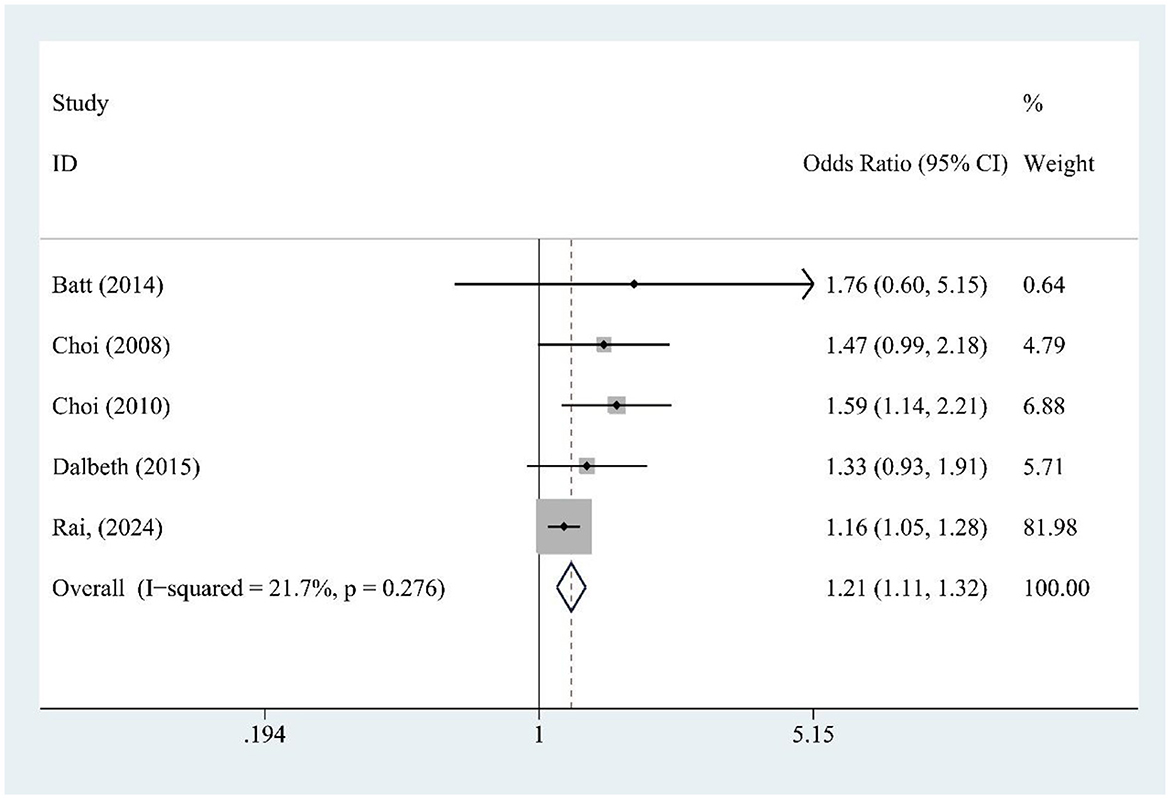
Figure 5. Forest plot of the association between sugar-sweetened beverage (SSB) consumption and gout risk.
3.8 FJ and gout risk
FJ intake (three studies) was not significantly associated with gout risk [OR = 1.28, 95% CI (0.96, 1.72), I2 = 70.5%, P = 0.034] (Figure 6), though high heterogeneity suggests variability among studies. Sensitivity analysis confirms result stability (Supplementary Figure S3).
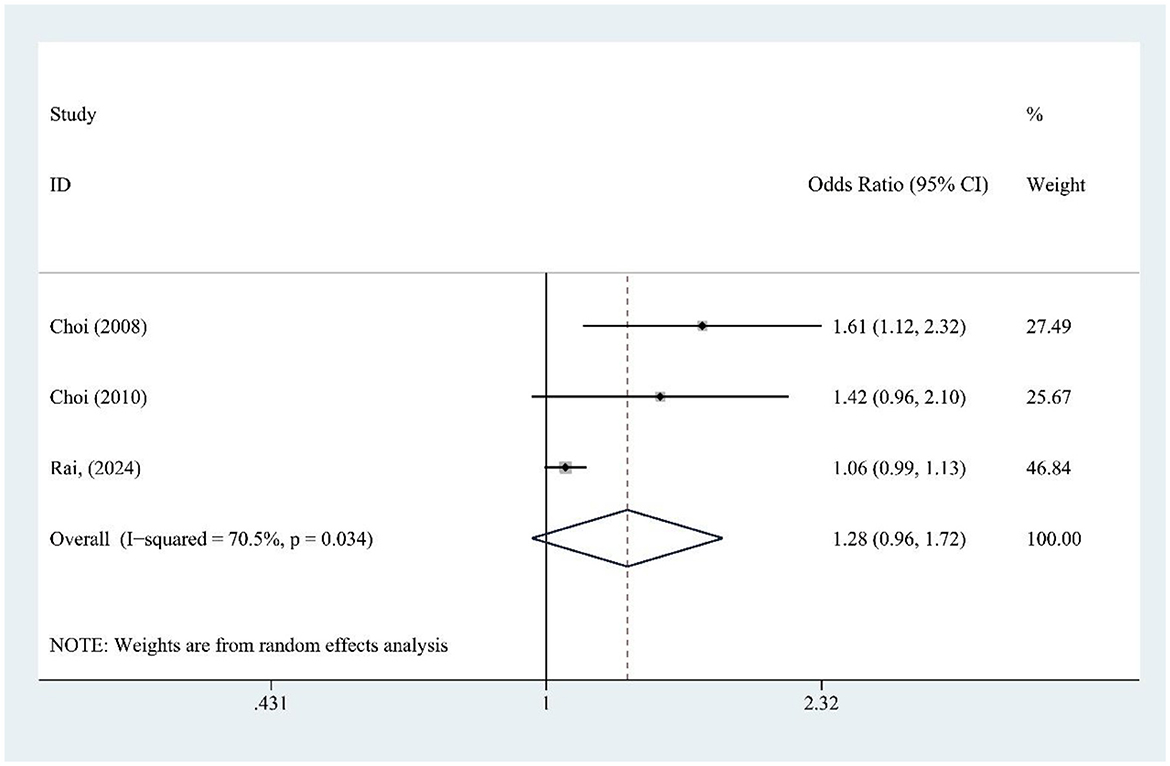
Figure 6. Forest plot of the association between fruit juice (FJ) consumption and gout risk.
3.9 DSD and gout risk
DSD consumption (two studies) showed no significant association with gout risk [OR = 1.14, 95% CI (0.95, 1.35), I2 = 0.0%, P = 0.587] (Figure 7), with no heterogeneity indicating reliable findings.
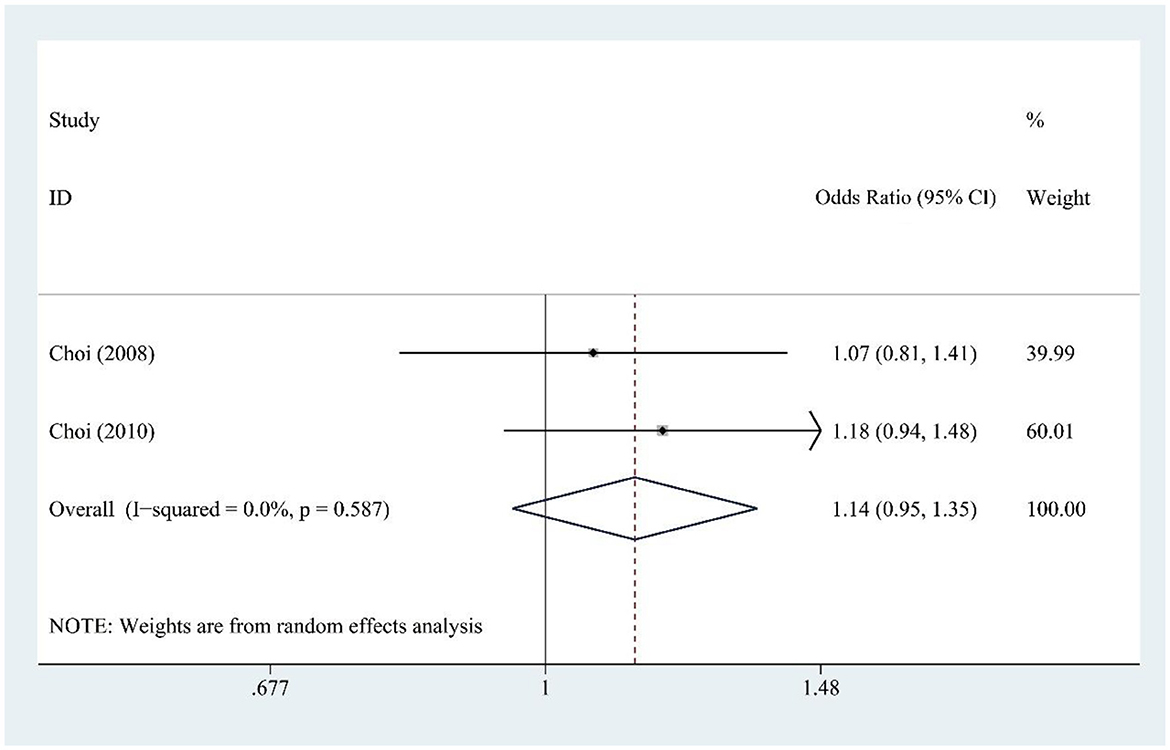
Figure 7. Forest plot of the association between diet soft drink (DSD) consumption and gout risk.
3.10 Fructose and gout risk
Fructose intake (two studies) was significantly associated with increased gout risk [OR = 1.66, 95% CI (1.27, 2.18), I2 = 0.0%, P = 0.429] (Figure 8), showing a strong and consistent effect across studies.
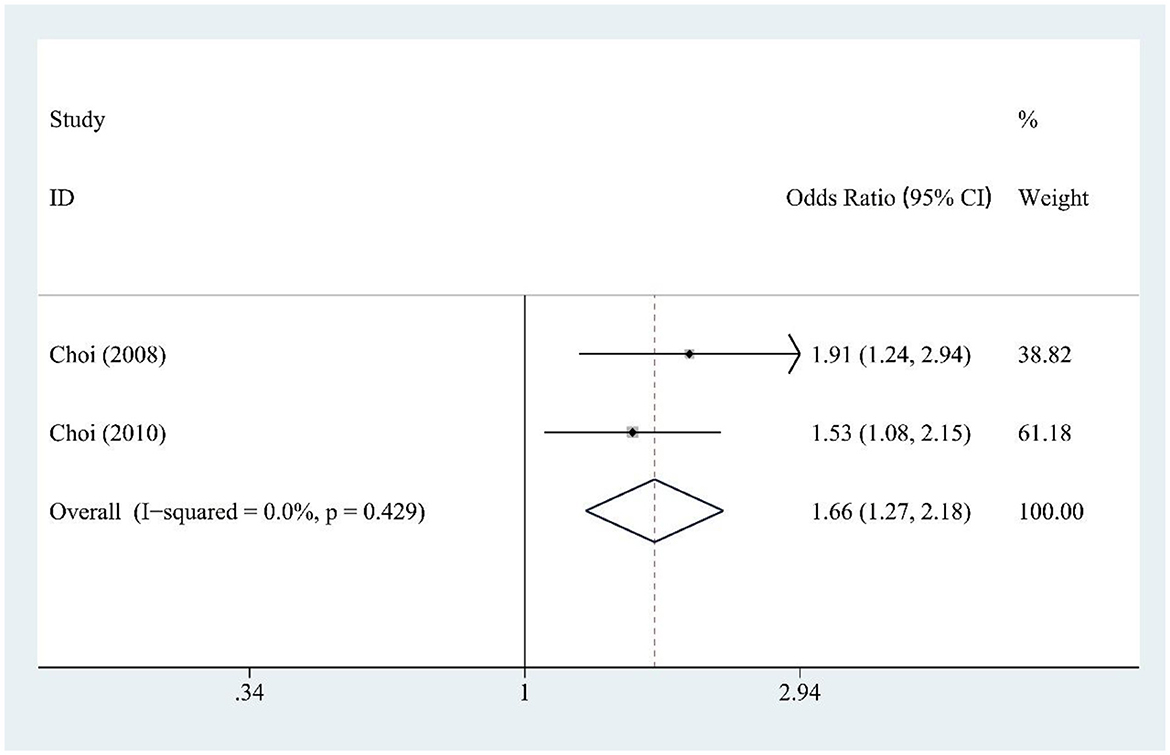
Figure 8. Forest plot of the association between fructose consumption and gout risk.
3.11 Subgroup analysis
Among females (eight studies), SSB intake was significantly associated with higher hyperuricemia risk [OR = 1.29, 95% CI (1.10, 1.50), I2 = 37.2%, P = 0.132] (Table 2). Males (eight studies) showed a stronger association [OR = 1.37, 95% CI (1.16, 1.63), I2 = 80.1%, P = 0.000] (Table 2).
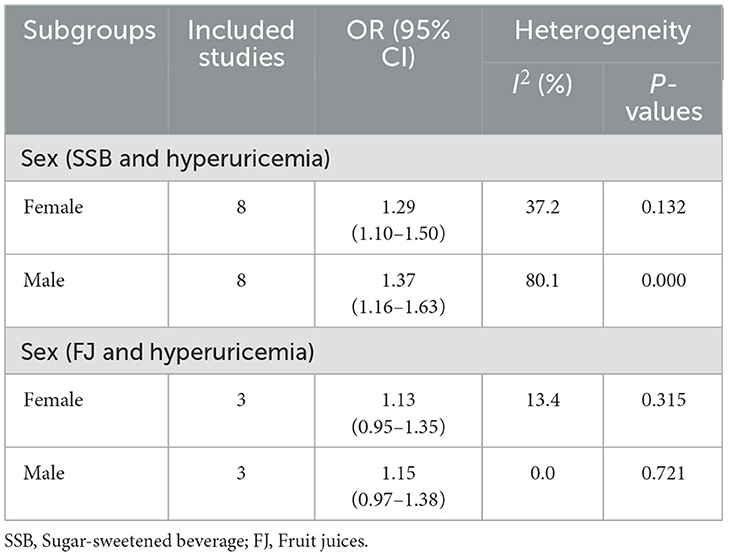
Table 2. Subgroup analysis for the risk of SSB and hyperuricemia and gout.
For FJ, no significant association with hyperuricemia risk was found in either females (three studies) [OR = 1.13, 95% CI (0.95, 1.35), I2 = 13.4%, P = 0.315] or males (three studies) [OR = 1.15, 95% CI (0.97, 1.38), I2 = 0.0%, P = 0.721] (Table 2).
3.12 Publication bias
For SSB and hyperuricemia, Begg's test showed no significant bias (P = 0.181), but Egger's test suggested small-study effects (P = 0.012; Supplementary Figure S4A). No bias was detected for FJ (P = 1.000, P = 0.243) or fructose (P = 1.000, P = 0.279; Supplementary Figures S4B, C). Publication bias for SSB and gout was inconclusive, with marginal significance for bias in Egger's test (P = 0.047; Supplementary Figure S5A). No significant bias was found for FJ and gout (Supplementary Figure S5B), and DSD and gout (Supplementary Figure S5C). Fructose and gout analysis was inconclusive due to the small sample size (Supplementary Figure S5D).
4 Discussion
4.1 Main findings
The findings of this meta-analysis of 235,790 participants suggest that SSB consumption is at significantly increased risks of hyperuricemia and gout, and the risk is higher in males than in females. The findings also emphasize the need for early intervention and continuous monitoring of people with large SSB consumption.
4.2 Comparison with previous meta-analyses
In recent years, increasing numbers of observational studies have reported the increased risk of hyperuricemia and gout in people with SSB consumption. Previous meta-analysis (16), based on three studies, concluded that a history of SSB consumption was associated with a 1.77 (1.20–2.61; I2 = 0.0%) times increased risk of incident gout, and FJ consumption was associated with a 2.08 (1.40–3.08; I2 = 0.0%) times increased risk of incident gout. However, the number of studies included in this study was too small and did not explore the association between SSBs and hyperuricemia. Another meta-analysis (17) based on nine studies, showed SSB consumption was associated with a 1.35 (1.18–1.55, I2 = 40.1%) times increased risk of incident gout, a 1.33 (1.06–1.66, I2 = 0.0%) times increased risk of prevalent gout, and a 1.35 (1.19–1.52, I2 = 41.4%) times increased risk of hyperuricemia. But this study did not analyze SSBs separately from FJ. In this meta-analysis, we found that consumption of SSBs was associated with a 1.33-fold increased risk of hyperuricemia and a 1.21-fold increased risk of gout. Consumption of FJ was linked to a 1.15-fold increased risk of hyperuricemia and a 1.28-fold increased risk of gout. Additionally, we analyzed that fructose consumption was associated with a 1.12-fold increased risk of hyperuricemia and a 1.66-fold increased risk of gout. Also, DSD consumption was found to have a 1.14-fold increased risk of gout. The subgroup analysis indicated that the risk of SSBs and FJ for hyperuricemia was higher in male.
This study had several advantages over previous meta-analysis. Firstly, our study incorporated the most recent and most comprehensive data to obtain a more complete understanding of the associations. Secondly, we examined the risk of developing hyperuricemia and gout for SSBs, FJ, fructose, and DSD consumption separately, with subgroup analyses by gender.
4.3 Potential underlying mechanisms
SSB-associated hyperuricemia and gout risks arise through interconnected metabolic pathways. Glucose from SSBs fuels purine synthesis via the pentose phosphate pathway, increasing phosphoribosyl pyrophosphate availability for nucleotide formation (44). Excessive glucose intake—a cardinal manifestation of nutrient surplus—activates mTOR/HIF-1α signaling. This dual activation drives anabolic shifts and oxidative stress, while simultaneously inducing insulin resistance. Collectively, these perturbations culminate in proximal tubule dysfunction, thereby impairing renal urate excretion (45–47).
Fructose uniquely drives hyperuricemia through direct hepatic metabolism. Its phosphorylation by fructokinase generates fructose-1-phosphate (F1P), depleting adenosine triphosphate (ATP) and inorganic phosphate (Pi). This impairs adenosine diphosphate (ADP) phosphorylation, trapping F1P while adenylate kinase converts accumulating ADP to adenosine monophosphate (AMP)—a direct uric acid precursor. Concurrently, ATP/Pi depletion attenuates feedback inhibition of urate production, amplifying hyperuricemia (33, 48). While chronic intake downregulates urate excretion transporters thereby reducing uric acid excretion (49). Emerging evidence implicates fructose-mediated gut microbiota alterations in gout pathogenesis (50), suggesting novel therapeutic targets. These mechanisms underscore the importance of SSB reduction in metabolic disorder prevention strategies.
Women have a higher rate of urate excretion and a lower rate of post-secretory reabsorption of renal tubular urate compared to men (51), which may be due to the effect of estrogen (52). This evidence is consistent with the results of our subgroup analysis.
4.4 Clinical recommendations
SSB intake is associated with a higher risk of hyperuricemia and gout, especially in males. Clinically, it is common to routinely inquire about the intake history of SSBs in patients with obesity, hypertension, and chronic kidney disease. In combination with the WHO and WCRF/AICR recommendations and our findings, we recommend reducing the consumption of free sugars or added sugars to below 25 g/day and limiting the consumption of sugar sweetened beverages to less than one serving a week (approximately 200–355 ml/week). Nevertheless, adherence to this precise threshold may be impractical across diverse socioeconomic and cultural contexts. A more feasible public health objective is to prioritize reduction in SSB consumption overall, as any decrease confers benefit. Achieving this requires complementary policy interventions—such as SSB taxation, marketing restrictions, improved nutrition labeling, and enhanced access to healthier beverages—to enable sustained population-level behavior change. To change sugar consumption patterns, especially for children and adolescents, a combination of widespread public health education and policies worldwide is urgently needed (14). In particular, male patients should be more strictly restricted from consuming SSBs due to a higher risk associated with gender differences.
4.5 Strengths and limitations
This meta-analysis robustly links SSB intake to hyperuricemia and gout risks across diverse populations (n = 235,790), with methodological strengths including PRISMA adherence, sensitivity analyses, and high-quality study inclusion. Limitations encompass: (1) causal inference constraints from 14 cross-sectional studies (of 22) due to potential reverse causality (e.g., post-diagnosis SSB reduction); (2) elevated heterogeneity likely attributable to variations in study design, exposure/outcome assessment, intake units, recall bias, diet/lifestyle factors, residual confounders, dietary patterns, and diagnostic criteria, potentially affecting results despite robust sensitivity analyses; (3) limited statistical power for DSD/fructose analyses, along with feasibility challenges in defining heterogeneous beverage categories, such as distinguishing between natural and added-sugar juices or artificial and non-caloric sweeteners, due to the necessitated reliance on prior classifications that may confound outcomes; and (4) geographic bias toward predominantly Asia and North America, non-uniform SSB assessment methods, and unspecified serum urate assays in some studies, all of which potentially contribute to publication bias. Evidence quality is anticipated to improve with future updates, more high-quality studies, broader geographic data, and standardized measurements.
5 Conclusions
SSB intake is associated with a higher risk of hyperuricemia, especially in males, and a modest increase in the risk of gout. FJ intake posed a slight risk for hyperuricemia and gout. Fructose intake was not significantly associated with hyperuricemia risk but significantly associated with gout risk. DSD intake posed a slight risk for gout. The results highlight the need to reduce and continuous monitor SSB intake, especially in high-risk populations.
Data availability statement
The original contributions presented in the study are included in the article/Supplementary material, further inquiries can be directed to the corresponding authors.
Author contributions
YL: Data curation, Formal analysis, Methodology, Writing – original draft, Writing – review & editing. YW: Data curation, Formal analysis, Writing – original draft, Writing – review & editing. RH: Formal analysis, Writing – original draft, Writing – review & editing. HP: Data curation, Formal analysis, Methodology, Writing – review & editing. ZX: Funding acquisition, Project administration, Writing – review & editing. CW: Funding acquisition, Project administration, Writing – review & editing. LH: Methodology, Project administration, Writing – review & editing. XL: Methodology, Project administration, Writing – original draft, Writing – review & editing.
Funding
The author(s) declare that financial support was received for the research and/or publication of this article. This work was supported by grants from the National Natural Science Foundation of China (No. 82374393), the National Key R&D Program of China (No. 2022YFC3501204), the Key R&D Program of Zhejiang (No. 2023C03040), and the Science and Technology Department of the State Administration of Traditional Chinese Medicine - Zhejiang Province Co construction Project (GZY-ZJ-KJ-24012).
Conflict of interest
The authors declare that the research was conducted in the absence of any commercial or financial relationships that could be construed as a potential conflict of interest.
Generative AI statement
The author(s) declare that no Gen AI was used in the creation of this manuscript.
Any alternative text (alt text) provided alongside figures in this article has been generated by Frontiers with the support of artificial intelligence and reasonable efforts have been made to ensure accuracy, including review by the authors wherever possible. If you identify any issues, please contact us.
Publisher's note
All claims expressed in this article are solely those of the authors and do not necessarily represent those of their affiliated organizations, or those of the publisher, the editors and the reviewers. Any product that may be evaluated in this article, or claim that may be made by its manufacturer, is not guaranteed or endorsed by the publisher.
Supplementary material
The Supplementary Material for this article can be found online at: https://www.frontiersin.org/articles/10.3389/fnut.2025.1669129/full#supplementary-material
References
1. Chen-Xu M, Yokose C, Rai SK, Pillinger MH, Choi HK. Contemporary prevalence of gout and hyperuricemia in the United States and decadal trends: the National Health and Nutrition Examination Survey, 2007-2016. Arthritis Rheumatol. (2019) 71:991–9. doi: 10.1002/art.40807
3. Pillinger MH, Mandell BF. Therapeutic approaches in the treatment of gout. Semin Arthritis Rheum. (2020) 50:S24–30. doi: 10.1016/j.semarthrit.2020.04.010
5. Dehlin M, Jacobsson L, Roddy E. Global epidemiology of gout: prevalence, incidence, treatment patterns and risk factors. Nat Rev Rheumatol. (2020) 16:380–90. doi: 10.1038/s41584-020-0441-1
7. Wu Z, Yang X, He Y, Ni J, Wang J, Yin K, et al. Environmental factors and risk of gout. Environ Res. (2022) 212:113377. doi: 10.1016/j.envres.2022.113377
8. Hainer BL, Matheson E, Wilkes RT. Diagnosis, treatment, and prevention of gout. Am Fam Physician. (2014) 90:831–6.
9. Afinogenova Y, Danve A, Neogi T. Update on gout management: what is old and what is new. Curr Opin Rheumatol. (2022) 34:118–24. doi: 10.1097/BOR.0000000000000861
10. Karalius VP, Shoham DA. Dietary sugar and artificial sweetener intake and chronic kidney disease: a review. Adv Chronic Kidney Dis. (2013) 20:157–64. doi: 10.1053/j.ackd.2012.12.005
11. Malik VS, Hu FB. The role of sugar-sweetened beverages in the global epidemics of obesity and chronic diseases. Nat Rev Endocrinol. (2022) 18:205–18. doi: 10.1038/s41574-021-00627-6
12. Lara-Castor L, Micha R, Cudhea F, Miller V, Shi P, Zhang J, et al. Intake of sugar sweetened beverages among children and adolescents in 185 countries between 1990 and 2018: population based study. BMJ. (2024) 386:e079234. doi: 10.1136/bmj-2024-079234
13. Singh GM, Micha R, Khatibzadeh S, Lim S, Ezzati M, Mozaffarian D. Estimated global, regional, and national disease burdens related to sugar-sweetened beverage consumption in 2010. Circulation. (2015) 132:639–66. doi: 10.1161/CIRCULATIONAHA.114.010636
14. Huang Y, Chen Z, Chen B, Li J, Yuan X, Li J, et al. Dietary sugar consumption and health: umbrella review. BMJ. (2023) 381:e071609. doi: 10.1136/bmj-2022-071609
15. Lane MM, Travica N, Gamage E, Marshall S, Trakman GL, Young C, et al. Sugar-sweetened beverages and adverse human health outcomes: an umbrella review of meta-analyses of observational studies. Annu Rev Nutr. (2024) 44:383–404. doi: 10.1146/annurev-nutr-062322-020650
16. Ayoub-Charette S, Liu Q, Khan TA, Au-Yeung F, Blanco Mejia S, de Souza RJ, et al. Important food sources of fructose-containing sugars and incident gout: a systematic review and meta-analysis of prospective cohort studies. BMJ Open. (2019) 9:e024171. doi: 10.1136/bmjopen-2018-024171
17. Ebrahimpour-Koujan S, Saneei P, Larijani B, Esmaillzadeh A. Consumption of sugar sweetened beverages and dietary fructose in relation to risk of gout and hyperuricemia: a systematic review and meta-analysis. Crit Rev Food Sci Nutr. (2020) 60:1–10. doi: 10.1080/10408398.2018.1503155
18. Page MJ, McKenzie JE, Bossuyt PM, Boutron I, Hoffmann TC, Mulrow CD, et al. The PRISMA 2020 statement: an updated guideline for reporting systematic reviews. Bmj. (2021) 372:n71. doi: 10.1136/bmj.n71
19. Taylor KS, Mahtani KR, Aronson JK. Summarising good practice guidelines for data extraction for systematic reviews and meta-analysis. Bmj Evid-Based Med. (2021) 26:88–90. doi: 10.1136/bmjebm-2020-111651
20. Xie W, Wang Y, Xiao S, Qiu L, Yu Y, Zhang Z. Association of gestational diabetes mellitus with overall and type specific cardiovascular and cerebrovascular diseases: systematic review and meta-analysis. BMJ. (2022) 378:e070244. doi: 10.1136/bmj-2022-070244
21. Wang M, Gu H, Zhai Y, Li X, Huang L, Li H, et al. Vaccination and the risk of systemic lupus erythematosus: a meta-analysis of observational studies. Arthritis Res Ther. (2024) 26:60. doi: 10.1186/s13075-024-03296-8
22. Zhang W, Peng Q, Cai X, Jiang G, Huang J, Lu L, et al. A study on the correlation between hyperuricemia and lifestyle and dietary habits. Medicine. (2025) 104:e41399. doi: 10.1097/MD.0000000000041399
23. Rai SK, Wang S, Hu Y, Hu FB, Wang M, Choi HK, et al. Adherence to healthy and unhealthy plant-based diets and the risk of gout. Jama Netw Open. (2024) 7:e2411707. doi: 10.1001/jamanetworkopen.2024.11707
24. Lee SM, Lee SY, Park EJ, Lee YI, Choi JI, Lee SR, et al. Association between uric acid levels and the consumption of sugar-sweetened carbonated beverages in the Korean population: the 2016 Korea National Health and Nutrition Examination Survey. Nutrients. (2024) 16:2167. doi: 10.3390/nu16132167
25. Li Q, Zou Y, Lian S, Liang J, Bi Y, Deng C, et al. Sugar-sweeten beverage consumption is associated with more obesity and higher serum uric acid in Chinese male gout patients with early onset. Front Nutr. (2022) 9:916811. doi: 10.3389/fnut.2022.916811
26. Lin W, Kao Y, Lin H, Li MS, Luo T, Fritz JM, et al. Age difference in the combined effect of soda drinks consumption and body adiposity on hyperuricaemia in US adults. Public Health Nutr. (2021) 24:5756–68. doi: 10.1017/S1368980021000513
27. Siqueira JH, Pereira TSS, Velasquez-Melendez G, Barreto SM, Benseñor IM, Mill JG, et al. Sugar-sweetened soft drinks consumption and risk of hyperuricemia: results of the ELSA-Brasil study. Nutr Metab Carbiovasc Dis. (2021) 31:2004–13. doi: 10.1016/j.numecd.2021.04.008
28. Lee JS, Kim TJ, Hong SK, Min C, Yoo D.M, Wee JH, et al. Impact of coffee/green tea/soft drink consumption on the risk of hyperuricemia: a cross-sectional study. Int J Environ Res Public Health. (2021) 18:7299. doi: 10.3390/ijerph18147299
29. Meneses-León J, León-Maldonado L, Macías N, Torres-Ibarra L, Hernández-López R, Rivera-Paredez B, et al. Sugar-sweetened beverage consumption and risk of hyperuricemia: a longitudinal analysis of the Health Workers Cohort Study participants in Mexico. Am J Clin Nutr. (2020) 112:652–60. doi: 10.1093/ajcn/nqaa160
30. Zhang T, Bian S, Gu Y, Meng G, Zhang Q, Liu L, et al. Sugar-containing carbonated beverages consumption is associated with hyperuricemia in general adults: a cross-sectional study. Nutr Metab Carbiovasc Dis. (2020) 30:1645–52. doi: 10.1016/j.numecd.2020.05.022
31. So MW, Lim D, Kim S, Lee S. Dietary and nutritional factors associated with hyperuricemia: the seventh Korean National Health and Nutrition Examination Survey. Asia Pac J Clin Nutr. (2020) 29:609–17. doi: 10.6133/apjcn.202009_29(3).0021
32. Zheng Z, Harman JL, Coresh J, Köttgen A, McAdams-DeMarco MA, Correa A, et al. The dietary fructose: vitamin C intake ratio is associated with hyperuricemia in African-American adults. J Nutr. (2018) 148:419–26. doi: 10.1093/jn/nxx054
33. Siqueira JH, Mill JG, Velasquez-Melendez G, Moreira AD, Barreto SM, Benseñor IM, et al. Sugar-sweetened soft drinks and fructose consumption are associated with hyperuricemia: cross-sectional analysis from the Brazilian Longitudinal Study of Adult Health (ELSA-Brasil). Nutrients. (2018) 10:981. doi: 10.3390/nu10080981
34. Dalbeth N, Phipps-Green A, House ME, Gamble GD, Horne A, Stamp LK, et al. Body mass index modulates the relationship of sugar-sweetened beverage intake with serum urate concentrations and gout. Arthritis Res Ther. (2015) 17:263. doi: 10.1186/s13075-015-0781-4
35. Batt C, Phipps-Green AJ, Black MA, Cadzow M, Merriman ME, Topless R, et al. Sugar-sweetened beverage consumption: a risk factor for prevalent gout with SLC2A9 genotype-specific effects on serum urate and risk of gout. Ann Rheum Dis. (2014) 73:2101–6. doi: 10.1136/annrheumdis-2013-203600
36. Bae J, Chun B, Park PS, Choi BY, Kim MK, Shin M, et al. Higher consumption of sugar-sweetened soft drinks increases the risk of hyperuricemia in Korean population: the Korean Multi-Rural Communities Cohort Study. Semin Arthritis Rheum. (2014) 43:654–61. doi: 10.1016/j.semarthrit.2013.10.008
37. Meneses-Leon J, Denova-Gutiérrez E, Castañón-Robles S, Granados-García V, Talavera JO, Rivera-Paredez B, et al. Sweetened beverage consumption and the risk of hyperuricemia in Mexican adults: a cross-sectional study. BMC Public Health. (2014) 14:445. doi: 10.1186/1471-2458-14-445
38. Lin W, Huang H, Huang M, Chan T, Ciou S, Lee C, et al. Effects on uric acid, body mass index and blood pressure in adolescents of consumin beverages sweetened with high-fructose corn syrup. Int J Obes. (2013) 37:532–9. doi: 10.1038/ijo.2012.121
39. Teng GG, Tan CS, Santosa A, Saag KG, Yuan J, Koh W. Serum urate levels and consumption of common beverages and alcohol among Chinese in Singapore. Arthritis Care Res. (2013) 65:1432–40. doi: 10.1002/acr.21999
40. Bomback AS, Derebail VK, Shoham DA, Anderson CA, Steffen LM, Rosamond WD, et al. Sugar-sweetened soda consumption, hyperuricemia, and kidney disease. Kidney Int. (2010) 77:609–16. doi: 10.1038/ki.2009.500
41. Sun SZ, Flickinger BD, Williamson-Hughes PS, Empie MW. Lack of association between dietary fructose and hyperuricemia risk in adults. Nutr. Metab. (2010) 7:16. doi: 10.1186/1743-7075-7-16
42. Choi HK, Willett W, Curhan G. Fructose-rich beverages and risk of gout in women. Jama. (2010) 304:2270–8. doi: 10.1001/jama.2010.1638
43. Choi HK, Curhan G. Soft drinks, fructose consumption, and the risk of gout in men: prospective cohort study. BMJ. (2008) 336:309–12. doi: 10.1136/bmj.39449.819271.BE
44. Seegmiller JE, Laster L, Howell RR. Biochemistry of uric acid and its relation to gout. N Engl J Med. (1963) 268:712–6. doi: 10.1056/NEJM196303282681306
45. Packer M. Hyperuricemia and gout reduction by SGLT2 inhibitors in diabetes and heart failure: JACC review topic of the week. J Am Coll Cardiol. (2024) 83:371–81. doi: 10.1016/j.jacc.2023.10.030
46. Facchini F, Chen YD, Hollenbeck CB, Reaven GM. Relationship between resistance to insulin-mediated glucose uptake, urinary uric acid clearance, and plasma uric acid concentration. JAMA. (1991) 266:3008–11. doi: 10.1001/jama.1991.03470210076036
47. Yanai H, Adachi H, Hakoshima M, Katsuyama H. Molecular biological and clinical understanding of the pathophysiology and treatments of hyperuricemia and its association with metabolic syndrome, cardiovascular diseases and chronic kidney disease. Int J Mol Sci. (2021) 22:9221. doi: 10.3390/ijms22179221
48. Zhang P, Sun H, Cheng X, Li Y, Zhao Y, Mei W, et al. Dietary intake of fructose increases purine de novo synthesis: a crucial mechanism for hyperuricemia. Front Nutr. (2022) 9:1045805. doi: 10.3389/fnut.2022.1045805
49. Merriman TR, Dalbeth N, Johnson RJ. Sugar-sweetened beverages, urate, gout and genetic interaction. Pac Health Dialog. (2014) 20:31–8.
50. Fang X, Qi L, Chen H, Gao P, Zhang Q, Leng R, et al. The interaction between dietary fructose and gut microbiota in hyperuricemia and gout. Front Nutr. (2022) 9:890730. doi: 10.3389/fnut.2022.890730
51. Antón FM, García Puig J, Ramos T, González P, Ordás J. Sex differences in uric acid metabolism in adults: evidence for a lack of influence of estradiol-17 beta (E2) on the renal handling of urate. Metabolism. (1986) 35:343–8. doi: 10.1016/0026-0495(86)90152-6
Keywords: sugar-sweetened beverages, hyperuricemia, gout, fructose, meta-analysis, observational studies
Citation: Lu Y, Wang Y, Huang R, Pan H, Xie Z, Wen C, Huang L and Li X (2025) Sugar-sweetened beverages and the risk of hyperuricemia and gout: a meta-analysis. Front. Nutr. 12:1669129. doi: 10.3389/fnut.2025.1669129
Received: 19 July 2025; Accepted: 29 September 2025;
Published: 20 October 2025.
Edited by:
Federica Fogacci, University of Bologna, ItalyCopyright © 2025 Lu, Wang, Huang, Pan, Xie, Wen, Huang and Li. This is an open-access article distributed under the terms of the Creative Commons Attribution License (CC BY). The use, distribution or reproduction in other forums is permitted, provided the original author(s) and the copyright owner(s) are credited and that the original publication in this journal is cited, in accordance with accepted academic practice. No use, distribution or reproduction is permitted which does not comply with these terms.
*Correspondence: Xuanlin Li, bGl4dWFubGluaG56eUAxNjMuY29t; Lin Huang, aHVhbmdsaW5AemNtdS5lZHUuY24=
†These authors have contributed equally to this work and share first authorship