 Antonella Cano1,2Lucia Ventura1,2
 Maria Grazia Catte2Elena Castiglia2Josetta Sanna2Gianluca Martinez2Carmen Oneto2Nicola Loi1,2
 Francesca Ginatempo2
 Andrea Manca2
 Franca Deriu2,3*
- 1Azienda Ospedaliero Universitaria di Sassari, AOUSS, Sassari, Italy
- 2Department of Biomedical Sciences, University of Sassari, Sassari, Italy
- 3Unit of Endocrinology, Nutritional and Metabolic Disorders, Azienda Ospedaliero Universitaria di Sassari, AOUSS, Sassari, Italy
Introduction: Poor nutrition and progressive loss of muscle mass is frequent in older individuals. Extracellular mass to body cell mass ratio (ECM/BCM), an easy to calculate index obtained by bioelectrical impedance vector analysis (BIVA), is a parameter of catabolism or extracellular mass expansion, mainly studied in pathological conditions. The aim of the study was to characterize ECM/BCM ratio and its association to indexes of nutritional and functional status in middle-aged and community dwelling older individuals.
Methods: Participants aged 51–89 years old (n = 158, 96 women) were included in the study. Comorbidity burden was assessed by Charlson comorbidity index. Nutritional status was evaluated by mini nutritional assessment (MNA) and BIVA. Plasma biochemical parameters were measured, and prognostic nutritional index (PNI) and geriatric nutritional risk index (GNRI) were calculated. Functional performance was assessed by hand dynamometry and evaluated by means of muscle quality index (MQI).
Results: ECM/BCM mean value was 0.91 ± 0.12. Higher values were observed in women and in individuals over 75. Subjects displaying ECM/BCM above median, presented significantly lower MNA score, PNI, GNRI, and MQI (all p ≤ 0.05), compared to individuals with ECM/BCM values below median. Linear regression model using ECM/BCM, age, and sex as independent factors, showed ECM/BCM as significantly associated to comorbidity burden (β = 0.175, p = 0.019); MNA (β = −0.285; p = 0.004), PNI (β = −0.253; p = 0.009), GNRI (β = −0.363; p < 0.0001) and MQI (β = −0.311, p = 0.0001).
Discussion: Herein, ECM/BCM has been associated, after adjusting for cofounding factors as age and sex, to subjective and objective indexes of health, nutritional and functional status in middle-aged and community dwelling older adults. With an integrated perspective, it could represent an easy to calculate, objective index to assess and monitor health, nutritional and functional status in this population.
1 Introduction
Aging is a natural physiological process characterized by a gradual decline in cognitive and physical functions, whose trajectory can be modulated by modifiable factors such as nutrition and dietary habits (1). In older adults, malnutrition is commonly observed and may be a consequence of physiological, psychosocial, socioeconomic factors, existing pathological conditions and polypharmacy (2).
A well-established bidirectional relationship exists between nutritional and health status: poor nutrition can contribute to the onset/worsening of chronic diseases, while a pre-existing clinical condition can affect food intake and energy requirements, further deteriorating nutritional status. This creates a vicious cycle, where malnutrition itself may contribute to disease worsening (3).
Considering all this, assessing the nutritional status in older population is pivotal to prevent disease onset, slow clinical progression, and promote healthy aging (3).
The nutritional status is the result of nutrients intake, absorption, and utilization, and depends on energy homeostasis and organ function. It can be assessed using both subjective and objective measurements (4). The mini nutritional assessment (MNA) questionnaire, validated for older adults, is a widely used and effective tool to screen for malnutrition. It includes not only anthropometric measurements (such as body mass index, calf, and arm circumferences) but also information on involuntary weight loss, appetite and reduced food intake, mobility, neuropsychological disease, polypharmacy, quality of dietary habits, fluids intake and self-perception of nutrition and health status (5). Although it is a valuable tool, its application could be limited in populations with cognitive impairment (6).
Several biochemical markers—including albumin, prealbumin, transferrin and retinol-binding protein—are commonly used to assess protein levels and nutritional status in older adults (7). In this context, the prognostic nutritional index (PNI) and the geriatric nutritional risk index (GNRI) serve as objective and practical tools for assessing nutritional status of patients. Both indices can be calculated using standard laboratory parameters and anthropometric measurements (8, 9). The PNI combines serum albumin concentration and lymphocytes counts, serving as an indicator of both inflammatory and nutritional status (10). Conversely, the GNRI is calculated from serum albumin and body weight, providing a measure of nutritional risk in geriatric population and offering insight into their nutritional status (11).
Overall, clinical tools commonly used to assess nutritional status in older adults are simple and ease to apply but often lack sensitivity in detecting the early-stage malnutrition. For instance, parameters such as body mass index (BMI), serum albumin, and unintentional weight loss can be significantly affected by factors like inflammation, hydration, comorbidity and polypharmacy. As a result, changes such as muscle loss, fat redistribution, or fluid imbalance may go unnoticed (2). These limitations highlight the urgent need for more objective, comprehensive, and integrated approaches to accurately assess malnutrition in the aging population.
Bioimpedance analysis (BIA) is a simple, non-invasive, and accessible method for evaluating changes in body composition commonly associated with aging. A variant of the conventional BIA, the bioelectrical vector impedance analysis (BIVA), enhances the precision of body composition assessment by directly analyzing the two components of the impedance vector (Z): resistance (R) and reactance (Xc). In BIVA, the position and length of the impedance vector, plotted on the R-Xc graph and normalized for height, enable a more accurate evaluation of body cell mass, cellular integrity, and hydration status. This approach offers valuable prognostic information and extends its clinical applicability to populations with altered fluid distribution or hydration status (12).
Among the parameters derived from BIA, phase angle (PhA) has emerged as a clinically relevant marker, reflecting cell mass and membrane integrity. Its validity has been demonstrated across various physiological and pathological conditions (12–14). However, PhA is influenced by factors such as age, sex, and BMI, and may not fully capture the differences in body composition, as distinct impedance vectors can result in similar PhA values. Therefore, while PhA is useful, it may have limitations in detecting subtle changes in hydration when used alone (12, 14, 15).
Under normal physiological condition, approximately 73% of body fluids are distributed within the fat free mass (FFM), which comprises two compartments: body cell mass (BCM) and extracellular mass (ECM). In 1963, Moore and Boyden defined BCM as the cellular components responsible for metabolic “oxygen-requiring, carbon-dioxide-producing” processes (16). BCM represents the total metabolically active, living, functional cellular mass and is a key determinant of basal metabolic rate. It is widely regarded as a crucial indicator of nutritional status (17).
In physiological conditions, ECM and BCM are balanced and expressed as ECM-to-BCM ratio (ECM/BCM) (18). In healthy individuals, ECM/BCM values typically range between 0.85 and 1.00, and deviations from this range may indicate fluid imbalance and/or catabolism (18).
As extensively demonstrated, BCM loss can result from various pathological and/or adaptative mechanisms (14). Quantitative reductions in BCM and cell membrane surface area are observed in conditions such as malnutrition, sarcopenia, and cachexia. Inflammation and oxidative stress-related processes can compromise and damage cell membrane, leading to a functional loss in the number of viable cells (14). An increase in FFM hydration, without change in cell mass, may occur in hemodynamic failure (e.g., heart failure, chronic kidney disease) or in inflammatory states characterized by expansion of extracellular water, the main constituent of ECM (14). In pathological conditions, mechanisms causing both quantitative and qualitative depletion of BCM may coexist with processes that simultaneously promote extracellular fluid accumulation (14).
The ECM/BCM has been primarily studied in pathological conditions (19–22). For instance, in hemodialysis patients, it has been validated as prognostic indicator of mortality risk (22), while in patients with head and neck cancer, it has been proposed as a marker of malnutrition (20).
Despite increasing interest in body fluid distribution parameters such as ECW/ICW, ECW/TBW, and ICW/FFM (23–27), the ECM/BCM remains relatively underexplored in older populations. Derived from estimates of FFM and BCM, it reflects the quality of fat-free mass by quantifying the balance between its functional (BCM) and non-functional (ECM) components, independently of fat mass.
Age-related factors such as oxidative stress, low-grade inflammation, anabolic resistance, which subtend the physiological aging process, may contribute to cellular membrane damage, increased catabolism, and disruption of energy homeostasis. These changes may consequently impair both the quantity and functionality of cells, leading to alterations in body composition and compartment integrity (28).
Therefore, the assessment of ECM/BCM by BIVA may provide valuable insights into age-related conditions such as malnutrition, sarcopenia, systemic inflammation, and fluid overload. Although it relies on sex- and population-specific equations derived from bioimpedance and anthropometric data, ECM/BCM can identify catabolic states and fluid imbalance that may go undetected by other clinical tools, offering a practical and accessible parameter for assessing nutritional and hydration status, especially when interpreted alongside raw bioelectrical data.
In this context, the comprehensive assessment of nutritional status in older adults may benefit from the integration of both traditional and advanced tools, including body composition analysis, biochemical markers, and functional measures to better capture subtle yet clinically relevant changes in physiological reserve and functional decline.
All things considered, the aim of this study was to characterize ECM/BCM in middle-aged adults and community-dwelling older individuals, and to examine its possible associations with indexes of health, nutritional status, and functional performance. To this end, participants underwent standardized clinical, nutritional, and functional assessments using both validated questionnaires and objective measurements.
2 Materials and methods
2.1 Participants and clinical assessment
A total of 158 adult and older adults (96 women) aged 51–89 years with no medical, physical, or cognitive conditions that could interfere with signing a written consent form or complying with the study protocol, were enrolled in the study. This observational study was approved by the Territorial Ethics Committee (Sardinia Ethics Committee, Prot. PG/2023/5172, 06/04/2023) and conducted in accordance with the Declaration of Helsinki at the Department of Biomedical Sciences, University of Sassari, Italy, from May 2023 to September 2024. Former participants of several studies from the Department of Biomedical Sciences, University of Sassari, were recruited. Public engagement initiatives were also organized to implement recruitment. Written informed consent was obtained from all participants before inclusion and participation to the study. Socio-demographic data were collected through structured interview.
Following enrollment, participants underwent medical history assessment and clinical examination. Participants were excluded if they met any of the following criteria: age < 50 years; diagnosis of malignancy; severe obesity (BMI > 35 kg/m2); secondary hypertension; acute cardiovascular or cerebrovascular events within the past 6 months; chronic heart failure or unstable angina; atrial fibrillation; presence of an aortic stent or known abdominal aortic aneurysm; history of organ transplantation; chronic kidney disease, respiratory failure, or liver cirrhosis; moderate-to-severe chronic inflammatory or autoimmune diseases; severe non-compensated metabolic conditions, alcohol or substance dependence; known HIV positivity; or inability to provide informed consent.
Charlson comorbidity index (CCI) was calculated for each participant. The index encompasses 17 comorbid conditions, with diabetes, liver disease, and solid tumors classified into subcategories. Each comorbidity and subcategory is assigned a weight from 1 to 6 accordingly to mortality risk and disease severity. One point is added to the score for each decade of age over 40 years. The total CCI score is obtained by summing of points. A CCI score of 5 is associated with an estimated 10-year survival of 34% (29, 30).
Global cognitive status was assessed using Montreal Cognitive Assessment (MoCA), a widely validated tool used in both clinical practice and research, which comprises 12 subtasks to assess global cognitive function, short-term memory, visuospatial and executive function, attention, language and orientation, concentration and working memory (31). Raw scores were adjusted by adding or subtracting the contribution given by age and education in years. The total MoCA score ranges from 0 to 30, indicating worst or best performance, respectively. Adjusted MoCA scores were considered according to normative values reported by Santangelo and colleagues (32, 33).
2.2 Nutritional status assessment
Nutritional status was assessed by trained nutritionists. Anthropometric measurements (such as weight, height, arm and calf circumferences) were collected, and body mass index (BMI, kg/m2) was calculated.
The mini nutritional assessment (MNA) questionnaire was administered, and the total score was calculated according to the guidelines (5). The MNA consists of 18 items regarding anthropometry, cognitive and physical disabilities, pharmacotherapy, food and liquids intake, self-perception of nutritional and health status. A total score of 24 or above (up to 30), indicates normal nutrition; a score between 17.0 and 23.5 indicates risk of malnutrition, and a score lower than 17.0 indicates malnutrition (5).
Body composition was assessed using bioelectrical impedance vector analysis (BIVA) with a single-frequency impedance analyzer operating at a frequency of 50 kHz and 250 μA, in accordance with the manufacturer’s instructions (BIA 101 BIVA, Akern, Florence, Italy). Raw bioelectrical parameters were analyzed, and R/H and Xc/H normalized values were compared with the reference standards for the adult and elderly Italian population (34). Estimated values of FFM, FM, BCM, TBW (as absolute and percentage values) and TBW/FFM were obtained with the data analysis software (BodygramPlus, Akern, Florence, Italy).
ECM/BCM was obtained by subtracting BCM to FFM, both expressed in kg, to obtain ECM in kg. The ratio was calculated by dividing ECM by BCM, both expressed in kg.
2.3 Blood parameters
Blood samples were collected at the laboratory of the University Hospital of Sassari for subsequent hematochemical analyses, including, but not limited to, complete blood count, white blood cells (WBC), hematocrit (HTC), hemoglobin (Hgb), total protein, albumin, creatinine and serum iron. PNI and GNRI were calculated as indexes of nutritional and inflammatory (9, 35) and nutritional status (11), respectively.
PNI was obtained using the following formula:
PNI scores greater than 38 indicate no risk of malnutrition, scores between 35 and 38 indicate moderate risk, and scores below 35 indicate severe risk (35).
GNRI was calculated as follows:
Ideal weight was calculated from Lorentz formula (36):
For men: height (H)-100-[(H-150)/4].
For women: H-100-[(H-150)/2].
For current body weight/ideal body weight >1, the value of 1 was included in the formula (11, 37).
Four grades of nutrition-related risk have been defined. GNRI scores >98 indicate no risk of malnutrition, scores between 92 and 98 indicate low risk, scores between 82 and 92 indicate moderate risk, and scores below 82 indicate severe risk of malnutrition (11).
2.4 Muscle strength assessment
Muscle quality index (MQI) is defined as the ratio between muscle strength and muscle mass. Specifically, it has been calculated as best hand grip strength divided by the appendicular skeletal muscle mass (ASMM), both in kg, and used as a variable for the statistical analysis (38, 39).
Hand grip strength was measured using a handgrip dynamometer (G200, Biometrics LTD, Newport, United Kingdom) over three trials, with one-minute rest between trials. The best and average results were recorded. ASMM, the appendicular portion of the skeletal muscle mass, was obtained by BIVA accordingly to Sergi’s et al. (40).
2.5 Statistical analysis
The sample size was calculated a priori using G*Power software. For an F test employing analysis of covariance (ANCOVA) with fixed effects, main effects, and interactions, a minimum of 128 participants was required to achieve a statistical power (1 − β error probability of 0.8), assuming a medium effect size (f = 0.25) and a significance level of α = 0.05. The corresponding critical F value was calculated as 3.9169.
Statistical analyses were performed using SPSS version 20 (SPSS Inc., Chicago, IL, USA). Data are presented as mean ± standard deviation (SD). Data distributions were evaluated graphically using histograms and boxplots for outlier check, by means of descriptive (asymmetry and kurtosis) and statistical methods (Kolmogorov–Smirnov test).
Given the low proportion and random nature of missing data, pairwise deletion was applied for descriptive analyses and one-way analysis of variance (ANOVA), whereas listwise deletion was used for regression and general linear model analyses. Exploratory analyses were conducted to assess the potential confounding role of age, sex, smoking status, and medication use. Variables found to significantly influence ECM/BCM were subsequently included as covariates in the multivariable models to control for their potential confounding effects.
Statistical difference was evaluated by one-way ANOVA with GROUP (sex or age group) as between subject factors. Bonferroni-corrected post hoc tests were conducted to test for differences among more than two groups in sociodemographic, nutritional, and biochemical parameters. Participants were classified according to ECM/BCM median of 0.8984 into “low ECM/BCM” group for individuals below the median level and “high ECM/BCM” group for individuals above the median level. General linear model univariate ANOVA was used to evaluate the differences between ECM/BCM groups for the outcomes of interest, including the continuous variable “age” as covariate (ANCOVA). Interaction between ECM/BCM groups*sex was also analyzed.
ECM/BCM was used as continuous variable for the regression analysis. After verifying the absence of multicollinearity (variance inflation factor, VIF < 5, tolerance, and condition index) and influential outliers (studentized residuals, leverage, and Cook’s distance), a linear regression model including sex and age as covariates was conducted to evaluate the association of ECM/BCM with indexes of clinical (CCI), nutritional (MNA, PNI, GNRI), and functional (MQI) status. Differences with a p value < 0.05 were considered significant.
3 Results
3.1 Participants’ sociodemographic, anthropometric and clinical characteristics
A total of 158 subjects (mean age 65.9 ± 7.4 years) were enrolled in the study. The sample included 96 women (60.8%) and 62 men (39.2%). The most represented age decade was “65–75” with 76 subjects (48.1%), followed by “under-65” (≤64 years old) with 64 subjects (40.5%) and “over-75” (≥76 years old) with 18 subjects (11.4%). Sociodemographic, anthropometric, and clinical data are reported in Table 1. Height (F1,157 = 196.276; p < 0.0001) and weight (F1,157 = 75.199; p < 0.0001) were significantly different between women and men. Height (F2,157 = 5.863; p = 0.004) was significantly different among age groups. No significant differences among age groups were observed for weight. Most of the participants (73.1%) had high education level (≥13 years). Twenty-three participants were actual smokers (14.8%).
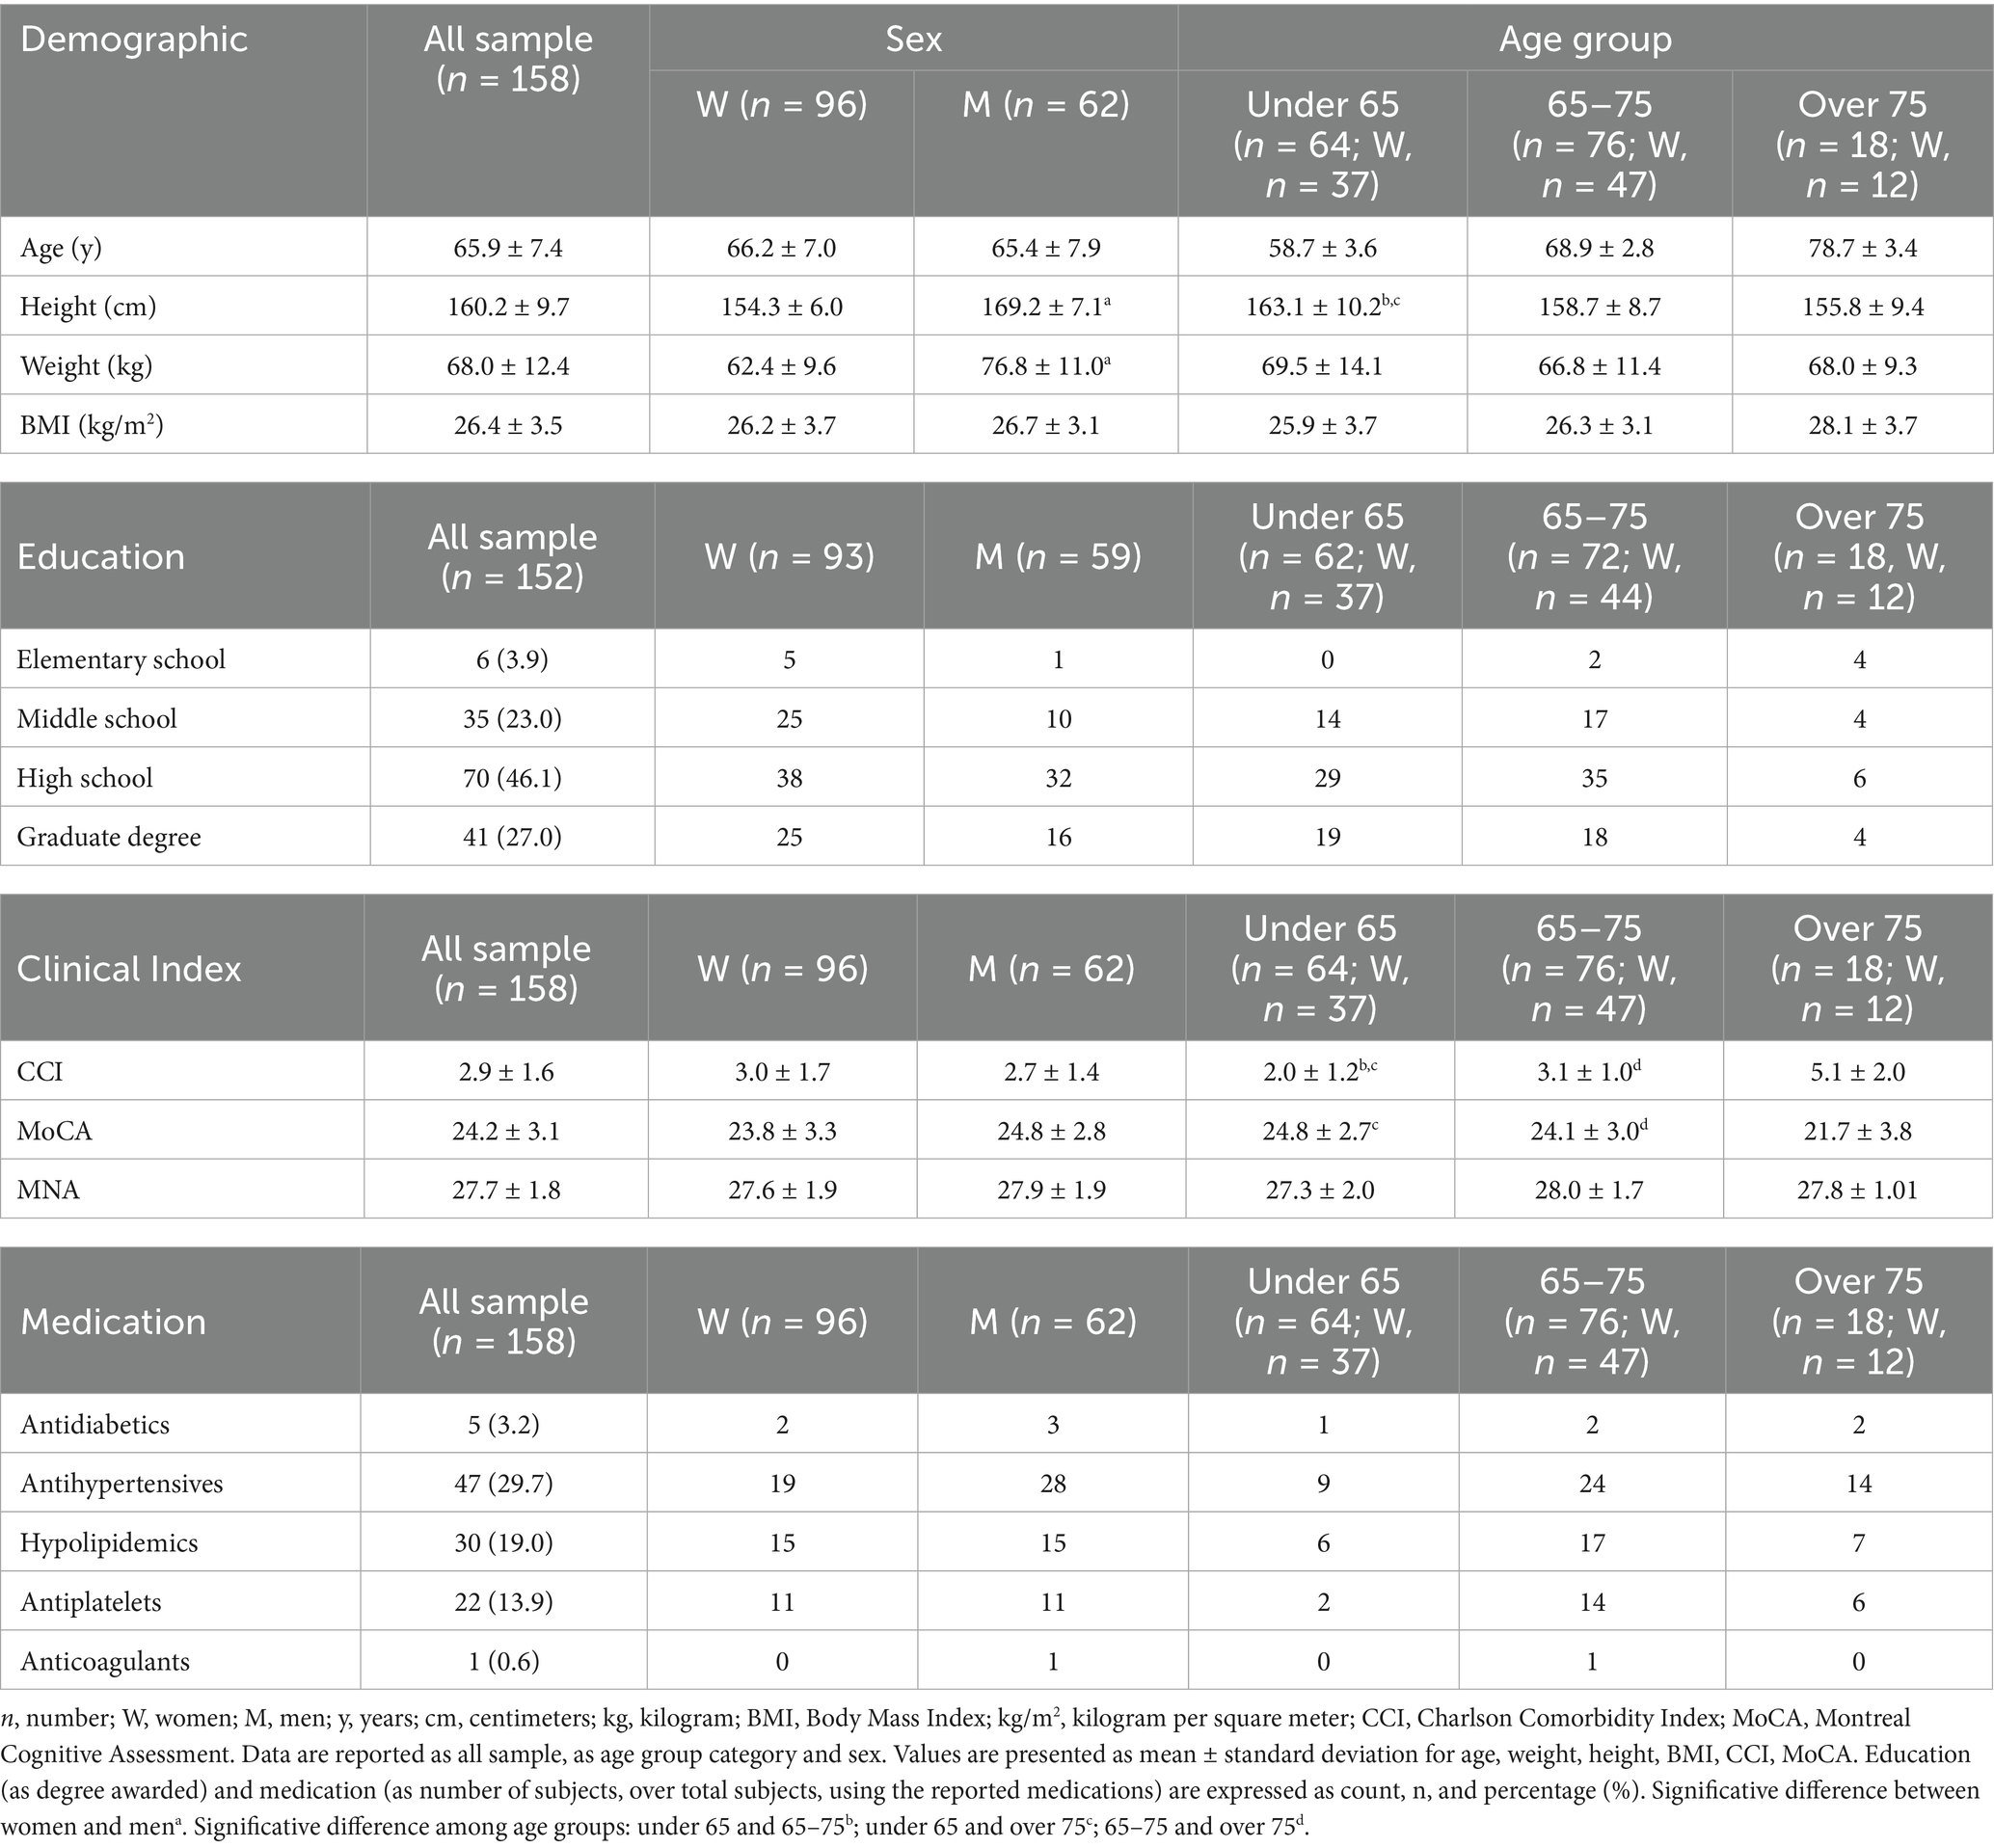
Table 1. Sociodemographic, anthropometric and clinic characteristics of participants.
Mean CCI was 2.9 ± 1.6. CCI was not significantly different between women and men (F1,157 = 1.463; p = 0.228), but a significant difference was observed among age groups (F2,157 = 46.699; p < 0.0001). CCI was significantly higher in over 75 (CI: 4.5–5.6) compared to 65–75 (CI: 2.9–3.4) and under 65 individuals (CI: 1.7–2.3) (p < 0.0001 and p < 0.0001, respectively). Significantly different CCI was observed between 65 and 75 and under 65 individuals (p < 0.0001). Drug-treated hypertension (29.7%) and hypercholesterolemia (19.0%) were the most represented chronic diseases. Antiplatelet drugs were used by 13.9% of the sample.
Mean MoCA score was 24.2 ± 3.1. No significant differences between women (CI: 23.1–24.5) and men (CI: 24.0–25.5) were observed (F1,139 = 3.299; p = 0.072). Significant differences were observed among age groups (F2,139 = 6.408; p = 0.002). MoCA score was significantly lower in over 75 (CI: 20.2–23.3) compared to 65–75 (CI: 23.4–24.8) and under 65 individuals (CI: 24.1–25.6) (p = 0.020 and p = 0.001, respectively). No significant differences were observed between 65 and 75 and under 65 individuals.
3.2 Nutritional status
MNA score mean was 27.7 ± 1.8 (CI: 27.4–28.0). No significant difference was observed between women (CI: 27.2–28.0) and men (CI: 27.5–28.3) (F1,155 = 1.212; p = 0.273) and among age groups (F2,155 = 2.454; p = 0.089).
Hydration mean value, as total body water to fat free mass (TBW/FFM, %), was 73.3 ± 0.3. One-way ANOVA for age group showed significant differences for reactance normalized by height (Xc/H), PhA, BCM, ECM/BCM, TBW/FFM. Post hoc tests for differences among age groups are reported in Table 2.
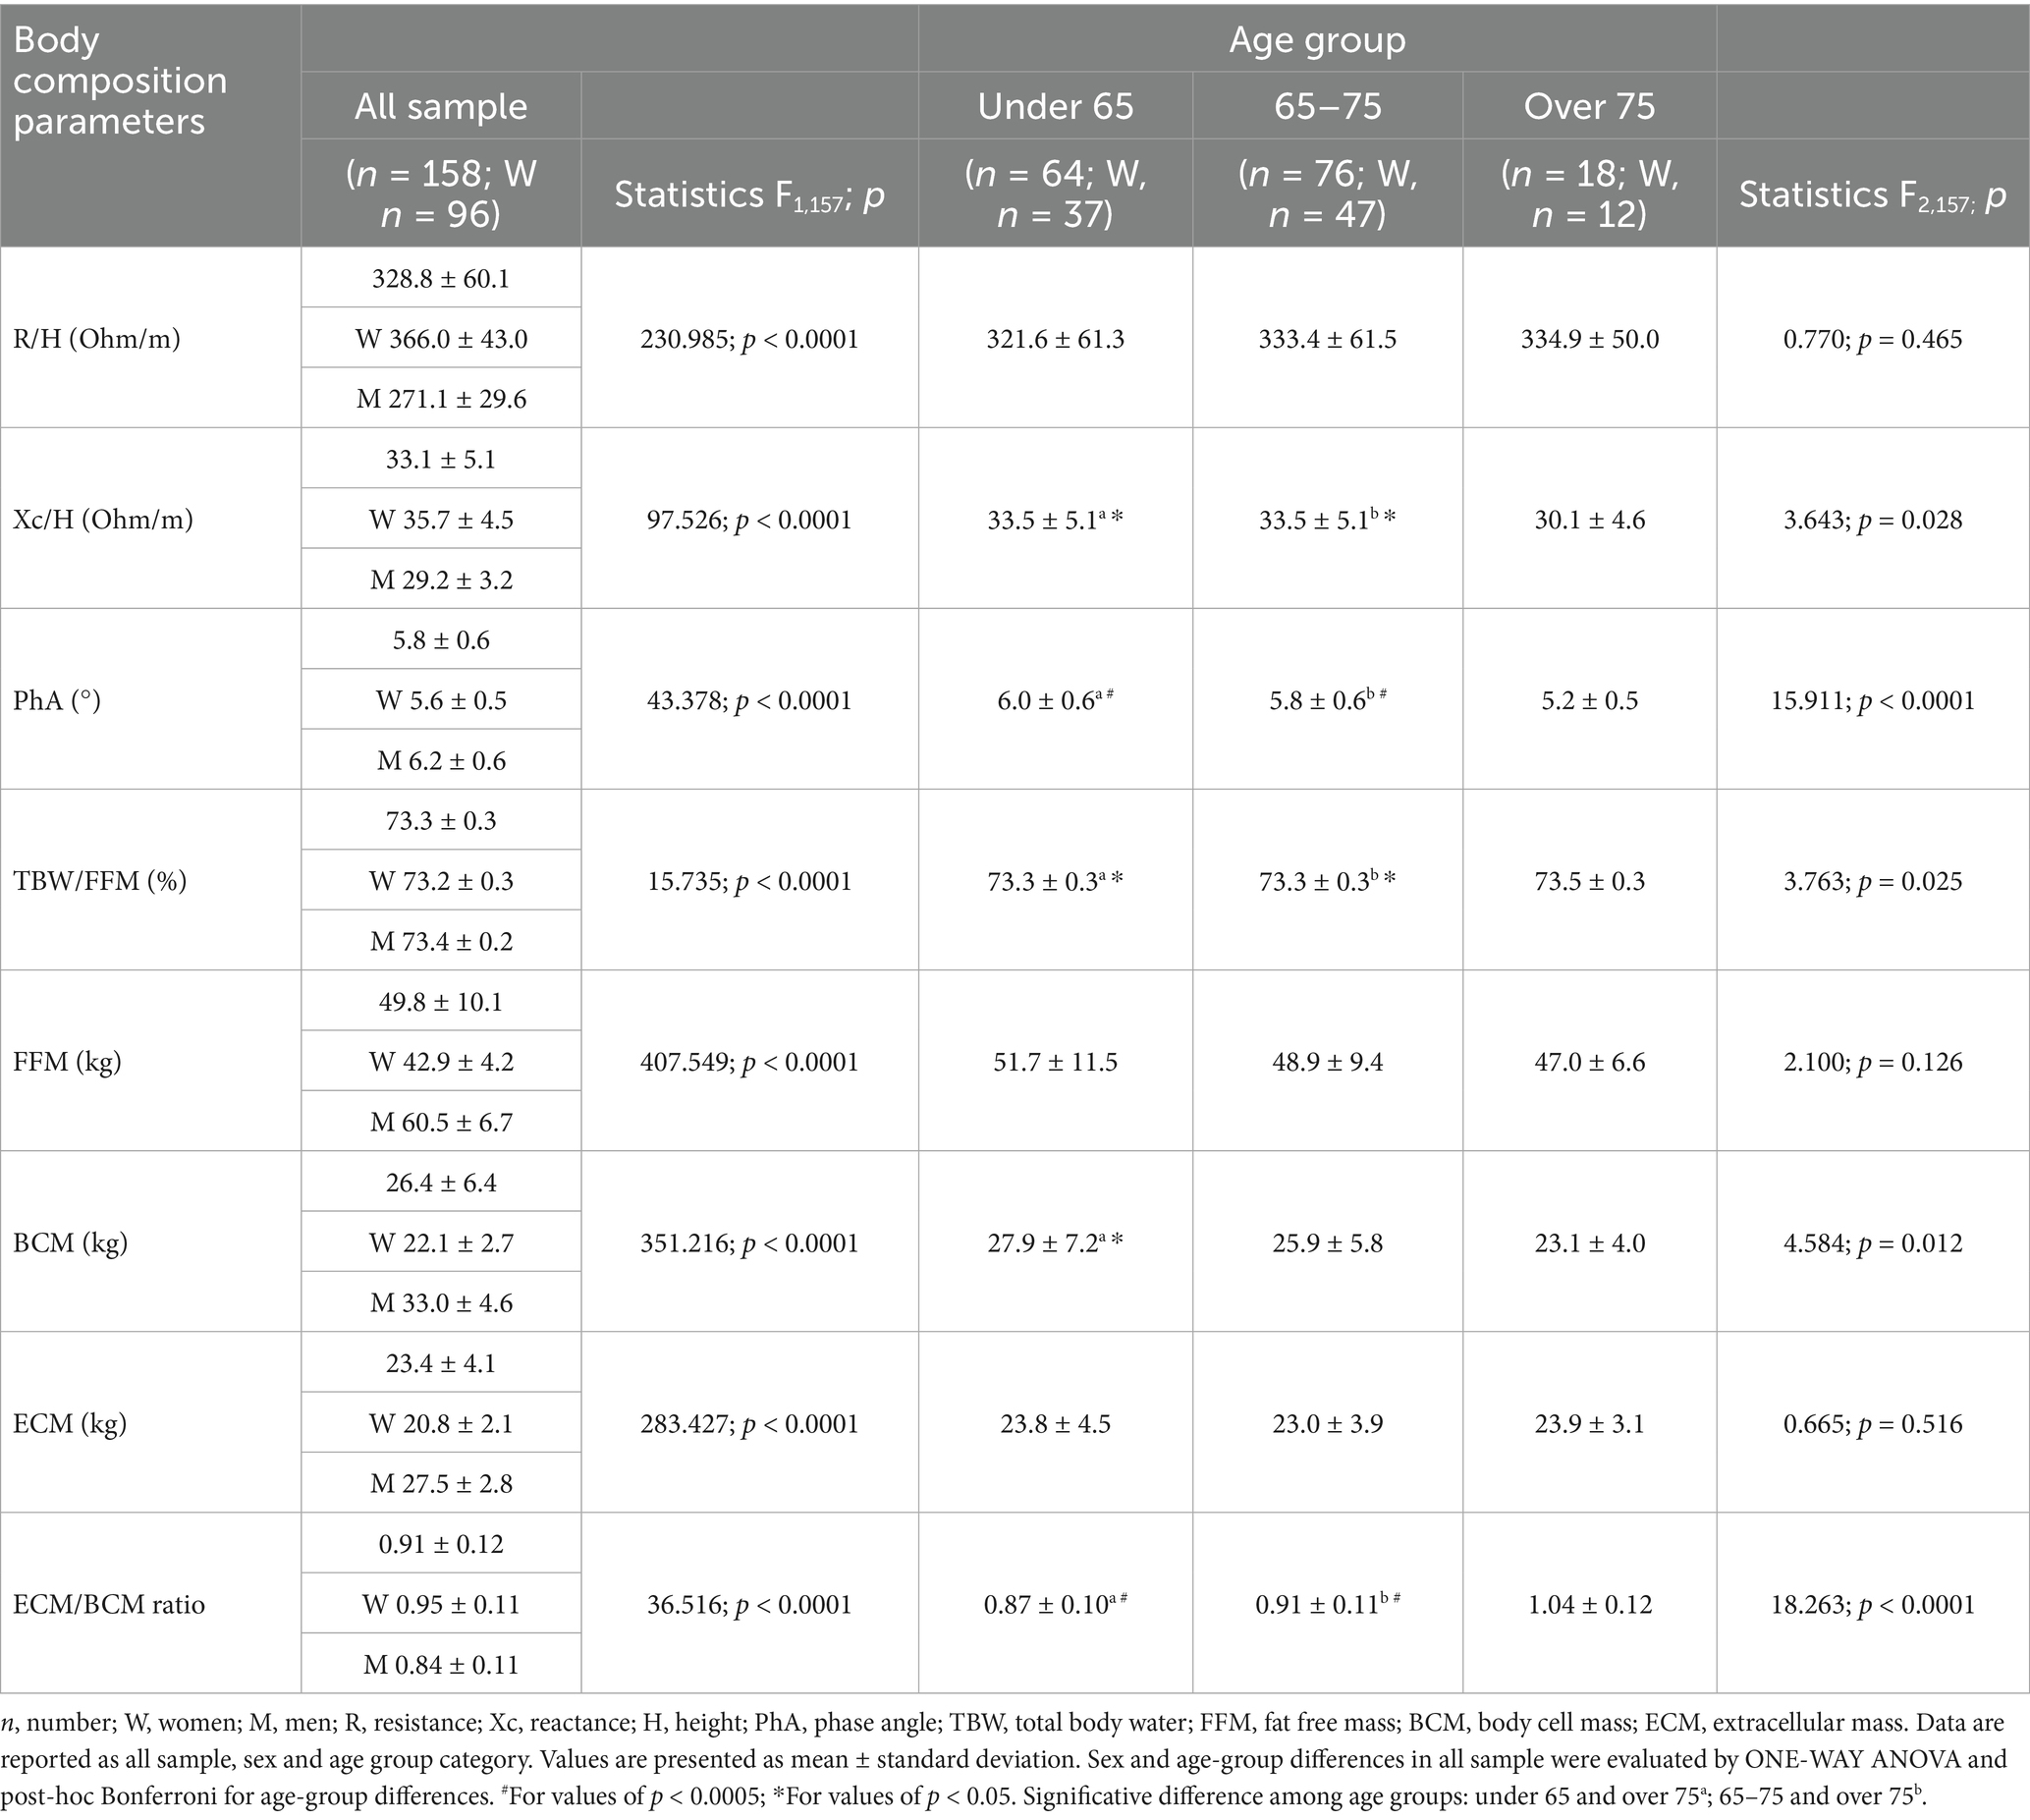
Table 2. Body composition analysis of participants.
Overall, body composition parameters were significantly different between men and women, as reported in Table 2.
3.3 Blood parameters
Sex differences were found for all the parameters except for total protein and albumin, with men presenting significantly higher values than women (Table 3). Significant differences were observed among age groups with WBC higher in over 75 (CI: 5.9–7.5) compared to individuals aged 65–75 (CI: 5.4–5.9) (p = 0.013); hematocrit lower in over 75 (CI: 39.5–43.2) compared to individuals aged 65–75 (CI: 43.1–44.8) (p = 0.023); albumin lower in over 75 (CI: 4.0–4.2) compared to under 65 (CI: 4.2–4.3) (p = 0.009) and individuals aged 65–75 (CI: 4.2–4.3) (p = 0.014); serum iron lower in over 75 (CI: 54.7–87.1) compared to under 65 individuals (CI: 88.3–102.3) (p = 0.006) and individuals aged 65–75 (CI: 85.4–97.4) (p = 0.025). PNI and GNRI were not significantly different between women and men. Only PNI showed significant differences among age groups with lower index in over 75 (CI: 39.7–42.1) compared to individuals aged 65–75 (CI: 42.2–43.2) (p = 0.014) and under 65 individuals (CI: 42.3–43.3) (p = 0.009) (Table 3).
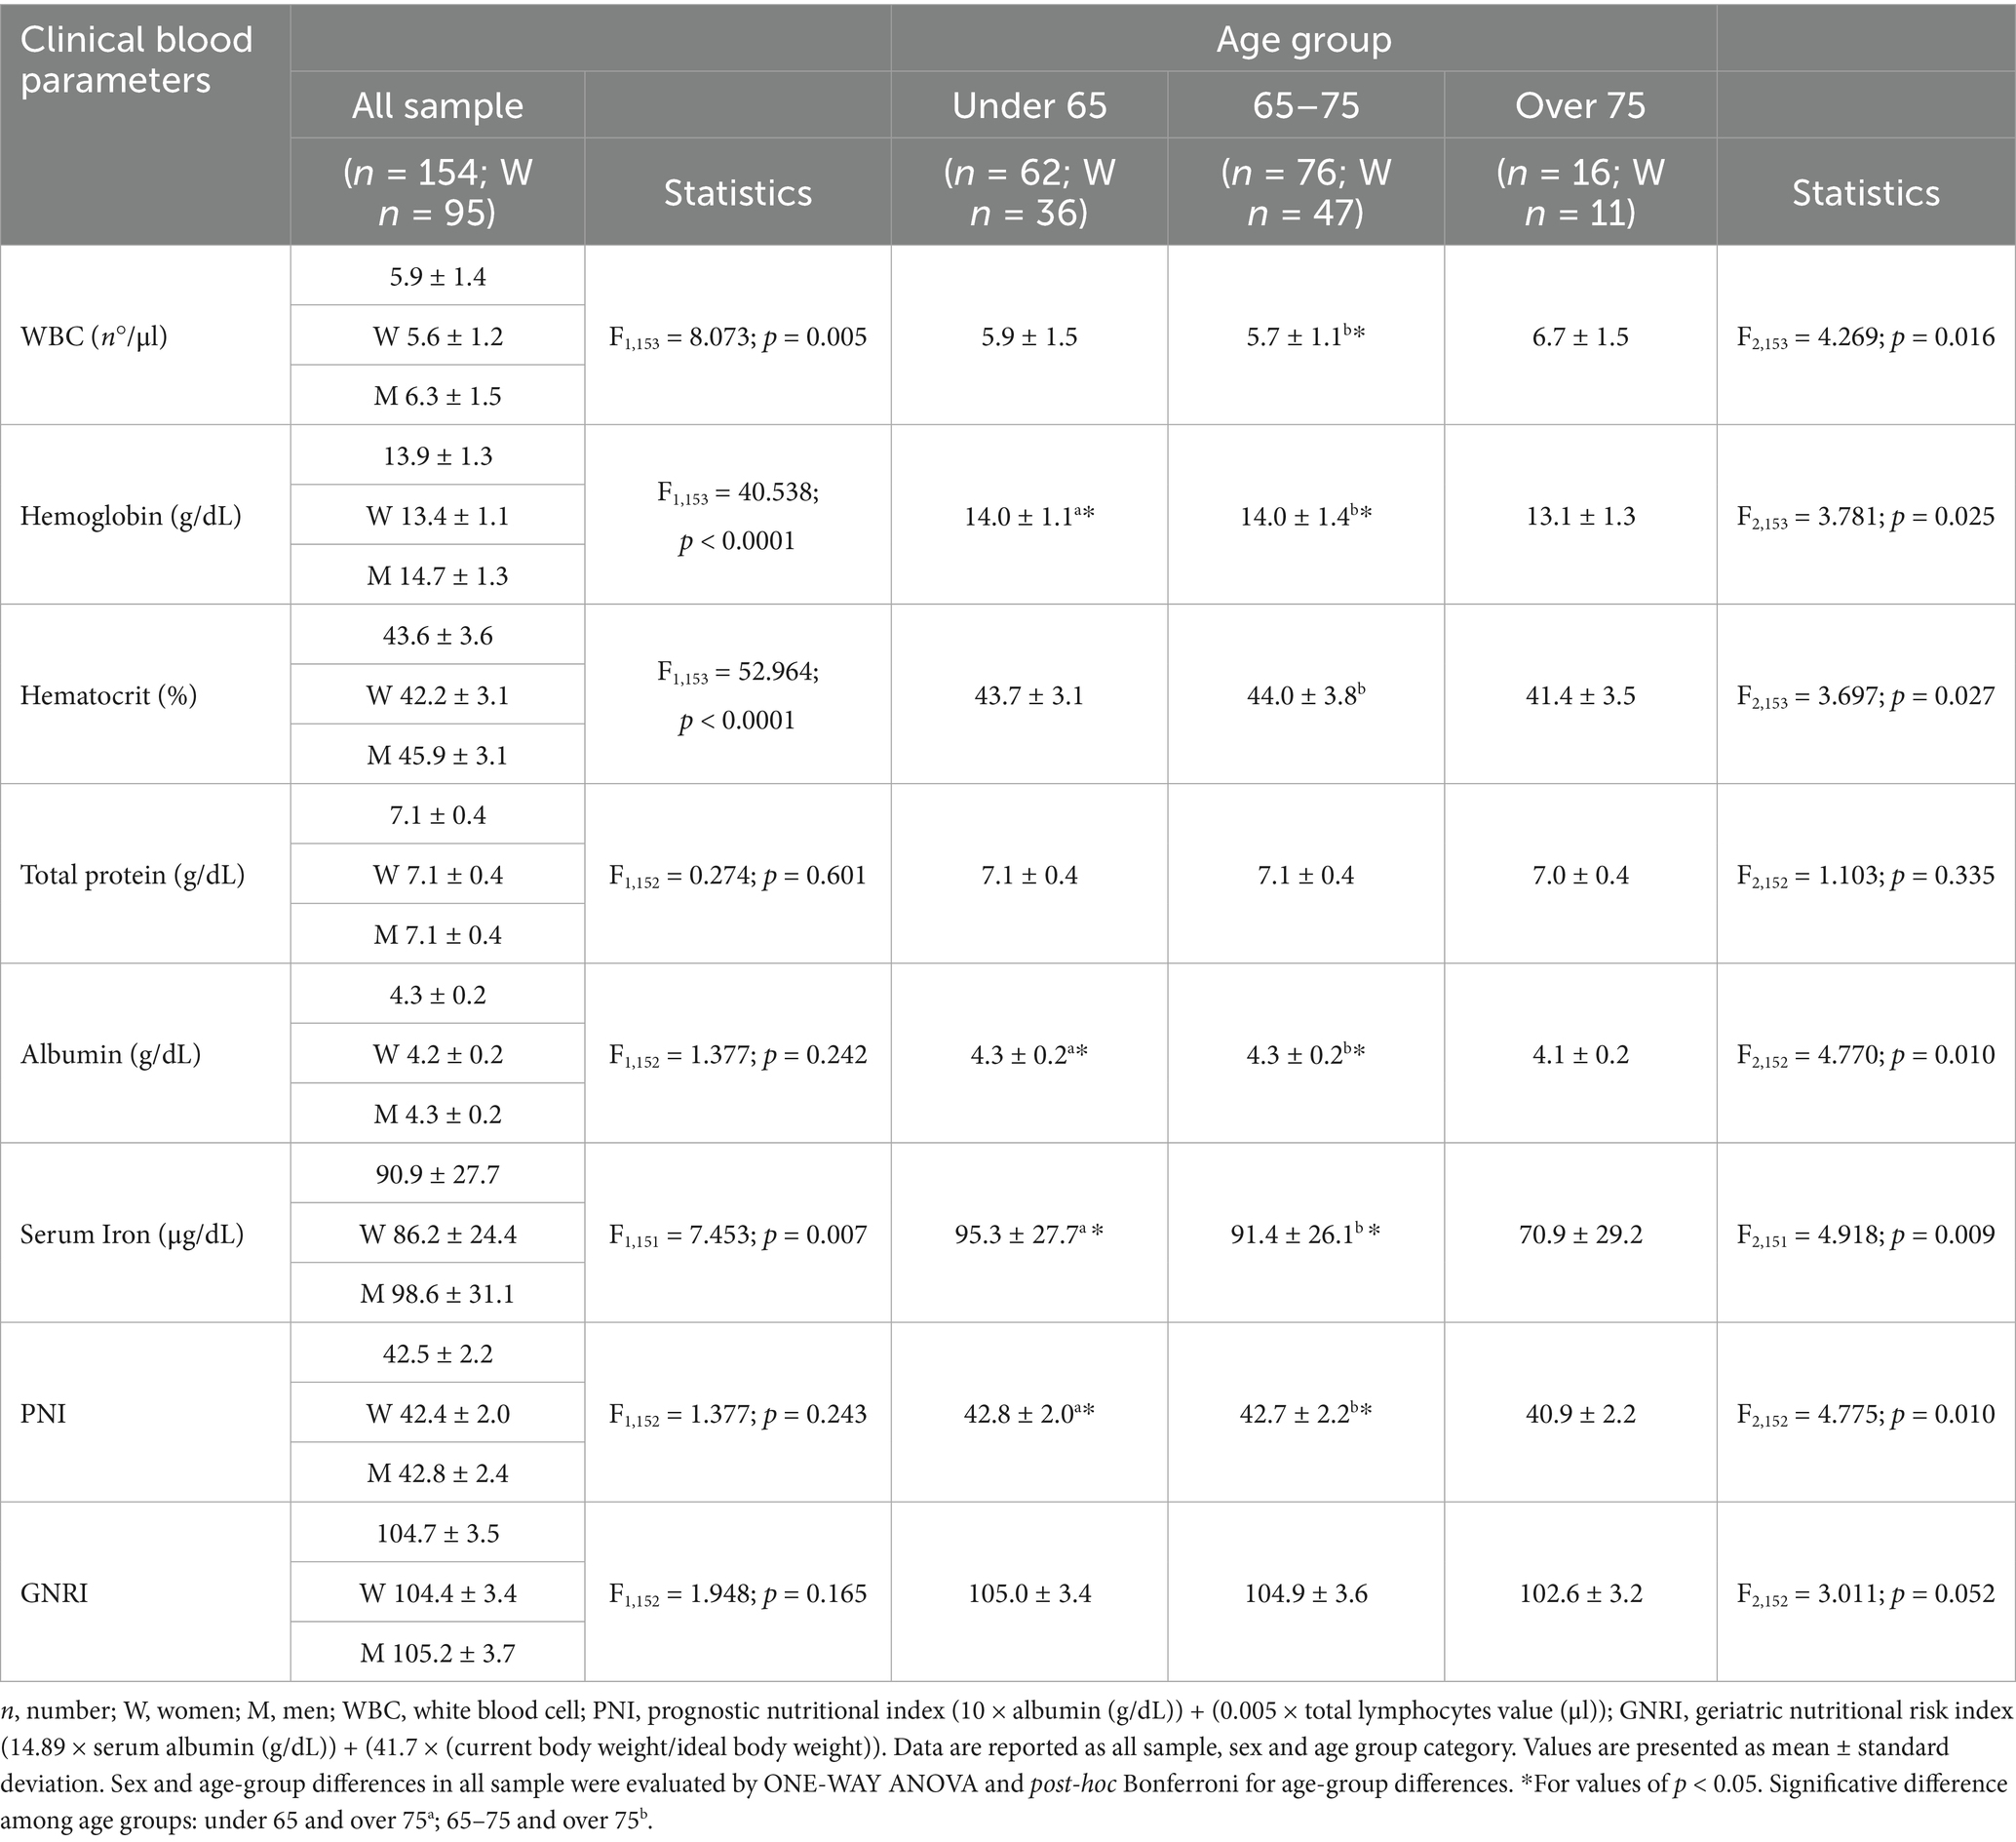
Table 3. Clinical blood parameters of participants.
3.4 Muscle strength assessment
MQI mean value was 1.4 ± 0.3. A significant difference was observed between women (1.3 ± 0.2; CI: 1.3–1.4) and men (1.6 ± 0.3; CI: 1.5–1.7) (F1,157 = 48.653; p < 0.0001). Significant differences were also observed among age groups (F2,157 = 7.987; p < 0.0001). Post hoc tests detected a significantly lower MQI in over 75 (1.2 ± 0.2; CI. 1.1–1.3) compared to 65–75 (1.4 ± 0.3; CI: 1.4–1.5) (p = 0.001) and under 65 individuals (1.4 ± 0.2; CI: 1.4–1.5) (p = 0.001). No significant differences were observed between 65–75 and under 65 individuals.
3.5 Extracellular mass to body cell mass ratio analysis
3.5.1 ECM/BCM characterization
ECM/BCM mean value was 0.91 ± 0.12. ECM/BCM was found higher in women (CI: 0.93–0.97) compared to men (CI: 0.82–0.87). ECM/BCM was significantly different among age groups, and Bonferroni post hoc test showed significantly higher ECM/BCM in individuals aged over 75 (CI: 0.99–1.10) compared to 65–75 (CI: 0.88–0.93) (p < 0.0001), and under 65 (CI: 0.84–0.90) (p < 0.0001) (Table 2). No significant differences in ECM/BCM were observed between smokers and non-smokers, nor in relation to the use of antihypertensive, hypolipidemic, antidiabetic, or antiplatelet medications (all p > 0.05). For this reason, these factors were not included in the multivariable models to adjust for their potential influence.
Participants were classified by ECM/BCM median in 2 groups: “low ECM/BCM” (79 subjects, 31 women) and “high ECM/BCM” (79 subjects, 65 women) (Table 4). Estimated marginal means of the outcomes of interest, corrected by the covariate age (mean 65.97), were significantly different between the two ECM/BCM groups, as shown in Table 5. Comorbidity index was not significantly different between the two groups after covariate correction. ECM/BCM group*sex interaction was observed only for the outcome MQI (F1,157 = 4.729; p = 0.031).
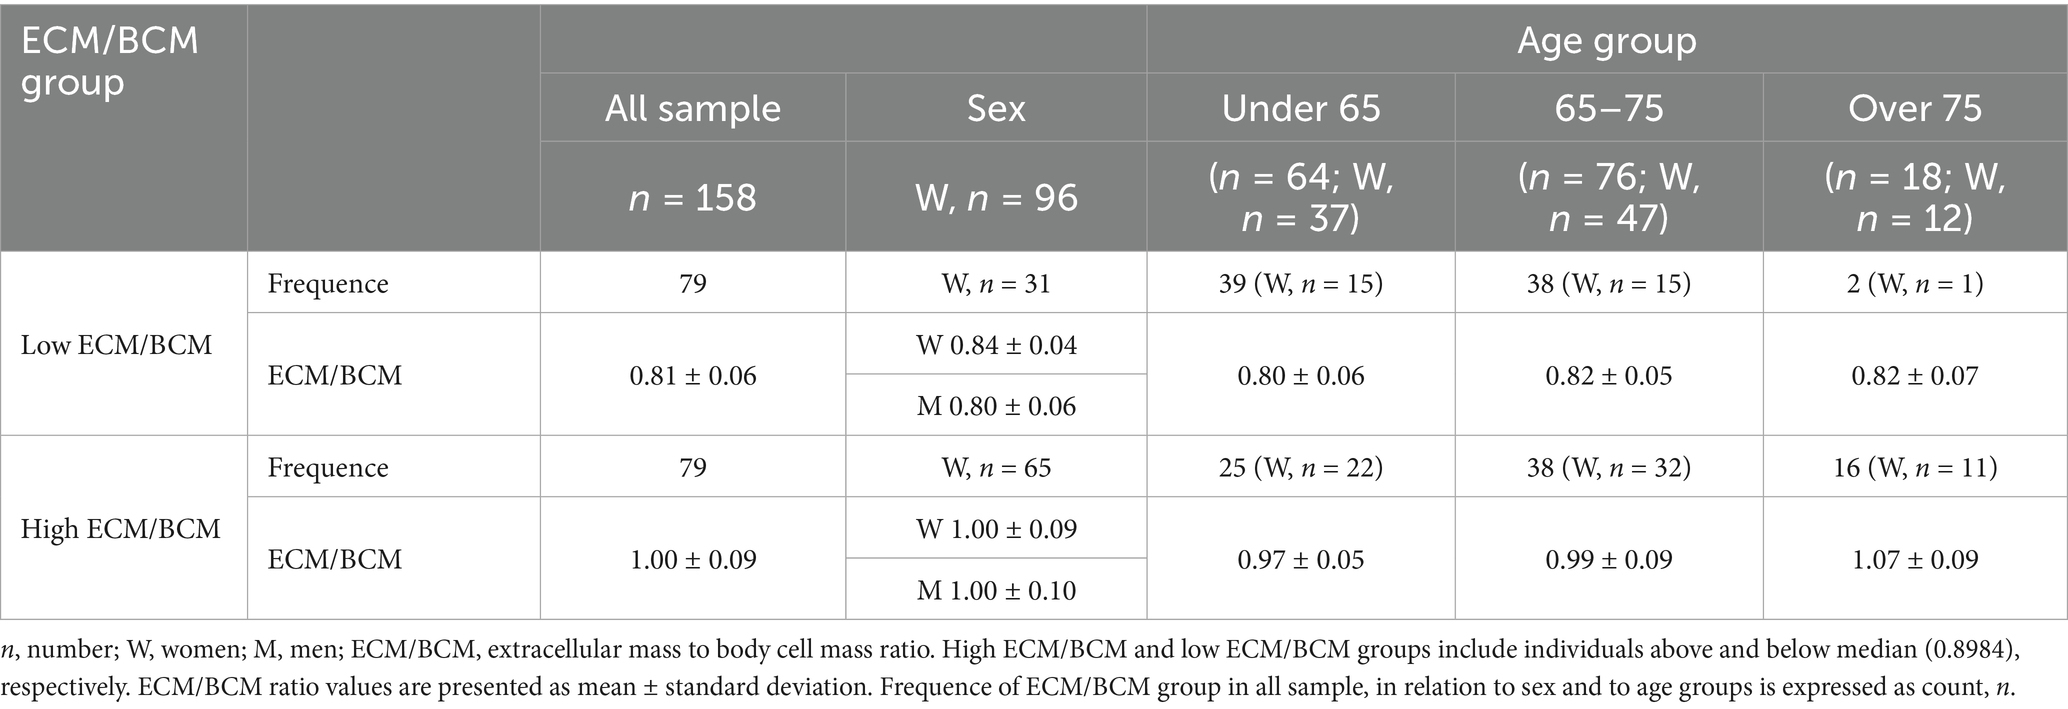
Table 4. ECM/BCM groups characterization accordingly to sex and age groups.
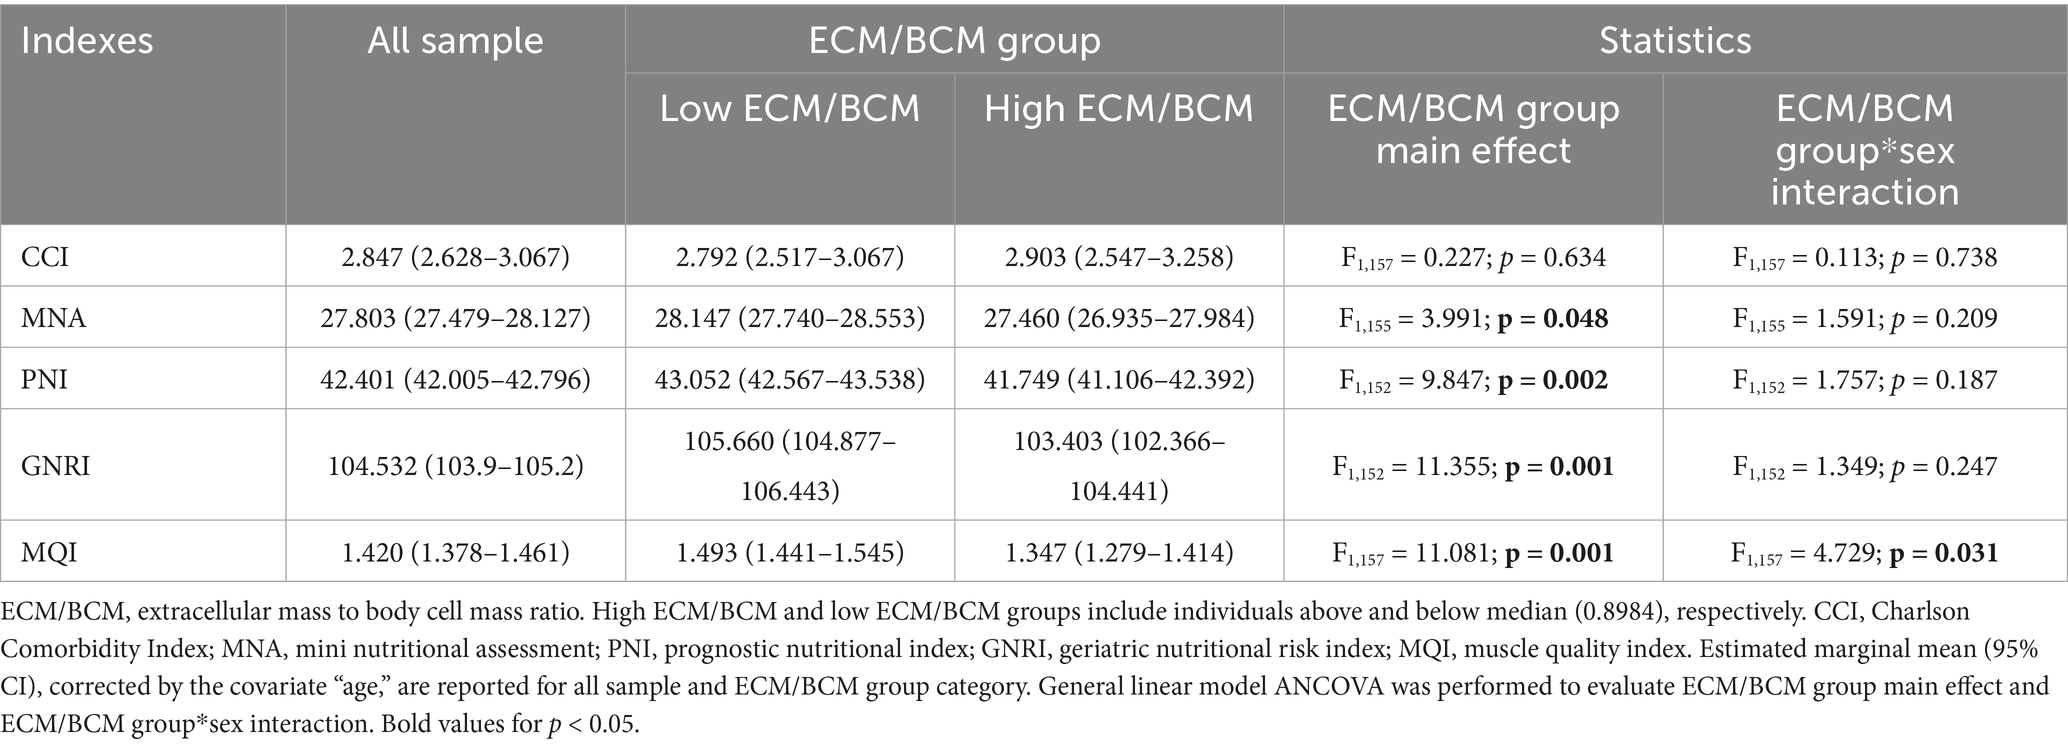
Table 5. Differential analysis for clinical, nutritional and functional indexes accordingly to ECM/BCM group and sex.
3.5.2 Linear regression analysis
Linear regression was performed to evaluate the prediction of dependent variables as CCI, MNA, PNI, GNRI, and MQI using ECM/BCM and age and sex as confounder factors. No multicollinearity was observed (all VIF < 2) and no influential outliers (accordingly to studentized residuals and Cook’s distances) were revealed. Overall, the regression models were statistically significant for all the examined indices.
The model for CCI was highly significant (F3,157 = 42.837, p < 0.0001) and explained 45.5% of the variance (R2 = 0.455; R2adj = 0.444). The model for MNA was also significant (F3,155 = 4.155, p = 0.007), explaining the 7.6% of the variance (R2 = 0.076; R2adj = 0.058). For the PNI, the model reached statistical significance (F3,152 = 5.195, p = 0.002), with 9.5% of the variance explained (R2 = 0.095; R2adj = 0.076). Similarly, GNRI was significant (F3,152 = 7.417, p < 0.0001), accounting for 13.0% of the variance (R2 = 0.130; R2adj = 0.112). Finally, the regression model for MQI demonstrated strong significance (F3,157 = 25.387, p < 0.0001), explaining 33.1% of the variance (R2 = 0.331; R2adj = 0.318). ECM/BCM was shown a significant predictor for all investigated outcomes, as shown in Table 6.
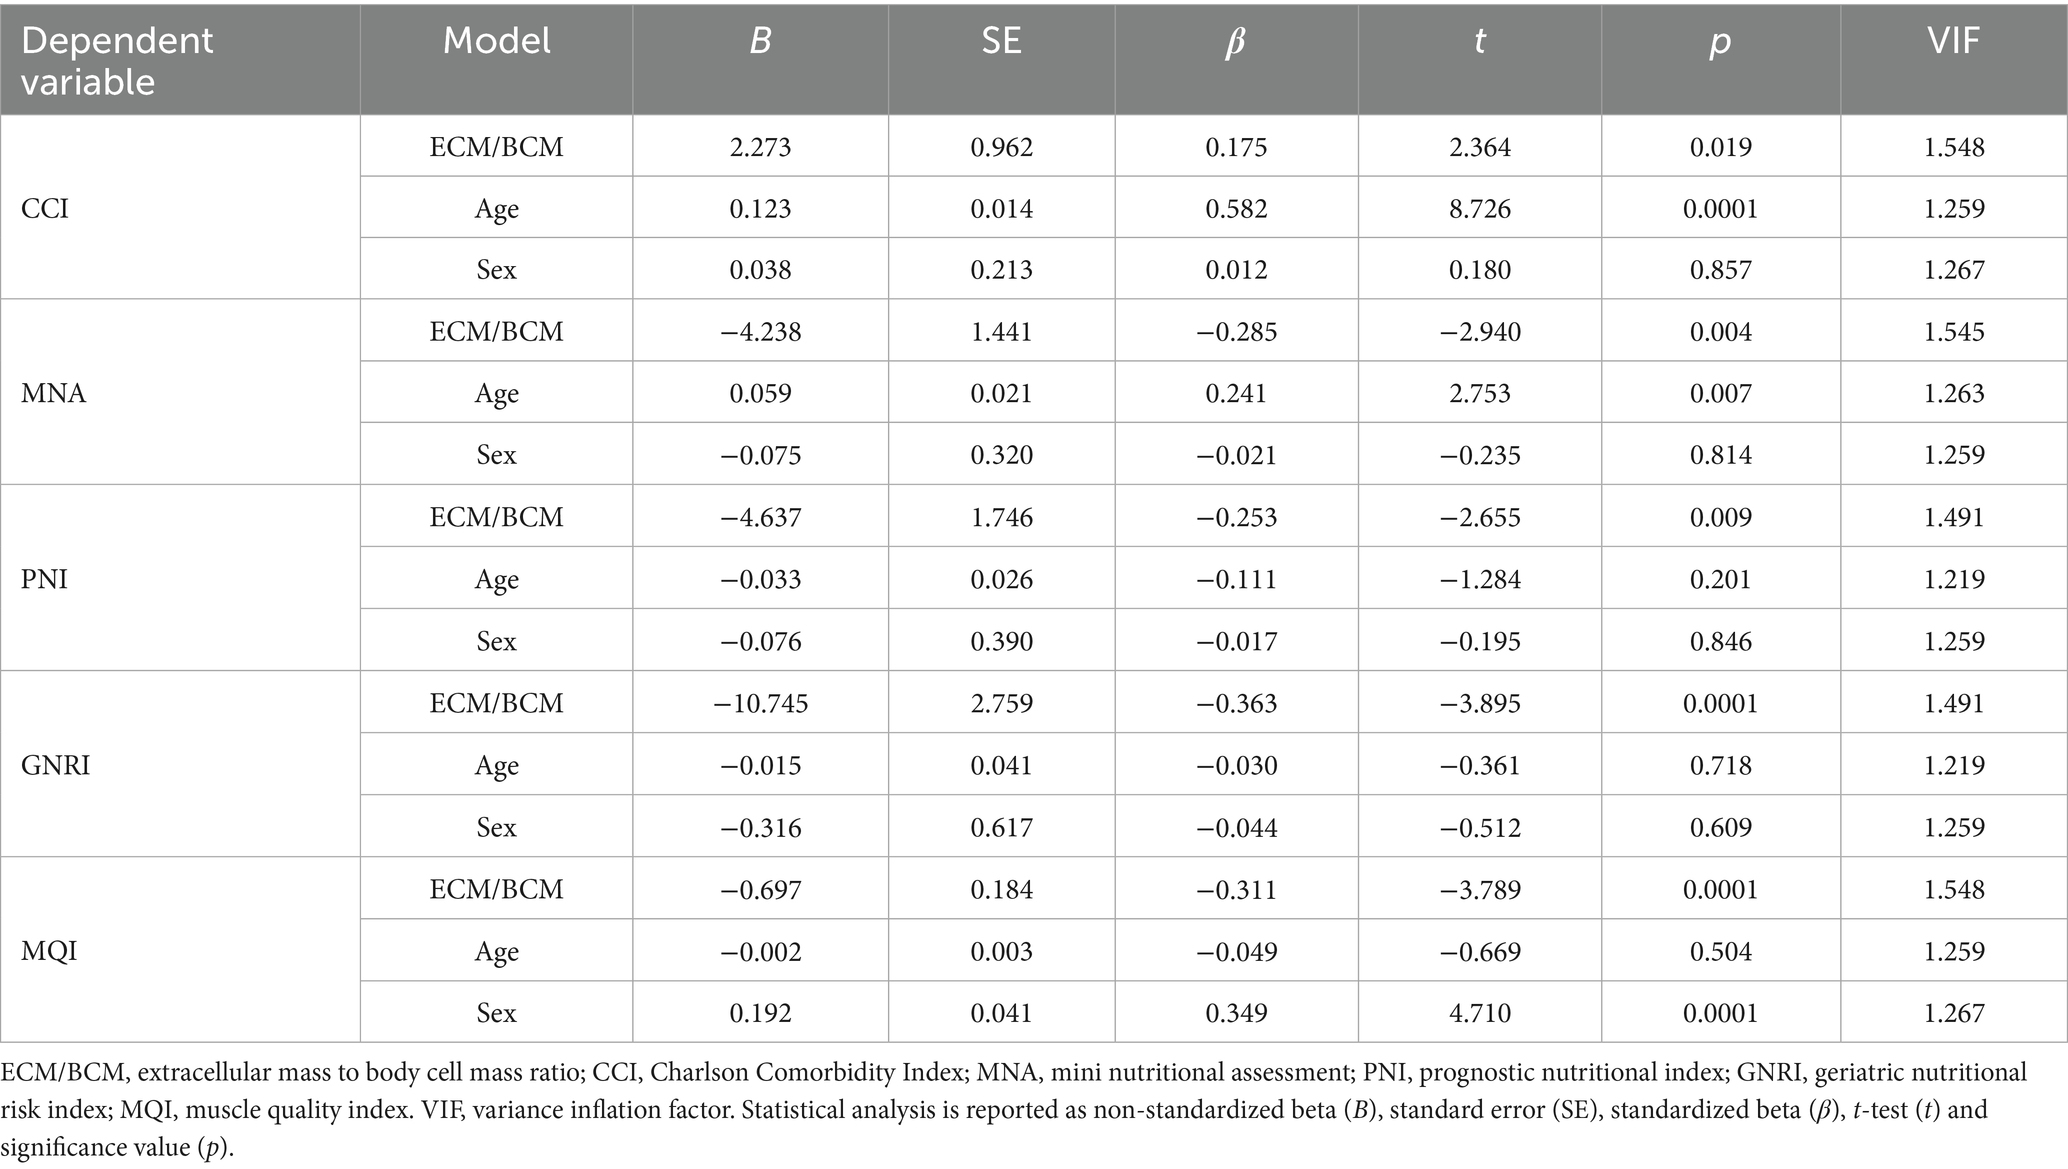
Table 6. Linear regression analysis for the prediction of dependent variables CCI, MNA, PNI, GNRI and MQI by predictors ECM/BCM, sex and age.
4 Discussion
This study investigated the association between ECM/BCM, an index obtained by BIVA, and both subjective and objective indicators of nutritional, health and functional status, in middle-aged adults and community dwelling older individuals. The findings demonstrated that ECM/BCM increases with age and is higher in women than in men, and that high ECM/BCM values are associated with lower scores of MNA, PNI, GNRI, and MQI. Furthermore, regression analyses revealed that ECM/BCM was a significant predictor of health, nutritional, and functional status. This association remained statistically significant even after adjusting for potential confounders such as age and sex.
Herein, ECM/BCM is proposed as an indicator of FFM quality in older individuals, reflecting cellular and extracellular mass balance. ECM/BCM mean values were found to fall within the normality range, according to Talluri et al. (18). Single values below (31.6%) and above this range (20.9%) were principally observed in men and women, respectively. As expected, the ratio varied accordingly to sociodemographic characteristics such as age and sex, with values increasing with age and being higher in women than in men. These findings are consistent with those of Gallagher et al. who reported an age-related decline of BCM relative to FFM. Notably, this decline was less pronounced in women than in men, suggesting that sex may moderate the effect of aging on body composition. Furthermore, the study further suggests that the reduction of BCM relative to FFM with advancing age is accompanied by a small but consistent increase in extracellular fluid (41, 42).
After controlling for age and sex, ECM/BCM proves to be a predictor of comorbidity burden, by means of CCI, even when not major health problems are present, suggesting its potential utility in detecting early sign of clinical distress. This finding is consistent with a previous prospective observational study by Ruperto and Barril, who reported a positive correlation between ECM/BCM and CCI in hemodialyzed patients. In the same study, an ECM/BCM cut-off value ≥1.20, in conjunction with elevated inflammatory markers and comorbidities, was significantly associated with an increased risk of all-cause mortality (22).
Although the majority of the participants in this study did not exhibit major clinical conditions, except for pharmacologically treated hypertension (29.7%) and hypercholesterolemia (19.0%), and demonstrated hydration status (TBW/FFM %) within the normality range (18, 34), age-related processes, such as protein catabolism, chronic inflammation, oxidative stress, and mitochondrial dysfunction, may subtend the observed association between ECM/BCM and the clinical phenotype (43).
Interestingly, several studies have explored the relationship between reduction in whole body lean mass and cognitive decline (6, 13). A recent study involving segmental bioimpedance analysis in 365 cognitively normal individuals, 123 patients with mild cognitive impairment, and 30 patients with Alzheimer Disease, demonstrated a negative correlation between extracellular-to-intracellular water ratio, in the lower extremities, and cognitive impairment associated to Alzheimer’s disease (44).
In this study, participants exhibit generally preserved cognitive functions, although significative lower MoCA score in over 75 compared to younger individuals were found (32, 33). This relative preservation of cognitive status likely limited the analysis of an association between ECM/BCM and cognitive performance. Further studies are warranted to investigate this potential relationship in population with cognitive impairment.
Analysis of MNA scores indicate an overall good nutritional status among participants, with no differences across age groups or between sexes. Individuals with higher ECM/BCM values presented lower MNA scores, although these scores remained within the normal nutritional status range (5). This trend was reflected by the modest yet statistically significant association between ECM/BCM and nutritional status as assessed by MNA.
Our findings are consistent with previous studies reporting a positive association between MNA and PhA (6) a parameter reflecting cell membrane integrity, body cell mass, which is closely related to body fluid distribution, and compartmentalization (37, 45). However, PhA represents a composite single value that is significantly influenced by age, sex, and BMI and does not provide specific insights into shifts between BCM and ECM, thus requiring a combined analysis of body compartments estimates (14). Given its strong correlation with PhA and its predictive value for MNA score, as demonstrated by our linear regression model, ECM/BCM may serve as a simpler yet informative BIVA-derived parameter for assessing nutritional status in older adults.
Biochemical data presented in this study further support the relationship between ECM/BCM and nutritional status. GNRI and PNI are widely used indicators of nutritional status and have been associated to diverse clinical outcomes (8–10, 37, 46). Herein, individuals with higher ECM/BCM exhibited significantly lower PNI and GNRI values compared to those with lower ECM/BCM, even after adjusting for age and sex. The association were confirmed by the regression model, which identified ECM/BCM as a significant predictor of PNI and GNRI.
Although blood parameters and nutritional index scores were within normal ranges in our study population (11, 35, 47, 48), the association between higher ECM/BCM and lower PNI and GNRI may reflect an early loss of BCM and fluid expansion in older individuals, potentially linked to lower level of albumin. Albumin is the most used plasma biomarker for assessing malnutrition (49) and hypoalbuminemia has been associated to low muscle mass and function, increased mortality risk, and poor recovery outcomes both in community-dwelling and hospitalized older adults (47). Our findings are confirmed by a previous work by Rondanelli and co-authors who reported a significant association between the body cell mass index (BCM/(height)2) and serum albumin, in a geriatric population (50). In line with our results, Ruperto and Barril reported a significant correlation between ECM/BCM and both malnutrition–inflammation score and high sensitivity C-reactive protein (s-CRP) in hemodialyzed patients. A more recent study investigating the relationship between body composition and inflammatory markers, found an inverse association between BCM and absolute FFM with s-CRP (51). The authors explained this correlation by the activation of myokines in skeletal muscle to induce protectory anti-inflammatory activity (51).
MQI has been proposed as a better predictor of functional capacity in older individuals compared to muscle mass alone or hand-grip strength (52). In hemodialyzed patients, MQI has also been associated with clinical prognosis, and it has been shown that visceral fat does not significantly influence this relationship (53). These findings underscore the relevance of FFM and its two components, in relation to functional capacity as expressed by MQI.
The data presented in this study identify ECM/BCM as a significant predictor of MQI in older adults. Notably, high ECM/BCM were associated with lower MQI, even after adjusting for potential confounding factors, and a significant interaction with sex was observed. Specifically, sex-related differences in MQI were evident across both ECM/BCM groups but were more pronounced in the low ECM/BCM group. This finding may be attributed to baseline sex differences in the proportion of BCM relative to FFM, which tend to diminish as age increases, with men experiencing a more accelerated decline in BCM compared to women (41).
Several studies support our findings. Specifically, the association between FFM and its components, in terms of BCM/FFM, ECW/ICW, ECW/TBW, with physical performance in both adult and older individuals has been previously demonstrated. In community dwelling elderly women, hand-grip strength and gait speed was found to be negatively correlated with the total body ECW/ICW ratio, which has been suggested as an indicator of overall health status in this population (54). Serra-Prat and co-authors suggested that the decline in ICW observed in older adults, potentially reflecting both a reduction in muscle cell number and decrease cellular hydration, is associated with reduced muscle strength and impaired functional performance (55). Similarly, Yamada et al. demonstrated in a cohort of 115 adults that both BCM/FFM and ECW/ICW were significant predictors of peak oxygen uptake, a key indicator of cardiorespiratory fitness (24).
From a mechanistic perspective, the association between ECM/BCM and health and functional status in older adult, may be driven by age-related malnutrition. This condition results from physiological changes that affect dietary requirement, nutrients absorption and metabolic utilization, accompanied by imbalances in energy, protein and micronutrients intake, ultimately leading to catabolism and altered body composition (56).
In this context, the interplay between nutrition and immune function may represent a critical factor particularly in older individuals. At a cellular level, immune-senescence and inflammation are the key processes associated with impaired immune responses and a pro-inflammatory milieu, which underlie many of the physiological and pathological changes observed with aging (57).
This study presents some limitations. The cross-sectional design prevents from clarifying the causal association between ECM/BCM and health, nutritional, and functional status. The absence of data related to nutritional/energy intake and level of physical activity did not allow to verify the presence of poor dietary habits and sedentary behavior in our population. Future studies, specifically designed, should further investigate the relationship between ECM/BCM and lifestyle, psychosocial, and environmental factors. The absent of overt malnutrition cases within the sample limited the ability to define a cut-off point for discriminating nutritional and functional status. Moreover, the relatively small sample size and single-center design may limit the generalizability of the findings to other populations. Future multi-centered, cross-cultural studies are warranted to validate ECM/BCM and to further evaluate its universality and reliability in the diverse population groups. While pairwise and listwise deletion were applied, due to the low proportion of missing values and the nature of the available data, the use of multiple imputation could be considered in future studies to further reduce the risk of bias and enhance statistical efficiency. BIA is not considered the gold standard for body composition measurements because its reliance on population specific equations to calculate body composition estimates, might lead to errors in older and diseased subjects, who are characterized by altered body composition and hydration status. The application of BIVA overcomes this limitation, since it is independent of predictive equations and necessary assumptions to estimate body compartment through the analysis of raw bioelectrical parameters, it provides semi-quantitative data on body cell mass, cellular integrity and tissue hydration status (12). ECM/BCM is derived from estimates of FFM and BCM, calculated using age- and sex-specific equations based on bioelectrical impedance and anthropometric data. Despite this, it remains a practical and accessible indicator of nutritional and hydration status, particularly when interpreted alongside raw bioelectrical data. Unlike vector analysis, which requires expertise, ECM/BCM also may represent a relatively simple and accessible parameter, both for clinician to interpret and for patients to understand. Furthermore, compared to dual-energy X-ray absorptiometry, the gold standard for body composition assessment, BIVA offers an easy to use, portable, not expensive and non-invasive alternative for the assessment and monitoring of body composition (12).
In conclusion, clinical guidelines recommend the use of standardized screening tools to identify the risk of malnutrition or the presence of overt malnutrition in older individuals, along with the collection of objective measurements, including anthropometric, biochemical, nutritional and functional markers (58). These recommendations underlying the need of adopting multidimensional approaches to better characterize aging phenotypes and risk factors.
In this study, ECM/BCM was found to be associated, after adjustment for cofounding factors as age and sex, with both subjective and objective indicators of health, nutritional and functional status in middle-aged adults and community dwelling older individuals. From an integrated perspective, ECM/BCM may serve as a simple, objective, and easily obtainable index for the assessment and monitoring of health, nutritional and functional status in this population.
From this perspective, an ECM/BCM imbalance may reflect compromised health, nutritional, and functional status in older individuals, who are intrinsically frail, even in the absence of overt clinical conditions, as observed in our sample. This imbalance may represent the physiological progressive loss of homeostatic resilience in response to stress. Future research will be addressed to characterize ECM/BCM shifts in both physiological aging and age-related clinical conditions and to elucidate the underlying pathophysiological mechanisms (e.g., low-grade chronic inflammation, oxidative stress, etc.) that may contribute to ECM/BCM imbalance and its association with functional decline in both aging and age-related diseases.
Data availability statement
The data that support the findings of this study are made available from the corresponding author, upon reasonable request.
Ethics statement
The studies involving humans were approved by Sardinia Ethics Committee, Prot. PG/2023/5172, 06/04/2023. The studies were conducted in accordance with the local legislation and institutional requirements. The participants provided their written informed consent to participate in this study.
Author contributions
AC: Writing – review & editing, Investigation, Conceptualization, Writing – original draft, Formal analysis. LV: Writing – review & editing, Data curation, Investigation. MC: Investigation, Writing – review & editing, Formal analysis. EC: Writing – review & editing, Investigation, Data curation. JS: Writing – review & editing, Investigation, Data curation. GM: Data curation, Investigation, Writing – review & editing. CO: Investigation, Writing – review & editing, Data curation. NL: Writing – review & editing, Data curation. FG: Formal analysis, Writing – review & editing. AM: Formal analysis, Writing – review & editing. FD: Writing – original draft, Methodology, Funding acquisition, Conceptualization, Supervision, Project administration, Writing – review & editing.
Funding
The author(s) declare that financial support was received for the research and/or publication of this article. This work was funded by Unione Europea, Next Generation EU, PNRR M6C2, Investimento 2.1 Valorizzazione e potenziamento della ricerca biomedica del SSN, PNRR-MAD-2022-12376667, CUP H83C22000720006.
Conflict of interest
The authors declare that the research was conducted in the absence of any commercial or financial relationships that could be construed as a potential conflict of interest.
Generative AI statement
The authors declare that no Gen AI was used in the creation of this manuscript.
Any alternative text (alt text) provided alongside figures in this article has been generated by Frontiers with the support of artificial intelligence and reasonable efforts have been made to ensure accuracy, including review by the authors wherever possible. If you identify any issues, please contact us.
Publisher’s note
All claims expressed in this article are solely those of the authors and do not necessarily represent those of their affiliated organizations, or those of the publisher, the editors and the reviewers. Any product that may be evaluated in this article, or claim that may be made by its manufacturer, is not guaranteed or endorsed by the publisher.
References
1. Lorenzo-López, L, Maseda, A, De Labra, C, Regueiro-Folgueira, L, Rodríguez-Villamil, JL, and Millán-Calenti, JC. Nutritional determinants of frailty in older adults: a systematic review. BMC Geriatr. (2017) 17:1–13. doi: 10.1186/s12877-017-0496-2
2. Tomasiewicz, A, Polański, J, and Tański, W. Advancing the understanding of malnutrition in the elderly population: current insights and future directions. Nutrients. (2024) 16:2502. doi: 10.3390/nu16152502
3. Volkert, D, Beck, AM, Cederholm, T, Cruz-Jentoft, A, Goisser, S, Hooper, L, et al. ESPEN guideline on clinical nutrition and hydration in geriatrics. Clin Nutr. (2019) 38:10–47. doi: 10.1016/j.clnu.2018.05.024
4. Mueller, C, Compher, C, and Ellen, DM. A.S.P.E.N. clinical guidelines: nutrition screening, assessment, and intervention in adults. J Parenter Enter Nutr. (2011) 35:16–24. doi: 10.1177/0148607110389335
5. Guigoz, Y, Lauque, S, and Vellas, BJ. Identifying the elderly at risk for malnutrition. Clin Geriatr Med. (2002) 18:737–57. doi: 10.1016/S0749-0690(02)00059-9
6. Buffa, R, Mereu, RM, Putzu, PF, Floris, G, and Marini, E. Bioelectrical impedance vector analysis detects low body cell mass and dehydration in patients with Alzheimer’s disease. J Nutr Health Aging. (2010) 14:823–7. doi: 10.1007/s12603-010-0115-9
7. Keller, U. Nutritional laboratory markers in malnutrition. J Clin Med. (2019) 8:775. doi: 10.3390/jcm8060775
8. da Costa Pereira, JP, Silva Diniz, A, de Lemos, MCC, Ramiro, CPSP, and Cabral, PC. Prognostic value of the geriatric nutritional risk index and other hematological markers on long-term survival in the geriatric population. Geriatr Gerontol Int. (2024) 24:312–8. doi: 10.1111/ggi.14821
9. Zhou, J, Ma, L, Zhao, L, Sheng, J, Xu, Y, Chen, J, et al. Association between the prognostic nutritional index and cognitive function among older adults in the United States: a population-based study. J Alzheimer's Dis. (2021) 83:819–31. doi: 10.3233/JAD-210141
10. Cheng, L, Hu, S, and Wu, Q. Higher prognostic nutritional index is associated with lower incidence of sarcopenia. Geriatr Nurs (Minneap). (2025) 63:499–504. doi: 10.1016/j.gerinurse.2025.03.046
11. Bouillanne, O, Morineau, G, Dupont, C, Coulombel, I, Vincent, J-P, Nicolis, I, et al. Geriatric nutritional risk index: a new index for evaluating at-risk elderly medical patients. Am J Clin Nutr. (2005) 82:777–83. doi: 10.1093/ajcn/82.4.777
12. Norman, K, Stobäus, N, Pirlich, M, and Bosy-Westphal, A. Bioelectrical phase angle and impedance vector analysis - clinical relevance and applicability of impedance parameters. Clin Nutr. (2012) 31:854–61. doi: 10.1016/j.clnu.2012.05.008
13. Buffa, R, Mereu, E, Comandini, O, Ibanez, ME, and Marini, E. Bioelectrical impedance vector analysis (BIVA) for the assessment of two-compartment body composition. Eur J Clin Nutr. (2014) 68:1234–40. doi: 10.1038/ejcn.2014.170
14. Bellido, D, García-García, C, Talluri, A, Lukaski, HC, and García-Almeida, JM. Future lines of research on phase angle: strengths and limitations. Rev Endocr Metab Disord. (2023) 24:563–83. doi: 10.1007/s11154-023-09803-7
15. Catapano, A, Trinchese, G, Cimmino, F, Petrella, L, D’Angelo, M, Di Maio, G, et al. Impedance analysis to evaluate nutritional status in physiological and pathological conditions. Nutrients. (2023) 15:2264. doi: 10.3390/nu15102264
16. Moore, FD, and Boyden, CM. Body cell mass and limits of hydration of the fat-free body: their relation to estimated skeletal weight. Ann N Y Acad Sci. (1963) 110:62–71. doi: 10.1111/j.1749-6632.1963.tb17072.x
17. Earthman, C, Traughber, D, Dobratz, J, and Howell, W. Bioimpedance spectroscopy for clinical assessment of fluid distribution and body cell mass. Nutr Clin Pract. (2007) 22:389–405. doi: 10.1177/0115426507022004389
18. Talluri, T, Lietdke, RJ, Evangelisti, A, Talluri, J, and Maggia, G. Fat-free mass qualitative assessment with bioelectric impedance analysis (BIA). Ann N Y Acad Sci. (1999) 873:94–8. doi: 10.1111/j.1749-6632.1999.tb09454.x
19. Avram, MM, Fein, PA, Borawski, C, Chattopadhyay, J, and Matza, B. Extracellular mass/body cell mass ratio is an independent predictor of survival in peritoneal dialysis patients. Kidney Int. (2010) 78:S37–40. doi: 10.1038/ki.2010.192
20. Małecka-Massalska, T, Smoleń, A, and Morshed, K. Extracellular-to-body cell mass ratio and subjective global assessment in head-and-neck cancers. Curr Oncol. (2014) 21:62–6. doi: 10.3747/co.21.1671
21. Rott, C, Limen, E, Kriegsmann, K, Herth, F, and Brock, JM. Analysis of body composition with bioelectrical impedance analysis in patients with severe COPD and pulmonary emphysema. Respir Med. (2024) 223:107559. doi: 10.1016/j.rmed.2024.107559
22. Ruperto, M, and Barril, G. The extracellular mass to body cell mass ratio as a predictor of mortality risk in hemodialysis patients. Nutrients. (2022) 14:1659. doi: 10.3390/nu14081659
23. Crisafulli, O, Bottoni, G, Lacetera, J, Fassio, F, Grattarola, L, Lavaselli, E, et al. Bioimpedance analysis of fat free mass and its subcomponents and relative associations with maximal oxygen consumption in facioscapulohumeral dystrophy. Eur J Appl Physiol. (2024) 125:157–65. doi: 10.1007/s00421-024-05581-5
24. Yamada, Y, Yoshida, T, Murakami, H, Gando, Y, Kawakami, R, Ohno, H, et al. Body cell mass to fat-free mass ratio and extra- to intracellular water ratio are related to maximal oxygen uptake. J. Gerontol. Ser. A. (2023) 78:1778–84. doi: 10.1093/gerona/glad140
25. Ohashi, Y, Joki, N, Yamazaki, K, Kawamura, T, Tai, R, Oguchi, H, et al. Changes in the fluid volume balance between intra- and extracellular water in a sample of Japanese adults aged 15–88 yr old: a cross-sectional study. Am J Physiol. Ren Physiol. (2018) 314:F614–22. doi: 10.1152/ajprenal.00477.2017
26. Hioka, A, Akazawa, N, Okawa, N, and Nagahiro, S. Influence of aging on extracellular water-to-total body water ratio in community-dwelling females. Clin Nutr ESPEN. (2024) 60:73–8. doi: 10.1016/j.clnesp.2024.01.007
27. Serra-Prat, M, Lorenzo, I, Martínez, J, Palomera, E, Pleguezuelos, E, and Ferrer, P. Relationship between hydration status and muscle catabolism in the aged population: a cross-sectional study. Nutrients. (2023) 15:4718. doi: 10.3390/nu15224718
28. Tenchov, R, Sasso, JM, Wang, X, and Zhou, QA. Aging hallmarks and progression and age-related diseases: a landscape view of research advancement. ACS Chem Neurosci. (2024) 15:1–30. doi: 10.1021/acschemneuro.3c00531
29. Charlson, M, Szatrowski, TP, Peterson, J, and Gold, J. Validation of a combined comorbidity index. J Clin Epidemiol. (1994) 47:1245–51. doi: 10.1016/0895-4356(94)90129-5
30. Roffman, CE, Buchanan, J, and Allison, GT. Charlson comorbidities index. J Physiother. (2016) 62:171. doi: 10.1016/j.jphys.2016.05.008
31. Nasreddine, ZS, Phillips, NA, Bédirian, V, Charbonneau, S, Whitehead, V, Collin, I, et al. The Montreal cognitive assessment, MoCA: a brief screening tool for mild cognitive impairment. J Am Geriatr Soc. (2005) 53:695–9. doi: 10.1111/j.1532-5415.2005.53221.x
32. Conti, S, Bonazzi, S, Laiacona, M, Masina, M, and Coralli, MV. Montreal cognitive assessment (MoCA)-Italian version: regression based norms and equivalent scores. Neurol Sci. (2015) 36:209–14. doi: 10.1007/s10072-014-1921-3
33. Santangelo, G, Siciliano, M, Pedone, R, Vitale, C, Falco, F, Bisogno, R, et al. Normative data for the Montreal cognitive assessment in an Italian population sample. Neurol Sci. (2015) 36:585–91. doi: 10.1007/s10072-014-1995-y
34. Buffa, R, Floris, G, and Marini, E. Migration of the bioelectrical impedance vector in healthy elderly subjects. Nutrition. (2003) 19:917–21. doi: 10.1016/S0899-9007(03)00180-1
35. Huang, H, Lu, M, Zhang, P, Xiao, L, Zhang, W, Xu, Y, et al. Association between malnutrition, depression, anxiety and fatigue after stroke in older adults: a cross-lagged panel analysis. Aging Clin Exp Res. (2025) 37:4. doi: 10.1007/s40520-024-02892-7
36. Nahler, G. Lorentz-formula In: Dictionary of pharmaceutical medicine. Vienna: Springer (2009). 9–11. doi: 10.1007/978-3-211-89836-9_803
37. Aiello, A, Calabrò, A, Zarcone, R, Caruso, C, Candore, G, and Accardi, G. Refining nutritional assessment methods for older adults: a pilot study on Sicilian long-living individuals. Forum Nutr. (2025) 17:1–18. doi: 10.3390/nu17111873
38. Lopes, LCC, Vaz-Gonçalves, L, Schincaglia, RM, Gonzalez, MC, Prado, CM, de Oliveira, EP, et al. Sex and population-specific cutoff values of muscle quality index: results from NHANES 2011–2014. Clin Nutr. (2022) 41:1328–34. doi: 10.1016/j.clnu.2022.04.026
39. Barbat-Artigas, S, Rolland, Y, Zamboni, M, and Aubertin-Leheudre, M. How to assess functional status: a new muscle quality index. J Nutr Health Aging. (2012) 16:67–77. doi: 10.1007/s12603-012-0004-5
40. Sergi, G, De Rui, M, Veronese, N, Bolzetta, F, Berton, L, Carraro, S, et al. Assessing appendicular skeletal muscle mass with bioelectrical impedance analysis in free-living Caucasian older adults. Clin Nutr. (2015) 34:667–73. doi: 10.1016/j.clnu.2014.07.010
41. Gallagher, D, Visser, M, Wang, Z, Harris, T, Pierson, RN, and Heymsfield, SB. Metabolically active component of fat-free body mass: influences of age, adiposity, and gender. Metabolism. (1996) 45:992–7. doi: 10.1016/s0026-0495(96)90269-3
42. Bazzocchi, A, Diano, D, Ponti, F, Andreone, A, Sassi, C, Albisinni, U, et al. Health and ageing: a cross-sectional study of body composition. Clin Nutr. (2013) 32:569–78. doi: 10.1016/j.clnu.2012.10.004
43. López-Otín, C, Blasco, MA, Partridge, L, Serrano, M, and Kroemer, G. Hallmarks of aging: An expanding universe. Cell. (2023) 186:243–78. doi: 10.1016/j.cell.2022.11.001
44. Doan, DNT, Kim, K, Ku, B, Lee, KH, and Kim, JU. Reduced body cell mass and functions in lower extremities are associated with mild cognitive impairment and Alzheimer’s dementia. Sci Rep. (2023) 13:1–12. doi: 10.1038/s41598-023-39110-9
45. Kujawowicz, K, Mirończuk-Chodakowska, I, Cyuńczyk, M, and Witkowska, AM. Identifying malnutrition risk in the elderly: a single- and multi-parameter approach. Nutrients. (2024) 16:2537. doi: 10.3390/nu16152537
46. Lin, CY, Zhai, YJ, Wu, F, An, HH, Chen, T, Qiu, HN, et al. Interaction and overall effects of underweight, low muscle mass, malnutrition, and inflammation on early-onset mild cognitive impairment in type 2 diabetes. Front Aging Neurosci. (2025) 17:1–18. doi: 10.3389/fnagi.2025.1498478
47. Cabrerizo, S, Cuadras, D, Gomez-Busto, F, Artaza-Artabe, I, Marín-Ciancas, F, and Malafarina, V. Serum albumin and health in older people: review and meta analysis. Maturitas. (2015) 81:17–27. doi: 10.1016/j.maturitas.2015.02.009
48. Romano, AD, Paglia, A, Bellanti, F, Villani, R, Sangineto, M, Vendemiale, G, et al. Molecular aspects and treatment of iron deficiency in the elderly. Int J Mol Sci. (2020) 21:3821. doi: 10.3390/ijms21113821
49. Zhang, Z, Pereira, SL, Luo, M, and Matheson, EM. Evaluation of blood biomarkers associated with risk of malnutrition in older adults: a systematic review and meta-analysis. Nutrients. (2017) 9:829. doi: 10.3390/nu9080829
50. Rondanelli, M, Talluri, J, Peroni, G, Donelli, C, Guerriero, F, Ferrini, K, et al. Beyond body mass index. is the body cell mass index (BCMI) a useful prognostic factor to describe nutritional, inflammation and muscle mass status in hospitalized elderly?: body cell mass index links in elderly. Clin Nutr. (2018) 37:934–9. doi: 10.1016/j.clnu.2017.03.021
51. Bibi, S, Naeem, M, Bahls, M, Dörr, M, Friedrich, N, Nauck, M, et al. Body composition markers from classic anthropometry, bioelectrical impedance analysis, and magnetic resonance imaging are associated with inflammatory markers in the general population. Nutr Metab Cardiovasc Dis. (2023) 33:1899–906. doi: 10.1016/j.numecd.2023.05.026
52. Brown, JC, Harhay, MO, and Harhay, MN. The muscle quality index and mortality among males and females. Ann Epidemiol. (2016) 26:648–53. doi: 10.1016/j.annepidem.2016.07.006
53. Mayrink Ivo, JF, Sugizaki, CSA, Souza Freitas AT, V, Costa, NA, and Peixoto, M d RG. Age, hemodialysis time, gait speed, but not mortality, are associated with muscle quality index in end-stage renal disease. Exp Gerontol. (2023) 171:112035. doi: 10.1016/j.exger.2022.112035
54. Hioka, A, Akazawa, N, Okawa, N, and Nagahiro, S. Increased total body extracellular-to-intracellular water ratio in community-dwelling elderly women is associated with decreased handgrip strength and gait speed. Nutrition. (2021) 86:111175. doi: 10.1016/j.nut.2021.111175
55. Serra-Prat, M, Lorenzo, I, Palomera, E, Ramírez, S, and Yébenes, JC. Total body water and intracellular water relationships with muscle strength, frailty and functional performance in an elderly population. A cross-sectional study. J Nutr Health Aging. (2019) 23:96–101. doi: 10.1007/s12603-018-1129-y
56. Coperchini, F, Greco, A, Teliti, M, Croce, L, Chytiris, S, Magri, F, et al. Inflamm-ageing: how cytokines and nutrition shape the trajectory of ageing. Cytokine Growth Factor Rev. (2024) 82:31–42. doi: 10.1016/j.cytogfr.2024.08.004
57. Antuña, E, Cachán-Vega, C, Bermejo-Millo, JC, Potes, Y, Caballero, B, Vega-Naredo, I, et al. Inflammaging: implications in sarcopenia. Int J Mol Sci. (2022) 23:1–24. doi: 10.3390/ijms232315039
58. Boccardi, V, and Marano, L. Improving geriatric outcomes through nutritional and immunonutritional strategies: focus on surgical setting by a comprehensive evidence review. Ageing Res Rev. (2024) 96:102272. doi: 10.1016/j.arr.2024.102272
Glossary
ASMM - appendicular skeletal muscle mass
BCM - body cell mass
BIVA - bioelectrical impedance vector analysis
BMI - body mass index
CCI - Charlson comorbidity index
ECM - extracellular mass
ECM/BCM - extracellular mass to body cell mass ratio
ECW - extracellular water
ECW/ICW - extracellular-water–intracellular-water ratio
FFM - fat free mass
FM - fat mass
GNRI - geriatric nutritional risk index
Hgb - hemoglobin
HTC - hematocrit
ICW - intracellular water
MNA - mini nutritional assessment
MoCA - Montreal cognitive assessment
MQI - muscle quality index
PhA - phase angle
PNI - prognostic nutritional index
R/H - resistance standardized by height
TBW - total body water
TBW/FFM - total body water/fat-free mass ratio
WBC - white blood cells
Xc/H - reactance standardized by height
Keywords: extracellular mass to body cell mass ratio, body composition, mini nutritional assessment, aging, muscle quality index, prognostic nutritional index, geriatric nutritional risk index
Citation: Cano A, Ventura L, Catte MG, Castiglia E, Sanna J, Martinez G, Oneto C, Loi N, Ginatempo F, Manca A and Deriu F (2025) Extracellular mass to body cell mass ratio association to nutritional and functional status in middle-aged and older adults. Front. Nutr. 12:1683856. doi: 10.3389/fnut.2025.1683856
Edited by:
Di Wu, Guangzhou Center for Disease Control and Prevention, ChinaReviewed by:
Marta Jeruszka-Bielak, Warsaw University of Life Sciences, PolandQian Wu, The First Affiliated Hospital of Soochow University, China
Copyright © 2025 Cano, Ventura, Catte, Castiglia, Sanna, Martinez, Oneto, Loi, Ginatempo, Manca and Deriu. This is an open-access article distributed under the terms of the Creative Commons Attribution License (CC BY). The use, distribution or reproduction in other forums is permitted, provided the original author(s) and the copyright owner(s) are credited and that the original publication in this journal is cited, in accordance with accepted academic practice. No use, distribution or reproduction is permitted which does not comply with these terms.
*Correspondence: Franca Deriu, ZGVyaXVmQHVuaXNzLml0