Abstract
Background and aims:
Gestational diabetes mellitus (GDM) is a prevalent pregnancy complication associated with long-term cardiometabolic risk, including metabolic syndrome (MetS). This study aimed to assess differences in body composition and metabolic health 6 years postpartum based on prior GDM diagnosis and to identify body composition cut-off values predictive of MetS.
Methods:
This cross-sectional analysis included 604 women from the prospective St. Carlos Cohort in Spain, who had no subsequent pregnancies and complete body composition data 6 years postpartum. Body composition was assessed using bioelectrical impedance analysis (BIA), and MetS was diagnosed per harmonized criteria. Statistical analyses included ROC curves to establish diagnostic accuracy and optimal cut-off points.
Results:
Women with prior GDM had a twofold increased risk of developing MetS (26.6 vs. 14.6%). However, waist circumference or elevated BMI and waist-to-height ratio were not significantly different between groups. ROC analysis identified that body composition parameters, particularly fat mass (FM), visceral fat, and FM/Fat Free Mass ratio, as having high predictive value for MetS, regardless of GDM history (AUC ≥ 0.8). Women with MetS showed significantly higher FM and lower relative muscle mass and function. Diagnostic models showed high negative predictive values (≥90%) for most body composition parameters making them effective for excluding MetS.
Conclusion:
GDM is a significant predictor of MetS. However, body composition, especially increased adiposity and reduced relative muscle mass, provides valuable clinical insights beyond traditional anthropometric measures in postpartum women. The proposed cut-off values for body composition parameters may serve as effective, non-invasive tools for early MetS detection in postpartum care.
1 Introduction
Gestational diabetes mellitus (GDM) is characterized by hyperglycemia first recognized during the second or third trimester of pregnancy, in cases where overt diabetes is not clearly present (1, 2). According to the most recent report by the International Diabetes Federation (IDF), approximately 14% of pregnancies worldwide are affected by GDM when applying the criteria established by the International Association of Diabetes and Pregnancy Study Groups (IADPSG) (3). In Europe, the prevalence is slightly lower, at 7.8%, while in Spain is around 13.9%, depending on the population studied and diagnostic criteria used (3, 4).
Risk factors for GDM include overweight or obesity, advanced maternal age, excessive gestational weight gain, ethnicity, family history of insulin resistance or diabetes, among others (5). Although GDM usually resolves after delivery, women diagnosed with GDM have a significantly increased risk of developing type 2 diabetes mellitus and cardiovascular disease in the long-term follow-up (6, 7). Furthermore, women with a history of GDM also have a higher risk (8) and prevalence of metabolic syndrome (MetS) (25.3%) compared to those without GMD history (6.6%) (9). Women diagnosed with GDM often present long-term alterations in body composition after childbirth (10, 11). Normoglycemic women who experience excessive gestational weight gain also entail an increased risk of postpartum weight retention and potentially unfavorable changes in body composition (12, 13). These findings suggest that pregnancy itself may trigger persistent metabolic alterations, which could contribute to the later development of cardiometabolic disease (14, 15). Consequently, body composition may serve as a useful prognostic marker for MetS in women with a history of pregnancy.
The St. Carlos Cohort is a prospective population-based clinical study established at the Hospital Clínico San Carlos in Madrid, Spain. It was designed to analyze long-term outcomes in women diagnosed with GDM and to identify modifiable risk factors contributing to the development of subsequent metabolic disorders. The cohort integrates data from three public funded national studies and includes follow-up of over 2,500 women for more than 10 years (16). The St. Carlos Cohort represents a substantial contribution to the understanding and prevention of long-term metabolic complications in women with prior GDM, offering valuable insights for the development of early, targeted, and personalized intervention strategies (17).
In this setting, the present study was conducted with two main objectives: first, to evaluate differences in maternal body composition and metabolic health 6 years postpartum according to previous GDM diagnosis; and second, to establish, for the first time, cut-off points for body composition parameters associated with the risk of MetS.
2 Materials and methods
The St. Carlos Cohort comprises three consecutives prospective, single-center, interventional clinical trials all registered at https://www.isrctn.com/ under the identifiers ISRCTN84389045, ISRCTN13389832, and ISRCTN16896947. The data used in the present analysis were collected in an identical manner across all three studies, thereby enabling the integration of the study variables.
2.1 Participants and selection criteria
At baseline, a total of 2,529 normoglycemic pregnant women were enrolled in the St. Carlos Cohort at approximately the 12th gestational week (GW). All participants were assessed and closely monitored by both the Department of Obstetrics and the Department of Nutrition at the Hospital Clínico San Carlos in Madrid, Spain. Of these, 2,228 participants completed antenatal follow-up all the way through to delivery and were evaluated at the end of pregnancy. Longitudinal follow-up during gestation and the postpartum period was conducted from 2015 to 2018. A total of 1,403 women completed a face-to-face visit at 6 years postpartum and were subsequently included in the postnatal phase of the study. For the present cross-sectional analysis from the prospective St. Carlos Cohort, only women without subsequent pregnancies and with available data on body composition at 6 years postpartum were considered, resulting in a final sample of 604 participants (Figure 1). Women with subsequent pregnancies during the follow-up period were excluded in order to avoid the potential confounding effects of additional gestational exposures on metabolic outcomes.
Figure 1
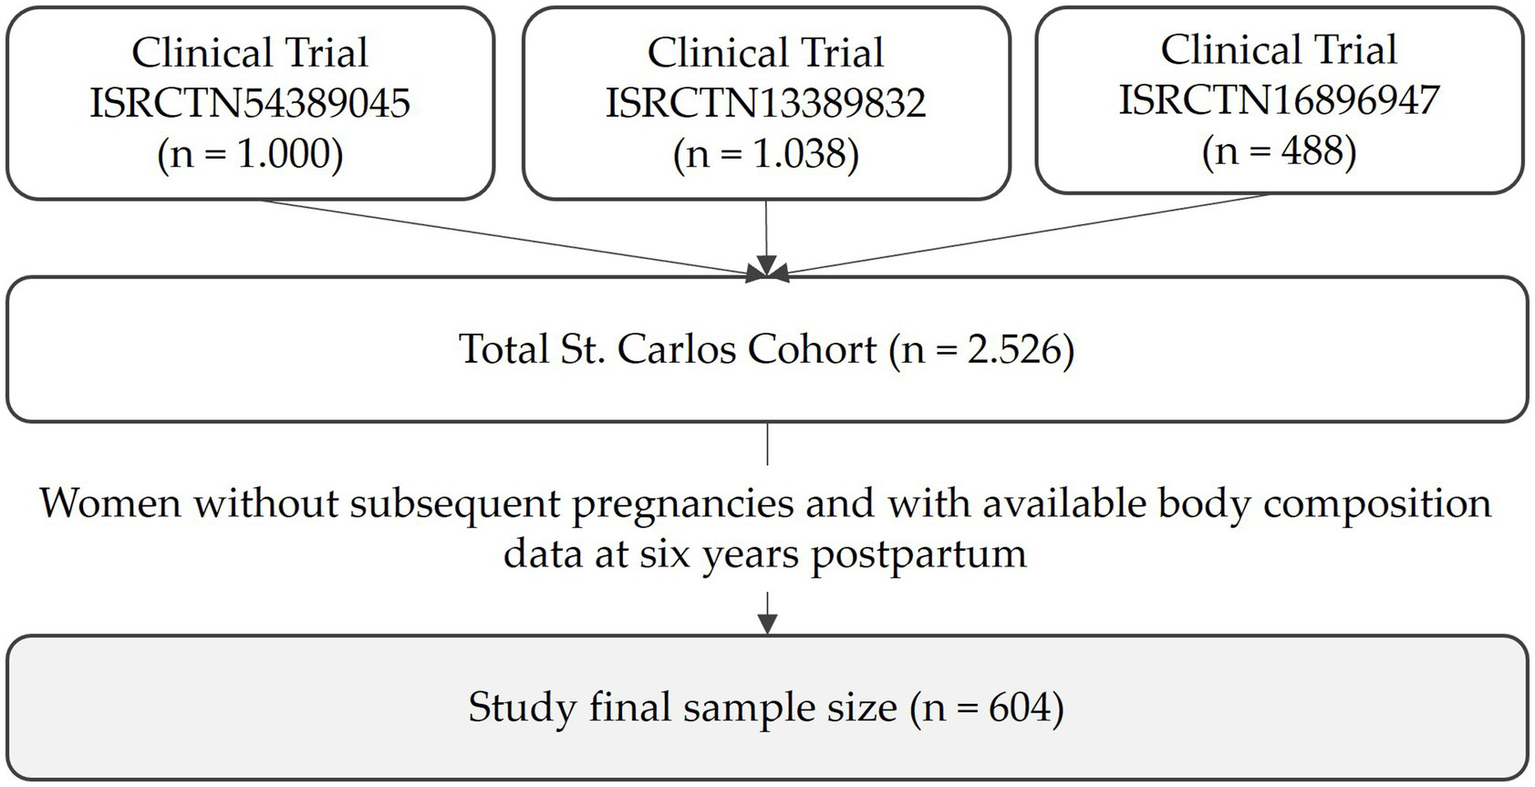
Constitution of the St. Carlos Cohort and final size of the study.
2.2 Ethics statement
The three studies were approved by the Ethics Committee of Hospital Clínico San Carlos under the codes CI 13/296-E, CI 16/442-E, and CI 16/316.1 All procedures were conducted in accordance with the Ethical Standards of the Institutional Research Committee and the principles outlined in the Declaration of Helsinki for biomedical research involving human participants (18). All researchers involved known and followed the ICH Harmonized Tripartite Guidelines for Good Clinical Practice (19).
All study data were processed by members of the research team in a database specifically created for this study and dissociated from any data that could identify the patient. The processing of personal data will follow the Spanish Organic Law (Ley Orgánica) 3/2018, of December 5, and the General Data Protection Regulation of the European Union (EU) 2016/679 of April 27, 2016.
2.3 Timeline
The prospective St. Carlos Cohort and the present cross-sectional analysis are represented in Figure 2. Baseline characteristics were initially evaluated at the 12th GW and stratified by GDM during pregnancy. A follow-up assessment was conducted 6 years postpartum, examining the presence of MetS, anthropometric parameters, and body composition, also stratified by prior GDM diagnosis. During this phase, the risk of developing MetS 6 years after delivery was analyzed in relation to the previous diagnosis of GDM. Finally, body composition was evaluated based on the presence of MetS after 6 years. In this stage, diagnostic models for MetS were also developed and their performance was evaluated.
Figure 2
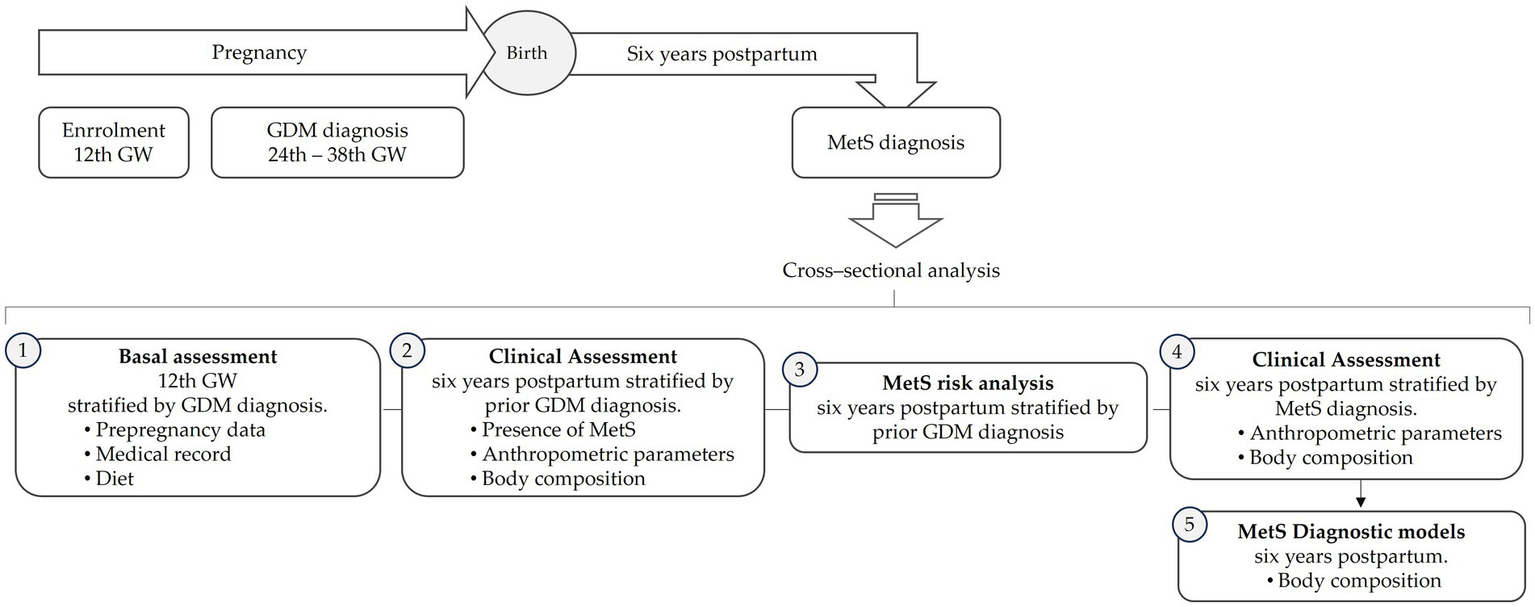
Flowchart of the analysis of the study.
2.4 Definition of gestational diabetes mellitus
GDM was diagnosed according to the criteria established by the International Association of the IADPSG (20, 21). Screening was performed between 24 and 28 GW using a single-step 2-h 75-g oral glucose tolerance test (OGTT). Plasma glucose levels were measured at fasting, 1 h, and 2 h post-glucose load. Diagnosis of GDM was made when one or more of the following thresholds were met: fasting plasma glucose (FPG) ≥ 92 mg/dL, 1-h plasma glucose ≥ 180 mg/dL, or 2-hour plasma glucose ≥ 153 mg/dL. Additionally, overt diabetes in pregnancy was diagnosed if any of the following criteria were met: FPG ≥ 126 mg/dL, glycated hemoglobin (HbA1c) ≥ 6.5%, or random plasma glucose ≥ 200 mg/dL, confirmed on a subsequent occasion.
2.5 Definition of metabolic syndrome
MetS was diagnosed according to the harmonized criteria proposed by the Joint Interim Statement (22). Participants were classified as having MetS if they met at least three of the following five criteria: waist circumference (WC) > 89.5 cm (women), triglycerides ≥ 150 mg/dL, HDL cholesterol < 50 mg/dL (women), blood pressure ≥ 130/85 mmHg, and FPG ≥ 100 mg/dL.
For the present study, WC thresholds were based on specific cut-off values previously established for the Spanish population (23). WC was not considered a mandatory criterion for the diagnosis of MetS.
2.6 Anthropometric parameters
Anthropometric variables were assessed using standardized procedures in accordance with the international guidelines established by the World Health Organization (WHO) (24). Body weight was measured in the morning after a 12-hour overnight fast, following evacuation, using a calibrated digital clinical scale (capacity: 0–150 kg). Participants were barefoot and wore light clothing during measurement. Stature was measured to the nearest millimeter using a wall-mounted stadiometer (Seca 220®, Seca GmbH & Co. KG, Hamburg, Germany) with a measuring range of 80–200 cm. Body mass index (BMI) was calculated using the standard formula: weight (kg) divided by height squared (m2). WC was measured in centimeters with a non-elastic anthropometric tape, following the International Society for the Advancement of Kinanthropometry (ISAK) guidelines (25). WC was measured at the narrowest point of the torso when identifiable; otherwise, the measurement was taken midway between the lower margin of the last palpable rib and the top of the iliac crest. The waist-to-height ratio (WHtR) was subsequently calculated as WC (cm) divided by height (cm), and a WHtR ≥ 0.5 was considered indicative of increased cardiometabolic risk (26, 27).
2.7 Body composition
Body composition was assessed using a multifrequency medical body composition analyzer (mBCA 515®, Seca GmbH & Co. KG, Hamburg, Germany), which operates with eight electrodes: two pairs in contact with the hands and two pairs with the feet. The procedure followed the recommendations of the European Society for Clinical Nutrition and Metabolism (28, 29).
To minimize variability and ensure measurement reliability, the following standardized conditions were maintained prior to analysis: participants remained in a relaxed state, standing upright with bare feet and minimal clothing, limbs abducted at approximately 45°, and free from metallic accessories (e.g., earrings, necklaces, bracelets). Measurements were conducted in a thermoneutral environment, following a fasting period of at least 2 h and abstention from alcohol, coffee, caffeinated beverages, and chocolate for 24 h. Women were encouraged to avoid strenuous physical activity during the previous 24 h.
Bioelectrical impedance (BIA) was measured using a 100 μA current across a frequency range of 1–1,000 kHz. Raw values for resistance (R), reactance (Xc), and phase angle (PhA) were obtained at a frequency of 50 kHz. Impedance measurements at 5 and 50 kHz were used to develop the predictive equations (30). The PhA/BMI ratio was also calculated.
Body composition assessment submitted several key parameters. Total body water (TBW) and extracellular water (ECW) were quantified in liters, and their relative distribution was expressed as the ECW/TBW ratio (%). Fat mass (FM) was assessed in both absolute terms (kg) and as a percentage of total body weight (%). Fat-free mass (FFM) was measured in kilograms. Visceral adipose tissue was also estimated and reported in liters. To normalize for body size, FM and FFM indices were calculated by dividing each value by height squared (kg/m2) (31). Additionally, the FM to FFM ratio (FM/FFM) was determined to provide a further indicator of body composition balance (32).
Skeletal muscle mass (SMM) was estimated using the Janssen equation (33), and appendicular skeletal muscle mass (ASM) was calculated using the Sergi formula (34). Both were normalized by height squared to obtain the skeletal muscle mass index (SMMI) and the appendicular skeletal muscle mass index (ASMI), respectively (35). Relative SMM was also expressed as a percentage of total body weight (SMM/weight × 100) (33), and an additional index was calculated as SMM adjusted for BMI (SMM/BMI) (36).
2.8 Assessment of grip strength
Hand grip strength (HGS) was evaluated using a digital dynamometer (Jamar Plus Digital®, Performance Health International Ltd., Nottinghamshire, UK), a device with demonstrated high reliability and validity for assessing muscular strength (37). Measurements were performed on the dominant hand to assess upper body muscle function. The device features an adjustable handle with five grip positions (ranging from 35 to 87 mm), a digital scale calibrated in kilograms, and an isometric grip force range from 0 to 90 kg.
To ensure accuracy and reproducibility, HGS was assessed following standardized procedures based on established normative data for adults (38). Prior to testing, participants rested for at least 5 min in a seated position. Any jewelry or accessories that could interfere with grip performance were removed. The dynamometer handle was adjusted according to individual hand size to optimize grip alignment.
Participants were seated with the shoulder adducted and in a neutral rotation, the elbow flexed at 90°, and the wrist positioned between 0° and 30° of dorsiflexion and between 0° and 15° of ulnar deviation. The dynamometer was held in the dominant hand, with the handle aligned parallel to the fingers.
Subjects were instructed to exert maximal isometric force by squeezing the handle as hard as possible for 5 s after a verbal order. Three consecutive trials were conducted with 30-s rest intervals between attempts. The highest of three measurements was recorded as the final HGS value. In addition, the hand grip strength to body mass index ratio (HGS/BMI) was calculated to normalize strength relative to body size (39).
2.9 Dietary assessment
Adherence to the Mediterranean dietary pattern was evaluated using the Mediterranean Diet Adherence Screener (MEDAS) at two different time points. During pregnancy, a modified version of the MEDAS was performed (40). This version excluded items related to alcohol and fruit juice consumption, since these are not recommended during gestation. The adapted questionnaire consisted of 12 items, with a total score ranging from 0 to 12 points. Higher scores denoted greater adherence to the Mediterranean dietary pattern.
Assessment at the 6-year follow-up was conducted using the established 14-item MEDAS version (41). This validated tool assesses adherence based on the consumption of foods which are characteristic of the Mediterranean diet. These include beneficial components, such as vegetables, fruits, legumes, nuts, whole grains, fish, and olive oil, as well as items evaluating the intake of less recommended foods, such as red and processed meats, sugar-sweetened beverages, and commercial pastries. Each item is scored dichotomously (0 or 1) based on predefined consumption thresholds, resulting in a total score ranging from 0 to 14 points in the standard version. A score of 9 or higher was considered indicative of high adherence to the Mediterranean dietary pattern.
2.10 Physical activity
Physical activity was measured by the short version of the International Physical Activity Questionnaire (IPAQ) (42). This questionnaire consists of seven questions that explore physical activity patterns over the previous seven days and is divided into two main sections. The first section collects information on the type, frequency, and duration of activities performed in four areas: occupational, domestic, transportation, and leisure-time activities. Responses are recorded in terms of frequency (days per week) and duration (minutes per day). The second section assesses sedentary behavior by asking women to report the amount of time spent sitting on a typical weekday (hours per day). Once the questionnaire is completed, a total physical activity score is calculated, integrating the duration and frequency of reported activities, presenting both quantitative and qualitative information. The quantitative outcome is expressed as total energy metabolism equivalents (MET-minutes/week), whereas qualitative classification categorizes the physical activity as low, moderate, or high intensity.
For quantitative estimation, standardized MET values are applied to each activity category: 8 METs for vigorous activity, 4 METs for moderate activity, and 3.3 METs for walking. The total MET-minutes per week was calculated using the following formula:
2.11 Biochemical parameters
Blood samples were collected in the morning (between 08:00 and 09:00 h) following an overnight fast. Trained personnel at the Extraction Unit of Hospital Clínico San Carlos performed the venipuncture. Fasting blood samples were extracted into vacuum tubes and subsequently centrifuged at 1500×g for 10 min to obtain serum for biochemical analyses. Biochemical parameters were analyzed using standardized protocols specific to each assay. All determinations were performed by highly trained personnel from the Clinical Analysis Service, ensuring methodological accuracy and analytical reliability.
FPG was measured using the glucose oxidase method. Serum insulin concentrations were determined by chemiluminescent immunoassay on an IMMULITE 2000 Xpi system (Siemens Healthcare Diagnostics Inc., Tarrytown, NY, USA), with inter-assay coefficients of variation (CVs) of 6.3% at 11 μIU/mL and 5.91% at 21 μIU/mL. Insulin resistance was estimated using the homeostatic model assessment (HOMA) calculated as:
FPG and glycated hemoglobin (HbA1c) were standardized according to the International Federation of Clinical Chemistry and Laboratory Medicine (IFCC) using ion-exchange high-performance liquid chromatography (HPLC) with gradient elution on a Tosoh G8 analyzer (Tosoh Corporation, Minato-ku, Tokyo, Japan). Inter-assay imprecision for HbA1c at a concentration of 5.1% showed a standard deviation (SD) of 0.06 and a CV of 1.23%. At a concentration of 10.39%, the SD was 0.11 and the CV was 1.04%.
Total cholesterol was measured using the enzymatic colorimetric cholesterol oxidase-phenol aminophenazone (CHOD-PAP) method. Serum high-density lipoprotein cholesterol (HDL) concentration was determined by enzymatic immunoinhibition on an Olympus AU5800 analyzer (Beckman Coulter, Brea, CA, USA). Low-density lipoprotein cholesterol (LDL) was estimated using the Friedewald equation. Serum triglycerides were determined using a colorimetric enzymatic method based on glycerol phosphate oxidase-phenol aminophenazone (GPO-PAP).
Apolipoprotein B and high-sensitivity C-reactive protein (hsCRP) concentrations were measured using the Dimension Vista system (Siemens Healthcare Diagnostics, Munich, Germany), employing immunonephelometry and nephelometry, respectively.
Serum levels of aspartate aminotransferase (AST), alanine aminotransferase (ALT), gamma-glutamyl transferase (GGT), and alkaline phosphatase were measured using direct kinetic methods on an Olympus AU5800 analyzer (Beckman Coulter, Inc., Brea, CA, USA). Thyroid-stimulating hormone (TSH) levels were measured using a third-generation sandwich chemiluminescent immunoassay with magnetic particles and human TSH mouse monoclonal antibodies on a DXI-800® analyzer (Beckman Coulter, Inc., Brea, CA, USA). Free thyroxine (FT4) levels were determined using a two-step competitive chemiluminescent immunoassay with paramagnetic particles on the same analyzer.
All analytical procedures were subject to monthly external quality control through the Spanish Society of Clinical Chemistry (SEQC).
2.12 Statistical analysis
Continuous variables were expressed as mean and SD, whereas categorical variables were presented as absolute frequencies and percentages. Outliers were defined as values exceeding ±3 SD from the mean. The distribution of continuous variables was assessed using the Kolmogorov–Smirnov test, and homogeneity of variances was evaluated with Levene’s test. Depending on data distribution, comparisons between groups were conducted using either parametric tests (Student’s t-test) or non-parametric tests (Mann–Whitney U test). Categorical variables were analyzed using the chi-squared (χ2) test.
Odds ratios (ORs) with 95% confidence intervals (CIs) were calculated to evaluate the association between previous GDM diagnosis and the MetS risk at 6 years postpartum.
The receiver operating characteristic (ROC) curve and corresponding area under the curve (AUC) were used to determine the discriminatory capacity of body composition parameters in identifying MetS. AUC values ≥ 0.90 were classified as indicating excellent discrimination; values between 0.80 and 0.89 were considered very good discrimination; 0.70–0.79 reflected good discrimination; 0.60–0.69 indicated fair discrimination; and 0.50–0.59 were interpreted as poor discrimination. An AUC of 0.50 denotes no discriminative ability, equivalent to random classification. When a result fell below the line of no-discrimination, the method’s predictions were mirrored moving the result above the diagonal line. These values were identified with a prime symbol (‘). In such cases, values above the cut-off point indicated a lower risk of MetS. The Youden Index was applied to establish optimal cut-off points, maximizing both sensitivity and specificity. To assess the adequacy of the sample size, it has been performed a post-hoc power analysis based on two-tailed Z test for two independent proportions based on the observed prevalence of MetS in GDM and NGT groups.
All statistical tests were two-tailed, and a p-value < 0.05 was considered statistically significant. Analyses were performed using the Statistical Package for the Social Sciences (SPSS), version 25.0 for Windows (IBM Corp., Armonk, NY, USA) and the post-hoc statistical power analyses in G*Power Program version 3.1.9.7 for Windows (Düsseldorf University, Düsseldorf, Germany).
3 Results
Baseline results at 12th GW according to the diagnosis of GDM are shown in Table 1. A total of 604 women were selected from the 2,529 participants in the St. Carlos Cohort based on the availability of body composition data and the absence of subsequent pregnancies after a the 6-year postpartum follow-up. Among these women, 20.5% developed GDM during pregnancy. Advanced maternal age, higher prepregnancy weight and elevated BMI determined the development of GDM throughout their pregnancy. Specifically, an elevated prepregnancy BMI (≥25 kg/m2) raised the risk of developing GDM (OR = 1.784 [1.316–2.420]). An excess weight at the beginning of pregnancy was associated with a lower weight gain in women who later developed GDM. Additionally, individual constituents of MetS such as SBP or fasting blood glucose were also higher in women who developed GDM during pregnancy, although mean values for both parameters remained within normal range.
Table 1
| NGT (n = 480) | GDM (n = 124) | P-value | |||
|---|---|---|---|---|---|
| Age | (years) | 34.17 ± 4.95 | 35.4 ± 5.04 | 0.014 | |
| Prepregnancy body weight | (kg) | 60.57 ± 9.84 | 63.54 ± 12.54 | 0.015 | |
| Prepregnancy BMI | (kg/m2) | 22.99 ± 3.49 | 24.36 ± 4.42 | 0.002 | |
| Prepregnancy BMI ≥ 25 kg/m2 | (%) | 109 (22.9) | 42 (33.9) | 0.012 | |
| Weight gain at | 24–28 GW | (kg) | 7.11 ± 3.98 | 6.81 ± 4.12 | 0.466 |
| 36–38 GW | (kg) | 12.32 ± 5.45 | 8.92 ± 6.1 | 0.001 | |
| Systolic blood pressure | (mmHg) | 107.94 ± 10.9 | 111.44 ± 10.09 | 0.002 | |
| Diastolic blood pressure | (mmHg) | 66.65 ± 8.72 | 67.22 ± 8.02 | 0.536 | |
| Fasting blood glucose | (mg/dL) | 80.24 ± 6.02 | 82.41 ± 5.35 | 0.001 | |
| HbA1c | (%) | 5.12 ± 0.22 | 5.27 ± 0.11 | 0.084 | |
| Family history | DM | n (%) | 18 (3.8) | 9 (7.1) | 0.557 |
| MetS | n (%) | 116 (24.3) | 27 (21.3) | ||
| Gestational history | None | n (%) | 262 (54.8) | 64 (50.4) | 0.001 |
| GDM | n (%) | 19 (4) | 5 (3.9) | ||
| Miscarriage | n (%) | 175 (36.6) | 46 (36.2) | ||
| Hypertension | n (%) | 7 (1.5) | 1 (0.8) | ||
| Primiparous | (%) | 127 (31.7) | 32 (29.9) | 0.727 | |
| Smoker | Never | (%) | 292 (88.8) | 78 (94) | 0.160 |
| Ethnicity | Caucasian | (%) | 309 (64.4) | 79 (63.7) | 0.855 |
| Latin American | (%) | 163 (34) | 42 (33.9) | ||
| Others | (%) | 8 (1.7) | 3 (2.4) | ||
| MEDAS score | 12 GW | (score) | 5.00 ± 1.80 | 5.17 ± 1.73 | 0.349 |
| 24 GW | (score) | 5.60 ± 1.89 | 5.77 ± 1.78 | 0.418 |
Baseline characteristics at 12th GW stratified by gestational diabetes mellitus diagnosis (Mean ± SD).
NTG, Normal Glucose Tolerance; DM, Diabetes Mellitus; MetS, Metabolic Syndrome; GDM, Gestational Diabetes Mellitus; GW, gestational weeks; BMI, body mass index.
Dietary patterns during pregnancy were comparable between groups and did not influence the development of GDM. Similarly, no significant dietary differences were observed between groups at 6 years postpartum (Supplementary Table 1). Overall, adherence to the Mediterranean diet remained low throughout the study period. Regarding physical activity, no significant differences were found between groups 6 years postpartum (Supplementary Table 1). Although women with prior GDM reported slightly lower weekly light-intensity physical activity, total physical activity levels, expressed as MET-min/week, were comparable between groups.
Tables 2, 3 and Figure 3 summarize the assessment of MetS, anthropometric and body composition variables and MetS risk at 6 years postpartum according to previous GDM diagnosis.
Table 2
| NGT (n = 480) | GDM (n = 124) | P-value | ||
|---|---|---|---|---|
| MetS | n (%) | 70 (14.6) | 33 (26.6) | 0.001 |
| 0 Criteria | n (%) | 172 (35.8) | 32 (25.8) | 0.002 |
| 1 Criterion | n (%) | 165 (34.4) | 36 (29.0) | |
| 2 Criteria | n (%) | 73 (15.2) | 23 (18.5) | |
| 3 Criteria | n (%) | 43 (9.0) | 16 (12.9) | |
| 4 Criteria | n (%) | 21 (4.4) | 9 (7.3) | |
| 5 Criteria | n (%) | 6 (1.3) | 8 (6.5) | |
| MetS criteria | ||||
| Elevated WC | n (%) | 69 (14.4) | 26 (21) | 0.072 |
| Waist circumference | (cm) | 78.46 ± 9.76 | 81.01 ± 11.24 | 0.012 |
| Elevated triglycerides | n (%) | 23 (4.8) | 16 (12.9) | 0.001 |
| Triglycerides | (mg/dL) | 77.47 ± 37.03 | 95.76 ± 56.49 | 0.001 |
| Reduced HDL | n (%) | 71 (14.8) | 21 (16.9) | 0.554 |
| HDL cholesterol | (mg/dL) | 62.24 ± 12.17 | 61.42 ± 11.7 | 0.501 |
| Elevated blood pressure | n (%) | 68 (14.8) | 33 (27) | 0.002 |
| Systolic blood pressure | (mmHg) | 107.25 ± 12.41 | 108.65 ± 12.00 | 0.261 |
| SBP ≥ 130 mmHg | n (%) | 28 (5.8) | 5 (4) | 0.431 |
| Diastolic blood pressure | (mmHg) | 77.48 ± 8.49 | 79.01 ± 9.27 | 0.081 |
| DBP ≥ 85 mmHg | n (%) | 84 (17.5) | 32 (25.8) | 0.036 |
| Elevated FPG | n (%) | 63 (13.1) | 40 (32.3) | 0.001 |
| Glucose | (mg/dL) | 91.45 ± 6.69 | 96.98 ± 8.94 | 0.001 |
Metabolic syndrome at 6 years postpartum stratified by prior GDM diagnosis (Mean ± SD).
NTG, Normal Glucose Tolerance; GDM, Gestational Diabetes Mellitus; WC, waist circumference.
Table 3
| NGT (n = 480) | GDM (n = 124) | P-value | ||
|---|---|---|---|---|
| Age | (years) | 40.13 ± 5.19 | 41.98 ± 4.86 | 0.003 |
| Weight | (kg) | 64.82 ± 11.45 | 66.72 ± 12.31 | 0.105 |
| WHtR | 0.48 ± 0.07 | 0.50 ± 0.08 | 0.006 | |
| WHtR risk | n (%) | 174 (36.3) | 51 (41.1) | 0.324 |
| FM | (kg) | 23.39 ± 8.25 | 24.66 ± 8.52 | 0.131 |
| (%) | 35.12 ± 6.91 | 36.02 ± 6.67 | 0.193 | |
| FMI | (kg/m2) | 8.9 ± 3.17 | 9.49 ± 3.38 | 0.070 |
| Visceral fat | (L) | 1.13 ± 0.67 | 1.25 ± 0.71 | 0.075 |
| FFM | (kg) | 41.39 ± 4.38 | 42.03 ± 4.79 | 0.158 |
| FFM index | (kg/m2) | 15.92 ± 1.45 | 16.24 ± 1.76 | 0.069 |
| FM/FFM | 0.56 ± 0.17 | 0.58 ± 0.17 | 0.234 | |
| SMM | (kg) | 17.99 ± 2.04 | 18.16 ± 2.44 | 0.439 |
| SMMI | (kg/m2) | 6.83 ± 0.68 | 6.96 ± 0.82 | 0.057 |
| SMM/weight | (%) | 28.26 ± 3.77 | 27.66 ± 3.13 | 0.117 |
| ASM | (kg) | 14.93 ± 1.82 | 15.24 ± 2.04 | 0.099 |
| ASMI | (kg/m2) | 5.67 ± 0.63 | 5.85 ± 0.74 | 0.013 |
| ASM/BMI | 0.61 ± 0.07 | 0.6 ± 0.07 | 0.103 | |
| TBW | (L) | 30.81 ± 3.39 | 31.22 ± 3.86 | 0.239 |
| (%) | 47.92 ± 4.88 | 47.35 ± 4.6 | 0.245 | |
| ECW | (L) | 13.56 ± 1.53 | 13.74 ± 1.67 | 0.323 |
| ECW/TBW | 0.45 ± 0.02 | 0.45 ± 0.03 | 0.223 | |
| Phase angle | (°) | 5.04 ± 0.48 | 5.12 ± 0.51 | 0.087 |
| PhA/BMI | 0.21 ± 0.03 | 0.20 ± 0.03 | 0.202 | |
| Resistance | (ohm) | 679.54 ± 72.75 | 662.87 ± 81.01 | 0.027 |
| Reactance | (ohm) | 59.67 ± 7.08 | 59.69 ± 7.48 | 0.973 |
| HGS | (kg) | 28.13 ± 4.76 | 27.34 ± 4.69 | 0.102 |
| HGS/BMI | 1.16 ± 0.26 | 1.09 ± 0.26 | 0.008 |
Anthropometric and body composition parameters at 6 years postpartum stratified by prior gestational diabetes mellitus diagnosis (Mean ± SD).
NTG, Normal Glucose Tolerance; GDM, Gestational Diabetes mellitus; FM, Fat Mass; FFM, Fat Free Mass; WHtR, waist-to-height ratio; SMM, Skeletal muscle mass; SMMI, Skeletal muscle mass index; SMI, Skeletal muscle index; ASM, Appendicular skeletal muscle mass; ASMI, Appendicular skeletal muscle mass index; TBW, Total Body Water; ECW, extracellular water; TBW, total body water; HGS, Handgrip strength.
Figure 3
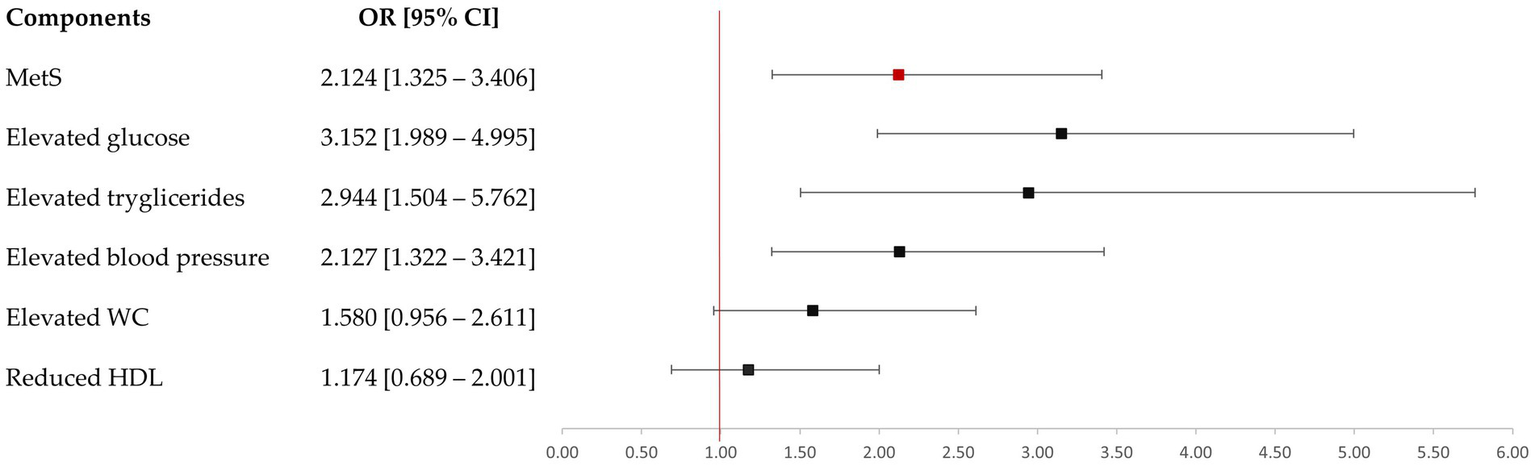
Risk of metabolic syndrome at six years postpartum by prior GDM.
At 6 years postpartum, 26.6% of women who had developed GDM during pregnancy were diagnosed with MetS (Table 2). Notably, these women had a 2-fold increased risk of developing MetS over these years compared to their normoglycemic counterparts (Figure 3). They also presented a higher frequency of ≥3 MetS diagnostic criteria (p = 0.001). However, 14.6% women exhibiting normal glucose tolerance (NGT) also developed MetS during the follow-up period. The post-hoc power to detect the difference between GDM and NGT was 85.7% (p < 0.05).
Among the biochemical components for the diagnosis of MetS, elevated triglycerides and FPG levels were significantly influenced by the prior GDM diagnosis, whereas low HDL cholesterol concentration was not. These two elevated diagnostic criteria showed an increased risk over the 6 years postpartum in women with previous GDM diagnosis. Notably, several parameters related to glucose metabolism and lipid profile were affected by a prior diagnosis of GDM. However, mean values for these parameters remained within normal reference ranges for all the study population. Furthermore, safety parameters were comparable across all participants, with none exceeding established clinical normal ranges (Supplementary Table 2). Additionally, the hypertension risk was also increased in these women, with DBP appearing to be more conditioned by this diabetogenic condition.
Conversely, although the prior GDM diagnosis during pregnancy entailed a greater WC compared to NGT women, there were no significant differences when a risk circumference was evaluated (> 89.5 cm). Indeed, the presence of GDM did not significantly affect the risk of meeting this anthropometric criterion for MetS diagnosis over time. Similarly, body weight at 6 years postpartum was comparable between women who were previously diagnosed with GDM versus those who were not (Table 3). Moreover, a history of GDM was not significantly associated with the presence of an elevated body mass index (BMI ≥ 25 kg/m2; OR = 1.254 [0.689–2.001]) or with an elevated WHtR risk (OR = 1.225 [0.818–1.833]) over time. On the other hand, body composition at 6 years postpartum was poorly affected by previous GDM diagnosis during pregnancy (Table 4). FM, visceral fat or FFM were similar between women with prior GDM diagnosis or without. SMMI and ASMI were higher in women who had developed GDM. Among the raw data parameters, only resistance was significantly affected by prior GDM diagnosis, presenting lower values. Nevertheless, these differences were no longer evident when body composition was assessed after stratification by previous GDM diagnosis and MetS diagnosis (Supplementary Table 3). However, body composition was significantly different when it was only assessed depending on the presence or absence of MetS at 6 years postpartum (Table 4).
Table 4
| No MetS (n = 501) | MetS (n = 103) | p-value | ||
|---|---|---|---|---|
| Age | (years) | 39.90 ± 5.29 | 42.28 ± 4.76 | 0.001 |
| Weight | (kg) | 62.38 ± 9.57 | 78.91 ± 11.14 | 0.001 |
| WHtR | 0.47 ± 0.05 | 0.58 ± 0.06 | 0.001 | |
| WHtR risk | n (%) | 134 (26.5) | 92 (90.2) | 0.001 |
| FM | (kg) | 21.53 ± 6.66 | 33.97 ± 7.85 | 0.001 |
| (%) | 33.84 ± 6.19 | 42.51 ± 5.31 | 0.001 | |
| FMI | (kg/m2) | 8.18 ± 2.54 | 13.16 ± 3.04 | 0.001 |
| Visceral fat | (L) | 1.00 ± 0.55 | 1.97 ± 0.69 | 0.001 |
| FFM | (kg) | 40.92 ± 4.26 | 44.52 ± 4.32 | 0.001 |
| FFMI | (kg/m2) | 15.68 ± 1.31 | 17.52 ± 1.58 | 0.001 |
| FM/FFM | 0.52 ± 0.14 | 0.76 ± 0.15 | 0.001 | |
| SMM | (kg) | 17.80 ± 2.04 | 19.13 ± 2.22 | 0.001 |
| SMMI | (kg/m2) | 6.74 ± 0.63 | 7.39 ± 0.82 | 0.001 |
| SMM/weight | (%) | 28.90 ± 3.51 | 24.38 ± 2.35 | 0.001 |
| ASM | (kg) | 14.62 ± 1.63 | 16.82 ± 1.9 | 0.001 |
| ASMI | (kg/m2) | 5.54 ± 0.52 | 6.5 ± 0.68 | 0.001 |
| ASM/BMI | 0.62 ± 0.07 | 0.54 ± 0.06 | 0.001 | |
| TBW | (L) | 30.41 ± 3.34 | 33.31 ± 3.22 | 0.001 |
| (%) | 48.85 ± 4.35 | 42.72 ± 3.66 | 0.001 | |
| ECW | (L) | 13.45 ± 1.5 | 14.76 ± 1.28 | 0.001 |
| ECW/TBW | 0.45 ± 0.02 | 0.45 ± 0.02 | 0.895 | |
| Phase angle | (°) | 5.00 ± 0.47 | 5.29 ± 0.53 | 0.001 |
| PhA/BMI | 0.21 ± 0.03 | 0.17 ± 0.03 | 0.001 | |
| Resistance | (ohm) | 687.68 ± 70.16 | 620.23 ± 71.25 | 0.001 |
| Reactance | (ohm) | 60.15 ± 7.1 | 57.37 ± 6.99 | 0.001 |
| HGS | (kg) | 27.99 ± 4.79 | 27.6 ± 4.8 | 0.457 |
| HGS/BMI | 1.19 ± 0.25 | 0.90 ± 0.20 | 0.001 |
Anthropometric and body composition parameters stratified by Metabolic Syndrome at 6 years Postpartum (Mean ± SD).
MetS, Metabolic Syndrome; FM, Fat Mass; FFM, Fat Free Mass; WHtR, waist-to-height ratio; SMM, Skeletal muscle mass; SMMI, Skeletal muscle mass index; SMI, Skeletal muscle index; ASM, Appendicular skeletal muscle mass; ASMI, Appendicular skeletal muscle mass index; TBW, Total Body Water; ECW, extracellular water; TBW, total body water; HGS, Handgrip strength.
In this context, women with MetS exhibited significantly greater adiposity in both absolute (FM, visceral fat) and relative terms (FMI, FM/FFM). Although these women also had higher absolute muscle mass (SMM, ASM) their muscle mass relative to body size (SMM/weight, ASM/BMI ratio) was significantly lower compared to those with no MetS at 6 years postpartum. Notably, TBW and ECW were also higher in women with MetS diagnosis, however, the proportion of total water relative to weight (TBW, %) was lower, evidencing a higher relative FM. Notably, the ECW/TBW ratio did not differ significantly between groups (p = 0.895), further supporting the notion of increased adiposity rather than altered fluid distribution.
This excess adiposity was also associated with significantly lower values of resistance and reactance in women with MetS. Whereas PhA, a marker of cellular integrity and function, was higher in women with MetS, it was significantly lower when adjusted for BMI (PhA/BMI), suggesting inadequate cellular health relative to body mass. A similar pattern occurs when muscular strength was observed, although absolute HGS was comparable between groups, functional strength relative to body weight (HGS/BMI) was substantially lower in women with MetS at 6 years postpartum.
When diagnostic performance was evaluated, variables that demonstrated the highest diagnostic capacity for MetS-with AUC values ≥ 0.85 (very good discrimination)-were FM (kg, %), visceral fat, FM/FFM ratio, and ASM. In contrast, SMM/weight’ and TBW’ (%) exhibited strong discriminatory power for discarding MetS (Table 5).
Table 5
| AUC [95% CI] | Youden index | Cut-off | Sensitivity (%) | Specificity (%) | PPV (%) | NPV (%) | ||
|---|---|---|---|---|---|---|---|---|
| FM | (kg) | 0.89 [0.85–0.92] | 0.602 | 26.43 | 81 | 80 | 45 | 95 |
| (%) | 0.86 [0.82–0.90] | 0.575 | 37.15 | 89 | 69 | 38 | 97 | |
| FMI | (kg/m2) | 0.90 [0.87–0.93] | 0.650 | 9.53 | 91 | 74 | 42 | 98 |
| Visceral fat | (L) | 0.86 [0.82–0.90] | 0.582 | 1.45 | 80 | 78 | 41 | 95 |
| FFM | (kg) | 0.73 [0.68–0.78] | 0.364 | 40.91 | 82 | 54 | 27 | 94 |
| FFM intex | (kg/m2) | 0.83 [0.79–0.87] | 0.519 | 16.89 | 70 | 83 | 46 | 93 |
| FM/FFM ratio | 0.87 [0.83–0.90] | 0.581 | 0.593 | 88 | 70 | 37 | 97 | |
| SMM | (kg) | 0.68 [0.62–0.73] | 0.277 | 18.01 | 71 | 57 | 26 | 90 |
| SMMI | (kg/m2) | 0.73 [0.67–0.78] | 0.347 | 7.25 | 52 | 82 | 36 | 89 |
| SMM/weight | (%) | 0.87 [0.83–0.90] | 0.593 | 27.01 | 71 | 89 | 39 | 96 |
| ASM | (kg) | 0.82 [0.77–0.86] | 0.492 | 15.78 | 70 | 80 | 42 | 93 |
| ASMI | (kg/m2) | 0.88 [0.84–0.91] | 0.634 | 5.97 | 82 | 82 | 49 | 96 |
| ASM/BMI | 0.78 [0.74–0.83] | 0.445 | 0.603 | 87 | 58 | 30 | 95 | |
| Total body water | (L) | 0.74 [0.69–0.79] | 0.381 | 30.75 | 81 | 57 | 28 | 94 |
| Total body water | (%) | 0.86 [0.82–0.90] | 0.566 | 44.95 | 75 | 82 | 47 | 94 |
| Extracellular water | (L) | 0.76 [0.70–0.82] | 0.480 | 13.85 | 80 | 68 | 30 | 95 |
| Phase angle | (°) | 0.67 [0.61–0.73] | 0.292 | 5.05 | 74 | 56 | 9 | 74 |
| PhA/BMI | 0.85 [0.81–0.89] | 0.585 | 0.184 | 83 | 75 | 6 | 52 | |
| Resistance | (ohm) | 0.75 [0.70–0.80] | 0.388 | 643.65 | 66 | 74 | 35 | 91 |
| Reactance | (ohm) | 0.62 [0.56–0.68] | 0.219 | 58.25 | 61 | 61 | 25 | 88 |
Diagnostic performance of body composition parameters to discriminate metabolic syndrome.
FM, fat mass; FFM, Fat Free Mass; SMM, Skeletal muscle mass; SMMI, Skeletal muscle mass index; ASM, Appendicular skeletal muscle mass; ASMI, Appendicular skeletal muscle mass index; Model vs. no MetS (values above the cut-off point indicate reduced risk of MetS).
Although the models demonstrated good sensitivity and specificity, the relatively low prevalence of MetS in the cohort (17%) limited the positive predictive value (PPV), which ranged from 25 to 49%. In contrast, negative predictive values (NPV) were consistently high (≥90%) in almost all body composition parameters. Therefore, these diagnostic tests were particularly useful for excluding the presence of MetS in women at 6 years postpartum.
Moreover, these findings underscore the strong relationship between body composition and MetS. The variables that showed the greatest differences between women with and without MetS were also the most effective as screening tools, indicating a robust internal consistency between diagnostic capacity and group differences in body composition.
4 Discussion
The results of this study confirm GDM as an important risk factor for MetS; however, it also highlights that it does not equally impact over the distinct diagnostic criteria. Specifically, elevated WC did not represent a MetS risk factor in these women. In contrast, body composition, specifically, high fat mass and low muscle content and function, showed a strong association with the presence of MetS. Therefore, the findings of this study show that assessment of body composition, particularly adiposity, emerges as an important complementary tool to anthropometric parameters in the detection of MetS in postpartum women.
GDM represents one of the most prevalent metabolic complications during pregnancy, and it is associated with multiple maternal and perinatal risk factors (43, 44). Consistent with the literature (45), in the present study, advanced maternal age was higher in women who were later diagnosed with GDM. Likewise, pregestational body weight and BMI were significantly higher, with a higher proportion of GDM women with BMI ≥ 25 kg/m2. This association reinforces the evidence that a high pregestational body mass is determinant in the pathogenesis of GDM (44, 46). In this regard, some authors have shown that a high prepregnancy BMI represents an even stronger risk factor than advanced maternal age for the development of GDM (47). Weight gain towards the end of the pregnancy was lower in women with GDM, which was expected due to the tight monitoring of weight in women with prepregnancy overweight, highly prevalent in these women. Therefore, from the beginning of pregnancy, excess weight determines metabolic changes.
After 6 years postpartum, data indicate a significantly higher prevalence of MetS among women with a prior diagnosis of GDM. These women exhibited a two-fold increased risk of developing MetS, although this risk estimate is somewhat lower than that reported in a recent meta-analysis, which found a three-fold increase (48). This finding reinforces the evidence that GDM is a strong predictor of future metabolic dysfunction (48–51). Nonetheless, the findings of the present study indicate that the association is not uniform across the different diagnostic criteria for MetS. In women with prior diagnosis of GDM, an increased WC did not emerge as an independent risk factor for MetS and exhibited values comparable to those of normoglycemic counterparts. This is particularly relevant because, although there is no mandatory criterion for the diagnosis of MetS, WC measurement is still recommended as a preliminary screening tool (22). Other anthropometric parameters linked to cardiometabolic risk, as elevated BMI and WHtR, or even body weight, were likewise unaffected by prior diagnosis of GDM. This suggests that the evaluation of body composition may provide a more accurate assessment of MetS risk relative to conventional anthropometric parameters, despite the discriminatory capability of central adiposity measures in detecting cardiometabolic risk (52–54). In this context, an expanding amount of evidence indicates that a precise characterization of the body distribution, rather than isolated anthropometric parameters, is essential to better understand and assess of health status (55–58).
At 6 years postpartum, body composition parameters did not differ significantly between women with a history of GDM and those without. This finding suggests that pregnancy itself-particularly when accompanied by greater gestational weight gain and continued weight gain over time, as observed among women who did not develop GDM-may induce hormonal, inflammatory, and/or metabolic alterations that persist long-term (59–61). This could explain the convergence in body composition parameters in these women over time, irrespective of GDM diagnosis during pregnancy. In contrast, when stratified by the presence of MetS, notable differences were observed. Consistent with findings from previous studies (62, 63), women who met the diagnostic criteria for MetS at 6 years postpartum exhibited significantly less favorable body composition parameters compared to those without MetS. This condition was marked by increased adiposity, both in absolute terms (FM and visceral fat)-the latter approximately twice in individuals with MetS-and in adjusted measures (FMI and FM/FFM). These findings were supported by a lower hydration status relative to body weight (TBW, %), suggesting a higher adipose tissue proportion. Absolute estimators of muscle mass such as SMM and ASM, also including FFM, were higher in women with MetS, likely as consequence of greater overall body weight. These findings are in line with previous reports that have documented similar associations between increased muscle mass parameters and MetS in female populations (64). However, several studies have indicated that muscle mass parameters adjusted for body size provide more accurate information of cardiometabolic risk (65–68). Consistently, women with MetS exhibited lower SMM/weight and ASM/BMI, as well as reduced functional performance (HGS/BMI) and compromised cellular health (PhA/BMI) when these were normalized for body size. Resistance and reactance were significantly lower in MetS, possibly due to higher FM and a lower cell integrity (69). These body composition alterations suggest a heightened metabolic and functional risk that may not be apparent when relying exclusively on conventional anthropometric parameters (70).
These findings provided a rationale for the development of predictive models to assess the potential usefulness of body composition parameters in the identification of MetS and, for the first time, the establishment of specific cut-off values for their identification. In this context, adipose compartments mainly FM, visceral fat, FMI and FM/FFM, had an excellent diagnostic capacity for MetS (AUC ≥ 85%). FMI and FM (kg) exhibit also an adequate balance between sensitivity and specificity, supporting their potential utility in the development of predictive models or screening algorithms of MetS. The identified cut-off values for the different body composition parameters were also quite similar to those established for other clinical conditions, such as obesity (FM > 39%) (71) or sarcopenia-reduced muscle mass (SMM/Weight < 27.6%) (33), low muscle mass (ASM < 15 kg; ASMI < 5.5 kg/m2) (72)-demonstrating consistency in the data found.
Nevertheless, from a clinical perspective, the low PPV observed reflects a substantial rate of false-positive results following test administration. These findings are consistent with the low prevalence of MetS in the population (17%), a factor that adversely affects PPV, even when test sensitivity and specificity are high (73, 74). In return, the post-test results revealed a high NPV, indicating that, in clinical practice, these diagnostic tests are particularly effective for dismissing the presence of MetS in postpartum women when test results are negative.
The present findings represent a significant step forward in the clinical application of body composition analysis, as they have allowed, for the first time, the definition of specific cut-off values for identifying individuals at risk of MetS. These cut-offs not only enhance the understanding of the pathophysiological link between altered body composition and MetS, but also provide a robust basis for the development of predictive models. Such models may improve the diagnostic accuracy and clinical utility of body composition parameters, highlighting their potential as accessible, non-invasive screening tools for early detection and risk stratification in routine clinical practice. This highlights their utility not only for identifying individuals at risk, but also for reassuring those unlikely to be affected, thus optimizing resource allocation and follow-up strategies in clinical settings.
This study has some limitations that merit consideration. Its cross-sectional design limits the ability to establish causal relationships between body composition indicators and the presence of MetS. Although BIA was used for its accessibility and non-invasive nature, it is less precise than reference methods such as DXA or MRI, particularly in individuals with an altered hydration status or high adiposity. Furthermore, the proposed cut-off points have not been validated in external cohorts, which may limit their generalizability and may restrict their applicability to other populations. Lastly, the influence of potential confounding variables, such as physical activity, dietary patterns, and comorbidities, was not fully addressed, potentially affecting the observed associations.
5 Conclusion
This study confirms GDM as a significant long-term risk factor for MetS in postpartum women. However, the association is not uniform across diagnostic criteria, with WC showing limited discriminative value. In contrast, body composition, particularly increased adiposity and reduced relative muscle mass and function, showed a stronger association with MetS. These results underscore the added clinical value of body composition assessment over conventional anthropometric measures. Additionally, the proposed cut-off values for key parameters demonstrated strong diagnostic performance, especially for fat-related indices. Although positive predictive value was limited by the low MetS prevalence, the high NPV supports its utility in excluding MetS. Overall, body composition analysis emerges as a valuable complementary tool for improving cardiometabolic risk assessment in postpartum care.
Statements
Data availability statement
The datasets presented in this study can be found in online repositories. The names of the repository/repositories and accession number(s) can be found at: https://doi.org/10.5281/zenodo.15586793.
Ethics statement
The studies involving humans were approved by the study was conducted in accordance with the ethical principles outlined in the Declaration of Helsinki. Ethical approval was obtained from the Institutional Review Board and the Clinical Ethics Committee of Hospital Clínico San Carlos (approval codes: CI 13/296-E, 22 July 2013; CI 16/442-E, 8 November 2016; and CI 16/316, 15 July 2016). The studies were conducted in accordance with the local legislation and institutional requirements. The participants provided their written informed consent to participate in this study.
Author contributions
BL-P: Conceptualization, Data curation, Formal analysis, Visualization, Writing – review & editing, Validation, Writing – original draft. AL-S: Conceptualization, Data curation, Visualization, Writing – review & editing. JV: Investigation, Methodology, Writing – review & editing. RO: Investigation, Methodology, Writing – review & editing. LV: Investigation, Writing – review & editing. AMR-L: Writing – review & editing, Investigation, Methodology. AB: Investigation, Methodology, Writing – review & editing. CM: Investigation, Methodology, Writing – review & editing. IJ-V: Investigation, Methodology, Writing – review & editing. MAR-H: Investigation, Methodology, Writing – review & editing. PM-M: Conceptualization, Data curation, Formal analysis, Validation, Visualization, Writing – review & editing. AC-P: Conceptualization, Data curation, Formal analysis, Visualization, Writing – review & editing, Funding acquisition, Methodology, Project administration, Resources, Supervision.
Funding
The author(s) declare that financial support was received for the research and/or publication of this article. This study was supported by grants from the Instituto de Salud Carlos III/MICINN of Spain (grant number PI20/01758), the European Regional Development Fund (FEDER) ‘A way to build Europe’. The study design, data collection, management, analysis, interpretation, manuscript preparation, review, and the decision to submit for publication were conducted independently by the authors, without influence from the funding entities.
Acknowledgments
The authors would like to extend their sincere gratitude to the administrative staff and nursing and dieticians personnel of the Laboratory Department (Marisol Sanchez Orta, María Dolores Hermoso Martín, María Victoria Saez de Parayuelo), the Pregnancy and Diabetes Unit, and all members of the Departments of Endocrinology and Nutrition, and Obstetrics and Gynecology at Hospital Clínico San Carlos, Madrid, Spain, for their invaluable support and collaboration throughout the study.
Conflict of interest
The authors declare that the research was conducted in the absence of any commercial or financial relationships that could be construed as a potential conflict of interest.
Generative AI statement
The authors declare that no Gen AI was used in the creation of this manuscript.
Any alternative text (alt text) provided alongside figures in this article has been generated by Frontiers with the support of artificial intelligence and reasonable efforts have been made to ensure accuracy, including review by the authors wherever possible. If you identify any issues, please contact us.
Publisher’s note
All claims expressed in this article are solely those of the authors and do not necessarily represent those of their affiliated organizations, or those of the publisher, the editors and the reviewers. Any product that may be evaluated in this article, or claim that may be made by its manufacturer, is not guaranteed or endorsed by the publisher.
Supplementary material
The Supplementary material for this article can be found online at: https://www.frontiersin.org/articles/10.3389/fnut.2025.1689658/full#supplementary-material.
References
1.
ElSayed NA McCoy RG Aleppo G Balapattabi K Beverly EA Briggs Early K et al . Diagnosis and classification of diabetes: standards of care in diabetes—2025. Diabetes Care. (2025) 48:S27–49. doi: 10.2337/DC25-S002
2.
World Health Organization . Diagnostic criteria and classification of hyperglycaemia first detected in pregnancy: a world health organization guideline. Diabetes Res Clin Pract. (2014) 103:341–63. doi: 10.1016/j.diabres.2013.10.012
3.
Wang H Li N Chivese T Werfalli M Sun H Yuen L et al . IDF diabetes atlas: estimation of global and regional gestational diabetes mellitus prevalence for 2021 by International Association of Diabetes in pregnancy study group’s criteria. Diabetes Res Clin Pract. (2022) 183:109050. doi: 10.1016/j.diabres.2021.109050
4.
De La Torre NG Assaf-Balut C Varas IJ Del Valle L Durán A Fuentes M et al . Effectiveness of following Mediterranean diet recommendations in the real world in the incidence of gestational diabetes mellitus (GDM) and adverse maternal-foetal outcomes: a prospective, universal, interventional study with a single group. The St Carlos study. Nutrients. (2019) 11:1210. doi: 10.3390/NU11061210
5.
Plows JF Stanley JL Baker PN Reynolds CM Vickers MH . The pathophysiology of gestational diabetes mellitus. Int J Mol Sci. (2018) 19:3342. doi: 10.3390/IJMS19113342
6.
Nguyen B Tselovalnikova T Drees BM . Gestational diabetes mellitus and metabolic syndrome: a review of the associations and recommendations. Endocr Pract. (2024) 30:78–82. doi: 10.1016/J.EPRAC.2023.10.133
7.
Sheiner E . Gestational diabetes mellitus: long-term consequences for the mother and child grand challenge: how to move on towards secondary prevention?Front Clin Diabetes Healthc. (2020) 1:546256. doi: 10.3389/FCDHC.2020.546256
8.
Pathirana MM Lassi ZS Ali A Arstall MA Roberts CT Andraweera PH . Association between metabolic syndrome and gestational diabetes mellitus in women and their children: a systematic review and meta-analysis. Endocrine. (2021) 71:310–20. doi: 10.1007/S12020-020-02492-1
9.
Burlina S Dalfrà MG Chilelli NC Lapolla A . Gestational diabetes mellitus and future cardiovascular risk: an update. Int J Endocrinol. (2016) 2016:1–6. doi: 10.1155/2016/2070926
10.
Lim S Sung HC Young JP Kyong SP Hong KL Jang HC et al . Visceral fatness and insulin sensitivity in women with a previous history of gestational diabetes mellitus. Diabetes Care. (2007) 30:348–53. doi: 10.2337/DC06-1405
11.
Svensson H Wetterling L Andersson-Hall U Jennische E Edén S Holmäng A et al . Adipose tissue and body composition in women six years after gestational diabetes: factors associated with development of type 2 diabetes. Adipocyte. (2018) 7:229–37. doi: 10.1080/21623945.2018.1521230
12.
Meyer D Gjika E Raab R Michel SKF Hauner H . How does gestational weight gain influence short- and long-term postpartum weight retention? An updated systematic review and meta-analysis. Obes Rev. (2024) 25:e13679. doi: 10.1111/OBR.13679
13.
Berezowsky A Berger H . Gestational weight gain and long-term postpartum weight retention. Clin Exp Obstet Gynecol. (2021) 48:466–71. doi: 10.31083/J.CEOG.2021.03.2413/0390-6663-48-3-466.PDF
14.
Kramer CK Ye C Hanley AJ Connelly PW Sermer M Zinman B et al . Postpartum weight retention and the early evolution of cardiovascular risk over the first 5 years after pregnancy. Cardiovasc Diabetol. (2024) 23:1–10. doi: 10.1186/S12933-024-02184-4/FIGURES/1
15.
Després JP . Body fat distribution and risk of cardiovascular disease: an update. Circulation. (2012) 126:1301–13. doi: 10.1161/CIRCULATIONAHA.111.067264
16.
Duran A Śaenz S Torrej́on MJ Bordí UE Del Valle L Galindo M et al . Introduction of IADPSG criteria for the screening and diagnosis of gestational diabetes mellitus results in improved pregnancy outcomes at a lower cost in a large cohort of pregnant women: the St. Carlos gestational diabetes study. Diabetes Care. (2014) 37:2442–50. doi: 10.2337/DC14-0179
17.
Del VL Melero V Bodas A O’Connor RM Ramos-Levi A Barabash A et al . A greater adherence to the Mediterranean diet supplemented with extra virgin olive oil and nuts during pregnancy is associated with improved offspring health at six years of age. Forum Nutr. (2025) 17:1719. doi: 10.3390/NU17101719
18.
WMA Declaration of Helsinki – Ethical principles for medical research involving human participants – WMA – the world medical association . Available online at: https://www.wma.net/policies-post/wma-declaration-of-helsinki/ (Accessed May 26, 2025).
19.
Medicines Agency E . ICH E6 (R3) Guideline on good clinical practice (GCP)_Step 5. Available online at: www.ema.europa.eu/contact (Accessed May 26, 2025).
20.
IADPSGC . National Institutes of Health consensus development conference statement: diagnosing gestational diabetes mellitus, March 4-6, 2013. Obstet Gynecol. (2013) 122:358–69. doi: 10.1097/AOG.0B013E31829C3E64
21.
Metzger BE . International association of diabetes and pregnancy study groups recommendations on the diagnosis and classification of hyperglycemia in pregnancy. Diabetes Care. (2010) 33:676–82. doi: 10.2337/DC09-1848
22.
Alberti KGMM Eckel RH Grundy SM Zimmet PZ Cleeman JI Donato KA et al . Harmonizing the metabolic syndrome: a joint interim statement of the international diabetes federation task force on epidemiology and prevention; national heart, lung, and blood institute; American heart association; world heart federation; international atherosclerosis society; and international association for the study of obesity. Circulation. (2009) 120:1640–5. doi: 10.1161/CIRCULATIONAHA.109.192644
23.
Marcuello C Calle-Pascual AL Fuentes M Runkle I Rubio MA Montañez C et al . Prevalence of the metabolic syndrome in Spain using regional cutoff points for waist circumference: the di@bet.es study. Acta Diabetol. (2013) 50:615–23. doi: 10.1007/S00592-013-0468-8
24.
FAO/UNICEF/WHO . Methodology of nutritional surveillance. Report of a joint FAO/UNICEF/WHO expert committee - PubMed. Available online at: https://pubmed.ncbi.nlm.nih.gov/822593/ (Accessed May 26, 2025).
25.
Norton K Whittingham N Carter L Kerr D Gore CM-JM . Antropometrica. In: NortonKOT, editor. Measurement techniques in anthropometry. Sydney: UNSW (1966). 27–75.
26.
Gibson S Ashwell M . A simple cut-off for waist-to-height ratio (0·5) can act as an indicator for cardiometabolic risk: recent data from adults in the health survey for England. Br J Nutr. (2020) 123:681–90. doi: 10.1017/S0007114519003301
27.
Browning LM Hsieh SD Ashwell M . A systematic review of waist-to-height ratio as a screening tool for the prediction of cardiovascular disease and diabetes: 05 could be a suitable global boundary value. Nutr Res Rev. (2010) 23:247–69. doi: 10.1017/S0954422410000144
28.
Kyle UG Bosaeus I De Lorenzo AD Deurenberg P Elia M Gómez JM et al . Bioelectrical impedance analysis - part I: review of principles and methods. Clin Nutr. (2004) 23:1226–43. doi: 10.1016/j.clnu.2004.06.004
29.
Kyle UG Bosaeus I De Lorenzo AD Deurenberg P Elia M Gómez JM et al . Bioelectrical impedance analysis - part II: utilization in clinical practice. Clin Nutr. (2004) 23:1430–53. doi: 10.1016/j.clnu.2004.09.012
30.
Bosy-Westphal A Schautz B Later W Kehayias JJ Gallagher D Müller MJ . What makes a BIA equation unique? Validity of eight-electrode multifrequency BIA to estimate body composition in a healthy adult population. Eur J Clin Nutr. (2013) 67:S14–21. doi: 10.1038/EJCN.2012.160
31.
VanItallie TB Yang MU Heymsfield SB Funk RC Boileau RA . Height-normalized indices of the body’s fat-free mass and fat mass: potentially useful indicators of nutritional status. Am J Clin Nutr. (1990) 52:953–9. doi: 10.1093/ajcn/52.6.953
32.
Xiao J Purcell SA Prado CM Gonzalez MC . Fat mass to fat-free mass ratio reference values from NHANES III using bioelectrical impedance analysis. Clin Nutr. (2018) 37:2284–7. doi: 10.1016/j.clnu.2017.09.021
33.
Janssen I Heymsfield SB Ross R . Low relative skeletal muscle mass (sarcopenia) in older persons is associated with functional impairment and physical disability. J Am Geriatr Soc. (2002) 50:889–96. doi: 10.1046/J.1532-5415.2002.50216.X
34.
Sergi G De Rui M Veronese N Bolzetta F Berton L Carraro S et al . Assessing appendicular skeletal muscle mass with bioelectrical impedance analysis in free-living Caucasian older adults. Clin Nutr. (2015) 34:667–73. doi: 10.1016/j.clnu.2014.07.010
35.
Gould H Brennan SL Kotowicz MA Nicholson GC Pasco JA . Total and appendicular lean mass reference ranges for Australian men and women: the Geelong osteoporosis study. Calcif Tissue Int. (2014) 94:363–72. doi: 10.1007/S00223-013-9830-7
36.
Bahat G Kilic C Ilhan B Karan MA Cruz-Jentoft A . Association of different bioimpedanciometry estimations of muscle mass with functional measures. Geriatr Gerontol Int. (2019) 19:593–7. doi: 10.1111/GGI.13668
37.
Mathiowetz V Weber K Volland G Kashman N . Reliability and validity of grip and pinch strength evaluations. J Hand Surg Am. (1984) 9:222–6. doi: 10.1016/S0363-5023(84)80146-X
38.
Mathiowetz V Kashman N Volland G Weber K Dowe M Rogers S . Grip and pinch strength: normative data for adults. Arch Phys Med Rehabil. (1985) 66:69–74.
39.
McGrath R Hackney KJ Ratamess NA Vincent BM Clark BC Kraemer WJ . Absolute and body mass index normalized handgrip strength percentiles by gender, ethnicity, and hand dominance in Americans. Adv Geriatr Med Res. (2019) 2:e200005. doi: 10.20900/AGMR20200005
40.
Schröder H Fitó M Estruch R Martínez-González MA Corella D Salas-Salvadó J et al . A short screener is valid for assessing mediterranean diet adherence among older Spanish men and women. J Nutr. (2011) 141:1140–5. doi: 10.3945/jn.110.135566
41.
Martínez-González MA García-Arellano A Toledo E Salas-Salvadó J Buil-Cosiales P Corella D et al . A 14-item mediterranean diet assessment tool and obesity indexes among high-risk subjects: the PREDIMED trial. PLoS One. (2012) 7:e43134. doi: 10.1371/JOURNAL.PONE.0043134
42.
Booth M . Assessment of physical activity: an international perspective. Res Q Exerc Sport. (2000) 71:114–20. doi: 10.1080/02701367.2000.11082794
43.
ADA ADAPPC . 15. Management of diabetes in pregnancy: standards of medical care in diabetes—2022. Diabetes Care. (2022) 45:S232–43. doi: 10.2337/DC22-S015
44.
Zhang Y Xiao CM Zhang Y Chen Q Zhang XQ Li XF et al . Factors associated with gestational diabetes mellitus: a meta-analysis. J Diabetes Res. (2021) 2021:1–18. doi: 10.1155/2021/6692695
45.
Shirazian N Emdadi R Mahboubi M Motevallian A Fazel-Sarjuei Z Sedighpour N et al . Screening for gestational diabetes: usefulness of clinical risk factors. Arch Gynecol Obstet. (2009) 280:933–7. doi: 10.1007/S00404-009-1027-Y/METRICS
46.
Dong B Yu H Wei Q Zhi M Wu C Zhu X et al . The effect of pre-pregnancy body mass index and excessive gestational weight gain on the risk of gestational diabetes in advanced maternal age. Oncotarget. (2017) 8:58364–71. doi: 10.18632/ONCOTARGET.17651
47.
Mirabelli M Tocci V Donnici A Giuliano S Sarnelli P Salatino A et al . Maternal preconception body mass index overtakes age as a risk factor for gestational diabetes mellitus. J Clin Med. (2023) 12:2830. doi: 10.3390/JCM12082830
48.
Tranidou A Dagklis T Tsakiridis I Siargkas A Apostolopoulou A Mamopoulos A et al . Risk of developing metabolic syndrome after gestational diabetes mellitus - a systematic review and meta-analysis. J Endocrinol Investig. (2021) 44:1139–49. doi: 10.1007/S40618-020-01464-6
49.
Akinci B Celtik A Yener S Yesil S . Prediction of developing metabolic syndrome after gestational diabetes mellitus. Fertil Steril. (2010) 93:1248–54. doi: 10.1016/j.fertnstert.2008.12.007
50.
Aldridge E Pathirana M Wittwer M Sierp S Leemaqz SY Roberts CT et al . Prevalence of metabolic syndrome in women after maternal complications of pregnancy: an observational cohort analysis. Front Cardiovasc Med. (2022) 9:853851. doi: 10.3389/FCVM.2022.853851
51.
Zhao X Zhao D Sun J Yuan N Zhang X . Correlation between gestational diabetes mellitus and postpartum cardiovascular metabolic indicators and inflammatory factors: a cohort study of Chinese population. Front Endocrinol (Lausanne). (2024) 15:1401679. doi: 10.3389/FENDO.2024.1401679
52.
Lee CMY Huxley RR Wildman RP Woodward M . Indices of abdominal obesity are better discriminators of cardiovascular risk factors than BMI: a meta-analysis. J Clin Epidemiol. (2008) 61:646–53. doi: 10.1016/j.jclinepi.2007.08.012
53.
Ashwell M Gunn P Gibson S . Waist-to-height ratio is a better screening tool than waist circumference and BMI for adult cardiometabolic risk factors: systematic review and meta-analysis. Obes Rev. (2012) 13:275–86. doi: 10.1111/J.1467-789X.2011.00952.X
54.
Rico-Martín S Calderón-García JF Sánchez-Rey P Franco-Antonio C Martínez Alvarez M Sánchez Muñoz-Torrero JF . Effectiveness of body roundness index in predicting metabolic syndrome: a systematic review and meta-analysis. Obes Rev. (2020) 21:e13023. doi: 10.1111/OBR.13023
55.
Holmes CJ Racette SB . The utility of body composition assessment in nutrition and clinical practice: an overview of current methodology. Nutrients. (2021) 13:2493. doi: 10.3390/NU13082493
56.
de Morais N d S Azevedo FM de Freitas Rocha AR Morais D d C Ribeiro SAV Gonçalves VSS et al . Body fat is superior to body mass index in predicting cardiometabolic risk factors in adolescents. Int J Environ Res Public Health. (2023) 20:2074. doi: 10.3390/IJERPH20032074/S1
57.
Lee BJ Yim MH . Comparison of anthropometric and body composition indices in the identification of metabolic risk factors. Sci Rep. (2021) 11:9931. doi: 10.1038/S41598-021-89422-X
58.
Zeng Q Dong SY Sun XN Xie J Cui Y . Percent body fat is a better predictor of cardiovascular risk factors than body mass index. Braz J Med Biol Res. (2012) 45:591. doi: 10.1590/S0100-879X2012007500059
59.
Gunderson EP . Childbearing and obesity in women: weight before, during, and after pregnancy. Obstet Gynecol Clin N Am. (2009) 36:317–32. doi: 10.1016/J.OGC.2009.04.001
60.
Ishaku SM Karima T Oboirien KA Innocent AP Lawal O Jamilu T et al . Metabolic syndrome following hypertensive disorders in pregnancy in a low-resource setting: a cohort study. Pregnancy Hypertens. (2021) 25:129–35. doi: 10.1016/j.preghy.2021.05.018
61.
Garcia De Leon R Hodges TE Brown HK Bodnar TS LAM G . Inflammatory signalling during the perinatal period: implications for short- and long-term disease risk. Psychoneuroendocrinology. (2025) 172:107245. doi: 10.1016/J.PSYNEUEN.2024.107245
62.
Baudrand R Domínguez JM Tabilo C Figueroa D Jimenez M Eugenin C et al . The estimation of visceral adipose tissue with a body composition monitor predicts the metabolic syndrome. J Hum Nutr Diet. (2013) 26:154–8. doi: 10.1111/JHN.12089
63.
Cho DH Kim MN Joo HJ Shim WJ Lim DS Park SM . Visceral obesity, but not central obesity, is associated with cardiac remodeling in subjects with suspected metabolic syndrome. Nutr Metab Cardiovasc Dis. (2019) 29:360–6. doi: 10.1016/j.numecd.2019.01.007
64.
Pramyothin P Limpattanachart V Dawilai S Sarasak R Sukaruttanawong C Chaiyasoot K et al . Fat-free mass, metabolically healthy obesity, and type 2 diabetes in severely obese Asian adults. Endocr Pract. (2017) 23:915–22. doi: 10.4158/EP171792.OR
65.
Kim TN Park MS Lee EJ Chung HS Yoo HJ Kang HJ et al . Comparisons of three different methods for defining sarcopenia: an aspect of cardiometabolic risk. Sci Rep. (2017) 7:6491. doi: 10.1038/S41598-017-06831-7
66.
Kim G Lee SE Jun JE Lee YB Ahn J Bae JC et al . Increase in relative skeletal muscle mass over time and its inverse association with metabolic syndrome development: a 7-year retrospective cohort study. Cardiovasc Diabetol. (2018) 17:23. doi: 10.1186/S12933-018-0659-2
67.
Song YM Lee K . Comparison of the associations between appendicular lean mass adjustment methods and cardiometabolic factors. Nutr Metab Cardiovasc Dis. (2020) 30:2271–8. doi: 10.1016/j.numecd.2020.07.036
68.
Guan Z Minnetti M Heymsfield SB Poggiogalle E Prado CM Sim M et al . Beyond traditional body composition metrics: load-capacity indices emerge as predictors of cardiometabolic outcomes—a systematic review and meta-analysis. Adv Nutr. (2025) 16:100364. doi: 10.1016/j.advnut.2024.100364
69.
Cancello R Brunani A Brenna E Soranna D Bertoli S Zambon A et al . Phase angle (PhA) in overweight and obesity: evidence of applicability from diagnosis to weight changes in obesity treatment. Rev Endocr Metab Disord. (2022) 24:451–64. doi: 10.1007/S11154-022-09774-1
70.
Sagun G Oguz A Karagoz E Filizer AT Tamer G Mesci B . Application of alternative anthropometric measurements to predict metabolic syndrome. Clinics. (2014) 69:347–53. doi: 10.6061/CLINICS/2014(05)09
71.
Gallagher D Heymsfield SB Heo M Jebb SA Murgatroyd PR Sakamoto Y . Healthy percentage body fat ranges: an approach for developing guidelines based on body mass index. Am J Clin Nutr. (2000) 72:694–701. doi: 10.1093/ajcn/72.3.694
72.
Cruz-Jentoft AJ Bahat G Bauer J Boirie Y Bruyère O Cederholm T et al . Sarcopenia: revised European consensus on definition and diagnosis. Age Ageing. (2019) 48:16–31. doi: 10.1093/AGEING/AFY169
73.
Leeflang MMG Rutjes AWS Reitsma JB Hooft L Bossuyt PMM . Variation of a test’s sensitivity and specificity with disease prevalence. Can Med Assoc J. (2013) 185:E537–44. doi: 10.1503/CMAJ.121286
74.
Murad MH Lin L Chu H Hasan B Alsibai RA Abbas AS et al . The association of sensitivity and specificity with disease prevalence: analysis of 6909 studies of diagnostic test accuracy. Can Med Assoc J. (2023) 195:E925–31. doi: 10.1503/CMAJ.221802/TAB-RELATED-CONTENT
Summary
Keywords
gestational diabetes mellitus, body composition, metabolic syndrome, postpartum period, prevalance
Citation
López-Plaza B, Larrad-Sainz A, Valerio J, O’Connor RM, del Valle L, Ramos-Levi AM, Barabash A, Marcuello C, Jiménez-Varas I, Rubio-Herrera MA, Matía-Martín P and Calle-Pascual AL (2025) Body composition as a complementary tool for detection of metabolic syndrome 6 years postpartum: a St. Carlos Cohort follow-up. Front. Nutr. 12:1689658. doi: 10.3389/fnut.2025.1689658
Received
20 August 2025
Accepted
07 October 2025
Published
29 October 2025
Volume
12 - 2025
Edited by
Roberto Fernandes Da Costa, Autonomous University of Chile, Chile
Reviewed by
Yujia Zhang, Centers for Disease Control and Prevention (CDC), United States
Herald Midzi, Family Health International 360 (Zimbabwe), Zimbabwe
Updates
Copyright
© 2025 López-Plaza, Larrad-Sainz, Valerio, O’Connor, del Valle, Ramos-Levi, Barabash, Marcuello, Jiménez-Varas, Rubio-Herrera, Matía-Martín and Calle-Pascual.
This is an open-access article distributed under the terms of the Creative Commons Attribution License (CC BY). The use, distribution or reproduction in other forums is permitted, provided the original author(s) and the copyright owner(s) are credited and that the original publication in this journal is cited, in accordance with accepted academic practice. No use, distribution or reproduction is permitted which does not comply with these terms.
*Correspondence: Alfonso L. Calle-Pascual, alfonsca@ucm.es Pilar Matía-Martín, mmatia@ucm.es
†These authors have contributed equally to this work
Disclaimer
All claims expressed in this article are solely those of the authors and do not necessarily represent those of their affiliated organizations, or those of the publisher, the editors and the reviewers. Any product that may be evaluated in this article or claim that may be made by its manufacturer is not guaranteed or endorsed by the publisher.