 Vanessa M. Oddo
 Julien Leider
 Alison Tovar
 Maya K. Vadiveloo
 Emily Elenio
 Lisa M. Powell
- 1Department of Kinesiology and Nutrition, College of Applied Health Sciences, University of Illinois Chicago, Chicago, IL, United States
- 2Institute for Health Research and Policy, School of Public Health, University of Illinois Chicago, Chicago, IL, United States
- 3Department of Behavioral and Social Sciences, School of Public Health, Brown University, Providence, RI, United States
- 4Department of Nutrition, College of Health Sciences, The University of Rhode Island, Kingston, RI, United States
- 5Division of Health Policy and Administration, School of Public Health, University of Illinois Chicago, Chicago, IL, United States
Objective: To test the short-term effect of a state-level fruit and vegetable incentive (FVI) on food and nutrition security among Supplemental Nutrition Assistance Program (SNAP) participants.
Methods: In January 2024, Rhode Island (RI) implemented a FVI, which provided a $0.50 credit for every $1.00 spent on fresh FV up to $25/month. Using a difference-in-differences approach, we used separate adjusted logistic regression models to evaluate FVI impacts on household food and nutrition insecurity and perceived FV affordability, in RI relative to changes in the comparison site of Connecticut (CT), ~6 months after implementation.
Results: At baseline, participants’ (N = 725) mean age was ~35 years old, ~95% were women, ~40% identified as Hispanic, and ~25% perceived that they could not afford FV. Food (55–59%) and nutrition (30–34%) insecurity were high in both states. After implementation, neither food [Odds Ratio (OR): 1.14; 95% Confidence Interval (CI): 0.84–1.55] nor nutrition insecurity (OR: 0.92; 95% CI: 0.63–1.34) changed in RI relative to CT. There were also no changes over time in perceived FV affordability in RI versus CT (OR: 0.80; 95% CI: 0.54–1.18).
Conclusion: We did not observe short-term changes in food or nutrition insecurity associated with the FVI provided to SNAP participants. Future analyses should evaluate longer-term policy effects.
Introduction
Food and nutrition insecurity remain critical public health issues in the United States (U.S.). In 2023, 13.5% of U.S. households experienced food insecurity, commonly defined as lacking access to enough food for a healthy life (1). A related construct, nutrition security, emphasizes the ability to access and afford food for a nutritionally adequate diet that promotes health and prevents disease (2, 3). Using a proxy measure, prior evidence suggests ~36% of Americans are nutrition insecure (4), with a higher prevalence (~50%) previously observed among Supplemental Nutrition Assistance Program (SNAP) participants (5). Both food and nutrition insecurity can negatively impact diet quality (6, 7), which in turn, contributes to diet-related diseases among individuals with low income.
SNAP provides food benefits to individuals with low income, with the primary goal of reducing food insecurity in the U.S. While SNAP participation does decrease food insecurity among participants (8, 9), many remain food insecure (8), suggesting that additional structural- (e.g., transportation) and individual-level barriers persist, including affordability, particularly for nutrient-dense foods (10). Nutrition incentive programs are one emerging strategy that aim to decrease food and nutrition insecurity by reducing financial burden among individuals with low income in the U.S.
Prior evaluations suggest that fruit and vegetable incentive (FVI) programs have reduced food insecurity among individuals with low income (11–13). Despite this prior evidence, few FVI have implemented programs at scale, many require enrollment to participate, and most evaluations do not include a control group. Moreover, none have evaluated their effects on household nutrition insecurity.
In January 2024, Rhode Island (RI) implemented the Eat Well, Be Well (EWBW) program, the first statewide FVI program automatically delivered to all SNAP households via EBT cards. Using a difference-in-differences approach, we tested the effect of EWBW on household food and nutrition insecurity among adult SNAP participants, with Connecticut (CT) serving as the comparison state. Study results can contribute to our understanding of the extent to which FVI programs affect food and nutrition insecurity, which may help inform the future direction of food assistance programs in the U.S.
Methods
Study overview
RI implemented EWBW in January 2024, which provided an automatic credit to each SNAP participant’s EBT card of $0.50 for every $1.00 spent on fresh FV sold by select participating SNAP retailers (Stop & Shop, Walmart), up to $25.00/month. A total of $11.5 million was allocated to the program, which will continue until funds are exhausted. In 2024, $3.2 million in extra SNAP benefits were issued as part of EWBW. Detailed elsewhere, the secondary aim of the larger evaluation was to evaluate the effect of the FVI on diet quality, measured via the Healthy Eating Index (HEI)-2015, employing a quasi-experimental design (14, 15). CT was selected as the comparison state based on geographic proximity and demographic, socioeconomic, and political similarity. Notably, 2023 data from the American Community Survey suggest that the percent of households participating in SNAP was similar in Rhode Island (13%) and Connecticut (12%) (16). We also aimed to evaluate the effect of the FVI on household food and nutrition insecurity, which was the focus of these analyses.
Study procedures
We recruited participants from RI and CT prior to policy implementation (May to September 2023) via in-person events, community partnerships, and text messages sent to Women, Infants, and Children (WIC) program participants. Participants that consented to participation completed a screener via Qualtrics to verify eligibility. Inclusion criteria included: speaking and reading English or Spanish; being 18 years old; currently participating in SNAP; living in RI or CT; and having access to email and a text message-capable phone. Eligible participants filled out a food frequency questionnaire (FFQ) through VioScreen and a sociodemographic survey in Qualtrics (n = 1,367) (15, 17).
Between June and September 2024, previously enrolled participants (n = 1,363) were recontacted for follow-up, and asked to verify their SNAP status by submitting a photo of a grocery receipt that showed their SNAP EBT card number, during the prior 30 days. Verified and eligible participants who responded to follow-up outreach were asked to complete a second FFQ and sociodemographic questionnaire. Participants received a $50 electronic gift card at each time period. Study procedures are detailed elsewhere (15).
Analytic sample
Consistent with our primary analyses, of the 837 individuals that completed the follow-up survey, participants were excluded if they moved from RI to CT (n = 1), were missing data on covariates (n = 3), reported extreme fruit and vegetable intake (>7.2 cup equivalents /1,000 kcal at baseline or >8 cup equivalents/1000 kcal at follow-up, including fruit juice; n = 10), or reported extreme overall dietary intake [≤500 kcal or ≥5,500 kcal (n = 87), or ≤25 different foods from FFQ (n = 11)]. The final analytical sample included 725 SNAP participants in RI and CT.
Key study variables
Our online survey queried respondents on demographic and household information, food insecurity, nutrition insecurity, food access barriers, and diet (17). For these analyses, household food and nutrition insecurity served as our primary dependent variables. Food insecurity was defined using the 6-item USDA Module (18) and a binary measure was created based on a score of 0–1 (food secure) versus 2–6 (food insecure). A binary nutrition insecurity measure was defined using the 1-item measure developed by the Center for Nutrition and Health Impact (19) based on responses in the affirmative to the question, “In the last 30 days, we worried that the food we were able to eat would hurt our health and well-being.” At follow-up only, we also collected data on the full 4-item nutrition insecurity measure with a 12-month reference period (19).
Individuals were asked to check all that apply to several perceived barriers for buying and preparing FV, including not being able to afford FV; limited transportation options; limited variety of FV sold at the store; disklike of FV among the household members; and not knowing how to prepare FV, among others. Non-financial barriers for purchasing FV likely persisted following EWBW (e.g., transportation, nutrition education). However, given that cost was the most direct mechanism through which the FVI could affect food and nutrition insecurity, we secondarily explored whether perceived FV affordability (a binary variable) was impacted by the FVI.
Statistical analyses
We computed summary statistics by state and time period and then estimated adjusted logistic regression difference-in-differences models with robust standard errors, clustered on participant. Based on prior literature (5, 20–25) and variables hypothesized to affect food and nutrition insecurity, we controlled for the following covariates: education, employment, marital status, household size, living arrangement, race and ethnicity, gender, baseline age, and household receipt of WIC.
Consistent with our primary analysis focused on diet (14), we also conducted exploratory analyses stratified by lower (n = 363, 0.10–1.79 cup equivalents/1000 kcal) and upper (n = 362, >1.79–7.13 cup equivalents/1000 kcal) halves of the baseline FV intake distribution.
Analyses were conducted in Stata/MP 18.0. This study was approved by the institutional review boards at Brown University and University of Rhode Island.
Results
Largely, the demographic characteristics of participants were similar by state and time period (Table 1). At baseline, participants’ mean age was ~35 years old, ~95% were women, and ~40% identified as Hispanic. About half of the sample had ≥some college, but this was higher in CT (60%) than RI (47%). At baseline, 42 and 49% of the sample was employed in RI and CT, respectively; the percent of the sample that was employed was somewhat higher in both states at follow-up (47% in RI, 53% in CT). Most participants also received WIC benefits at baseline (77% in RI, 83% in CT), but this was lower in both states at follow-up (67% in RI, 70% in CT). In both states, ~25% of the sample perceived that they could not afford FV at baseline; this was slightly lower in RI at follow-up (23%). Food (55–59%) and nutrition (30–34%) insecurity were highly prevalent at baseline in both states; both were slightly lower at follow-up, but remained around 53 and 30%, respectively.
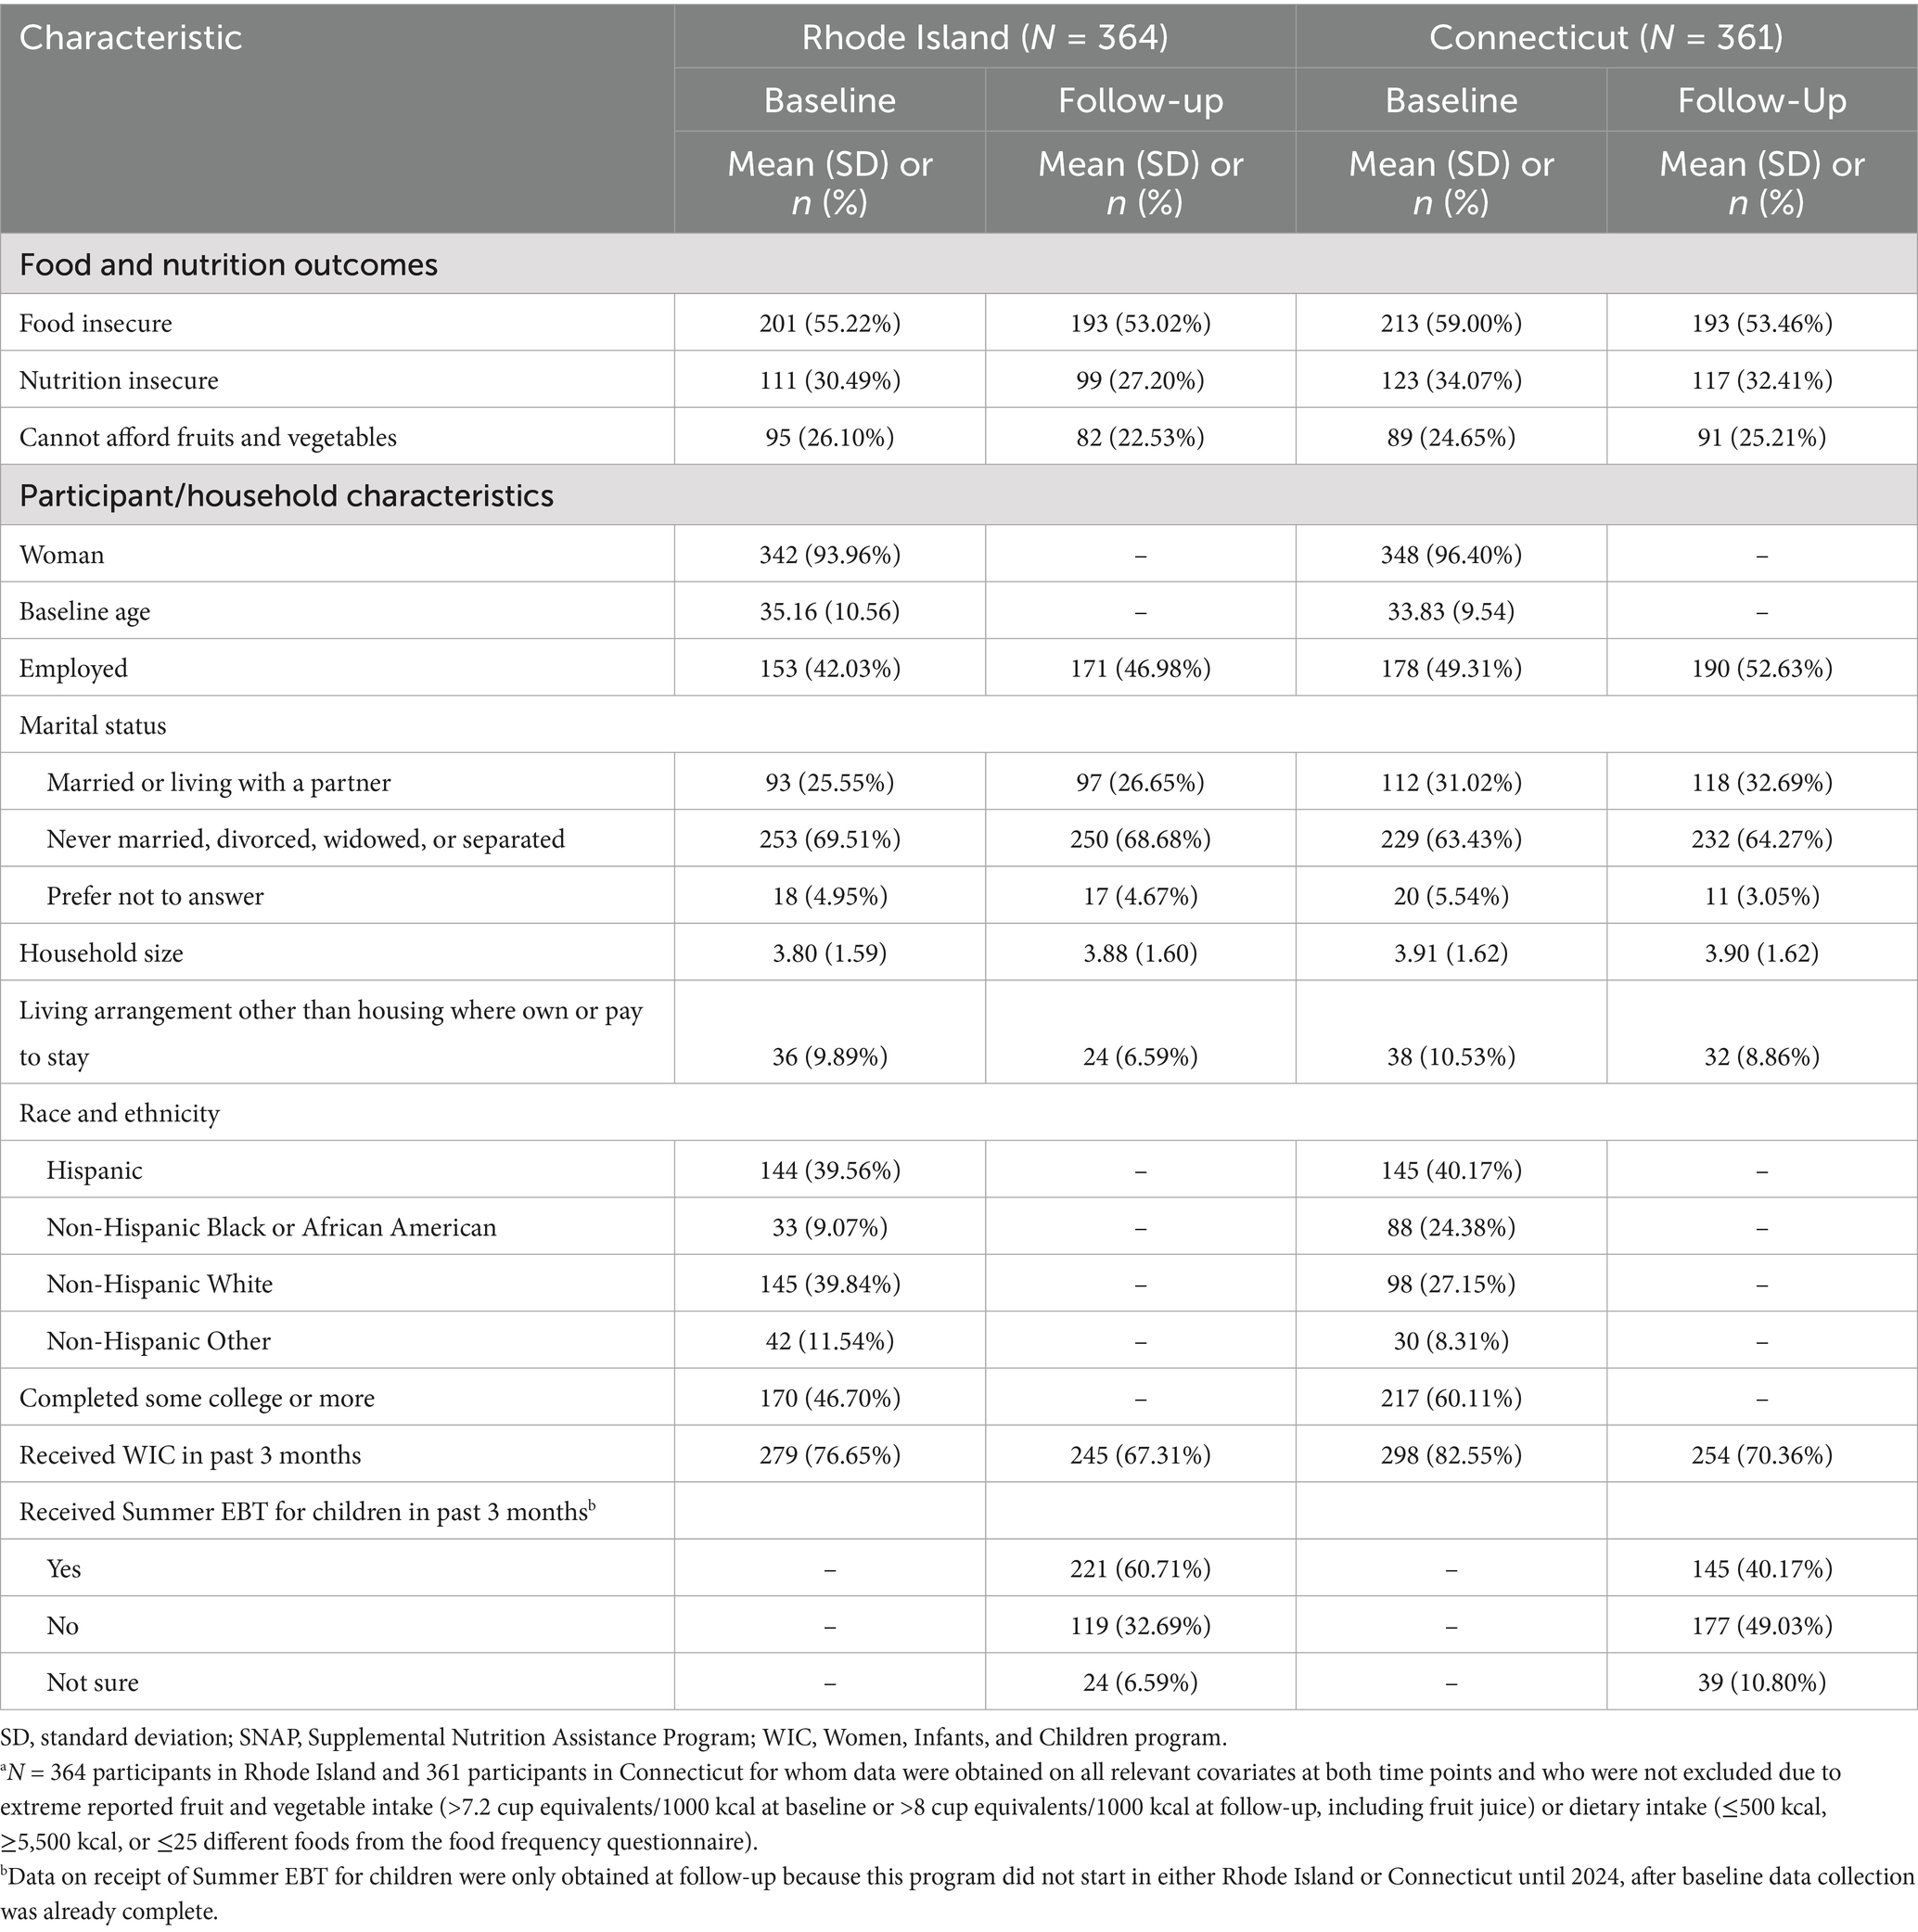
Table 1. Characteristics of analytical sample of SNAP participants in Rhode Island and Connecticuta.
Overall, ~6 months after the implementation of the FVI program, neither food [Odds Ratio (OR): 1.14; 95% Confidence Interval (CI): 0.84–1.55] nor nutrition insecurity (OR: 0.92; 95% CI: 0.63–1.34) changed in RI relative to CT (Table 2). We also did not observe changes in food nor nutrition insecurity in RI, compared to changes in CT, when results were stratified by baseline FV intake. Nor did we observe changes over time in perceived affordability of FV in RI versus CT (OR: 0.80; 95% CI: 0.54–1.18).

Table 2. Results of difference-in-differences regression models examining changes in food and nutrition insecurity and reported barriers to buying and preparing fruits and vegetables in Rhode Island relative to Connecticuta.
Discussion
To our knowledge, this study is the first to investigate a statewide automatic SNAP FVI in relation to food and nutrition security, using a quasi-experimental design. All difference-in-differences regression results were null.
Our findings contrast with a recent systematic review reporting lower household food insecurity among individuals with low income participating in FVI programs (n = 12) (13); when combining 7 of the 12 like studies, Stein et al. reported an ~18 percentage point reduction in the percentage of individuals with food insecurity. A recent randomized control study evaluated a healthy food benefit program for households with low income in Seattle (11). Knox et al. (11) report that a $40 per month benefit to buy fruits and vegetables at a wide range of retailers was associated with a decrease in food insecurity. Likewise, a study of >20,000 adult SNAP participants suggested that >6 months of participation (versus first-time participation) in the Gus Schumacher Nutrition Incentive (GusNIP) was associated with ~40% lower odds of having food insecurity (12). However, several key methodological differences between prior literature and our study warrant consideration. Most importantly, most studies included in the review (13) and the large GusNIP study by Shanks et al. (12) did not include control groups. Moreover, for many studies reporting on food insecurity, program duration was <6 months or not reported and most FVI were provided via a subsidy (i.e., a fixed amount of money) versus a match (i.e., money tied to dollars spent) (13). Additionally, the study conducted by Knox et al. (11) and the review (13) did not include studies that distributed FVI through larger federal nutrition assistance programs; although 55% of individuals included in the systematic review (13) were participating in SNAP. Although none of these prior studies examined nutrition security, our null findings also diverge from literature suggesting FVI programs improve FV intake (11, 13)—a proxy likely correlated with nutrition security.
There are other plausible explanations for our null findings. In our sample, only ~30% of individuals were nutrition insecure, which is lower than the prevalence of nutrition insecurity (~50%) reported by Tucker et al. (5) and Calloway et al. (6) The lower prevalence in our sample may be because a large proportion also received WIC benefits, which likely provides an additional buffer against both food and nutrition insecurity. However, it is relevant to note the decrease in WIC participation in the follow-up period. Additionally, it is possible that our follow-up period was too short (5–8 months) to observe significant changes in our outcomes. Further research, with a longer follow-up period, is important to help evaluate the longer-term impact and economic feasibility of sustained FVI programs. It is also possible that the incentive size, restricting to fresh FV, limited program awareness, and implementation occurring only at two store chains were limiting factors. Although our null results were unexpected, they are generally consistent with our primary analyses, which found a non-significant but positive association between FVI and fruit and vegetable intake overall (14). Our null findings may also be a result of limited program awareness as only one-quarter of the RI sample reported using the EWBW incentives after the policy was implemented (14), which underscores the need for effective communication strategies to accompany financial incentives, as has been demonstrated in other nutrition policy evaluations (26).
This study is subject to several limitations. First, nutrition security was assessed using a 1-item screener that has not yet been used extensively in the literature; however, the 1-item measure was well-correlated with the 4-item validated measure at follow-up (adjusted OR: 5.95; 95% CI: 4.40–8.04; data not shown in tables). Nevertheless, the development of a more robust nutrition security measure using a rigorous, mixed-methods approach like that employed to develop the 18-item USDA Household Food Security Survey Module warrants consideration (27). Moreover, both food and nutrition security are self-reported, which could introduce recall or social desirability bias. Our sample included predominantly women, most participants were also receiving WIC benefits (~70%), and our evaluation is of one statewide program in the Northeast, which may limit our external generalizability. Additionally, participant attrition over time could limit the external generalizability of results. Although CT was chosen as the comparison state based on demographic, socioeconomic, and political similarity, we cannot rule out the possibility of unmeasured confounding stemming from policy or contextual differences between RI and CT that changed over the course of the study. This study also has several strengths including our large sample of SNAP participants, evaluation of a statewide automatic FVI, quasi-experimental design, and inclusion of a nutrition security measure.
Conclusion
The EWBW FVI was not associated with food or nutrition insecurity among SNAP participants ~6 months after implementation. The results of this short-term follow-up suggest that providing an automatic nutrition incentive to EBT cards for use at a limited number of retailers may be insufficient to reduce food and nutrition insecurity. Future analyses should evaluate the effects of the FVI program after a longer follow-up duration and how factors like incentive size, store selection, and restrictions on incentive use work in concert to affect food and nutrition insecurity.
Data availability statement
The raw data supporting the conclusions of this article will be made available by the authors, without undue reservation.
Ethics statement
The studies involving humans were approved by Brown University; University of Rhode Island. The studies were conducted in accordance with the local legislation and institutional requirements. The participants provided their written informed consent to participate in this study.
Author contributions
VO: Conceptualization, Methodology, Writing – original draft. JL: Conceptualization, Formal analysis, Methodology, Writing – review & editing. AT: Conceptualization, Methodology, Supervision, Writing – review & editing. MV: Conceptualization, Methodology, Writing – review & editing. EE: Data curation, Project administration, Writing – review & editing. LP: Conceptualization, Funding acquisition, Methodology, Supervision, Writing – review & editing.
Funding
The author(s) declare that financial support was received for the research and/or publication of this article. This study was supported by a grant (2020-85774) from Bloomberg Philanthropies’ Food Policy Program (www.bloomberg.org). Bloomberg Philanthropies did not have a role in study design; collection, analysis, and/or interpretation of data. MV was also supported by a K01 Career Development award from the National Heart, Lung, and Blood Institute (5K01HL165104).
Conflict of interest
The authors declare that the research was conducted in the absence of any commercial or financial relationships that could be construed as a potential conflict of interest.
Generative AI statement
The authors declare that no Gen AI was used in the creation of this manuscript.
Any alternative text (alt text) provided alongside figures in this article has been generated by Frontiers with the support of artificial intelligence and reasonable efforts have been made to ensure accuracy, including review by the authors wherever possible. If you identify any issues, please contact us.
Publisher’s note
All claims expressed in this article are solely those of the authors and do not necessarily represent those of their affiliated organizations, or those of the publisher, the editors and the reviewers. Any product that may be evaluated in this article, or claim that may be made by its manufacturer, is not guaranteed or endorsed by the publisher.
Author disclaimer
The contents of this publication do not necessarily reflect the views or policies of Bloomberg Philanthropies.
References
1. Rabbitt, MP, Reed-Jones, M, Hales, LJ, and Burke, MP. Household food security in the United States in 2023. U.S. Department of Agriculture, Economic Research Service. (2024). Available online at: https://www.ers.usda.gov/publications/pub-details?pubid=109895
2. Thorndike, AN, Gardner, CD, Kendrick, KB, Seligman, HK, Yaroch, AL, Gomes, AV, et al. Strengthening US food policies and programs to promote equity in nutrition security: a policy statement from the American Heart Association. Circulation. (2022) 145:e1077–93. doi: 10.1161/CIR.0000000000001072
3. Seligman, HK, Levi, R, Adebiyi, VO, Coleman-Jensen, A, Guthrie, JF, and Frongillo, EA. Assessing and monitoring nutrition security to promote healthy dietary intake and outcomes in the United States. Annu Rev Nutr. (2023) 43:409–29. doi: 10.1146/annurev-nutr-062222-023359
4. Bhargava, V, Lee, JS, Smith, TA, and Chakrovorty, S. A measure of nutrition security using the National Health and Nutrition Examination Survey dataset. JAMA Netw Open. (2025) 8:e2462130. doi: 10.1001/jamanetworkopen.2024.62130
5. Tucker, AC, Bresnahan, C, John, S, Johnson, J, Leung, CW, Mui, Y, et al. Food (in) security in relation to nutrition (in) security in a national cross-sectional sample of Supplemental Nutrition Assistance Program participants: considerations of an emerging construct. Am J Clin Nutr. (2024) 119:1475–84. doi: 10.1016/j.ajcnut.2024.03.020
6. Calloway, EE, Coakley, KE, Carpenter, LR, Gargano, T, and Yaroch, AL. Benefits of using both the Hunger Vital Sign and brief nutrition security screener in health-related social needs screening. Transl Behav Med. (2024) 14:445–51. doi: 10.1093/tbm/ibae037
7. Hanson, KL, and Connor, LM. Food insecurity and dietary quality in US adults and children: a systematic review. Am J Clin Nutr. (2014) 100:684–92. doi: 10.3945/ajcn.114.084525
8. Mabli, J, and Ohls, J. Supplemental Nutrition Assistance Program participation is associated with an increase in household food security in a national evaluation. J Nutr. (2015) 145:344–51. doi: 10.3945/jn.114.198697
9. Ratcliffe, C, McKernan, S-M, and Zhang, S. How much does the Supplemental Nutrition Assistance Program reduce food insecurity? Am J Agric Econ. (2011) 93:1082–98. doi: 10.1093/ajae/aar026
10. Gearing, M, Dixit-Joshi, S, and May, L. Barriers that constrain the adequacy of Supplemental Nutrition Assistance Program (SNAP) allotments: survey findings. Report prepared by Westat, Inc. for the U.S. Department of Agriculture, Food and Nutrition Service. (2021). Available online at: https://fns-prod.azureedge.us/sites/default/files/resource-files/SNAP-Barriers-Summary.pdf (Accessed October 15, 2025).
11. Knox, M, Wallace, J, Baquero, B, Hara-Hubbard, K, and Jones-Smith, JC. Healthy food benefit programs, fruit and vegetable consumption, and food security. JAMA Netw Open. (2025) 8:e2527601. doi: 10.1001/jamanetworkopen.2025.27601
12. Shanks, CB, Uy, WF, Zhang, N, Parks, CA, Fricke, HE, Resnicow, K, et al. Nutrition incentives associated with improved outcomes: 2020–2023 results from the United States Gus Schumacher Nutrition Incentive Program (GusNIP). AJPM Focus. (2025) 4:100348. doi: 10.1016/j.focus.2025.100348
13. Stein, R, Finnie, RK, Harmon, S, Peng, Y, Pritchard, C, Vecsey, H, et al. Impact of fruit and vegetable incentive programs on food insecurity, fruit and vegetable consumption, and health outcomes: a Community Guide systematic review. Am J Prev Med. (2025) 68:627–37. doi: 10.1016/j.amepre.2024.11.016
14. Tovar, A, Powell, LM, Leider, J, Elenio, E, Oddo, VM, and Vadiveloo, MK. Evaluation of a State-Level Incentive Program to Improve Diet. JAMA Network Open (2025) 8:e2544215. doi: 10.1001/jamanetworkopen.2025.44215
15. Vadiveloo, MK, Elenio, E, Leider, J, Oddo, VM, Pipito, A, Powell, LM, et al. Design of the What’s On Your Plate SNAP study (2024). Available online at: https://p3rc.uic.edu/wp-content/uploads/sites/561/2024/12/Vadiveloo_Nov-2024_RsrchBrf-No-139_Dsgn-WhatsOnYourPlate-SNAP-Stdy.pdf (Accessed October 15, 2025).
16. U.S. Census Bureau, U.S. Department of Commerce. Food stamps/Supplemental Nutrition Assistance Program (SNAP). Available online at: https://data.census.gov/table/ACSST1Y2023.S2201?q=snap+participation+by+state (Accessed October 15, 2025).
17. Oddo, VM, Leider, J, Tovar, A, Powell, LM, Elenio, E, and Vadiveloo, MK. Food insecurity and risk of nutrition insecurity among Supplemental Nutrition Assistance Program participants in Rhode Island and Connecticut, USA. Prev Med Rep. (2025) 51:103002. doi: 10.1016/j.pmedr.2025.103002
18. USDA, Economic Research Service U.S. household food security survey module: six-item short form (2024). Available online at: https://www.ers.usda.gov/sites/default/files/_laserfiche/DataFiles/50764/short2024.pdf (Accessed October 15, 2025).
19. Calloway, EE, Carpenter, LR, Gargano, T, Sharp, JL, and Yaroch, AL. Development of new measures to assess household nutrition security, and choice in dietary characteristics. Appetite. (2022) 179:106288. doi: 10.1016/j.appet.2022.106288
20. Byker Shanks, C, and Gordon, NP. Screening for food and nutrition insecurity in the healthcare setting: a cross-sectional survey of non-Medicaid insured adults in an integrated healthcare delivery system. J Prim Care Community Health. (2024) 15:21501319241258948. doi: 10.1177/21501319241258948
21. Doar, R. Freedom from hunger: an achievable goal for the United States of America-recommendations of the National Commission on Hunger to Congress and the Secretary of the Department of Agriculture. Washington, D.C.: National Commission on Hunger, (2015).
22. Seligman, HK, and Schillinger, D. Hunger and socioeconomic disparities in chronic disease. N Engl J Med. (2010) 363:6–9. doi: 10.1056/NEJMp1000072
23. Coleman-Jensen, A. U.S food insecurity and population trends with a focus on adults with disabilities. Physiol Behav. (2020) 220:112865. doi: 10.1016/j.physbeh.2020.112865
24. Schwartz, N, Buliung, R, and Wilson, K. Disability and food access and insecurity: a scoping review of the literature. Health Place. (2019) 57:107–21. doi: 10.1016/j.healthplace.2019.03.011
25. Berkowitz, SA, Seligman, HK, and Palakshappa, D. Understanding food insecurity risk in the United States: a longitudinal analysis. SSM Popul Health. (2024) 25:101569. doi: 10.1016/j.ssmph.2023.101569
26. Oddo, VM, Knox, MA, Walkinshaw, LP, Saelens, BE, Chan, N, and Jones-Smith, JC. Evaluation of Seattle’s sweetened beverage tax on tax support and perceived economic and health impacts. Prev Med Rep. (2022) 27:101809. doi: 10.1016/j.pmedr.2022.101809
27. McClain, AC. Developing a measure of nutrition security in the US—current context and future opportunities. JAMA Netw Open. (2025) 8:e2462136. doi: 10.1001/jamanetworkopen.2024.62136
Abbreviations
CT, Connecticut; RI, Rhode Island; SNAP, Supplemental Nutrition Assistance Program; WIC program, Women, Infants, and Children.
Keywords: nutrition policy, quasi-experimental design, fruits and vegetables, food insecurity, nutrition insecurity
Citation: Oddo VM, Leider J, Tovar A, Vadiveloo MK, Elenio E and Powell LM (2025) An evaluation of a state-level fruit and vegetable incentive’s impacts on food and nutrition security among SNAP participants. Front. Nutr. 12:1706200. doi: 10.3389/fnut.2025.1706200
Edited by:
Abhishek Das, International Crops Research Institute for the Semi-Arid Tropics (ICRISAT), IndiaReviewed by:
Kimberly Battle, Virginia Commonwealth University, United StatesMaha Almohamad, University of Texas Health Science Center at Houston, United States
Jerold Mande, Harvard University, United States
Copyright © 2025 Oddo, Leider, Tovar, Vadiveloo, Elenio and Powell. This is an open-access article distributed under the terms of the Creative Commons Attribution License (CC BY). The use, distribution or reproduction in other forums is permitted, provided the original author(s) and the copyright owner(s) are credited and that the original publication in this journal is cited, in accordance with accepted academic practice. No use, distribution or reproduction is permitted which does not comply with these terms.
*Correspondence: Vanessa M. Oddo, dm9kZG9AdWljLmVkdQ==