 Deepti Adlakha
 Elizabeth L. Budd
 Rebecca Gernes
 Sonia Sequeira
 James A. Hipp
A corrigendum on
Results and figures of the article by Adlakha et al. (2014) contained minor errors, which we hereby rectify.
Results show that a large majority of running and walking routes were through or tangential to a park or green space. A total of 1,722.01 miles from 287 running routes and 236.84 miles from 71 walking routes appear in Figure 1 and Table 1. The average lengths of a run and walk in this sample were 6.00 and 3.33 miles, respectively. Of all the parks in the study area, 70% were located in low-income neighborhoods. Of the 287 running routes, 80.80% traversed a park at some point during the run and 6.97% of these runs took place in parks located in low-SES neighborhoods. Of the 71 walking routes, 70.40% traversed a park at some point during the walk and 15.50% of walking routes occurred in parks located in low-SES neighborhoods. Figure 2 illustrates the availability of many parks across St. Louis, but shows fewer mapped running or walking routes in the northern half of the region that features more low-SES neighborhoods.
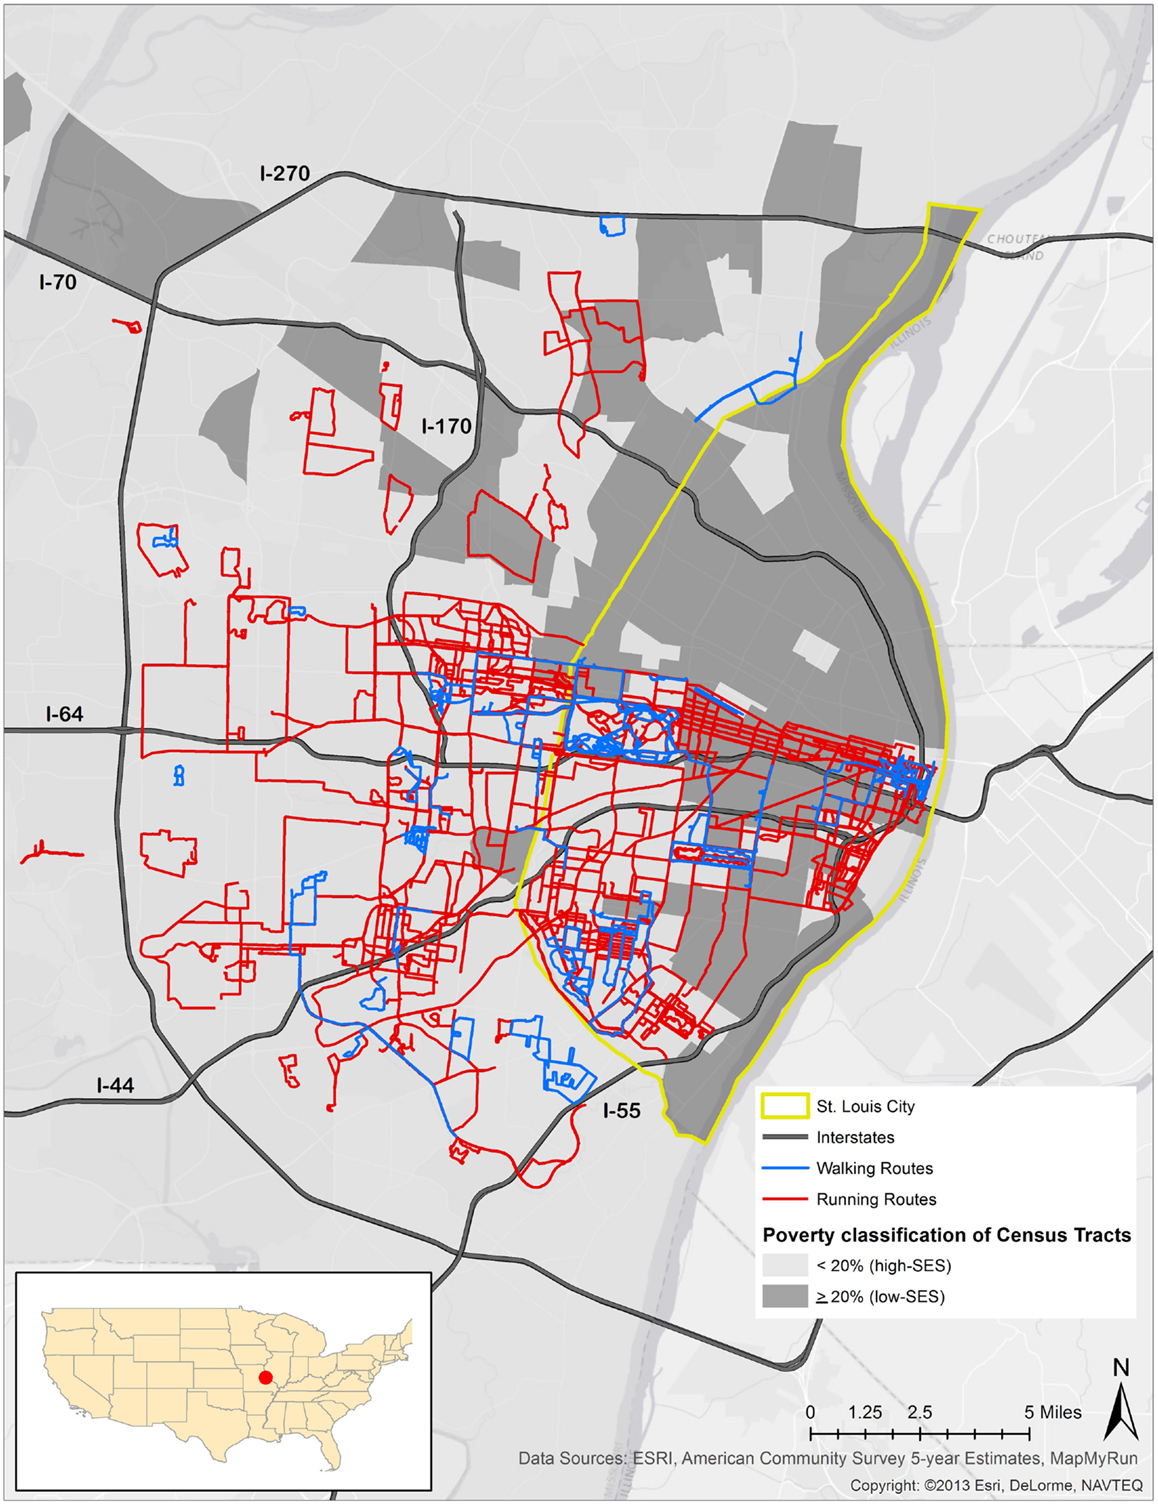
Figure 1. Running routes, walking routes, and poverty rate in St. Louis, MO, USA.
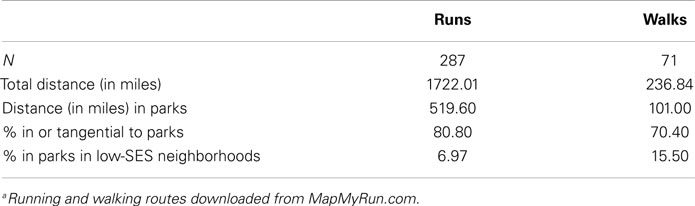
Table 1. Use of parks in St. Louis, MO for physical activity in 2012a.
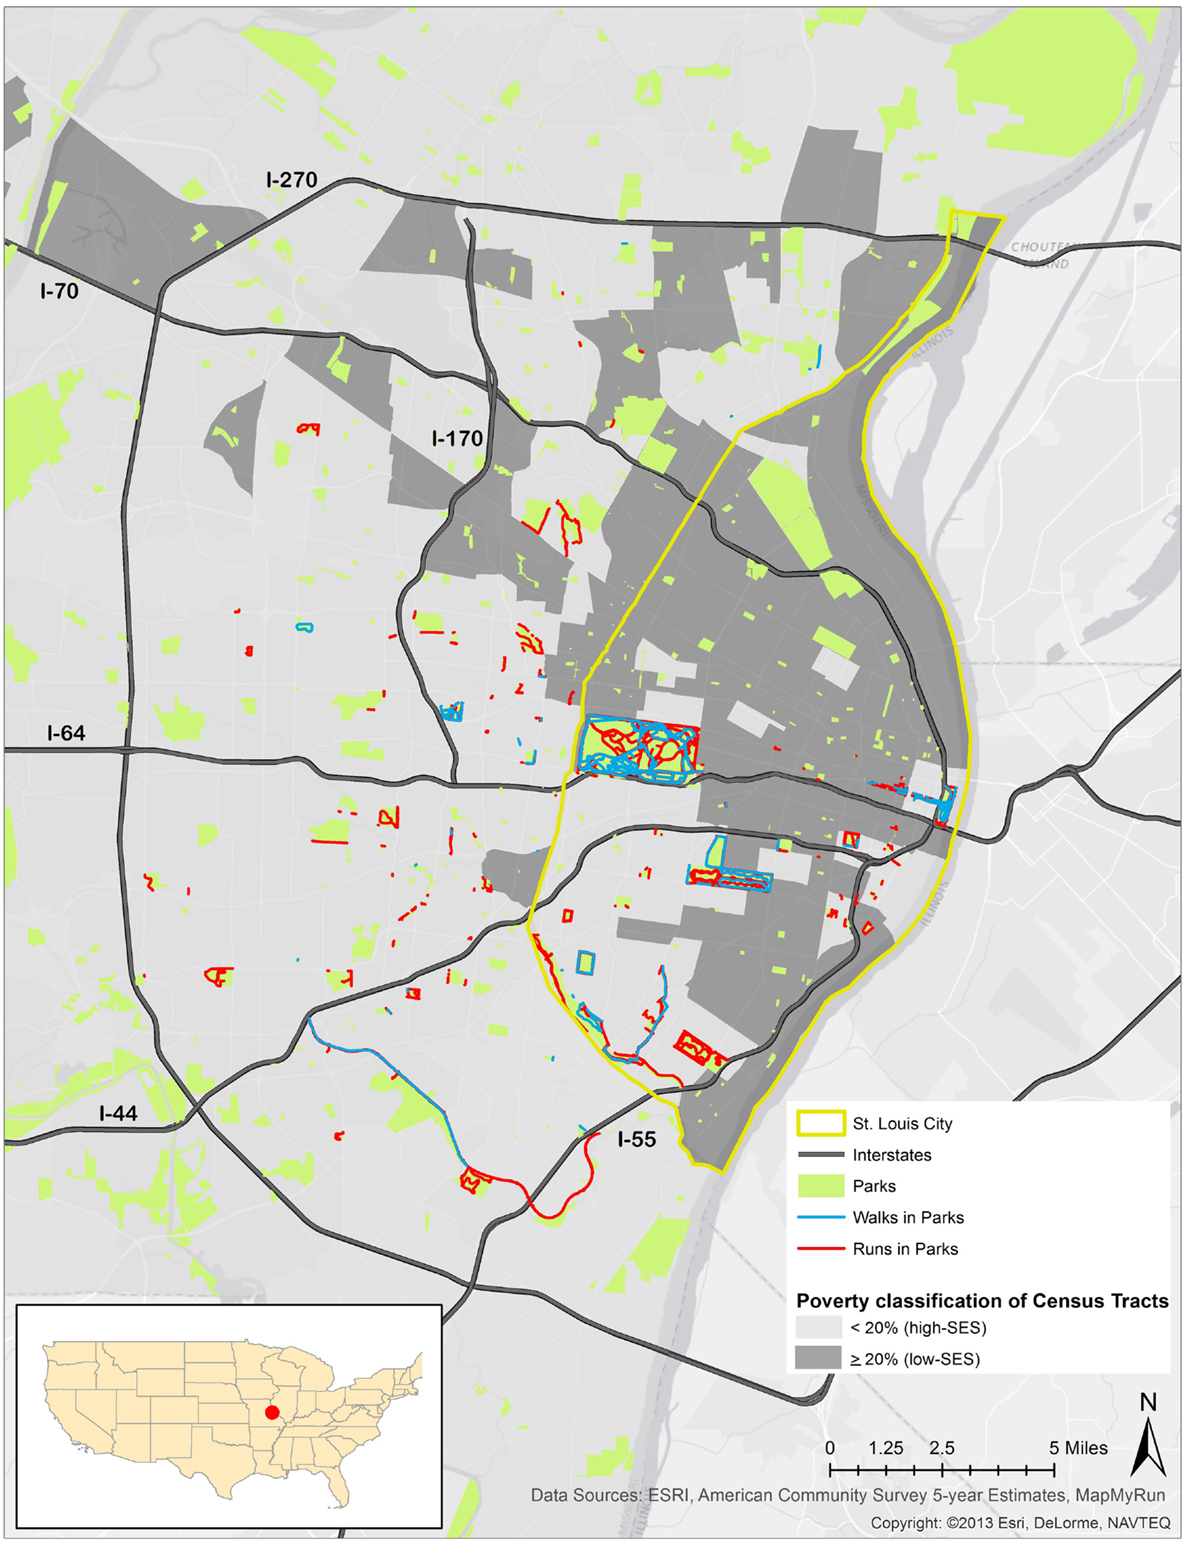
Figure 2. Running and walking routes in parks and poverty rate in St. Louis, MO, USA.
The odds of reported running and walking routes traversing low-SES neighborhoods were significantly lower than the odds of running and walking routes reported in higher-SES neighborhoods (runs: OR = 0.36, CI = 0.21–0.62; walks: OR = 0.41, CI = 0.23–0.73) (Table 2). The odds of running in a park in a low-SES neighborhood were 52% lower than running in a park in a higher-SES neighborhood (OR = 0.48, CI = 0.29–0.79). The odds of walking reported in a park in a low-SES neighborhood were 64% lower than walking in a park in a higher-SES neighborhood (OR = 0.36, CI = 0.16–0.82).
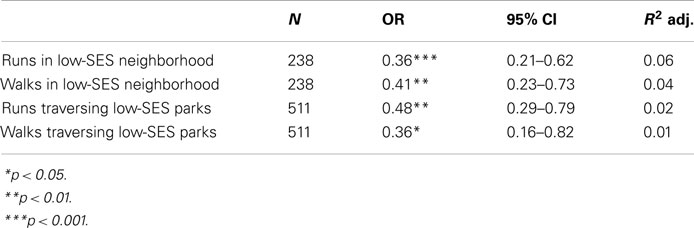
Table 2. Logistic regression: odds of running and walking in a low-SES neighborhood (N = 238) and park (N = 511), compared to higher-SES neighborhoods.
Revised results indicate decreased odds of reported running and walking in low-SES St. Louis neighborhoods compared to higher-SES St. Louis neighborhoods (Table 1). This finding is consistent with the disparate rates of PA in low versus higher-SES areas (1, 2). Overall, the lower odds of reported running and walking in low-SES neighborhoods and parks located in these low-SES neighborhoods compared to higher-SES neighborhoods and parks corroborates several health and environmental disparities between north and south St. Louis.
Conflict of Interest Statement
The authors declare that the research was conducted in the absence of any commercial or financial relationships that could be construed as a potential conflict of interest.
Acknowledgments
The authors would like to acknowledge the Open Space Council for the St. Louis region and Washington University in St. Louis University Research Strategic Alliance for providing the funding for this research.
References
1. Cohen DA, Marsh T, Williamson S, Derose KP, Martinez H, Setodji C, et al. Parks and physical activity: why are some parks used more than others? Prev Med (2010) 50(Suppl 1):S9–12. doi: 10.1016/j.ypmed.2009.08.020
Keywords: physical activity, parks, MapMyRun.com, socioeconomic status, web data feeds
Citation: Adlakha D, Budd EL, Gernes R, Sequeira S and Hipp JA (2015) Corrigendum: Use of emerging technologies to assess differences in outdoor physical activity in St. Louis, Missouri. Front. Public Health 3:41. doi: 10.3389/fpubh.2015.00041
Received: 26 November 2014; Paper pending published: 29 January 2015;
Accepted: 16 February 2015; Published online: 16 March 2015.
Edited by:
Dan J. Graham, Colorado State University, USAReviewed by:
Iffat Elbarazi, United Arab Emirates University, United Arab EmiratesRosemary M. Caron, University of New Hampshire, USA
Copyright: © 2015 Adlakha, Budd, Gernes, Sequeira and Hipp. This is an open-access article distributed under the terms of the Creative Commons Attribution License (CC BY). The use, distribution or reproduction in other forums is permitted, provided the original author(s) or licensor are credited and that the original publication in this journal is cited, in accordance with accepted academic practice. No use, distribution or reproduction is permitted which does not comply with these terms.
*Correspondence:ZGVlcHRpYUB3dXN0bC5lZHU=