 Shervin Assari
 Maryam Moghani Lankarani
- 1Department of Psychiatry, University of Michigan, Ann Arbor, MI, USA
- 2Center for Research on Ethnicity, Culture and Health, School of Public Health, University of Michigan, Ann Arbor, MI, USA
- 3Medicine and Health Promotion Institute, Tehran, Iran
Background: Although the effects of socioeconomic status (SES) on mortality are well established, these effects may vary based on contextual factors such as race and place. Using 25-year follow-up data of a nationally representative sample of adults in the U.S., this study had two aims: (1) to explore separate, additive, and multiplicative effects of race and place (urbanity) on mortality and (2) to test the effects of education and income on all-cause mortality based on race and place.
Methods: The Americans’ Changing Lives (ACL) Study followed Whites and Blacks 25 years and older from 1986 until 2011. The focal predictors were baseline SES (education and income) collected in 1986. The main outcome was time until death due to all causes from 1986 until 2011. Age, gender, behaviors (smoking and exercise), and health (chronic medical conditions, self-rated health, and depressive symptoms) at baseline were potential confounders. A series of survey Cox proportional hazard models were used to test protective effects of education and income on mortality based on race and urbanity.
Results: Race and place had separate but not additive or multiplicative effects on mortality. Higher education and income were protective against all-cause mortality in the pooled sample. Race and urbanity significantly interacted with baseline education but not income on all-cause mortality, suggesting that the protective effect of education but not income depend on race and place. While the protective effect of education were fully explained by baseline health status, the effect of income remained significant beyond health.
Conclusion: In the U.S., the health return associated with education depends on race and place. This finding suggests that populations differently benefit from SES resources, particularly education. Differential effect of education on employment and health care may explain the different protective effect of education based on race and place. Findings support the “diminishing returns” hypothesis for Blacks.
Introduction
The protective effects of socioeconomic status (SES; e.g., education and income) on health are consistently shown (1). Mirowsky and Ross described the effect of SES on health as “enduring, consistent, and growing” (2). State-of-the-art longitudinal studies, such as the Health and Retirement Study (HRS) (3), Americans’ Changing Lives (ACL) Study (4), Panel Study of Income Dynamics (5), British Cohort Study (BCS) (6), the British Whitehall Study (7), French GAZEL cohort (7), and Survey of Health, Aging and Retirement in Europe (SHARE) (8), have all shown that higher levels of education and income are associated with lower levels of morbidity (4) and mortality (9). Higher education and income enable individuals to avoid risks and minimize negative consequences as they occur (10, 11).
In the U.S., the education system and job market are both segregated by race, place, and social class (12, 13). As a result, even if they not drop out of school, Blacks do not have the same chance of receiving high-quality education (14, 15) or high-paying jobs (16, 17) as Whites. Thus, instead of having similar health effects across race, place, and social class (18), education and income may have differential protective effects across sub-populations (19, 20). If the school system is less resourced where Blacks live, the same education degree may have smaller effects on human capital for Blacks compared to Whites (14, 15). In addition, race also alters the effect of educational credentials on health through labor market advantages for Whites (21). However, it is still unknown if health gains associated with education and income depend on race and place (22–24).
Our knowledge of the effect of place on health is mostly limited only to the direct effect (25, 26). Research has shown that place influences health beyond individual-level factors (27) by conferring additional risk beyond individual SES status (28). Sastry argues that although SES partly explains why place (rural versus urban) causes disparities in health, interactions between SES and place also exist (29). As the neighborhood effects literature has mostly focused on the main effect of place on health (30), a question yet to be answered is whether place also alters the effects of SES resources on health. We still do not know whether protective effects of SES on health depend on place (31, 32). This research conceptualizes place as a moderator (33), which requires testing statistical interaction between place and social class (28). Very few studies have tested if the effects of race and place on disparities are independent, additive, sub-additive, or synergistic (34, 35).
This study investigated separate, additive, and multiplicative effects of race, place, and SES (education and income) on mortality. We were particularly interested in the moderating effects of race and place on the protective effects of baseline education and income (in 1986) on all-cause mortality during a 25-year follow-up in the U.S. We had three specific hypotheses: first, race and place would have separate, additive, and multiplicative effects on mortality. Second, the effects of education and income on mortality would be weaker for Blacks compared to Whites. Third, we expect urbanity to modify the effect of education and income on all-cause mortality. To provide generalizable results to the U.S., we used a nationally representative sample of American adults.
Materials and Methods
The ACL is a 25-year cohort study conducted from 1986 to 2011. The ACL study is the oldest ongoing longitudinal study with a nationally representative sample. The aim of the study is to investigate the role of a broad range of social, environmental, psychological, and behavioral factors (along with medical care) in health changes with age over the life course. The study began in 1986 with a national face-to-face survey of 3,617 adults ages 25 and up in the continental U.S. (36–41).
Participants
The ACL has enrolled a nationally representative sample of non-institutionalized U.S. adults (n = 3,617) aged 25 and older in 1986 (household response rate = 70%, individual response rate = 68%). Both individuals over 60 years of age and Blacks were oversampled (36–41). (Analytical sample = 3,361, composed of 2,205 Whites and 1,156 Blacks).
Process
Although four follow-up interviews were conducted with respondents, our analysis is restricted to baseline data and survival follow-up, neither of which depended on successful follow-up of respondents to the survey.
Measures
Demographic and SES characteristics were obtained from wave 1 interviews. Demographic covariates included gender (0 = male, 1 = female), race (0 = White, 1 = Black), and age in years (a continuous variable).
Race
Participant’s race was defined based on self-reported race and ethnicity, collected at baseline in 1986 with several survey items. Respondents gave an open-ended response to the question, “In addition to being American, what do you think of as your ethnic background or origins?” Respondents were then asked a multiple-choice question, “Are you white, black, American Indian, Asian, or another race?” and allowed to answer with multiple categories. Those who responded with more than one non-white group were asked to identify which “best described” their race. The survey also assessed the state or foreign country in which the respondent, respondent’s mother, and respondent’s father were born, and the respondent’s father’s last name. Finally, participants were asked “Are you of Spanish or Hispanic descent, that is, Mexican, Mexican–American, Chicano, Puerto Rican, Cuban, or Other Spanish?” Responses from the above questions were used to construct race categories of “Non-Hispanic White,” “Non-Hispanic Black,” “Non-Hispanic Native American,” “Non-Hispanic Asian,” and “Hispanic.” This study’s analysis only included Non-Hispanic White and Non-Hispanic Black respondents (38–41).
Urbanity
We collected information on urbanity at an individual level. We defined urbanity as a three-level categorical variable. Multiple items were used to define urbanity in this study. Categories included (1) inner cities (urban areas), defined as the centers (large or small) of cities, which are classified as metropolitan statistical areas greater than or equal to 50,000 people; (2) suburban areas, defined as suburbs to large or small central cities, and (3) rural areas, defined as other adjacent and outlying areas. Our urbanity measure is comparable with the Rural-Urban Continuum Codes, developed by the USDA Economic Research Service (42). This system distinguishes metropolitan (metro) counties by the population size of their metro area, and non-metropolitan (non-metro) counties by degree of urbanization and adjacency to a metro area or areas (42). These categories have major implications for capturing access to health-care services (43).
Education
Education, measured in 1986 as years of completed education, was the first SES predictor of interest. Due to low frequency of tertiary education among Blacks in 1986, we operationalized education in two ways: a continuous measure, reflecting years of education, and a three-level categorical variable (<12 years, 12 years, and >12 years). Other studies have operationalized education similarly (44–47).
Income
We measured baseline income (respondent and spouse total income) in 1986 as our second SES predictor of interest.
Chronic Medical Conditions
Number of chronic medical conditions (CMC) was measured using self-report data at baseline (1986). All participants were asked whether a health-care provider had ever told them they had any of the following seven focal conditions: hypertension, diabetes, chronic lung disease, heart disease, stroke, cancer, and arthritis. A sum score was calculated, ranging from 0 to 7. A detailed description on the measurement of CMC is provided elsewhere in House and colleagues (37).
Self-Rated Health
Respondents were asked to rate their self-rated health (SRH) as excellent, very good, good, fair, or poor. The literature has treated the SRH in three distinct ways, namely as a dichotomous variable, a nominal variable, and a continuous score (48–51). We treated SRH as a dichotomous variable. We collapsed it into two categories (fair/poor vs. excellent/very good/good), a cutoff point that is common in the literature (38).
Depressive Symptoms
Depressive symptoms were measured with an 11-item version of the Center for Epidemiological Studies-Depression scale (CES-D) (52). CES-D items measure the extent to which respondents felt depressed, happy, lonely, sad, that everything was an effort, that their sleep was restless, that people were unfriendly, that they did not feel like eating, that people dislike them, that they could not get going, and that they enjoyed life. Positively worded items were reverse coded. This abbreviated CES-D scale has shown acceptable reliability and a similar factor structure compared to the original version (53–55). Possible item responses were scored 1 (never or hardly ever) to 3 (most of the time). We used an average score of depressive symptoms, conceptualized as a continuous measure with a potential range from 1 to 3. Higher scores indicated greater severity of depressive symptoms (39–41).
Exercise
A physical activity index was derived from answers to survey questions regarding engagement in exercise, active sports, gardening/yard work, household chores, and walking. Higher scores on this index were indicative of more exercise frequency (36, 56).
Smoking
Information was collected on self-reported history of smoking. We used a dichotomous variable (current smoker = 1, never or ex-smoker = 0).
All-Cause Mortality
The main outcome variables were mortality from all causes, internal causes, and external causes. Information on all deaths from mid-1986 through 2011 was obtained through the National Death Index (NDI), death certificates, and also from informants. In most cases, time and cause of death were verified with death certificates. The handful of cases where death could not be verified with death certificates were reviewed carefully, and actual death was certain in all cases. Only in these cases, lacking death certificates was the date of death ascertained from the informants or the NDI report (39–41, 57, 58).
Statistical Analysis
Due to the complex sample design used in the ACL, Stata 13.0 (Stata Corp., College Station, TX, USA) was used for data analysis. Application of baseline weights provides rates and results that are generalizable to the US population in 1986. Taylor series linearization was used for estimation of SEs.
We estimated seven Cox proportional hazard models to determine the effects of education and income on mortality. Baseline SES (education and income) collected in 1986 was the focal predictor, time to death through 2011 from all causes was the main outcome, and age, gender, and health (CMC, SRH, and depressive symptoms) were confounders. Hazard ratios (HRs) with 95% confidence intervals are reported. A HR of <1 indicates a protective effect of the independent variable on the outcome. Because we consider multiple outcomes, we set p < 0.01 as the level of statistical significance. For comparability, all main effects and interaction terms were left in models if they were not significant.
Model 1 estimated age- and gender-adjusted effect of race. Model 2 tested age- and gender-adjusted effects of place. Model 3 estimated additive (combined) effects of race and place. Model 4 also controlled for SES, to test if education and income explain the effect of race and place on mortality. Model 5 also controls for health, in addition to SES. Models 3–5 also included interactions between race and place to test multiplicative effects of race and place. Model 6 and Model 7 included interaction terms between race and place with education and income. While Model 6 did not include health status, Model 7 controlled for baseline health.
Results
Table 1 shows descriptive statistics for the analytic sample overall and by race. While there were no race differences in age or gender (p > 0.05 for both comparisons), average education (12.69 years for Whites and 11.37 years for Blacks, p < 0.001) and income (USD 5,570 for Whites and USD 4,250 for Blacks, p < 0.001) were lower for Blacks than Whites. Mortality was higher among Blacks (39.41%) compared to Whites (35.66%) (p < 0.05).

Table 1. Distribution of the sample characteristics by race.
Table 2 reports results of five Cox proportional hazard models in the pooled sample. Model 1 reports the age- and gender-adjusted effect of race. Based on this model, race had a significant age- and gender-adjusted effect on mortality (HR = 1.42, 95% CI = 1.25–1.62). Model 2 reports age- and gender-adjusted effects of place. Based on Model 2, place also had a separate effect on mortality risk. Based on this model, compared to residing in the inner city, living in suburban areas (HR = 0.85, 95% CI = 0.70–1.03) was marginally associated with lower mortality risk, while residence in rural areas (HR = 0.80, 95% CI = 0.65–0.98) was significantly associated with lower mortality risk. Model 3 reports the additive effects of race and place. Based on this model, the effect of place on mortality did not remain above and beyond race (p > 0.05 for both living in suburban and rural areas). Model 4 also controls for SES and shows that education and income explain the effect of race on mortality. In this model, education (HR = 0.80, 95% CI = 0.71–0.91) and income (HR = 0.91, 95% CI = 0.89–0.94) were protective against mortality. Model 5 also controls for health, as well as SES. Based on this model, the effect of education on mortality is explained by health (p > 0.05). However, the effect of income on mortality stays in the model (HR = 0.94, 95% CI = 0.91–0.97). Based on Models 3–5, race and place did not have multiplicative effects, as interaction terms between race and urbanity were non-significant (p > 0.05 for all interactions terms).
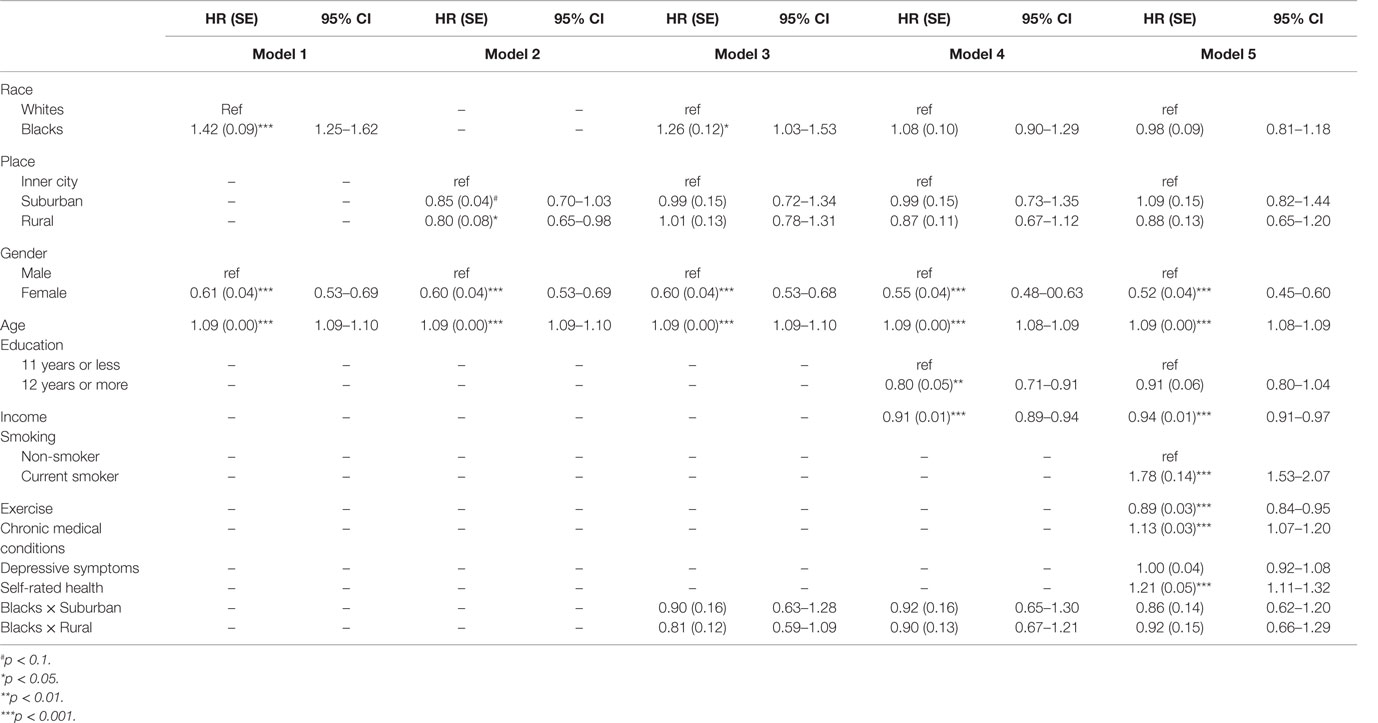
Table 2. Results of Cox proportional hazard models on the separate and additive and multiplicative effects of race and place on mortality.
Table 3 also shows two models (Model 6 and Model 7) that included interaction terms between race, place, education, and income. While Model 6 did not include health status, Model 7 also controlled for baseline health. Based on Model 6, race moderated the effect of education but not income on mortality. In this model, we found a significant interaction term between race and education (HR = 0.71, 95% CI = 0.50–0.99). This model also showed a marginally significant interaction between place and education (HR = 0.71, 95% CI = 0.48–1.04). In Model 7, which also controlled for health, the interaction term between race and education stayed significant (HR = 0.70, 95% CI = 0.50–0.98), but the interaction between place and education was explained by baseline health status (p > 0.05).
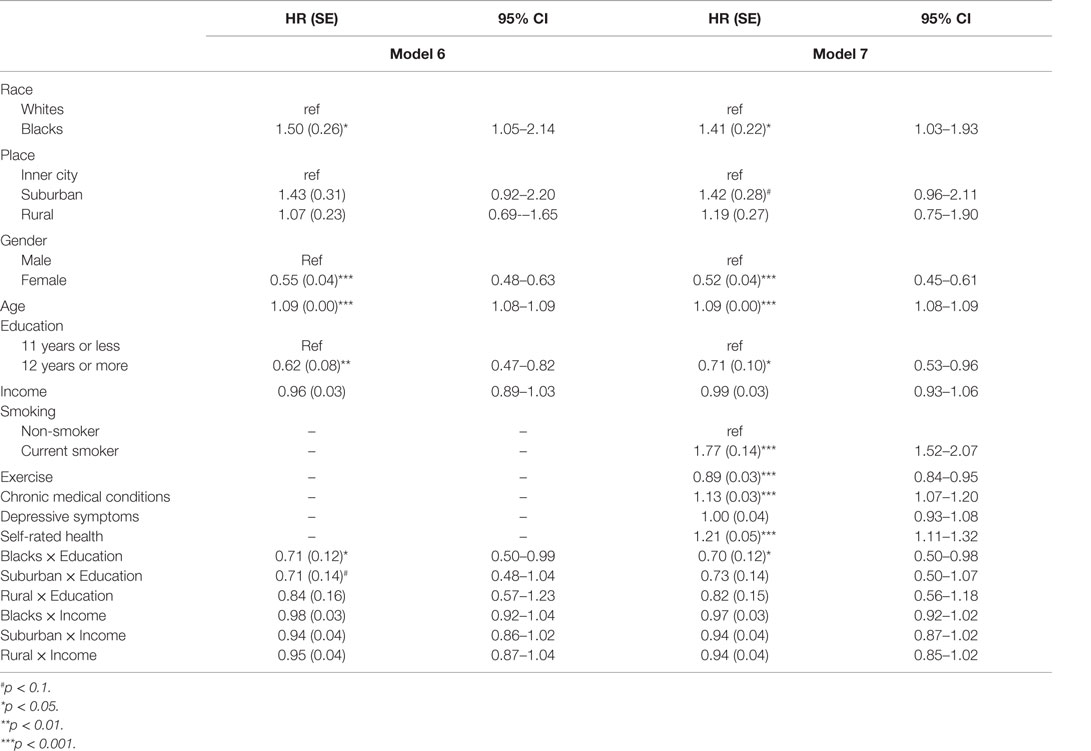
Table 3. Results of Cox proportional hazard models on the effects of baseline education and income on mortality based on race and place.
Discussion
Our study suggests that, in the U.S., the protective effects of education but not income on all-cause mortality is moderated by race and place. Our findings support the diminishing returns hypothesis for Blacks. Based on this hypothesis, as education levels increase, Blacks do not gain as much improvement in health as Whites (59–61). This hypothesis also suggests that disparity between Blacks and Whites is largest at the highest but not lowest SES levels (59). While the effect of race on health varies among low versus high SES levels, health effect of SES also depends on race (59, 62).
Previous research has suggested that protective effects of SES indicators against mortality are not necessarily uniform across sub-populations (1, 19, 20, 22, 63). This is possibly because education does not similarly improve life circumstances and does not similarly reduce exposure to risk and protective factors across various social groups (64). We argue that differential access to job and health care as well as differential pay based on race and place may explain differential survival benefits associated with education based on group membership.
Multiple previous studies have shown Black–White differences in the effect of SES indicators on health. A previous study showed a larger protective effect of education against mortality due to all causes as well as internal causes for Whites compared to Blacks1. In the National Longitudinal Mortality Study from 1979 to 1998, among non-Hispanic Blacks, there were step reductions in mortality at 12 and 16 years of education, with constant slopes between the steps. For Whites, each additional year of education had a stronger effect on decreasing mortality, but only among those with at least a high school diploma. Whites also showed a step reduction in mortality at 12 years of education (65). In another study on mortality data in the 1960s, education was linked to a lower risk of mortality for Whites but not Blacks (66). Everett and colleagues used the U.S. National Health Interview Survey-Linked Mortality sample and showed that race, gender, and cohort modified the effect of education on mortality, documenting significant changes across birth cohorts in the associations between education and mortality for White women and White men, but no such changes across cohorts of Black men (67). In a study by Hayward, Hummer, and Sasson, Whites showed an effect of education on mortality, but there was almost no association for Blacks in that period (66). Backlund and colleagues found that, for Blacks, there were step reductions in mortality at 12 and 16 years of education, with constant slopes between the steps. For Whites, each additional year of education had a stronger effect on decreasing mortality for those with a high school diploma (65). It has been also shown that education differently predicts behaviors (68) as well as CMC among Blacks and Whites (69, 70).
The magnitude of the health gain associated with educational attainment is conditional on the availability of other resources that can be gained or purchased by the income that such education generates. Availability of social resources (19, 20, 71), as well as purchase power associated with higher SES (67, 70, 72–76), are shaped by race, place, SES, and their intersections. SES does not independently affect health (in a vacuum), and its impact is specific to the context (9, 24, 71–73, 77–81). As Marmot has mentioned, it is not just important how many resources people have, but also what they can buy with those resources (82).
In line with our findings that the protective effect of education on mortality depends on place, Stafford and Marmot found that the effect of living in a deprived area was more marked for poorer individuals. The study used individual-level data from the Whitehall II study covering health, SES, and perceived status and census data on neighborhood deprivation. Authors concluded that living in a deprived neighborhood may have the most negative health effects on poorer individuals, possibly because poor individuals are more dependent on collective resources in the neighborhood (83). Proper and colleagues also found significant interactions between neighborhood SES and level of educational attainment in the contribution of total and vigorous occupational physical activity to total physical activity. Authors concluded that neighborhood SES functions as a moderator in the relationship between individual SES and occupational physical activity (84). Another study showed that death rates among people of low SES were highest in high SES neighborhoods, lower in moderate SES neighborhoods, and lowest in low SES neighborhoods. The study showed that differences were not merely due to individual-level risk factors (28).
In the U.S., place strongly influences employment opportunities, and race impacts employer choices as well as preferences and practices of the labor market (16, 17, 85). Structural inequalities due to race and place are well documented in the U.S. labor market (86). Racial wage inequality (87) and occupational segregation based on race and place (16, 88, 89) are a well-explained phenomenon in sociology and economics literature. Different earnings of Blacks and Whites, particularly for individuals with the highest levels of education, are indicative of inequalities in how education translates to income and subsequently income to health (90). A Black man with a master’s degree in 2006 earned $27,000 less than a White man with the same education. On top of individual income, due to lower chance of marriage, being Black significantly reduces household income and wealth (91). Even with the same employment opportunity, pay for an equal job is lower for Blacks than for Whites, a phenomenon called Black–White pay gaps (92). Similar effects can be attributed to place, which shapes job opportunities through residential segregation as well as job proximity (93). In addition, Blacks attend lower quality schools, which cause a differential effect of education on employment opportunities (94). All these factors explain the differential health gain due to education and income based on race and place.
Race, place, and other SES indicators may alter the health gains associated with education (22). As explained by David Williams, the effects of race and SES are not additive but multiplicative (72). That being said, health disparities are the product of complex and non-linear interactions between race, place, and SES factors, such as education (72). Our findings that race and place interact with education but not income suggest that, although race and place alter the health gains associated with education, income is universally protective, regardless of the context.
The results should be interpreted in the light of at least four limitations. First, education and income are both subject to change over time; however, we only measured their baseline status. Although this is likely a minor issue for education, income tends to change more over time. Second, our education measure is not on educational credentials but years of education completed. These two limitations cause measurement bias and may have impacted our magnitude of the association between education, income, and mortality. Third, our sample size was not equal based on race and place. As a result, statistical power may differ across groups. Fourth, due to the different distribution of education based on race and place, we could not use multiple education cut-offs and, thus, only used high school graduation. Despite the above limitations, this study extended the literature by showing that race and place alter long-term effects of education but not income on mortality in a nationally representative cohort.
To conclude, the protective effects of education but not income on mortality in the U.S. depend on race and place (i.e., urbanity). The lower health gain of educational attainment for Blacks compared to Whites is possibly due to structural racism, which even blocks gains associated with education for Blacks. Future research should explore mechanisms by which race and place alter the effects of health return associated with education in the U.S.
Informed Consent
All procedures followed were in accordance with the ethical standards of the responsible committee on human experimentation (institutional and national) with the Helsinki Declaration of 1975, as revised in 2000. Informed consent was obtained from all participants included in the study. The study protocol received approval by the Institutional Review Board of the University of Michigan.
Animal Studies
No animal studies were carried out by the authors for this article.
Author Contributions
SA designed the study, analyzed the data, and contributed to the revision. ML drafted the manuscript and revised the paper.
Conflict of Interest Statement
The authors declare that the research was conducted in the absence of any commercial or financial relationships that could be construed as a potential conflict of interest.
Acknowledgments
SA is supported by the Heinz C. Prechter Bipolar Research Fund and the Richard Tam Foundation at the University of Michigan Depression Center.
Funding
The Americans’ Changing Lives (ACL) survey was funded by the United States Department of Health and Human Services, National Institutes of Health, and National Institute on Aging (AG05561) and also Grant # AG018418 from the National Institute on Aging (DHHS/NIH). NIH is not responsible for the data collection or analyses represented in this article. The ACL study was conducted by the Institute of Social Research, University of Michigan.
Footnote
- ^Assari S. Racial disparities in the link between education and mortality in United States. JAMA (2016, under review).
References
1. Conti G, Heckman J, Urzua S. The education-health gradient. Am Econ Rev (2010) 100(2):234–8. doi: 10.1257/aer.100.2.234
3. Bowen ME, González HM. Childhood socioeconomic position and disability in later life: results of the health and retirement study. Am J Public Health (2010) 100(Suppl 1):S197–203. doi:10.2105/AJPH.2009.160986
4. Herd P, Goesling B, House JS. Socioeconomic position and health: the differential effects of education versus income on the onset versus progression of health problems. J Health Soc Behav (2007) 48(3):223–38. doi:10.1177/002214650704800302
5. McDonough P, Williams DR, House JS, Duncan GJ. Gender and the socioeconomic gradient in mortality. J Health Soc Behav (1999) 40(1):17–31. doi:10.2307/2676376
6. Johnson-Lawrence VD, Griffith DM, Watkins DC. The effects of race, ethnicity and mood/anxiety disorders on the chronic physical health conditions of men from a national sample. Am J Mens Health (2013) 7(4S):58S–67S. doi:10.1177/1557988313484960
7. Stringhini S, Dugravot A, Shipley M, Goldberg M, Zins M, Kivimäki M, et al. Health behaviours, socioeconomic status, and mortality: further analyses of the British Whitehall II and the French GAZEL prospective cohorts. PLoS Med (2011) 8(2):e1000419. doi:10.1371/journal.pmed.1000419
8. Leopold L, Engelhardt H. Education and physical health trajectories in old age. Evidence from the Survey of Health, Ageing and Retirement in Europe (SHARE). Int J Public Health (2013) 58(1):23–31. doi:10.1007/s00038-012-0399-0
9. Hummer RA, Hernandez EM. The effect of educational attainment on adult mortality in the United States. Population Bulletin (2013) 68(1):1–18.
10. Phelan JC, Link BG, Tehranifar P. Social conditions as fundamental causes of health inequalities: theory, evidence, and policy implications. J Health Soc Behav (2010) 51(Suppl):S28–40. doi:10.1177/0022146510383498
11. Link B, Phelan J. Social conditions as fundamental causes of disease. J Health Soc Behav (1995) 36(Extra Issue):80–94. doi:10.2307/2626958
12. Williams DR, Collins C. Racial residential segregation: a fundamental cause of racial disparities in health. Public Health Rep (2001) 116(5):404–16. doi:10.1016/S0033-3549(04)50068-7
13. Williams DR, Neighbors HW, Jackson JS. Racial/ethnic discrimination and health: findings from community studies. Am J Public Health (2008) 98(9 Suppl):S29–37. doi:10.2105/AJPH.98.Supplement_1.S29
14. Ferri B, Connor D. Tools of exclusion: race, disability, and (re) segregated education. Teach Coll Rec (2005) 107(3):453–74. doi:10.1111/j.1467-9620.2005.00483.x
15. Roscigno VJ. Race and the reproduction of educational disadvantage. Soc Forces (1998) 76(3):1033–61. doi:10.1093/sf/76.3.1033
16. Spalter-Roth R. Race and ethnicity in the labor market; employer practices and worker strategies. Handbooks of the Sociology of Racial and Ethnic Relations. USA: Springer (2007). p. 263–83.
17. Altonji JG, Blank RM. Race and gender in the labor market. Handb Labor Econ (1999) 3:3143–59. doi:10.1016/S1573-4463(99)30039-0
18. Mackenbach JP, Stirbu I, Roskam AJ, Schaap MM, Menvielle G, Leinsalu M, et al. Socioeconomic inequalities in health in 22 European countries. N Engl J Med (2008) 358(23):2468–81. doi:10.1056/NEJMsa0707519
19. Montez JK, Hayward MD, Brown DC, Hummer RA. Why is the educational gradient of mortality steeper for men? J Gerontol B Psychol Sci Soc Sci (2009) 64(5):625–34. doi:10.1093/geronb/gbp013
20. Zajacova A, Hummer RA. Gender differences in education effects on all-cause mortality for white and black adults in the United States. Soc Sci Med (2009) 69(4):529–37. doi:10.1016/j.socscimed.2009.06.028
21. Bound J, Freeman RB. What Went Wrong? The Erosion of Relative Earnings and Employment among Young Black Men in the 1980s (No. w3778). Cambridge, MA: National Bureau of Economic Research (1991).
22. Annang L, Walsemann KM, Maitra D, Kerr JC. Does education matter? Examining racial differences in the association between education and STI diagnosis among Black and White young adult females in the U.S. Public Health Rep (2010) 125(Suppl 4):110–21.
23. Chen E, Martin AD, Matthews KA. Understanding health disparities: the role of race and socioeconomic status in children’s health. Am J Public Health (2006) 96(4):702–8. doi:10.2105/AJPH.2004.048124
24. Gilman SE, Breslau J, Conron KJ, Koenen KC, Subramanian SV, Zaslavsky AM. Education and race-ethnicity differences in the lifetime risk of alcohol dependence. J Epidemiol Community Health (2008) 62(3):224–30. doi:10.1136/jech.2006.059022
25. Diez Roux AV, Mair C. Neighborhoods and health. Ann N Y Acad Sci (2010) 1186:125–45. doi:10.1111/j.1749-6632.2009.05333.x
26. Diez Roux AV. Neighborhoods and health: where are we and were do we go from here? Rev Epidemiol Sante Publique (2007) 55(1):13–21. doi:10.1016/j.respe.2006.12.003
27. Winkleby MA, Cubbin C. Influence of individual and neighbourhood socioeconomic status on mortality among black, Mexican-American, and white women and men in the United States. J Epidemiol Community Health (2003) 57(6):444–52. doi:10.1136/jech.57.6.444
28. Winkleby M, Cubbin C, Ahn D. Effect of cross-level interaction between individual and neighborhood socioeconomic status on adult mortality rates. Am J Public Health (2006) 96(12):2145–53. doi:10.2105/AJPH.2004.060970
29. Sastry N. What explains rural-urban differentials in child mortality in Brazil? Soc Sci Med (1997) 44(7):989–1002. doi:10.1016/S0277-9536(96)00224-9
30. Durlauf SN. Neighborhood effects. Handb Reg Urban Econ (2004) 4:2173–242. doi:10.1016/S1574-0080(04)80007-5
31. Lahana E, Pappa E, Niakas D. The impact of ethnicity, place of residence and socioeconomic status on health-related quality of life: results from a Greek health survey. Int J Public Health (2010) 55(5):391–400. doi:10.1007/s00038-010-0171-2
32. Kuate-Defo B. Interactions between socioeconomic status and living arrangements in predicting gender-specific health status among the elderly in Cameroon. Aging in Sub-Saharan Africa: Recommendations for Furthering Research. Washington, DC: The National Academies (2006). p. 276–313.
33. Markham WA, Lopez ML, Aveyard P, Herrero P, Bridle C, Comas A, et al. Mediated, moderated and direct effects of country of residence, age, and gender on the cognitive and social determinants of adolescent smoking in Spain and the UK: a cross-sectional study. BMC Public Health (2009) 9:173. doi:10.1186/1471-2458-9-173
34. Uthman OA, Moradi T, Lawoko S. The independent contribution of individual-, neighbourhood-, and country-level socioeconomic position on attitudes towards intimate partner violence against women in sub-Saharan Africa: a multilevel model of direct and moderating effects. Soc Sci Med (2009) 68(10):1801–9. doi:10.1016/j.socscimed.2009.02.045
35. Arnold M, Hsu L, Pipkin S, McFarland W, Rutherford GW. Race, place and AIDS: the role of socioeconomic context on racial disparities in treatment and survival in San Francisco. Soc Sci Med (2009) 69(1):121–8. doi:10.1016/j.socscimed.2009.04.019
36. House JS, Lepkowski JM, Kinney AM, Mero RP, Kessler RC, Herzog AR. The social stratification of aging and health. J Health Soc Behav (1994) 35(3):213–34. doi:10.2307/2137277
37. House JS, Kessler RC, Herzog AR. Age, socioeconomic status, and health. Milbank Q (1990) 68(3):383–411. doi:10.2307/3350111
38. Assari S, Lankarani MM, Burgard S. Black-white difference in long-term predictive power of self-rated health on all-cause mortality in United States. Ann Epidemiol (2015).
39. Assari S, Burgard S. Black-White differences in the effect of baseline depressive symptoms on deaths due to renal diseases: 25 year follow up of a nationally representative community sample. J Renal Inj Prev (2015) 4(4):127–34. doi:10.12861/jrip.2015.27
40. Assari S, Moazen-Zadeh E, Lankarani MM, Micol-Foster V. Race, depressive symptoms, and all-cause mortality in the United States. Front Public Health (2016) 4:40. doi:10.3389/fpubh.2016.00040
41. Moazen-Zadeh E, Assari S. Depressive symptoms predict major depressive disorder after 15 years among whites but not blacks. Front Public Health (2016) 4:13. doi:10.3389/fpubh.2016.00013
42. U.S. Department of Agriculture. USDA Economic Research Service-Documentation. (2016). Available from: http://www.ers.usda.gov/data-products/rural-urban-continuum-codes/documentation.aspx
43. Hall SA, Kaufman JS, Ricketts TC. Defining urban and rural areas in U.S. epidemiologic studies. J Urban Health (2006) 83(2):162–75. doi:10.1007/s11524-005-9016-3
44. Rosenbaum J. Degrees of health disparities: health status disparities between young adults with high school diplomas, sub-baccalaureate degrees, and baccalaureate degrees. Health Serv Outcomes Res Methodol (2012) 12(2–3):156–68. doi:10.1007/s10742-012-0094-x
45. Zajacova A. Health in working-aged Americans: adults with high school equivalency diploma are similar to dropouts, not high school graduates. Am J Public Health (2012) 102(Suppl 2):S284–90. doi:10.2105/AJPH.2011.300524
46. Liu SY, Buka SL, Linkletter CD, Kawachi I, Kubzansky L, Loucks EB. The association between blood pressure and years of schooling versus educational credentials: test of the sheepskin effect. Ann Epidemiol (2011) 21(2):128–38. doi:10.1016/j.annepidem.2010.11.004
47. Liu SY, Chavan NR, Glymour MM. Type of high-school credentials and older age ADL and IADL limitations: is the GED credential equivalent to a diploma? Gerontologist (2013) 53(2):326–33. doi:10.1093/geront/gns077
48. Singh-Manoux A, Martikainen P, Ferrie J, Zins M, Marmot M, Goldberg M. What does self rated health measure? Results from the British Whitehall II and French Gazel cohort studies. J Epidemiol Community Health (2006) 60(4):364e72. doi:10.1136/jech.2005.039883
49. Perlman F, Bobak M. Determinants of self rated health and mortality in Russia – are they the same? Int J Equity Health (2008) 25(7):19. doi:10.1186/1475-9276-7-19
50. Manor O, Matthews S, Power C. Dichotomous or categorical response? Analysing self-rated health and lifetime social class. Int J Epidemiol (2000) 29(1):149e57. doi:10.1093/ije/29.1.149
51. Schnittker J, Bacak V. The increasing predictive validity of self-rated health. PLoS One (2014) 9(1):e84933. doi:10.1371/journal.pone.0084933
52. Radloff LS. The CES-D scale: a self-report depression scale for research in the general population. Appl Psychol Meas (1977) 1:385e401. doi:10.1177/014662167700100306
53. Amtmann D, Kim J, Chung H, Bamer AM, Askew RL, Wu S, et al. Comparing CESD-10, PHQ-9, and PROMIS depression instruments in individuals with multiple sclerosis. Rehabil Psychol (2014) 59(2):220e9. doi:10.1037/a0035919
54. Zhang W, O’Brien N, Forrest JI, Salters KA, Patterson TL, Montaner JS, et al. Validating a shortened depression scale (10 item CES-D) among HIV-positive people in British Columbia, Canada. PLoS One (2012) 7(7):e40793. doi:10.1371/journal.pone.0040793
55. Andresen EM, Malmgren JA, Carter WB, Patrick DL. Screening for depression in well older adults: evaluation of a short form of the CES-D (Center for Epidemiologic Studies Depression Scale). Am J Prev Med (1994) 10(2):77e84.
56. Lantz PM, Golberstein E, House JS, Morenoff J. Socioeconomic and behavioral risk factors for mortality in a national 19-year prospective study of U.S. adults. Soc Sci Med (2010) 70(10):1558–66. doi:10.1016/j.socscimed.2010.02.003
57. Grossman M, Hanushek E, Welch F. Chapter 10: education and nonmarket outcomes. Handbook of the Economics of Education. (Vol. 1), Amsterdam: Elsevier (2006). p. 577–633.
58. Brunello G, Fort M, Schneeweis N, Winter-Ebmer R. The causal effect of education on health: what is the role of health behaviors? Health Econ (2015).
59. Farmer MM, Ferraro KF. Are racial disparities in health conditional on socioeconomic status? Soc Sci Med (2005) 60(1):191–204. doi:10.1016/j.socscimed.2004.04.026
60. Gavin AR, Walton E, Chae DH, Alegria M, Jackson JS, Takeuchi D. The associations between socio-economic status and major depressive disorder among Blacks, Latinos, Asians and non-Hispanic Whites: findings from the Collaborative Psychiatric Epidemiology Studies. Psychol Med (2010) 40(1):51–61. doi:10.1017/S0033291709006023
61. Monnat SM. Race/ethnicity and the socioeconomic status gradient in women’s cancer screening utilization: a case of diminishing returns? J Health Care Poor Underserved (2014) 25(1):332–56. doi:10.1353/hpu.2014.0050
62. Barbeau EM, Krieger N, Soobader MJ. Working class matters: socioeconomic disadvantage, race/ethnicity, gender, and smoking in NHIS 2000. Am J Public Health (2004) 94(2):269–78. doi:10.2105/AJPH.94.2.269
63. Amin V, Behrman JR, Spector TD. Does more schooling improve health outcomes and health related behaviors? Evidence from U.K. Twins. Econ Educ Rev (2013) 1:35. doi:10.1016/j.econedurev.2013.04.004
64. Paschall MJ, Bersamin M, Flewelling RL. Racial/ethnic differences in the association between college attendance and heavy alcohol use: a national study. J Stud Alcohol (2005) 66(2):266–74. doi:10.15288/jsa.2005.66.266
65. Backlund E, Sorlie PD, Johnson NJ. A comparison of the relationships of education and income with mortality: the National Longitudinal Mortality Study. Soc Sci Med (1999) 49(10):1373–84. doi:10.1016/S0277-9536(99)00209-9
66. Hayward MD, Hummer RA, Sasson I. Trends and group differences in the association between educational attainment and U.S. adult mortality: implications for understanding education’s causal influence. Soc Sci Med (2015) 127:8–18. doi:10.1016/j.socscimed.2014.11.024
67. Everett BG, Rehkopf DH, Rogers RG. The nonlinear relationship between education and mortality: an examination of cohort, race/ethnic, and gender differences. Popul Res Policy Rev (2013) 32:6. doi:10.1007/s11113-013-9299-0
68. Assari S, Moghani Lankarani M. Education and alcohol consumption among Older Americans; Black-White differences. Front Public Health (2016) 4:67. doi:10.3389/fpubh.2016.00067
69. Non AL, Gravlee CC, Mulligan CJ. Education, genetic ancestry, and blood pressure in African Americans and Whites. Am J Public Health (2012) 102(8):1559–65. doi:10.2105/AJPH.2011.300448
70. Assari S. Combined racial and gender differences in the long-term predictive role of education on depressive symptoms and chronic medical conditions. J Racial Ethn Health Dis (2016). doi:10.1007/s40615-015-0202-z
71. Mackenbach JP, Kulhánová I, Bopp M, Deboosere P, Eikemo TA, Hoffmann R, et al. Variations in the relation between education and cause-specific mortality in 19 European populations: a test of the “fundamental causes” theory of social inequalities in health. Soc Sci Med (2015) 127:51–62. doi:10.1016/j.socscimed.2014.05.021
72. Williams DR, Mohammed SA, Leavell J, Collins C. Race, socioeconomic status, and health: complexities, ongoing challenges, and research opportunities. Ann N Y Acad Sci (2010) 1186(1):69–101. doi:10.1111/j.1749-6632.2009.05339.x
73. Colen CG. Addressing racial disparities in health using life course perspectives. Du Bois Rev Soc Sci Res Race (2011) 8(1):79–94. doi:10.1017/S1742058X11000075
74. Crimmins EM, Hayward MD, Seeman TE. Race/ethnicity, socioeconomic status, and health. Critical Perspectives on Racial and Ethnic Differences in Health in Late Life. (2004). p. 310–52.
75. Montez JK, Hummer RA, Hayward MD, Woo H, Rogers RG. Trends in the educational gradient of US adult mortality from 1986 through 2006 by race, gender, and age group. Res Aging (2011) 33(2):145–71. doi:10.1177/0164027510392388
76. Masters RK. Uncrossing the US black-white mortality crossover: the role of cohort forces in life course mortality risk. Demography (2012) 49(3):773–96. doi:10.1007/s13524-012-0107-y
77. Phelan JC, Bruce G. Is race a fundamental cause of inequalities in health? Annu Rev Sociol (2014) 41:1.
78. Montez JK, Zajacova A. Why have educational disparities in mortality increased among white women in the United States? Policy brief. J Health Soc Behav (2013) 54(2):165. doi:10.1177/0022146513491066
79. Read JN, Gorman BK. Gender and health inequality. Annu Rev Sociol (2010) 36:371–86. doi:10.1146/annurev.soc.012809.102535
80. Hummer RA, Chinn JJ. Race/ethnicity and U.S. adult mortality: progress, prospects, and new analyses. Du Bois Rev (2011) 8(1):5–24. doi:10.1017/S1742058X11000051
81. Hicken MT, Gee GC, Morenoff J, Connell CM, Snow RC, Hu H. A novel look at racial health disparities: the interaction between social disadvantage and environmental health. Am J Public Health (2012) 102(12):2344–51. doi:10.2105/AJPH.2012.300774
83. Stafford M, Marmot M. Neighbourhood deprivation and health: does it affect us all equally? Int J Epidemiol (2003) 32(3):357–66. doi:10.1093/ije/dyg084
84. Proper KI, Cerin E, Owen N. Neighborhood and individual socio-economic variations in the contribution of occupational physical activity to total physical activity. J Phys Act Health (2006) 3(2):179.
85. Proudford KL, Nkomo S. Race and ethnicity in organizations. Handbook of Workplace Diversity. (2006). p. 323–44.
86. Grodsky E, Pager D. The structure of disadvantage: individual and occupational determinants of the black-white wage gap. Am Sociol Rev (2001) 66(4):542–67. doi:10.2307/3088922
87. Huffman ML, Cohen PN. Racial wage inequality: job segregation and devaluation across US labor markets. Am J Sociol (2004) 109(4):902–36. doi:10.1086/378928
88. Bergmann BR. Occupational segregation, wages and profits when employers discriminate by race or sex. East Econ J (1974) 1(2):103–10.
89. Western B, Pettit B. Black-White wage inequality, employment rates, and incarceration. Am J Sociol (2005) 111(2):553–78. doi:10.1086/432780
91. IWPR. Importance of Social Security by Gender, Race/Ethnicity, and Marital Status. Washington, DC (2010).
92. Tomaskovic-Devey D. The gender and race composition of jobs and the male/female, white/black pay gaps. Soc Forces (1993) 72(1):45–76. doi:10.1093/sf/72.1.45
93. Jencks C, Mayer SE. Residential segregation, job proximity, and black job opportunities. Inner-City Poverty in the United States. (1990). p. 187–222.
Keywords: ethnic groups, Blacks, Whites, socioeconomic status, education, income, urbanity, mortality
Citation: Assari S and Lankarani MM (2016) Race and Urbanity Alter the Protective Effect of Education but not Income on Mortality. Front. Public Health 4:100. doi: 10.3389/fpubh.2016.00100
Received: 04 March 2016; Accepted: 02 May 2016;
Published: 20 May 2016
Edited by:
Martine Hackett, Hofstra University, USAReviewed by:
Peter John Somerford, Department of Health Western Australia, AustraliaKate E. Beatty, East Tennessee State University, USA
Copyright: © 2016 Assari and Lankarani. This is an open-access article distributed under the terms of the Creative Commons Attribution License (CC BY). The use, distribution or reproduction in other forums is permitted, provided the original author(s) or licensor are credited and that the original publication in this journal is cited, in accordance with accepted academic practice. No use, distribution or reproduction is permitted which does not comply with these terms.
*Correspondence: Shervin Assari, YXNzYXJpQHVtaWNoLmVkdQ==