Abstract
Background:
Artificial intelligence has far surpassed previous related technologies in image recognition and is increasingly used in medical image analysis. We aimed to explore the diagnostic accuracy of the models based on deep learning or radiomics for lung cancer staging.
Methods:
Studies were systematically reviewed using literature searches from PubMed, EMBASE, Web of Science, and Wanfang Database, according to PRISMA guidelines. Studies about the diagnostic accuracy of radiomics and deep learning, including the identifications of lung cancer, tumor types, malignant lung nodules and lymph node metastase, were included. After identifying the articles, the methodological quality was assessed using the QUADAS-2 checklist. We extracted the characteristic of each study; the sensitivity, specificity, and AUROC for lung cancer diagnosis were summarized for subgroup analysis.
Results:
The systematic review identified 19 eligible studies, of which 14 used radiomics models and 5 used deep learning models. The pooled AUROC of 7 studies to determine whether patients had lung cancer was 0.83 (95% CI 0.78–0.88). The pooled AUROC of 9 studies to determine whether patients had NSCLC was 0.78 (95% CI 0.73–0.83). The pooled AUROC of the 6 studies that determined patients had malignant lung nodules was 0.79 (95% CI 0.77–0.82). The pooled AUROC of the other 6 studies that determined whether patients had lymph node metastases was 0.74 (95% CI 0.66–0.82).
Conclusion:
The models based on deep learning or radiomics have the potential to improve diagnostic accuracy for lung cancer staging.
Systematic Review Registration:
https://inplasy.com/inplasy-2022-3-0167/, identifier: INPLASY202230167.
Introduction
Lung cancer is one of the most common malignancies globally and the leading cause of cancer-related death in the world. Its morbidity and cancer-related mortality rank first among malignant tumors. There are ~2.2 million new cases and about 1.5 million deaths worldwide (1).
Radiomics and deep learning, as an innovative means to characterize lung lesions, can be applied to generate descriptive data, build predictive model, and correlate quantitative image features with phenotypes or gene-protein signatures, thus aiding in cancer detection, diagnosis, staging, treatment response prediction, and prognosis assessment and playing an increasingly important role in clinical decision-making, especially the management of malignant tumors (2).
Lung cancer staging is usually done by radiologists evaluating CT images of patients with lung cancer. The accuracy of diagnosis is affected by various factors, such as device performance, standardized imaging protocols, the experience of the reporting radiologist, and patient-specific factors. While radiomics involves using advanced computational algorithms to extract large numbers of researcher-defined features from images for defining related lung lesions, studies suggesting that deep learning algorithms can identify a more nuanced approach that eschews traditional radiology and statistical methods for cancer staging were extensively reported (3–6). Deep learning, as a new research direction in the field of machine learning (ML), is applied to learn the inherent laws and representation levels of sample data for feature recognition and model building (7). In the last decade, radiomics models and deep learning have made meaningful contributions to medical imaging diagnosis and related individual medicine (8).
This study aimed to perform a systematic review and meta-analysis of published data on lung cancer diagnosis and the diagnostic accuracy of deep learning algorithms and radiomics models for lung cancer staging.
Methods
Search Strategy
This study followed the Preferred Reporting Item of the Guidelines for Systematic Reviews and Meta-Analysis (PRISMA), and selection criteria, data extraction, and data analysis were determined before study initiation. Any eligible studies in the PubMed, EMBASE, Web of Science, and Wanfang Database will be searched by Cancer, Radiomics, Deep Learning, Lung Cancer, and more. The search method is shown in Table 1. Search terms such as “radiomics,” “deep learning,” “lymph node metastasis,” “non-small cell lung cancer,” “malignant lung nodules,” and “diagnostic accuracy.” Use the Boolean operator AND to combine the results of different queries. We also manually searched the reference lists of included studies to identify any relevant articles. Both English and Chinese articles are considered eligible.
Table 1
| Sources | Search in | MeSH terms | Limits | Search results |
|---|---|---|---|---|
| Web of science | Search manager | (“deep learning” OR “convolutional neural network” OR “machine learning” OR “radiomics” OR “radiomic”) AND (“CT” OR “MRI”) AND (“Lymph node” OR “lymph node metastasis” OR “Benign and malignant pulmonary nodules”)AND (“lung cancer” OR “non-small cell lung cancer” OR “NSCLC”) | None | 11 |
| PubMed, (MEDLINE) | N/A | (“deep learning” OR “convolutional neural network” OR “machine learning” OR “radiomics” OR “radiomic”) AND (“CT” OR “MRI”) AND (“Lymph node” OR “lymph node metastasis” OR “benign and malignant pulmonary nodules”) AND (“lung cancer” OR “non-small cell lung cancer” OR “NSCLC”) | None | 30 |
| EMBASE | Quick search | (‘deep learning'/exp OR “deep learning” OR “machine learning”/exp OR “machine learning” OR “radiomics”/exp OR “radiomics” OR “radiomic”) AND (“ct”/exp OR “ct” OR “mri”/exp OR “mri”) AND (“lymph node”/exp OR “lymph node” OR “lymph node metastasis”/exp OR “lymph node metastasis” OR “benign and malignant pulmonary nodules”) AND (“lung cancer”/exp OR “non-small cell lung cancer” OR “NSCLC”) | None | 56 |
| Wanfang database | N/A | (“deep learning” OR “machine learning” OR “radiomics” OR “radiomic”) AND (“CT” OR “MRI”) AND (“Lymph node” OR “lymph node metastasis”) AND (“lung cancer” OR “NSCLC”) | None | 5 |
Search strategy.
Study Selection
We selected publications for review if they met several of the following inclusion criteria: (1) patients with pathologically diagnosed lung cancer were included in the study; (2) radiomics or deep learning algorithms applied to lung cancer staging were evaluated. Exclusion criteria included: (1) informal publication types (e.g., reviews, letters to the editor, editorials, conference abstracts); (2) only focus on research on image segmentation or image feature extraction methods; (3) animal studies. After the removal of duplicates, titles and abstracts were identified by two independent reviewers using the Covidence systematic review software. Any disagreements will be resolved by consensus by arbitration by a third author.
Data Extraction
We reviewed data from selected primary studies using standardized forms, and two reviewers independently extracted data from each eligible study. Data extraction for each study included first author, country, year of publication, type of AI model, number of patients, patient characteristics (mean/median age, gender), type of malignancy, benign and malignant pulmonary nodules, lymph node metastasis. In addition, we extracted the area under the receiver operating characteristic curve (AUROC), along with sensitivity, specificity, accuracy, etc., for data processing and forest map production. The primary endpoint of this systematic review was AUROC.
Quality Assessment
Two independent reviewers will initially assess the risk of bias. A third reviewer will then review each study using the Quality Assessment of Studies for Diagnostic Accuracy (QUADAS-2) guidelines. The QUADAS-2 tool can assign a risk of bias rating of “low,” “high,” or “uncertain” based on the answer to “yes,” “no,” or “uncertain” to the relevant flag questions included in each section. For example, if the answer to all the landmark questions in a range is “yes,” then it can be rated as low risk of bias; if all the informational questions are answered “no,” then the risk of bias is rated as “high” (9). We summarized the risk of bias in individual studies in a narrative summary during the systematic review phase.
Statistical Analysis
The accuracy measures for this diagnostic meta-analysis included pooled sensitivity, pooled specificity, and their 95% confidence intervals (95% CI). Missing data is calculated using the formula in Table 2. At the same time, AUROC was calculated; an AUROC value close to 1.0 indicates that the test can discriminate almost perfectly, while an AUROC value close to 0.5 means poor discrimination (10, 11). The discordance index (I2) was used (12). Heterogeneity was assessed as low, medium, and high, with upper limits for I2 of 25, 50, and 75%, respectively. A forest plot was drawn to show the AUROC estimates relative to the summary pooled estimates for each study. In addition, we will draw a funnel plot to assess publication bias more intuitively. All statistical analyses were performed using STATA V16.0 software.
Table 2
| Measure | Formula |
|---|---|
| Sensitivity | |
| Specificity | |
| Accuracy | |
| PPV | |
| NPV | |
| SE | |
| 95% Confidence interval | bestestimate +/− (1.96) * (SE) |
Formulas.
P, condition positive; N, condition negative; FN, false negative; FP, false positive; TN, true negative and TP, true positive; PPV, positive predictive value; NPV, negative predictive value; Upper limit, upper limit of confidence interval; Lower limit, lower limit of confidence interval; SE, standard error.
Results
Study Selection
Our search identified 74 studies, with 56 screened after removing duplicates. Of these, 27 did not meet the inclusion criteria based on title and abstract. The remaining 29 full manuscripts were individually assessed, and, finally, 22 studies were eligible and included in our systematic review. Of these, 19 papers were available for meta-analysis, and five articles were excluded because of their insufficient data information. We outline the study selection process for review using the PRISMA flowchart (Figure 1).
Figure 1
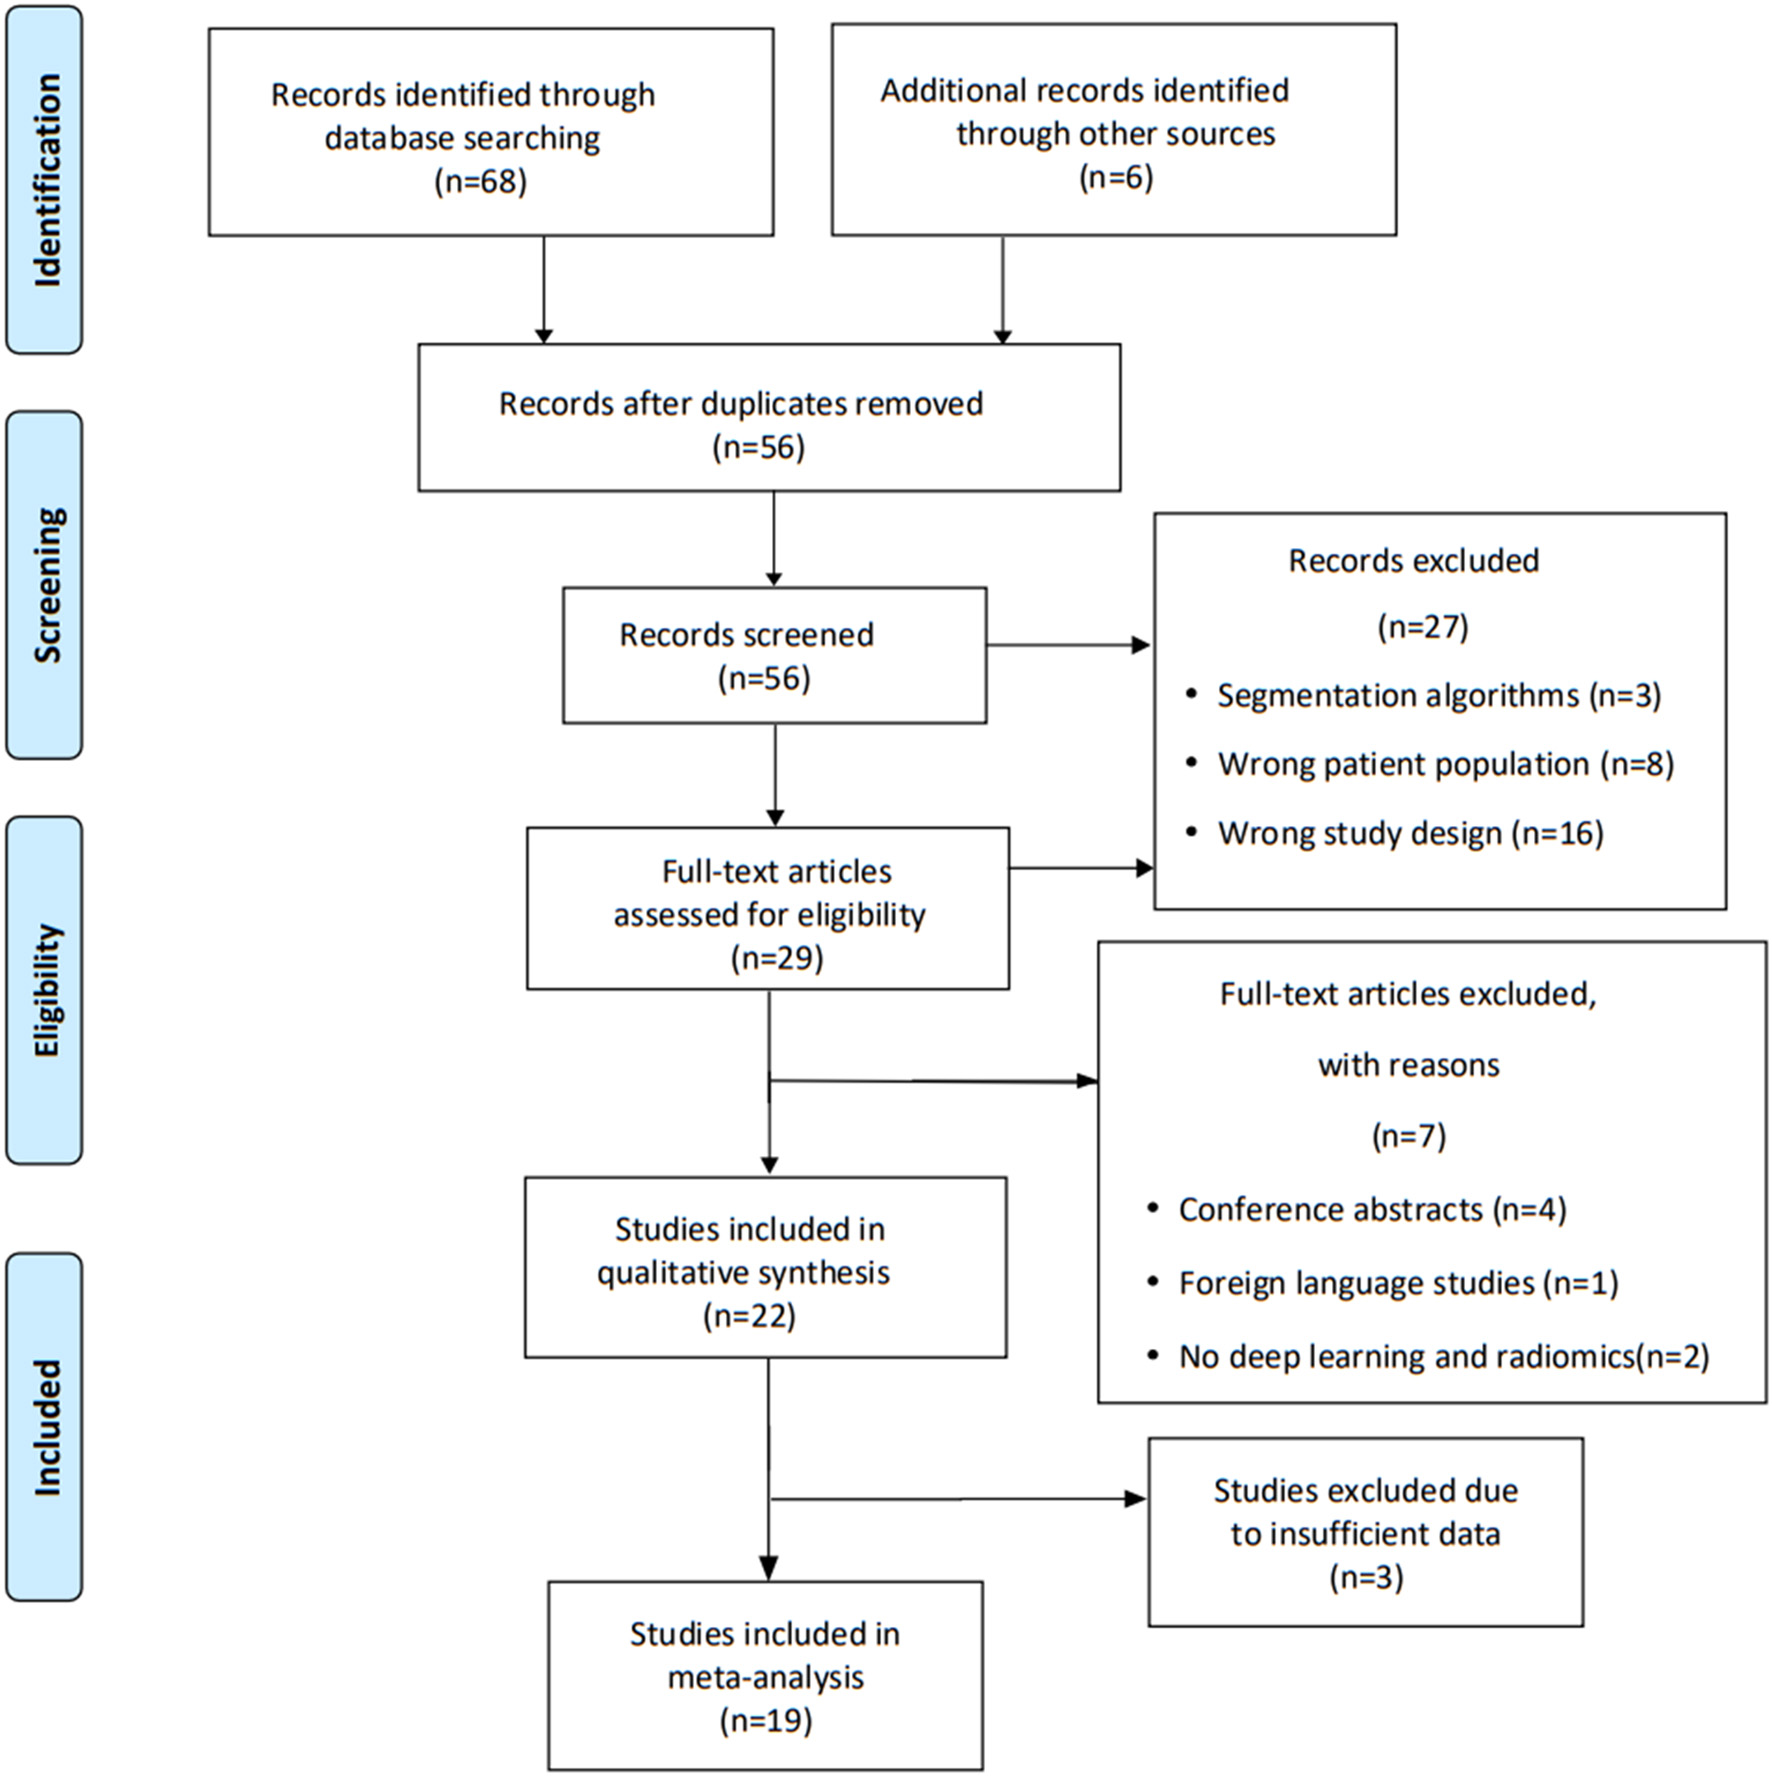
PRISMA flow chart outlining the selection of studies for review.
Study Characteristics
Of the 19 included studies, 14 had sufficient data for a meta-analysis of AUROC (Figure 2). Regarding study design, 17 studies were retrospective, and two were prospective. Sixteen studies were single-center, and the other three were multicenter. Most of the patients are male, and the median age of 63 years (24–93 years) [Table 3 (13–31)]. The malignancy type in twelve studies was NSCLC, and the malignancy type in the remaining studies was lung cancer. Seven studies used the diagnostic output per patient, and eight studies used the lymph node diagnostic output per node for metastases. While seven studies used post-operative pathology reports as reference standards, 11 used radiology reports.
Figure 2
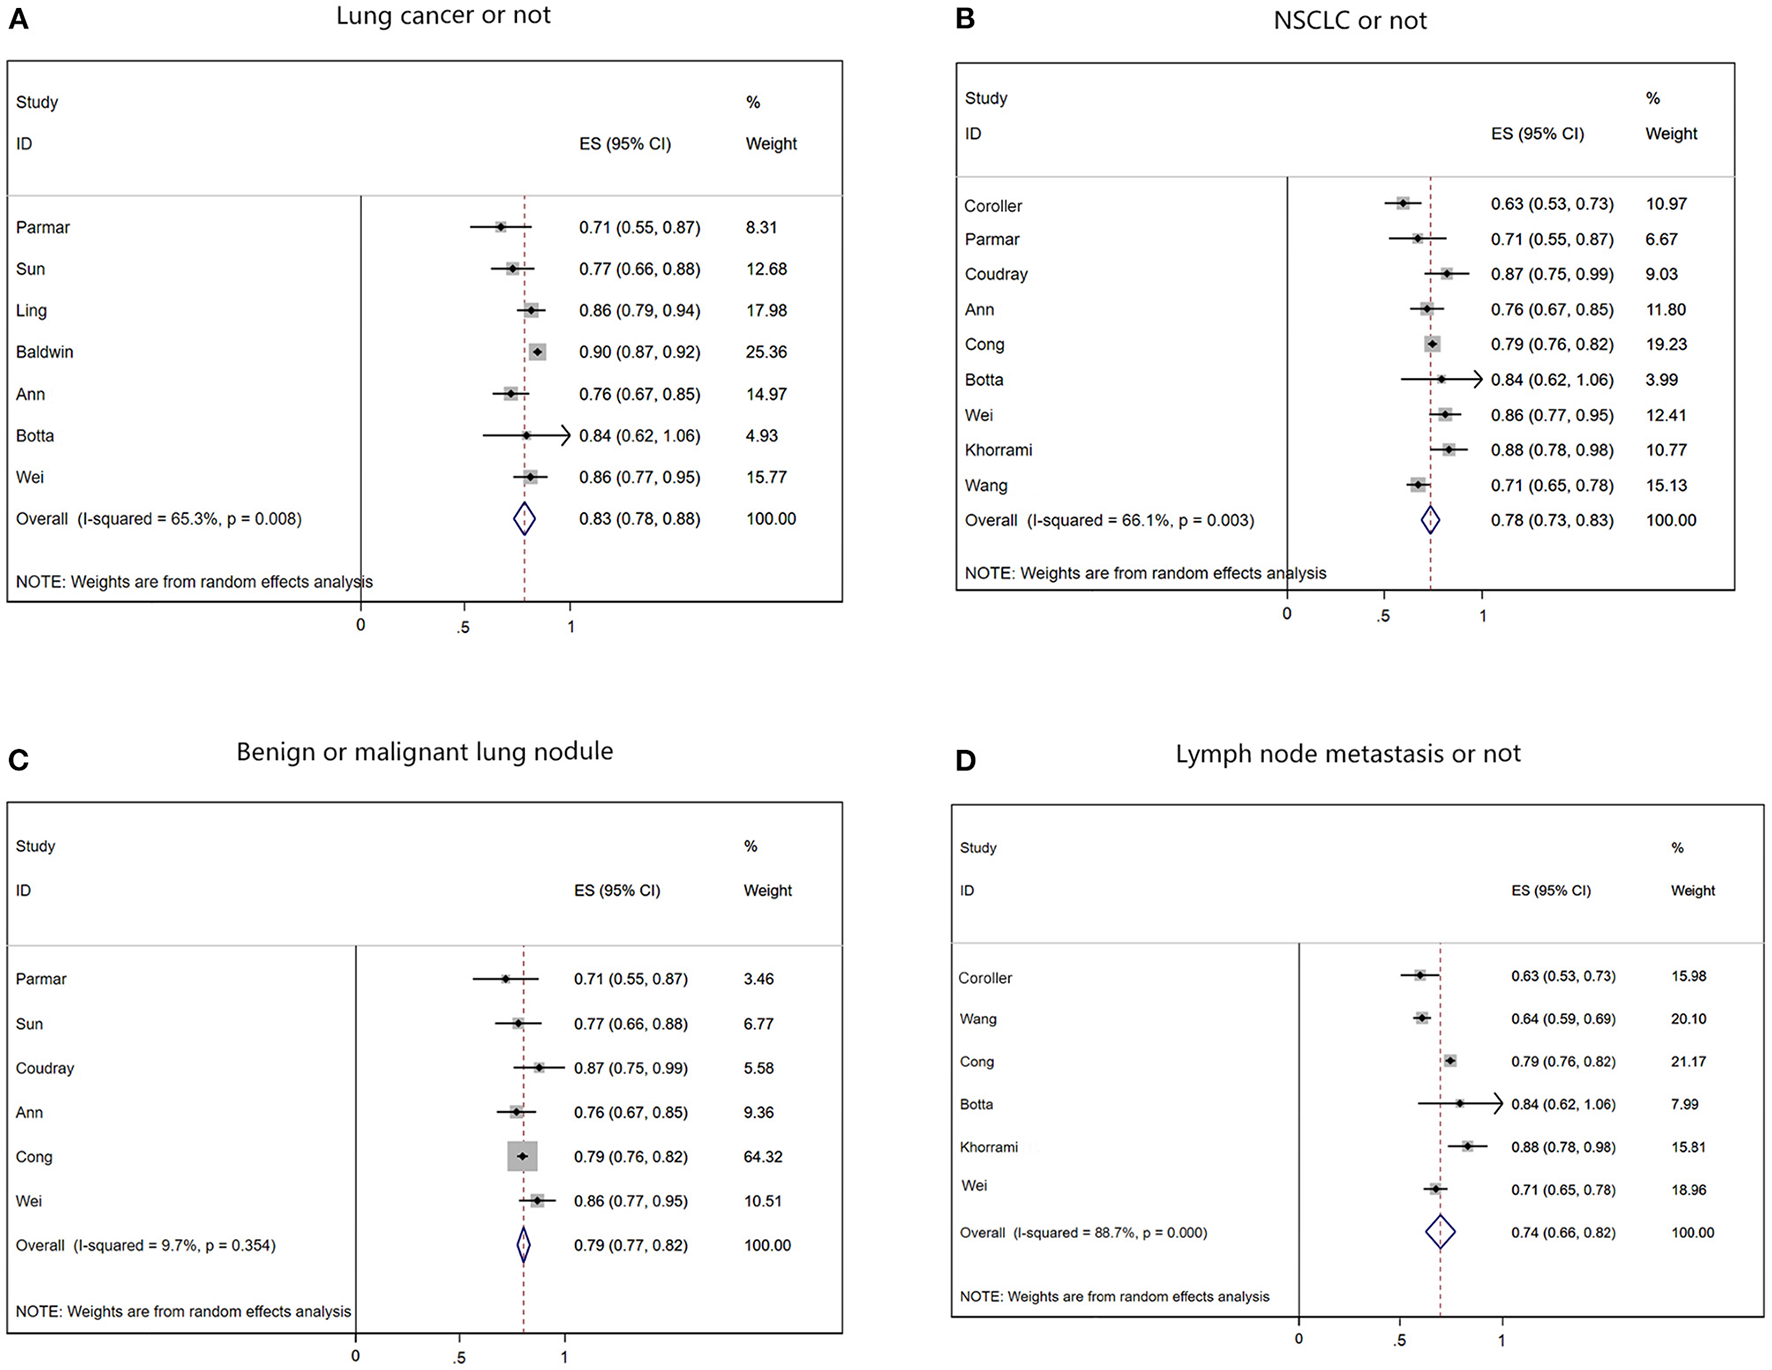
Summary of forest plots for different classifications. (A) The forest plot of determine if a patient has lung cancer. (B) The forest plot of determining whether the cancer type is NSCLC. (C) The forest plot of predicting benign and malignant pulmonary nodules. (D) The forest plot of predicting lymph node metastasis in lung cancer.
Table 3
| References | Country | Year | Study design |
Patients (% female patients) |
Sample size for diagnostic accuracy | Mean or median age (SD; range), years | Imaging modality | Type of malignancy | AI model (Per-patient/per-node diagnostic output) | Reference standard | Classification criteria |
|---|---|---|---|---|---|---|---|---|---|---|---|
| Coroller et al. (13) | USA | 2016 | Retrospective single-center | 85 (65%) | – | 60.3 | CT | NSCLC | Radiomics (per-patient) | Radiology | B D |
| Parmar et al. (14) | USA | 2018 | Retrospective single-center | 1,194 | – | 68.3 (32–93) | CT | NSCLC | Deep learning (per-patient) | Pathology | A B C |
| Sun et al. (15) | China | 2019 | Retrospective single-center | 385 (68%) | 201 | 53.1 (±12.2) | CT | Lung Cancer | Radiomics (per-patient) | Radiology | A C |
| Ling et al. (16) | China | 2019 | Retrospective multi-center | 229 (31.5%) | 74 | 64 (59–81) | CT | Lung Cancer | Radiomics (per-patient) | Radiology | A |
| Coudray et al. (17) | USA | 2018 | Retrospective single-center | 1,176 | 459 | 61 (51.3–72.8) | CT | NSCLC | Deep learning (per-patient) | Radiology | B C |
| Xu et al. (18) | China | 2019 | Retrospective single-center | 179 (52.8%) | – | 63 (32–93) | CT | NSCLC | Deep learning (per-patient) | Pathology | B D |
| Baldwin et al. (19) | UK | 2020 | Retrospective single-center | 1,337 | 328 | – | CT | Lung Cancer | Deep learning (per-patient) | – | A |
| Schroers et al. (20) | Germany | 2019 | Retrospective single-center | 82 (38%) | 50 | 61.5 (±5.0) | MRI | Lung Cancer | Radiomics (per-patient) | Pathology | A C |
| Wang et al. (21) | China | 2019 | Retrospective single-center | 249 (39.8%) | – | 61.4 (±8.96) | CT | Lung Cancer | Deep learning (per-patient) | Radiology | D |
| Leleu et al. (22) | France | 2020 | Retrospective single-center | 215 (39%) | 72 | 58.6 (±10.3) | CT | Lung Cancer | Radiomics (per-patient) | Pathology | A |
| Ann et al. (23) | USA | 2019 | Prospective multi-center | 262 | 48 | – | CT | NSCLC | Radiomics (per-patient) | Pathology | A B C |
| Cong et al. (24) | China | 2020 | Retrospective single-center | 411 (50.4%) | 141 | 59.62 (24–84) | CT | NSCLC | Radiomics (per-patient) | Radiology | B C D |
| Botta et al. (25) | Italy | 2020 | Retrospective single-center | 270 (38%) | – | 67.4 (61.0–72.6) | CT | NSCLC | Radiomics (per-patient) | Radiology | A B D |
| Wei et al. (26) | USA | 2020 | Retrospective multi-center | 146 (39.7%) | – | 65.72 (± 12.88) | PET/CT | NSCLC | Radiomics (per-node) | Radiology | A B C |
| Khorrami et al. (27) | USA | 2019 | Retrospective single-center | 112 | – | – | CT | NSCLC | Radiomics (per-patient) | Pathology | B D |
| Kirienko et al. (28) | Italy | 2021 | Retrospective single-center | 149 (37.6%) | 73 | 70 (41–84) | PET/CT | Lung Cancer | Radiomics (per-node) | Radiology | B C |
| Rossi et al. (29) | Italy | 2020 | Retrospective single-center | 109 | – | – | CT | NSCLC | Radiomics (per-patient) | Radiology | A B |
| Chai et al. (30) | China | 2021 | Retrospective single-center | 198 (54%) | 402 | 58.1 (± 8.5) | CT | NSCLC | Radiomics (per-node) | Pathology | A B D |
| Wang et al. (31) | China | 2019 | Retrospective single-center | 717 | 386 | — | CT | NSCLC | Radiomics (per-node) | Radiology | B D |
Selected characteristics of included studies.
A, Determine whether the patient has lung cancer; B, Determine whether the patient has non-small cell lung cancer; C, Determine whether the patient has malignant lung nodule; D, Determine whether the patient has lymph node metastasis.
Quality Assessment
According to the QUADAS-2 tool, the summary of this study's assessment is shown in Figure 3. The risk of bias in patient selection was low in 12 (74%) studies and high in 5 (26%) studies. The risk of bias for the index test was high in 2 studies (10%) and low in 17 studies (90%). The risk of bias for the reference standard test was low in 16 studies (85%), high in 2 studies (10%), and unclear in 1 study (5%). Process and timing made the risk of bias unclear for all 19 studies. Table 4 shown individual evaluation of the risk of bias and applicability. Overall suitability issues are low. To assess the publication bias of the studies, a funnel plot was constructed (Figure 4). The shape of the funnel plot revealed asymmetry in the included studies, showing study heterogeneity.
Figure 3
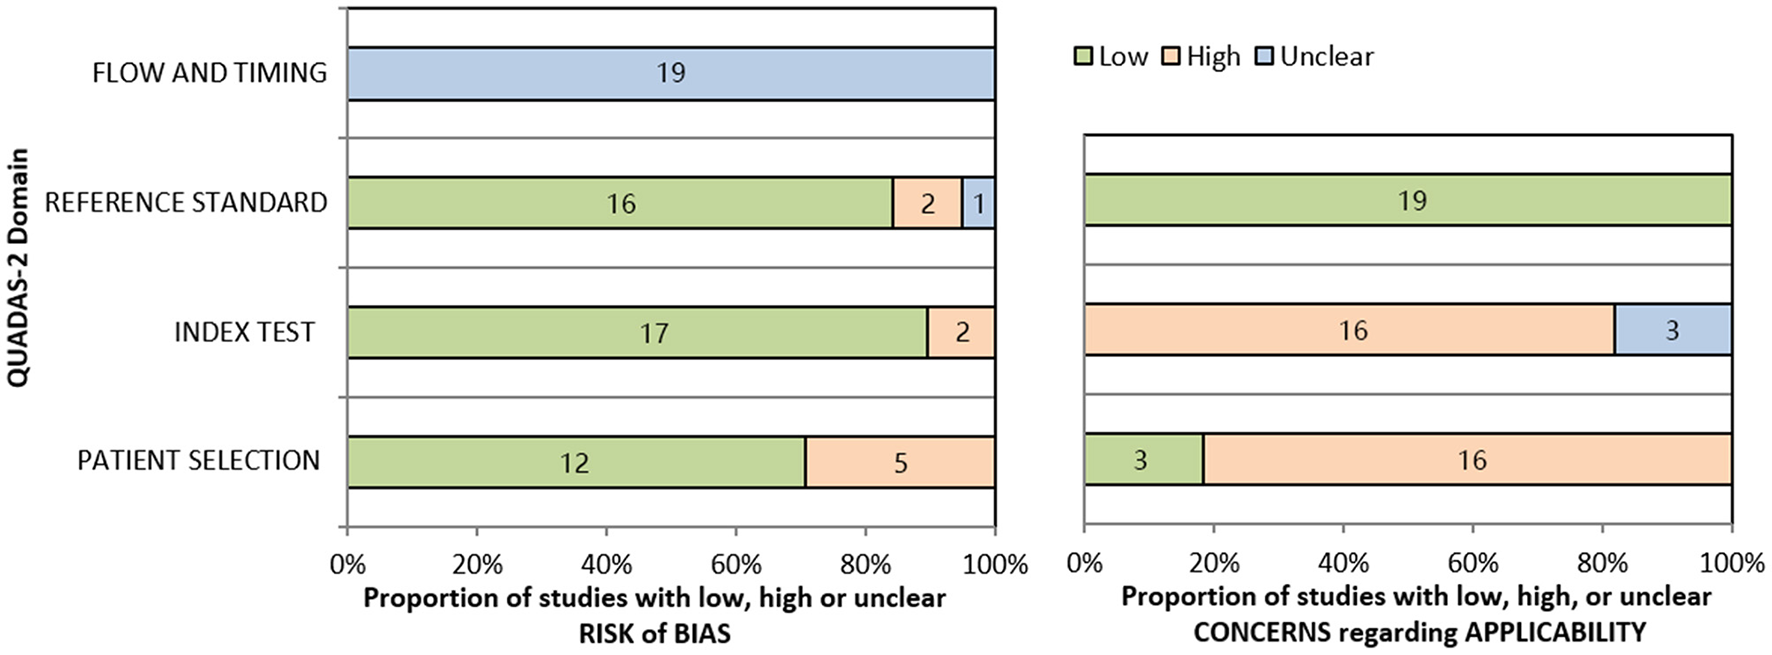
Summary of QUADAS-2 assessments of included studies.
Table 4
| Source | Risk of bias | Applicability concerns | |||||||||
|---|---|---|---|---|---|---|---|---|---|---|---|
| Patient selection | Index test | Reference standard | Flow and timing | Patient selection | Index test | Reference standard | |||||
| Was the statistical management adequate? | Were the inclusion/exclusion criteria specified? | Was the type of study (retrospective or prospective) specified? | Were the imaging acquisition protocol and the segmentation method(s) detailed? | Was the image processing approach detailed? | Was the validation independent (i.e., no internal)? | Was the reference standard adequate? | Was there an appropriate interval between index test and reference standard? | ||||
| Chetan et al. (1) | Yes | Yes | Yes | Yes | Yes | No | Yes | Unclear | Yes | Yes | Unclear |
| Parmar et al. (2) | Yes | Yes | Yes | Yes | Yes | No | Yes | Unclear | Yes | Yes | Yes |
| Sun et al. (3) | Yes | Yes | Yes | Yes | Yes | No | Unclear | Unclear | Yes | Yes | Yes |
| Ling et al. (4) | Yes | Yes | Yes | Yes | Yes | No | Yes | Unclear | Yes | Yes | Yes |
| Coudray et al. (5) | Yes | Yes | Yes | Yes | Yes | Yes | Yes | Unclear | Yes | Yes | Unclear |
| Xu et al. (6) | Yes | No | Yes | Yes | Yes | No | Unclear | Unclear | Yes | Yes | Yes |
| Baldwin et al. (7) | Yes | Yes | Yes | Yes | Yes | No | Yes | Unclear | Yes | Yes | Yes |
| Schroers et al. (8) | Yes | Yes | Yes | Yes | Yes | No | Yes | Unclear | Yes | Yes | Yes |
| Wang et al. (9) | Yes | No | Yes | Yes | No | No | Unclear | Unclear | Yes | Yes | Unclear |
| Leleu et al. (10) | Yes | Yes | Yes | Yes | Yes | Yes | Yes | Unclear | Yes | Yes | Yes |
| Ann et al. (11) | Yes | Yes | Yes | Yes | Yes | Yes | Unclear | Unclear | Yes | Yes | Unclear |
| Cong et al. (12) | Yes | Yes | Yes | Yes | Yes | Yes | No | Unclear | Yes | Yes | Yes |
| Botta et al. (13) | Yes | Yes | Yes | Yes | Yes | Yes | Yes | Unclear | Yes | Yes | Unclear |
| Botta et al. (13) | Yes | Yes | Yes | Yes | Yes | Yes | Yes | Unclear | Yes | Yes | Unclear |
| Wei et al. (14) | Yes | Yes | Yes | Yes | Yes | No | Yes | Unclear | Yes | Yes | Yes |
| Khorrami et al. (15) | Yes | Yes | Yes | Yes | Yes | No | Unclear | Unclear | Yes | Yes | Yes |
| Kirienko et al. (16) | Yes | Yes | Yes | Yes | Yes | No | Unclear | Unclear | Yes | Yes | Unclear |
| Rossi et al. (17) | Yes | Yes | Yes | Yes | Yes | No | Yes | Unclear | Yes | Yes | Unclear |
| Chai et al. (18) | Yes | Yes | Yes | Yes | Yes | Yes | Yes | Unclear | Yes | Yes | Yes |
| Wang et al. (19) | Yes | Yes | Yes | Yes | Yes | No | Unclear | Unclear | Yes | Yes | Unclear |
Quality assessment.
Figure 4
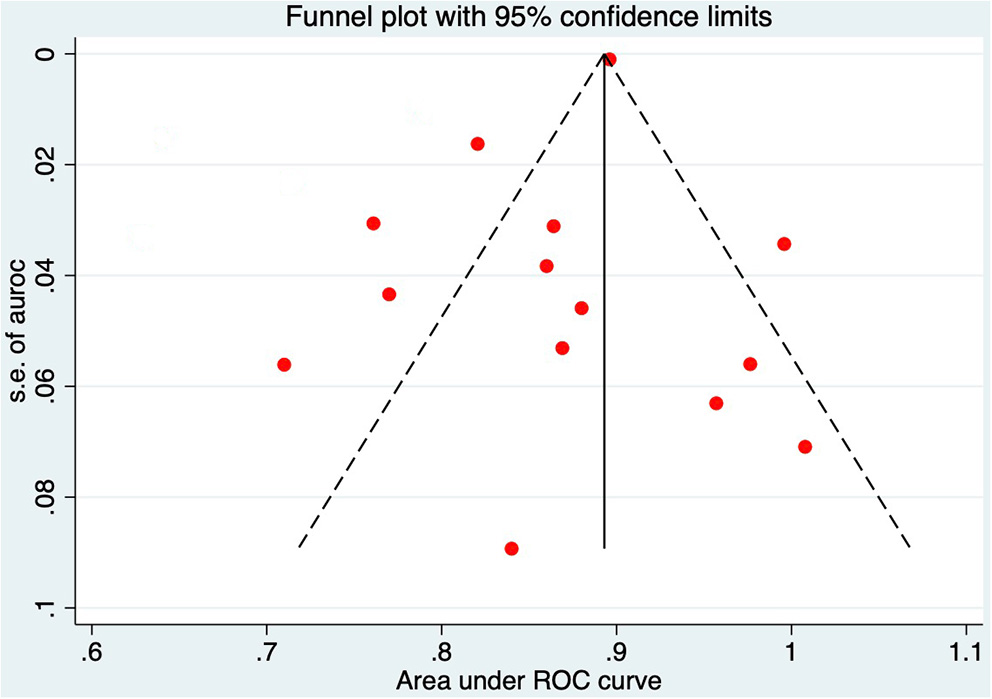
Funnel plot of the area under the receiver operating characteristic in 14 studies.
Diagnostic Accuracy
Of the 19 studies eligible for quantitative analysis, 14 used radiomics and 5 used deep learning. For each outcome, on a per-patient basis, pooled estimates including specificity, sensitivity, and AUROC were generated with 95% confidence intervals. The categorized data extraction for each study report is shown in Table 5. The type of lung cancer, malignant lung nodules, lymph node metastases, and deep learning or radiomics models discussed in each study were considered.
Table 5
| References | Sensitivity, % | Specificity, % | Accuracy, % | AUROC | 95%CI | Standard error |
|---|---|---|---|---|---|---|
| Coroller et al. (13) | – | – | – | 0.630 | 0.583–0.713 | 0.0331 |
| Parmar et al. (14) | 82.4 | 73.1 | 83.5 | 0.710 | 0.60–0.82 | 0.0561 |
| Sun et al. (15) | – | – | – | 0.770 | 0.69–0.86 | 0.0434 |
| Ling et al. (16) | – | – | – | 0.864 | 0.782–0.904 | 0.0311 |
| Coudray et al. (17) | 89.0 | 93.0 | 83.3 | 0.869 | 0.753–0.961 | 0.0531 |
| Xu et al. (18) | – | – | 63.5 | 0.670 | – | – |
| Baldwin et al. (19) | 99.57 | 28.03 | 40.01 | 0.896 | 0.876–0.915 | 0.0010 |
| Schroers et al. (20) | 86.95 | 93.25 | 88.89 | – | – | – |
| Wang et al. (21) | 64.04 | 58.97 | 61.47 | 0.640 | 0.61–0.67 | 0.0153 |
| Leleu et al. (22) | – | – | 72.6 | – | – | – |
| Ann et al. (23) | 79.9 | 75.2 | 65.8 | 0.761 | 0.59–0.71 | 0.0306 |
| Cong et al. (24) | 72.97 | 63.33 | 55.22 | 0.790 | 0.77–0.81 | 0.0102 |
| Botta et al. (25) | – | – | – | 0.840 | 0.63–0.98 | 0.0893 |
| Wei et al. (26) | 54.16 | 55.56 | 63.64 | 0.860 | 0.79–0.94 | 0.0383 |
| Khorrami et al. (27) | 61.34 | 57.16 | 63.81 | 0.880 | 0.79–0.97 | 0.0459 |
| Kirienko et al. (28) | 85.7 | 88.2 | 93.3 | – | – | – |
| Rossi et al. (29) | 100.0 | 66.7 | 85.7 | 0.850 | – | – |
| Chai et al. (30) | – | – | 95.3 | – | – | – |
| Wang et al. (31) | – | – | 72.4 | 0.712 | 0.678–0.770 | 0.0235 |
Summary of AUROC for each study.
The data from radiomics models showed high heterogeneity, except for AUROC and the sensitivity of each node. After removing the literature with insufficient data, the pooled AUROC of the 7 studies determining whether a patient had lung cancer was 0.83 (95% CI 0.78–0.88; Figure 2A), and the pooled sensitivity and specificity were 0.838 and 0.653, respectively, indicating high heterogeneity (I2 = 65.3%, p = 0.008). For the 9 NSCLC studies that currently represent ~85% of lung cancer, the pooled AUROC of radiomics was 0.78 (95% CI 0.73–0.83; Figure 2B), and the pooled sensitivity and specificity were 0.782 and 0.715, respectively, with higher heterogeneity (I2 = 66.1%, p = 0.003). Among the six studies predicting benign or malignant pulmonary nodules, the pooled AUROC of radiomics was 0.79 (95% CI 0.77–0.82; Figure 2C), and the pooled sensitivity and specificity were 0.787 and 0.774, respectively, with heterogeneity relatively low (I2 = 9.7%, p = 0.354). Among the 6 studies that predicted the accuracy of LNM in lung cancer patients, the pooled AUROC of radiomics was 0.74 (95% CI 0.66–0.82; Figure 2D), and the pooled sensitivity and specificity were 0.661 and 0.598, respectively, with heterogeneity relatively high (I2 = 88.7%, p = 0.000).
Discussion
During the diagnosis and treatment of lung cancer, many imaging data, such as CT, MRI, and PET, are generated. Doctors usually subjectively evaluate these data based on experience and make treatment plans (32). However, the features that doctors can observe from the image data with the naked eye are limited, and the potential of the image data is often not fully realized. Over the years, many researchers have tried to use complex mathematical and statistical algorithms to extract quantitative information that is hard to observe, even predicting cancer progression (33–35).
With the development of artificial intelligence technology, radiomics has emerged as the times require, using machine learning algorithms to mine high-throughput features from medical images and conduct modeling analysis. Increasing evidence shows that radiomics can be used for quantitative characterization of tumors for tasks such as disease diagnosis, treatment planning, and prognosis, which constitutes an important research direction for artificial intelligence technology in medical applications (36, 37). Radiomics is an emerging and rapidly developing field that integrates knowledge from radiology, oncology, and computer science and is an interdisciplinary subject that emphasizes the integration of medicine and engineering (38). With the rise of deep learning technology in recent years, the need for high precision and high stability in lung cancer staging has become more and more urgent (39).
To our knowledge, this is the first meta-analysis to summarize the diagnostic accuracy of deep learning and radiomics involving in lung cancer staging. We provided summarized data in this field and compared the identification effectiveness of lung cancer, tumor types, malignant lung nodules and lymph node metastase. In this article, the included studies mainly used radiomics (n = 14) rather than deep learning methods (n = 5). Of the five deep learning models, two were developed using transfer learning and three were developed using convolutional neural networks (CNN). Part of the reason there are relatively few deep learning models is that deep learning techniques are relatively new and prone to bias. The difference in the number of studies of the two AI models will lead to a significant deviation in the data ratio, affecting the ability comparison of the two models. Furthermore, most studies are retrospective in design, there are few prospective deep learning studies in lung cancer medical imaging staging, and most studies lack data and code availability. At the same time, most studies are single-center and use internal validation or resampling methods (cross-validation). However, internal validation tends to overestimate AUROC due to the lack of generality of the models, limiting the integration of AI models into clinical settings (40). Therefore, predictive models validated externally by using images from different hospitals are needed to create reliable estimates of the performance levels of other sites (41).
This systematic review performed a statistical assessment of pooled data collected from 19 studies. However, our findings must take into account some limitations. First, while comprehensive, our search may have missed some studies that could have been included. Second, we calculated estimates of diagnostic performance using limited data as several studies reported incomplete data. Third, there may be geographic bias because the included studies were from geographically different quantitative distributions. Finally, the type of scanner used for diagnosis, the imaging protocol, and the criteria for lung cancer staging may affect the accuracy of the results. In the future, the clinical benefit of diagnostic lung cancer staging models must be rigorously evaluated against current diagnostic criteria, as not all models are applicable in clinical practice (42, 43). Under the current hot spot of artificial intelligence development, more and more deep learning studies have shown that deep learning big data extracted from patients' medical images can have good clinical application value in tumor staging of patients. Therefore, we can combine deep learning features to establish a radiomics combined with deep learning diagnostic model, so that the accuracy of lung cancer staging diagnosis of patients can be improved.
Conclusion
The models based on deep learning or radiomics have the potential to improve diagnostic accuracy in the pathological staging of lung cancer with the purpose of providing individualized preoperative non-invasive auxiliary prediction means for clinicians and realizing valuable prediction for patients to obtain better treatment strategy. Future studies are welcomed to use standardized radiomics features, more robust tools of feature selection and model development to further improve the diagnostic accuracy of artificial intelligence in lung cancer staging.
Funding
This work was supported by the Chengdu Science and Technology Program, Grant no. 2021007 and Sichuan Science and technology plan, Grant no. 2018JY0356.
Publisher's Note
All claims expressed in this article are solely those of the authors and do not necessarily represent those of their affiliated organizations, or those of the publisher, the editors and the reviewers. Any product that may be evaluated in this article, or claim that may be made by its manufacturer, is not guaranteed or endorsed by the publisher.
Statements
Data availability statement
The original contributions presented in the study are included in the article/supplementary material, further inquiries can be directed to the corresponding author/s.
Author contributions
XZ and WH conceptualized the study. BH, YH, and MR collected the data. XZ, BH, and WH drafted the initial manuscript. ZC, ZZ, JM, LO, HC, and HG reviewed the included articles. YH and WH conducted the analyses. XZ, TL, and GL reviewed and revised the manuscript. All authors read and approved the final manuscript.
Conflict of interest
The authors declare that the research was conducted in the absence of any commercial or financial relationships that could be construed as a potential conflict of interest.
- CT
Computer tomography
- MRI
Magnetic resonance imaging
- AI
Artificial intelligence
- ML
machine learning
- LNM
lymph node metastasis
- QUADAS-2
Quality assessment of diagnostic accuracy studies tool 2
- AUROC
Area under the receiver operating characteristic curve
- NSCLC
non-small cell lung cancer.
Abbreviations
References
1.
Bray F Ferlay J Soerjomataram I Siegel RL Torre LA Jemal A . Global cancer statistics 2018: GLOBOCAN estimates of incidence and mortality worldwide for 36 cancers in 185 countries. CA Cancer J Clin. (2018) 68:394–424. 10.3322/caac.21492
2.
Hosny A Parmar C Quackenbush J Schwartz LH Aerts HJWL . Artificial intelligence in radiology. Nat Rev Cancer. (2018) 18:500–10. 10.1038/s41568-018-0016-5
3.
Lambin P Rios-Velazquez E Leijenaar R Carvalho S van Stiphout RG Granton P et al . Radiomics: extracting more information from medical images using advanced feature analysis. Eur J Cancer. (2012) 48:441–6. 10.1016/j.ejca.2011.11.036
4.
Kumar V Gu Y Basu S Berglund A Eschrich SA Schabath MB et al . Radiomics: the process and the challenges. Magn Reson Imaging. (2012) 30:1234–48. 10.1016/j.mri.2012.06.010
5.
Huang Y Liu Z He L Chen X Pan D Ma Z et al . Radiomics signature: a potential biomarker for the prediction of disease-free survival in early-stage (I or II) non-small cell lung cancer. Radiology. (2016) 281:947–57. 10.1148/radiol.2016152234
6.
Huang YQ Liang CH He L Tian J Liang CS Chen X et al . Development and validation of a radiomics nomogram for preoperative prediction of lymph node metastasis in colorectal cancer. J Clin Oncol. (2016) 34:2157–64. 10.1200/JCO.2015.65.9128
7.
Lundervold AS Lundervold A . An overview of deep learning in medical imaging focusing on MRI. Z Med Phys. (2019) 29:102–27. 10.1016/j.zemedi.2018.11.002
8.
Benjamens S Dhunnoo P Mesko B . The state of artificial intelligence-based FDA-approved medical devices and algorithms: an online database. NPJ Digit Med. (2020) 3:118. 10.1038/s41746-020-00324-0
9.
Bouwmeester W Zuithoff NP Mallett S Geerlings MI Vergouwe Y Steyerberg EW et al . Reporting and methods in clinical prediction research: a systematic review. PLoS Med. (2012) 9:1–12. 10.1371/journal.pmed.1001221
10.
Mantel N Haenszel W . Statistical aspects of the analysis of data from retrospective studies of disease. J Natl Cancer Inst. (1959) 22:719–48.
11.
DerSimonian R Laird N . Meta-analysis in clinical trials. Control Clin Trials. (1986) 7:177–88. 10.1016/0197-2456(86)90046-2
12.
Higgins JP Thompson SG Deeks JJ Altman DG . Measuring inconsistency in meta-analyses. BMJ. (2003) 327:557–60. 10.1136/bmj.327.7414.557
13.
Coroller TP Agrawal V Narayan V Hou Y Grossmann P Lee SW et al . Radiomic phenotype features predict pathological response in non-small cell lung cancer. Radiother Oncol. (2016) 119:480–6 10.1016/j.radonc.2016.04.004
14.
Hosny A Parmar C Coroller TP Grossmann P Zeleznik R Kumar A et al . Deep learning for lung cancer prognostication: a retrospective multi-cohort radiomics study. PLoS Med. (2018) 15:e1002711. 10.1371/journal.pmed.1002711
15.
Sun Y Li C Jin L Gao P Zhao W Ma W et al . Radiomics for lung adenocarcinoma manifesting as pure ground-glass nodules: invasive prediction. Eur Radiol. (2020) 30:3650–9. 10.1007/s00330-020-06776-y
16.
E L Lu L Li L Yang H Schwartz LH Zhao B . Radiomics for classifying histological subtypes of lung cancer based on multiphasic contrast-enhanced computed tomography. J Comput Assist Tomogr. (2019) 43:300–6. 10.1097/RCT.0000000000000836
17.
Coudray N Ocampo PS Sakellaropoulos T Narula N Snuderl M Fenyö D et al . Classification and mutation prediction from non-small cell lung cancer histopathology images using deep learning. Nat Med. (2018) 24:1559–67. 10.1038/s41591-018-0177-5
18.
Xu Y Hosny A Zeleznik R Parmar C Coroller T Franco I et al . Deep learning predicts lung cancer treatment response from serial medical imaging. Clin Cancer Res. (2019) 25:3266–75. 10.1158/1078-0432.CCR-18-2495
19.
Baldwin DR Gustafson J Pickup L Arteta C Novotny P Declerck J et al . External validation of a convolutional neural network artificial intelligence tool to predict malignancy in pulmonary nodules. Thorax. (2020) 75:306–12. 10.1136/thoraxjnl-2019-214104
20.
Meier-Schroers M Homsi R Schild HH Thomas D . Lung cancer screening with MRI: characterization of nodules with different non-enhanced MRI sequences. Acta Radiol. (2019) 60:168–76. 10.1177/0284185118778870
21.
Wang S Shi J Ye Z Dong D Yu D Zhou M et al . Predicting EGFR mutation status in lung adenocarcinoma on computed tomography image using deep learning. Eur Respir J. (2019) 53:1800986. 10.1183/13993003.00986-2018
22.
Leleu O Basille D Auquier M Clarot C Hoguet E Pétigny V et al . Lung cancer screening by low-dose CT scan: baseline results of a french prospective study. Clin Lung Cancer. (2020) 21:145–52. 10.1016/j.cllc.2019.10.014
23.
Trebeschi S Drago SG Birkbak NJ Kurilova I Cǎlin AM Delli Pizzi A et al . Predicting response to cancer immunotherapy using noninvasive radiomic biomarkers. Ann Oncol. (2019) 30:998–1004. 10.1093/annonc/mdz108
24.
Cong M Yao H Liu H Huang L Shi G . Development and evaluation of a venous computed tomography radiomics model to predict lymph node metastasis from non-small cell lung cancer. Medicine. (2020) 99:e20074. 10.1097/MD.0000000000020074
25.
Botta F Raimondi S Rinaldi L Bellerba F Corso F Bagnardi V et al . Association of a CT-based clinical and radiomics score of non-small cell lung cancer (NSCLC) with lymph node status and overall survival. Cancers. (2020) 12:1432. 10.3390/cancers12061432
26.
Mu W Tunali I Gray JE Qi J Schabath MB Gillies RJ . Radiomics of 18F-FDG PET/CT images predicts clinical benefit of advanced NSCLC patients to checkpoint blockade immunotherapy. Eur J Nucl Med Mol Imaging. (2020) 47:1168–82. 10.1007/s00259-019-04625-9
27.
Khorrami M Prasanna P Gupta A Patil P Velu PD Thawani R et al . Changes in CT radiomic features associated with lymphocyte distribution predict overall survival and response to immunotherapy in non-small cell lung cancer. Cancer Immunol Res. (2020) 8:108–19. 10.1158/2326-6066.CIR-19-0476
28.
Kirienko M Sollini M Corbetta M Voulaz E Gozzi N Interlenghi M et al . Radiomics and gene expression profile to characterise the disease and predict outcome in patients with lung cancer. Eur J Nucl Med Mol Imaging. (2021) 48:3643–55. 10.1007/s00259-021-05371-7
29.
Rossi G Barabino E Fedeli A Ficarra G Coco S Russo A et al . Radiomic detection of EGFR mutations in NSCLC. Cancer Res. (2021) 81:724–31. 10.1158/0008-5472.CAN-20-0999
30.
Yating C Shu L Xingyuan J Fan W Ye L . Combined model of radiomics features and clinical labels of peritumoral tissue to predict lymph node metastasis in T1 non-small cell lung cancer. Chin J Clin Med Imaging. (2021) 32:470–5. 10.12117/jccmi.2021.07.004
31.
Chao W Xia L Di D Liya Z Zaiyi L Changhong L et al . Prediction of lymph node metastasis in non-small cell lung cancer based on radiomics. Chin J Autom. (2019) 45:1087–93. 10.16383/j.aas.c160794
32.
Wen PY Macdonald DR Reardon DA Cloughesy TF Sorensen AG Galanis E et al . Updated response assessment criteria for high-grade gliomas: response assessment in neuro-oncology working group. J Clin Oncol. (2010) 28:1963–72. 10.1200/JCO.2009.26.3541
33.
Chaunzwa TL Christiani DC Lanuti M Shafer A Aerts H . Using deep-learningradiomics to predict lung cancer histology. J Clin Oncol. (2018) 36:8545. 10.1200/JCO.2018.36.15_suppl.8545
34.
Chalkidou A O'Doherty MJ Marsden PK . False discovery rates in PET and CT studies with texture features: a systematic review. PLoS ONE. (2015) 10:e0124165. 10.1371/journal.pone.0124165
35.
Forghani R Savadjiev P Chatterjee A Muthukrishnan N Reinhold C Forghani B . Radiomics and artificialintelligence for biomarker and prediction model development in oncology. Comput Struct Biotechnol J. (2019) 17:995–1008. 10.1016/j.csbj.2019.07.001
36.
Zacharaki EI Wang S Chawla S Soo Yoo D Wolf R Melhem ER et al . Classification of brain tumor type andgrade using MRI texture and shape in a machine learning scheme. Magn Reson Med. (2009) 62:1609–18. 10.1002/mrm.22147
37.
Qian Z Li Y Wang Y Li L Li R Wang K et al . Differentiation of glioblastoma from solitarybrain metastases using radiomic machine-learning classifiers. Cancer Lett. (2019) 451:128–35. 10.1016/j.canlet.2019.02.054
38.
Lambin P Leijenaar RTH Deist TM Peerlings J de Jong EEC van Timmeren J et al . Radiomics: the bridge betweenmedical imaging and personalized medicine. Nat Rev Clinicaloncol. (2017) 14:749. 10.1038/nrclinonc.2017.141
39.
Cai H Cui C Tian H Zhang M Li L . A novel approach to segment and classify regional lymph nodes on computed tomography images. Comput Math Methods Med. (2012) 2012:1–9. 10.1155/2012/145926
40.
Perone CS Cohen-Adad J . Promises and limitations of deep learning for medical image segmentation. J Med Artif Intel. (2019) 2:1. 10.21037/jmai.2019.01.01
41.
Kim DW Jang HY Kim KW Shin Y Park SH . Design characteristics of studies reporting the performance of artificial intelligence algorithms for diagnostic analysis of medical images: results from recently published papers. Korean J Radiol. (2019) 20:405–10. 10.3348/kjr.2019.0025
42.
Steyerberg EW Moons KG van der Windt DA Hayden JA Perel P et al . Prognosis Research Strategy (PROGRESS) 3: prognostic model research. PLoS Med. (2013) 10:e1001381. 10.1371/journal.pmed.1001381
43.
Liu X Faes L Kale AU Wagner SK Fu DJ Bruynseels A et al . A comparison of deep learning performance against healthcare professionals in detecting diseases from medical imaging: a systematic review and meta-analysis. Lancet Digital Health. (2019) 1:e271–97. 10.1016/S2589-7500(19)30123-2
Summary
Keywords
lung cancer, deep learning, radiomics, diagnostic accuracy, lymph node metastasis, meta-analysis
Citation
Zheng X, He B, Hu Y, Ren M, Chen Z, Zhang Z, Ma J, Ouyang L, Chu H, Gao H, He W, Liu T and Li G (2022) Diagnostic Accuracy of Deep Learning and Radiomics in Lung Cancer Staging: A Systematic Review and Meta-Analysis. Front. Public Health 10:938113. doi: 10.3389/fpubh.2022.938113
Received
07 May 2022
Accepted
15 June 2022
Published
18 July 2022
Volume
10 - 2022
Edited by
Md. Mohaimenul Islam, Aesop Technology, Taiwan
Reviewed by
Hsuan-Chia Yang, Taipei Medical University, Taiwan; Woon-Man Kung, Chinese Culture University, Taiwan
Updates
Copyright
© 2022 Zheng, He, Hu, Ren, Chen, Zhang, Ma, Ouyang, Chu, Gao, He, Liu and Li.
This is an open-access article distributed under the terms of the Creative Commons Attribution License (CC BY). The use, distribution or reproduction in other forums is permitted, provided the original author(s) and the copyright owner(s) are credited and that the original publication in this journal is cited, in accordance with accepted academic practice. No use, distribution or reproduction is permitted which does not comply with these terms.
*Correspondence: Tianhu Liu lthzgl@163.comGang Li ricon2001@126.com
†These authors have contributed equally to this work
This article was submitted to Family Medicine and Primary Care, a section of the journal Frontiers in Public Health
Disclaimer
All claims expressed in this article are solely those of the authors and do not necessarily represent those of their affiliated organizations, or those of the publisher, the editors and the reviewers. Any product that may be evaluated in this article or claim that may be made by its manufacturer is not guaranteed or endorsed by the publisher.