 Rujia Miao
 Qian Dong2
- 1Health Management Medicine Center, The Third Xiangya Hospital, Central South University, Changsha, China
- 2School of Science, Hunan University of Technology and Business, Changsha, China
Introduction: An easily accessible and cost-free machine learning model based on prior probabilities of vascular aging enables an application to pinpoint high-risk populations before physical checks and optimize healthcare investment.
Methods: A dataset containing questionnaire responses and physical measurement parameters from 77,134 adults was extracted from the electronic records of the Health Management Center at the Third Xiangya Hospital. The least absolute shrinkage and selection operator and recursive feature elimination-Lightweight Gradient Elevator were employed to select features from a pool of potential covariates. The participants were randomly divided into training (70%) and test cohorts (30%). Four machine learning algorithms were applied to build the screening models for elevated arterial stiffness (EAS), and the performance of models was evaluated by calculating the area under the receiver operating characteristic curve (AUC), sensitivity, specificity, and accuracy.
Results: Fourteen easily accessible features were selected to construct the model, including “systolic blood pressure” (SBP), “age,” “waist circumference,” “history of hypertension,” “sex,” “exercise,” “awareness of normal blood pressure,” “eat fruit,” “work intensity,” “drink milk,” “eat bean products,” “smoking,” “alcohol consumption,” and “Irritableness.” The extreme gradient boosting (XGBoost) model outperformed the other three models, achieving AUC values of 0.8722 and 0.8710 in the training and test sets, respectively. The most important five features are SBP, age, waist, history of hypertension, and sex.
Conclusion: The XGBoost model ideally assesses the prior probability of the current EAS in the general population. The integration of the model into primary care facilities has the potential to lower medical expenses and enhance the management of arterial aging.
1 Introduction
Vascular aging, regardless of the presence of atherosclerosis, is characterized by intimal and medial thickening and a loss of arterial elasticity, leading to vascular stiffness (1, 2). Population-based studies indicated that vascular aging should no longer be only considered a part of normal aging but rather influenced by industrialized lifestyle (3) and increased with the level of urbanization (4). Aortic pulse wave velocity (PWV) is considered a physiological method for quantifying arterial functional aging (5, 6) and serves as a surrogate marker of arterial stiffness, which is strongly related to cardiovascular diseases (CVDs) morbidity (7, 8).
Approximately 35% of individuals aged less than 40 years present a PWV value that was above the 90th percentile of PWV expected for their age, according to the European Reference Values Collaboration (9), and widespread PWV screening remains lacking in practice (10). Vascular aging is strongly influenced by acquired risk factors, primarily related to lifestyle choices and cardio-metabolic indicators such as smoking (11, 12), high blood pressure (13, 14), and glucose levels (15). This implies that arterial aging, as measured by PWV, can be preemptively evaluated with the aid of a suitable algorithm. This might allow for the precise identification of high-risk individuals at minimal or even zero cost, optimizing the efficiency of screening initiatives and reducing the health investment required for the vast low-risk population. We hereby reintroduce the concept of pretest probability. For example, in clinical practice, before diagnosing coronary heart disease, it is necessary to assess the disease’s prior probability based on symptoms and other factors. This assessment informs the next steps in patient testing (16). Similar to this scope, our testing employs cross-sectional big data and machine learning methods to determine the pretest probability of current vascular aging.
Machine learning (ML) has been successfully employed in medicine to establish and develop accurate models (17). It outperforms conventional statistical methods by automatically training itself and improving its performance without the need for intricate programming. ML has the capacity to learn from diverse data modules and model complex relationships, resulting in more accurate predictions (18). A gradient boosting-based model for arterial stiffness assessment using clinical characteristics was constructed in a cohort of 1,672 patients with diabetes (19), demonstrating effective classification for elevated arterial stiffness (EAS) within this specific group. Based on our speculation that the prevalence of elevated PWV would be higher in individuals with diabetes, and considering the distinct parameters and contributing features of the model in this population, we realized that the model for the general population would likely differ substantially.
By leveraging a vast dataset gathered from a substantial cohort of physical examinees, encompassing Pulse Wave Velocity (PWV) metrics, along with detailed insights into lifestyle patterns and fundamental clinical attributes, we employed machine learning (ML) techniques to craft a streamlined and economical screening model for arterial stiffness in the general populace. This approach enables more precise pinpointing of high-risk demographics. Such a strategy may significantly reduce the likelihood of overlooking potential diagnoses and curtail medical squandering, enhancing the overall efficiency and effectiveness of health screenings for arterial aging.
2 Methods
2.1 Study population and data source
The retrospective dataset was extracted from the electronic healthcare records of the health management center of the Third Xiangya Hospital. The records collected spanned from 2015 to 2021 and constituted the original set. The dataset consisted of 77,191 physical examinees who underwent a brachial-ankle pulse wave velocity (baPWV) test at the health management center. The exclusion criteria were as follows: (1) individuals who were unable to sign informed consent; (2) patients with a diagnosis of end-stage renal disease and aortopathy. Samples with massive missing data or excessive outliers whose irrationality was justified by the clinician were deleted, resulting in a final dataset of 77,134 individuals. All participants signed the informed consent form. The study was conducted in accordance with the Declaration of Helsinki and approved by the Ethics Committee of the Third Xiangya Hospital (No 2020-S609).
2.2 Feature characteristics and definitions
The dataset included a total of 82 features, which encompassed various types of information. These features included physical examination measurements such as body mass index (BMI), waist circumference (WC), and systolic/diastolic blood pressure (SBP/DBP). Laboratory indicators were also present in the dataset and included measurements such as fasting blood sugar (FBS), lipid profile, and renal function markers. Additionally, questionnaire information was collected, including previous diagnoses of diseases, lifestyle factors (diet preference, smoking, alcohol consumption, exercise habits, working and sedentary time, and sleep status), and health literacy regarding basic medical knowledge. For specific definitions within the dataset, alcohol consumption was defined as consuming more than 50 g of alcohol per week. The current smoking status was defined as smoking more than one cigarette per day. The baPWV measurements were obtained using a non-invasive measurement system called VP-2000 manufactured by Colin Co Ltd., Komaki, Japan. Trained medical staff performed the measurements in a room after the subjects had rested in a supine position for 10 min. Four pneumatic cuffs were attached to the bilateral arms and ankles to obtain pulse waves. The baPWV was automatically calculated using the formula (La-Lb)/Tba, where La represents the distance between the heart and ankle, Lb represents the distance between the heart and brachium, and Tba represents the time difference between the initial increase in the brachial waveform and that in the ankle waveform. Elevated arterial stiffness (EAS) was considered as baPWV≥1,400 cm/s (20).
2.3 Data processing and statistical analysis
Nineteen features in the original dataset are related to detailed questions about smoking, drinking, exercising, and work intensity, including types and frequency. To reduce the redundancy of the data, these data are not included in the analysis for now. If factors such as smoking and drinking prove important in later analyses, this part of the data will be specifically analyzed. However, since factors such as smoking and drinking were not considered highly important in subsequent analyses, no further specific analysis was conducted on these questions. If a sample has more than 30% of its variables missing, then the sample is deleted. Therefore, a total of 57 samples were deleted. For the remaining missing data, single-value imputation was used to handle features. Ultimately, 63 features and 77,134 samples were retained. The entire dataset was randomly divided into a training set (70%, 53,993 samples) and a test set (30%, 23,141 samples). In the test set, there were 13,600 samples for the non-EAS category and 9,541 samples for the EAS category.
Continuous measurement data conforming to the normal distribution were expressed as mean ± standard deviation, otherwise, the quartile was adopted, and the difference between categorical features was calculated using the chi-squared test. The difference of p < 0.05 on both sides was considered statistically significant.
2.4 Feature selection
In the field of machine learning, feature selection can eliminate irrelevant or redundant features, thereby reducing the number of features, improving model accuracy, and reducing runtime. Feature selection methods are mainly divided into three categories: filter, embedded, and wrapper methods.
Filter method: Features that did not show significant differences across categories meant they had no use for the prediction target and would be deleted.
Embedded: The features were input into the Lasso model for training after the filter method. The L1 regularization parameters were tuned using 10-fold cross-validation, and the coefficient would be shrunken to zero if their features were not important.
Wrapper: After filtering through Lasso regression, if there were still quite a number of features left, the wrapper method could be used for further selection. The working principle of recursive feature elimination (RFE) is to recursively remove features and build a model on the remaining features (in this case, the Lightweight Gradient Elevator (LGBM) is chosen), thereby determining which combinations of features contribute more significantly to the prediction results. Regarding the choice of the number of features, as we continuously increase the number of features, the AUC score of RFE-LGBM gradually increases and tends to stabilize. When the number of features reaches N, the AUC score reaches its maximum value. Adding more features will not enhance the model’s predictive capability, so ultimately, N features are determined for model building through RFE-LGBM.
Based on the common usage and the situation of data being selected at each step, we ultimately employed these three methods.
2.5 Parameter optimization and model evaluation
Four machine learning algorithms (logistic regression [LR], random forest [RF], extreme gradient boosting [XGBoost], and light gradient boosting machine [LightGBM]) were used to develop predictive models on the training data. Weights of different classes were assigned by setting parameters in the trained models to deal with data imbalance. The parameters of LR, RF, and LightGBM models were class_weight = “balanced,” and XGBoost’s was scale_pos_weight = “ratio of majority and minority class.” As to the other parameters that required adjustment, grid searching was adopted in the LR model and the Bayesian Optimization Algorithm was applied to the RF, XGBoost, and LightGBM models. To assess the model’s optimization and improve its generalization ability, 10-fold cross-validation was performed. The model’s performance was evaluated by calculating the accuracy, sensitivity, and specificity, and the distinguishing abilities of the risk assessment model were evaluated with the area under the receiver operator characteristic (AUC). The overview of the proposed ML algorithms is shown in Figure 1.
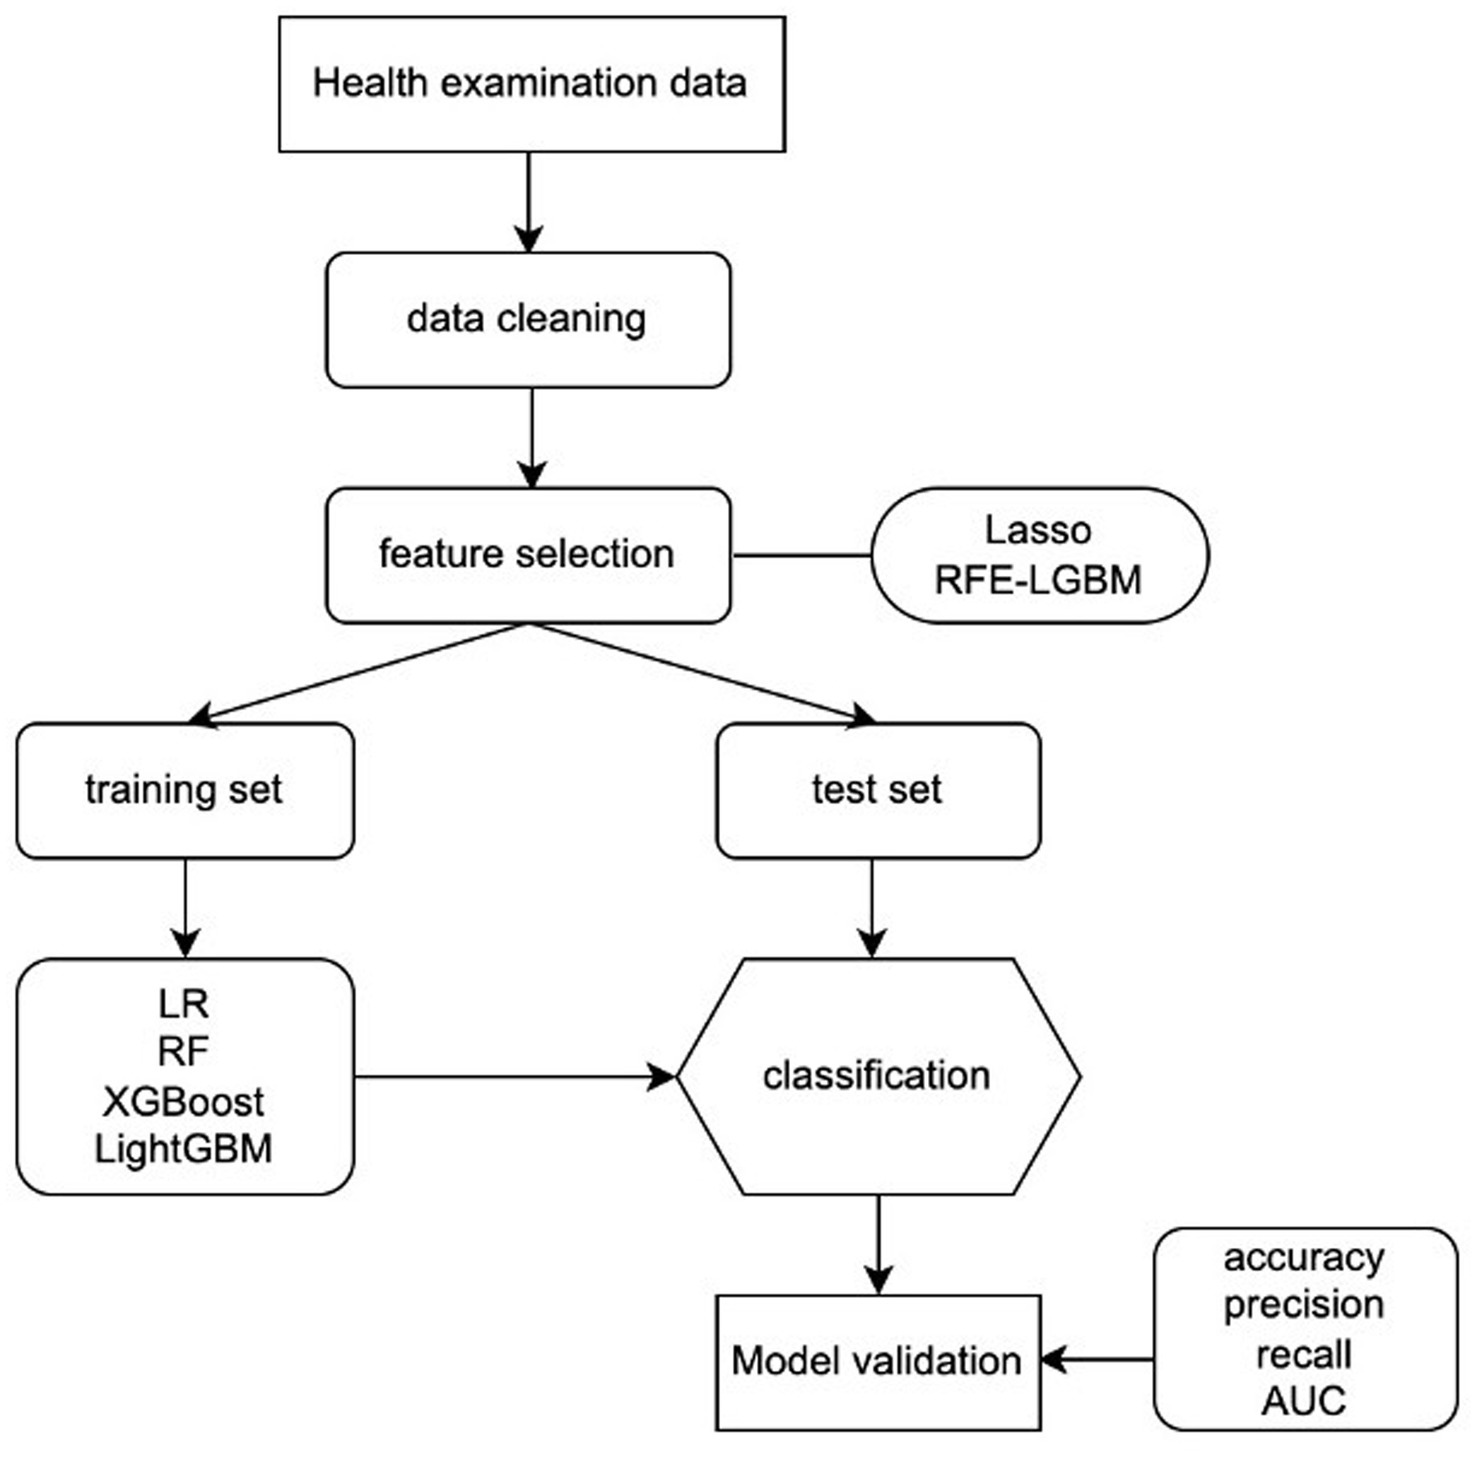
Figure 1. Machine learning flowchart of this study. LR, logistic regression; RF, random forest; XGBoost, extreme gradient boosting; LightGBM, Light gradient boosting machine; RFE-LGBM, recursive feature elimination-Lightweight Gradient Elevator; AUC, area under the receiver operating characteristic curve.
2.6 Feature importance ranking
Shapley additive explanations (SHAP) value was defined as the average marginal contribution of a feature value across all possible feature coalitions. It provides insights into the influence of each feature on individual samples, showcasing both positive and negative effects.
ML was implemented in Python (v 3.6) using the sklearn (v. 0.24.1) and XGBoost (v. 1.3.3) packages. Bayesian optimization based on the TPE toolbox (bayes_opt v. 1.2.0) was used to tune hyperparameters for learning algorithms when the best combination of parameters yielded a low model performance. SHAP (V 0.41.0) was for explainable ML.
3 Results
3.1 Characteristics of the study population
A total of 77,134 subjects were included, with a mean age of 48.6 ± 11.4 years, and 54.9 ± 10.6 years in subjects with EAS. The sample prevalence of EAS was 40.8%. Significant differences (p < 0.01) were observed in age, BMI, WC, SBP/DBP, indicators concerning renal function, FBS, total cholesterol (TC), triglyceride (TG), high−/low-density lipoprotein cholesterol (HDL-c/LDL-c) (Table 1), sex, history of cardiovascular diseases, smoking, exercise, work intensity, sedentary time, sleeping quality and time, 16 items of dietary habits, 9 items of negative emotions, and 12 items of health literacy (Table 2) between EAS and non-EAS.
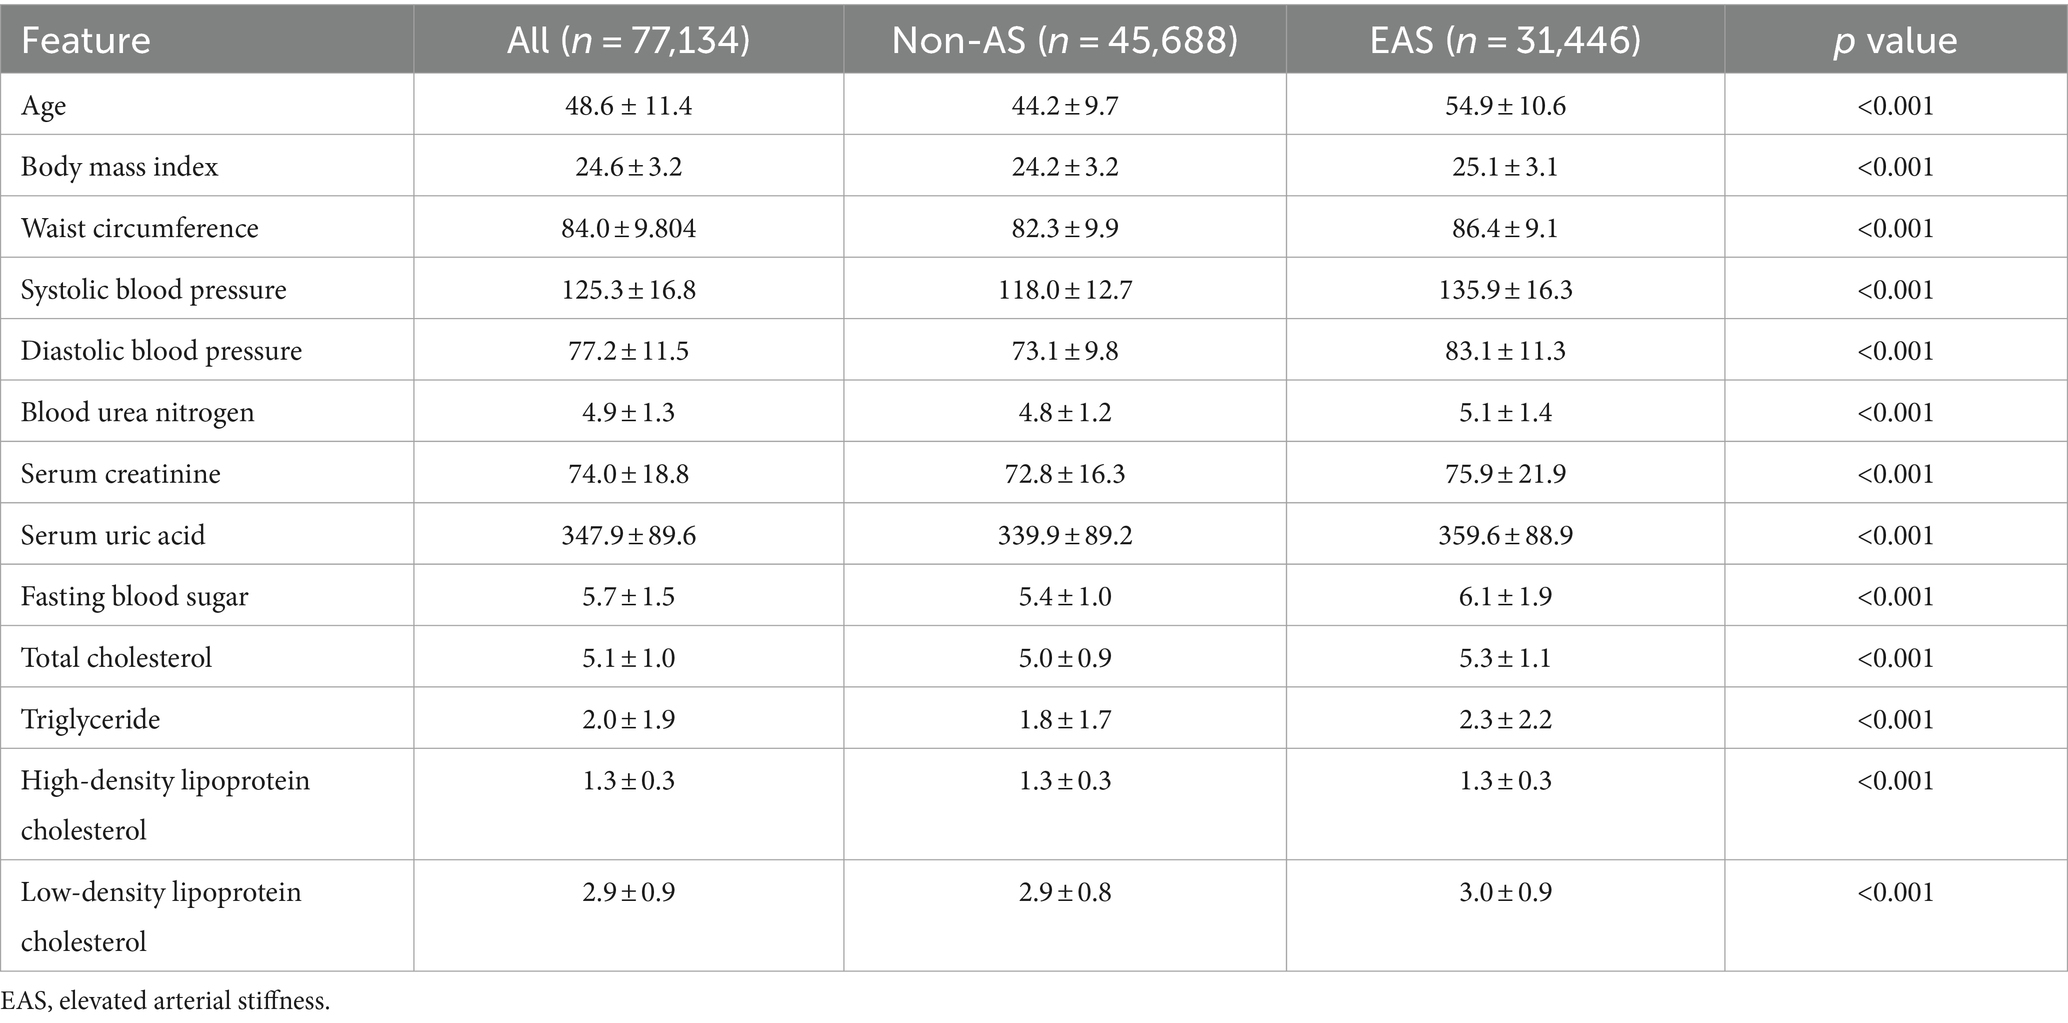
Table 1. Features of the participants that are continuous data in primary settings.
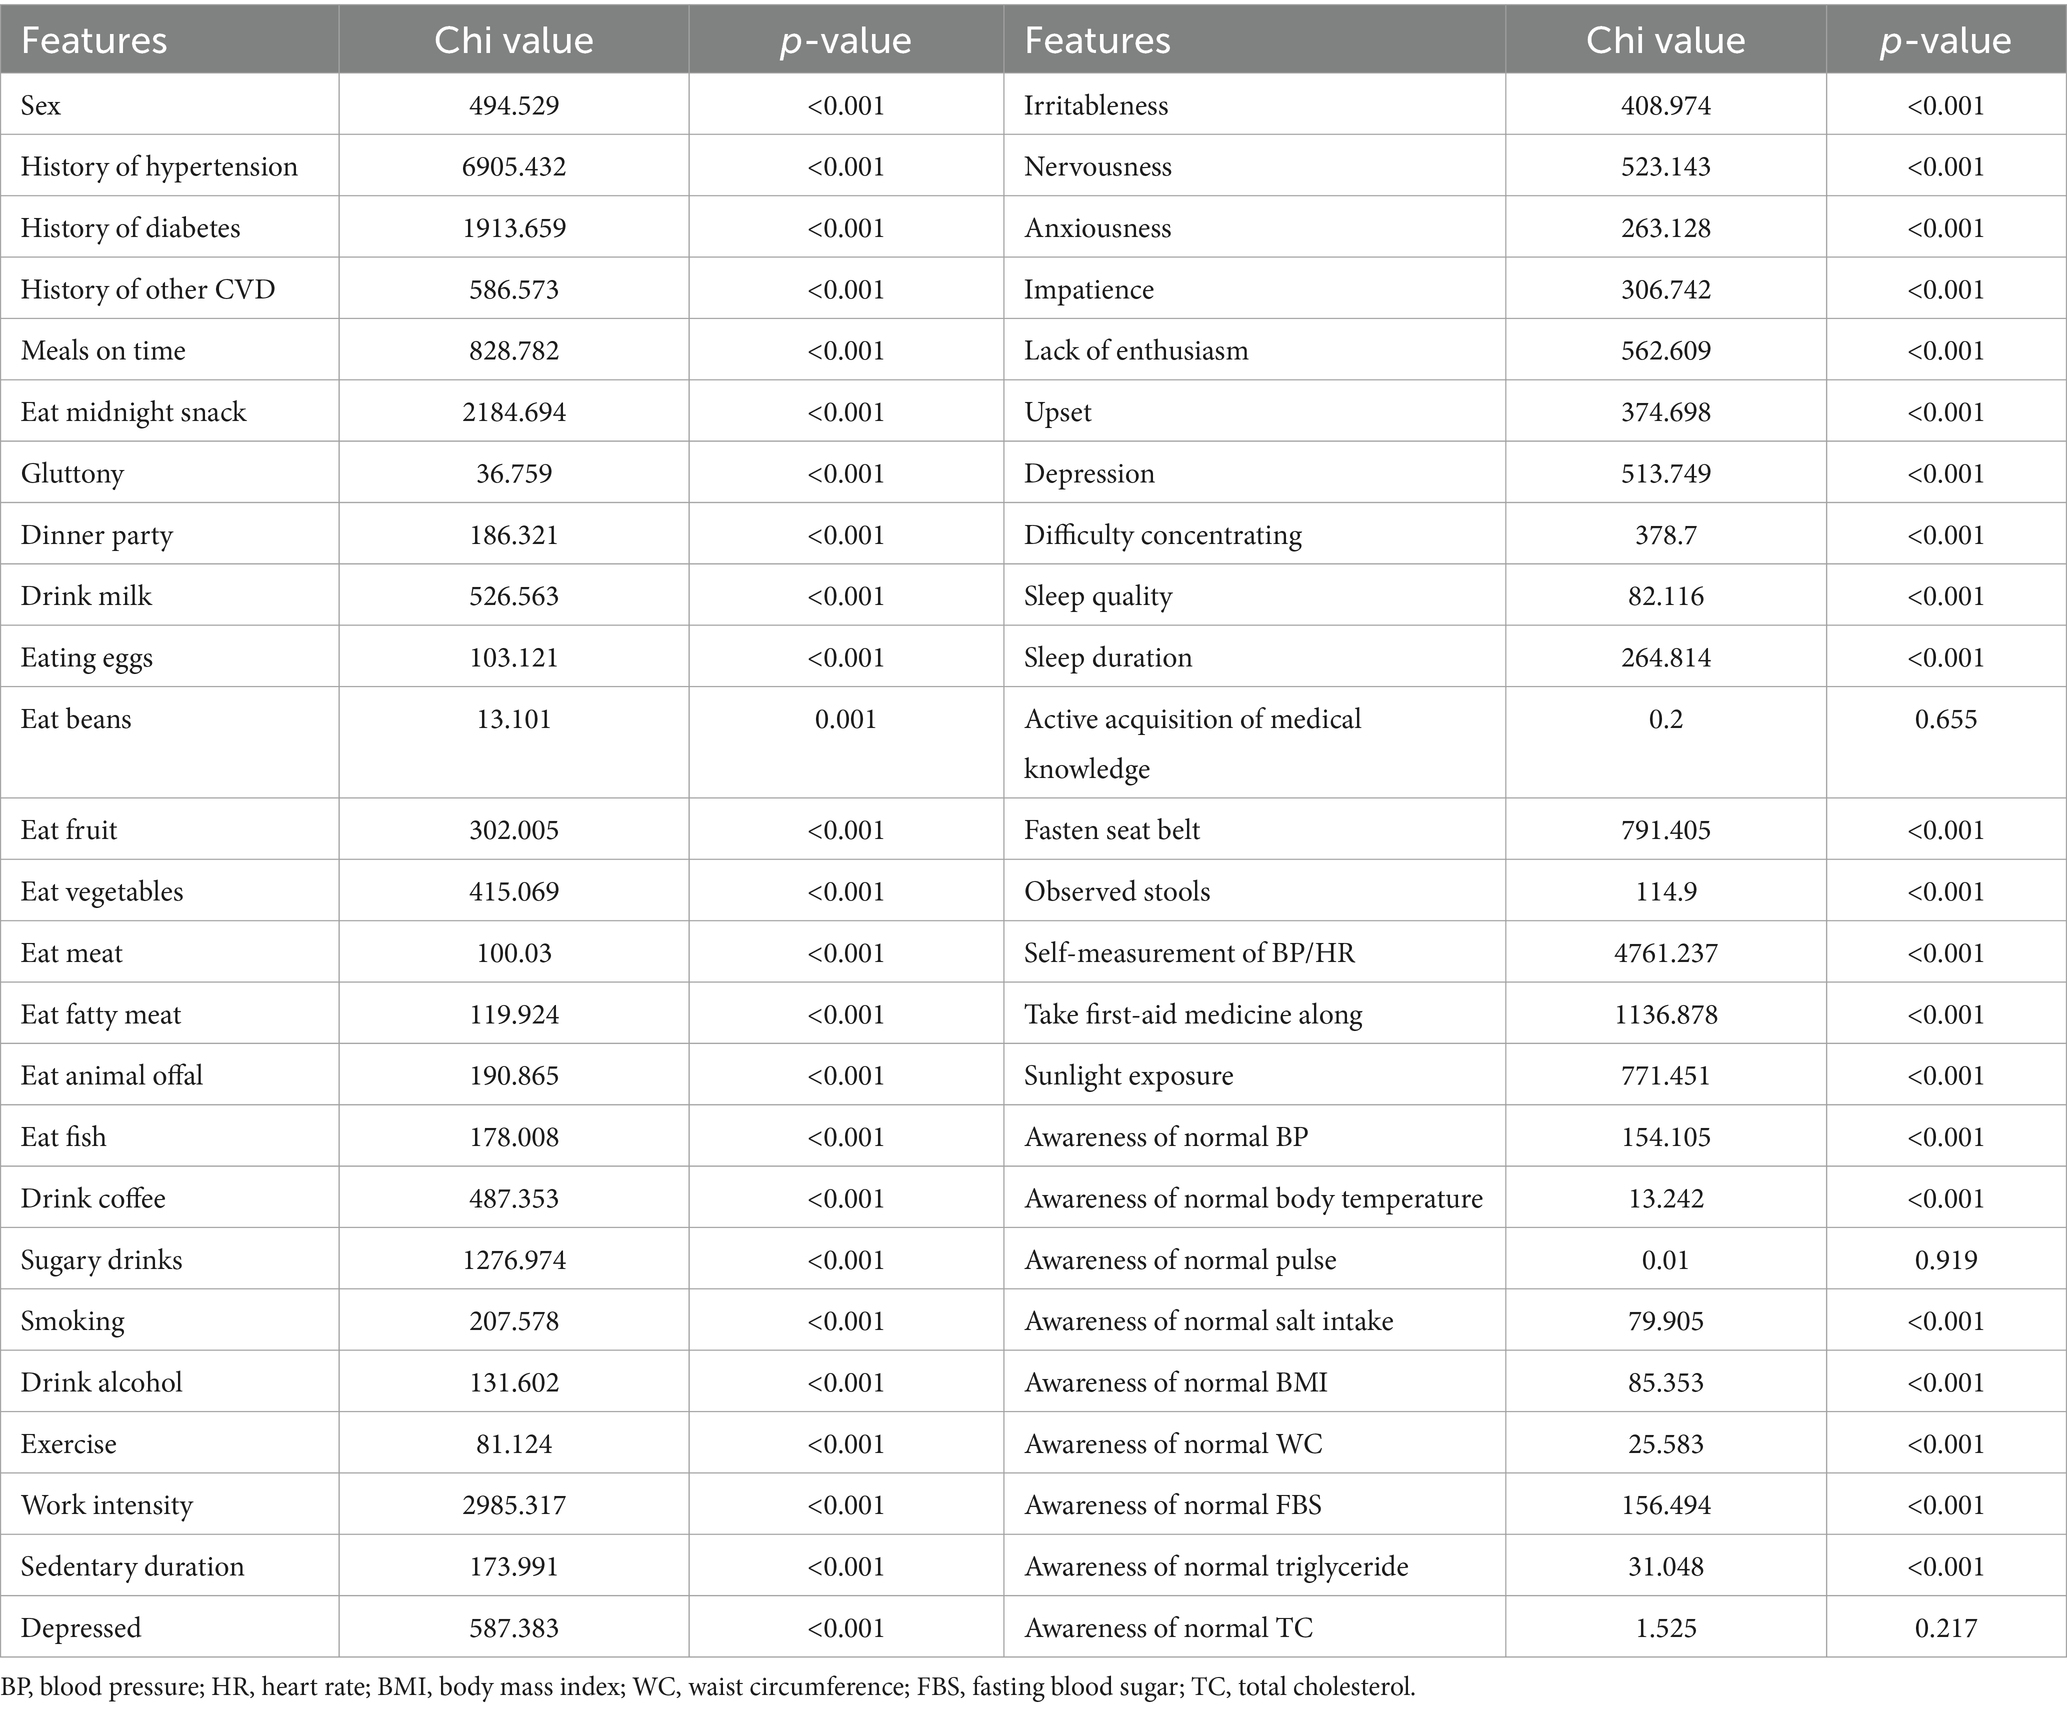
Table 2. Features of the participants that are categorical data in primary settings.
3.2 Feature selection
Three health literacy items (active in the acquisition of medical knowledge and awareness of normal pulse rate/total cholesterol) with no statistical difference were removed from further analysis, and 60 features were input for subsequent feature selection.
The Lasso regression ranked the features based on their parameter values, and the bottom 25 features (Figure 2A) were visually observed. Subsequently, 21 features with zero parameter values were deleted, including LDL-c, history of other cardiovascular diseases (excluding hypertension and diabetes), awareness of normal salt intake/FBS/TG values, sunlight exposure, lack of enthusiasm, impatience, difficulty concentrating, nervousness, upset, meals on time, gluttony, frequency of consumption of eggs, vegetables, fat, animal offal, coffee, sugary drinks, sedentary duration, and dinner party.
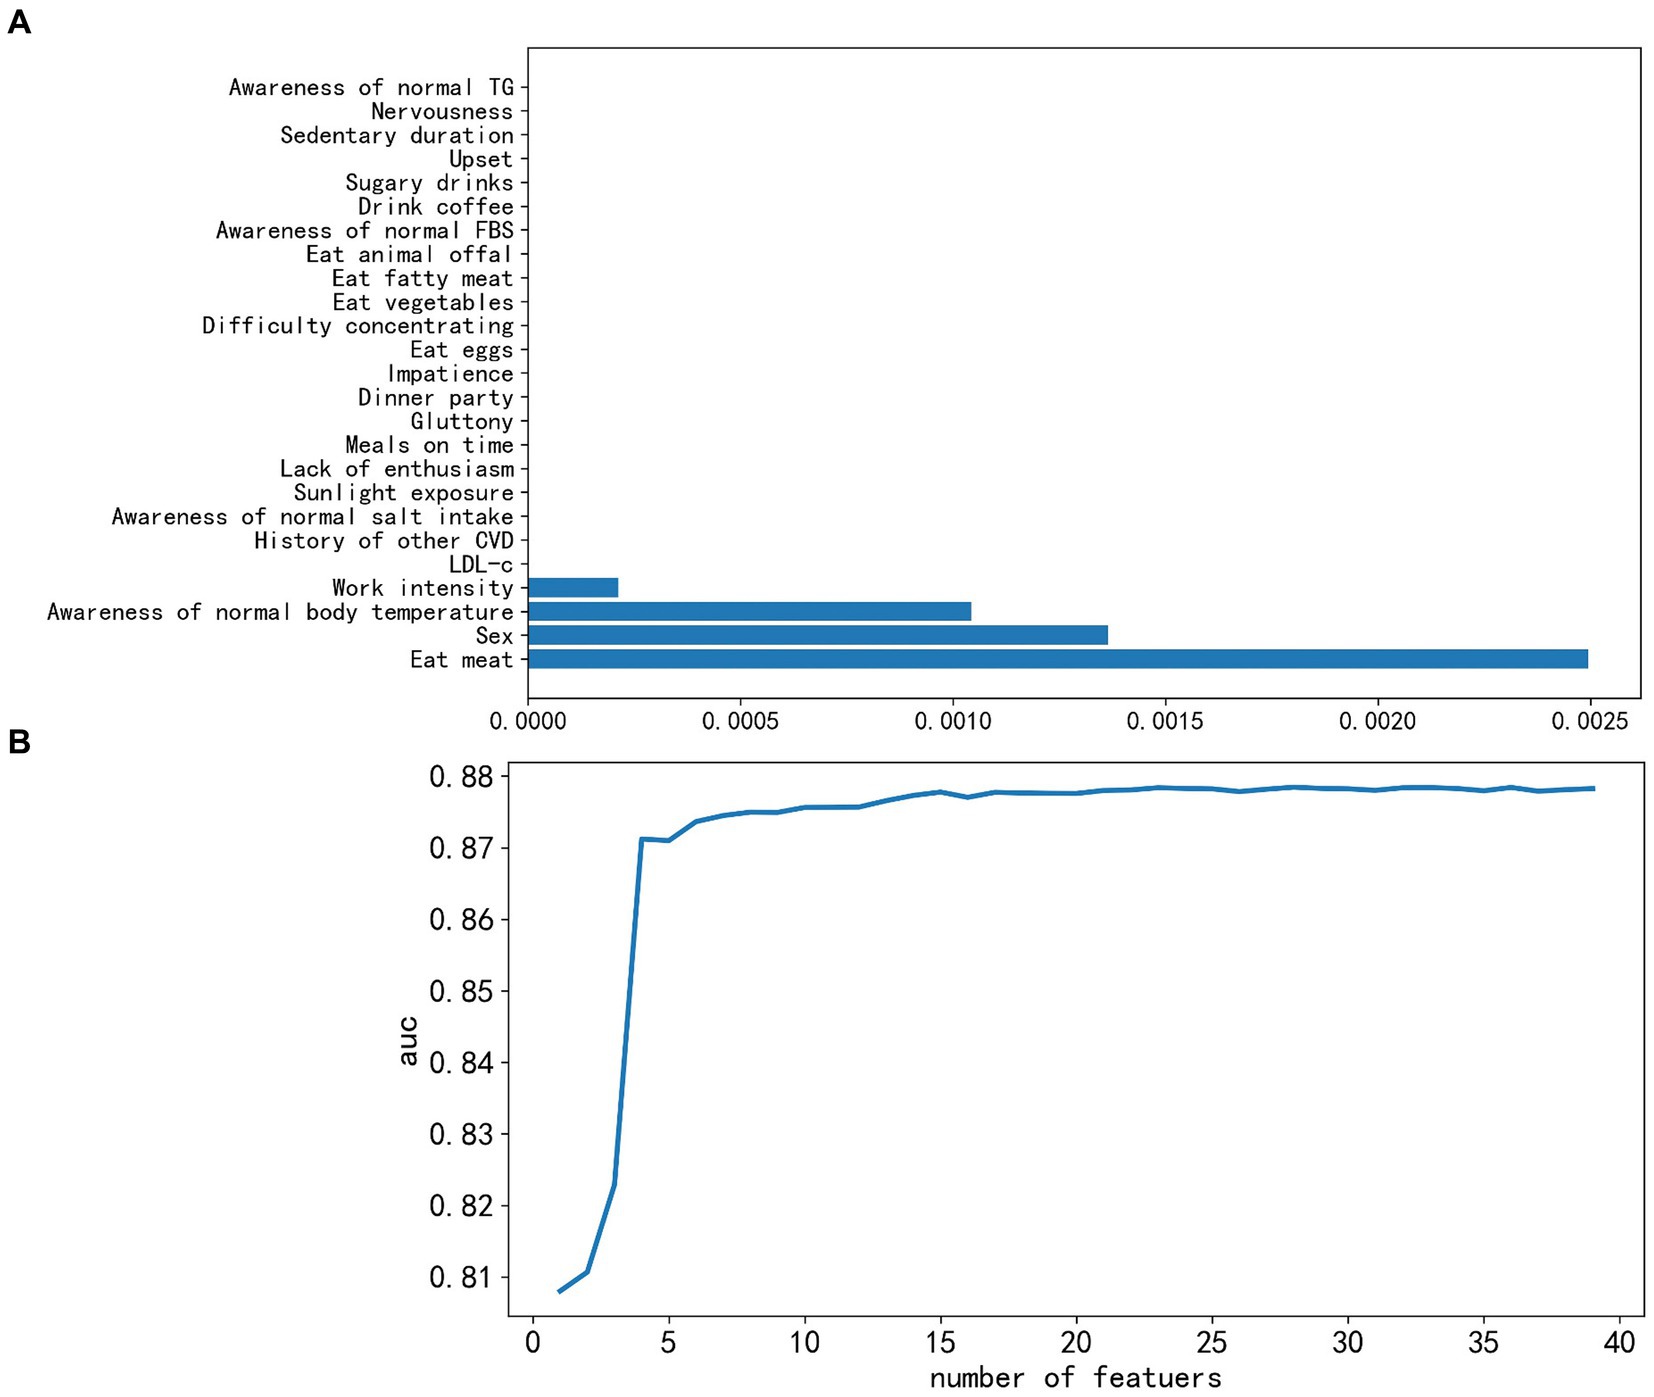
Figure 2. Feature selection successively using the Lasso algorithm and recursive feature elimination-lightweight gradient elevator (RFE-LGBM). (A) Coefficients profile of bottom 25 features resulting from the Lasso algorithm, where features with zero coefficients were removed. (B) Five-fold cross-validation criterion of RFE based on LGBM, 23 features were optimal and finally kept. AUC, area under the receiver operating characteristic curve.
The 39 reserved features were considered too much, and we adopted the LGBM model to train them further. With each addition, AUC scores for the test set were recorded. As depicted in Figure 2B, there was a discernible decrease in the score as we integrated 23 features one by one; continuous feature addition not only raised computational costs but also failed to enhance model performance. Consequently, we discarded the 16 non-contributory features. The remaining 23 significant features were sex, age, history of hypertension, SBP, DBP, BMI, WC, TC, TG, HDL-c, FBS, serum uric acid, serum creatinine, urea nitrogen, exercise, awareness of normal BP, the consumption frequency of items such as fruit, milk, bean products, alcohol, and smoking, work intensity, and irritableness. An important observation was the strong linear correlation between BMI and WC (r = 0.86) and between SBP and DBP (r = 0.78) (Supplementary Figure 1). For efficiency, we retained only WC and SBP, leading to a final 21 features for ML evaluation. It is noteworthy that we also developed a model that prioritizes features that are cost-effective and easily obtainable. Therefore, lab indicators were omitted, leaving us with 14 salient features.
3.3 Model performance and feature importance ranking
The performance of four classifiers—logistic regression (LR), random forest (RF), XGBoost, and LightGBM—across the training and test sets is detailed in Table 3 (for the 14-feature model) and Supplementary Table 1 (for the 21-feature model). Intriguingly, the incorporation of laboratory indicators in the 21-feature models resulted in only marginal improvements in performance compared to the 14-feature models. For instance, the AUC test scores showed negligible differences: LR (0.8746 vs. 0.8706), RF (0.8697 vs. 0.8695), XGBoost (0.8754 vs. 0.8710), and LGBM (0.8732 vs. 0.8702). This increment came at a significant cost to the testers, suggesting that classifiers with only 14 features are more suitable for broad public applications. In terms of overall performance, the XGBoost model modestly outshone the other classifiers in multiple metrics, including accuracy (0.7878), sensitivity (0.78), specificity (0.73), and AUC (0.8710) on the test set.
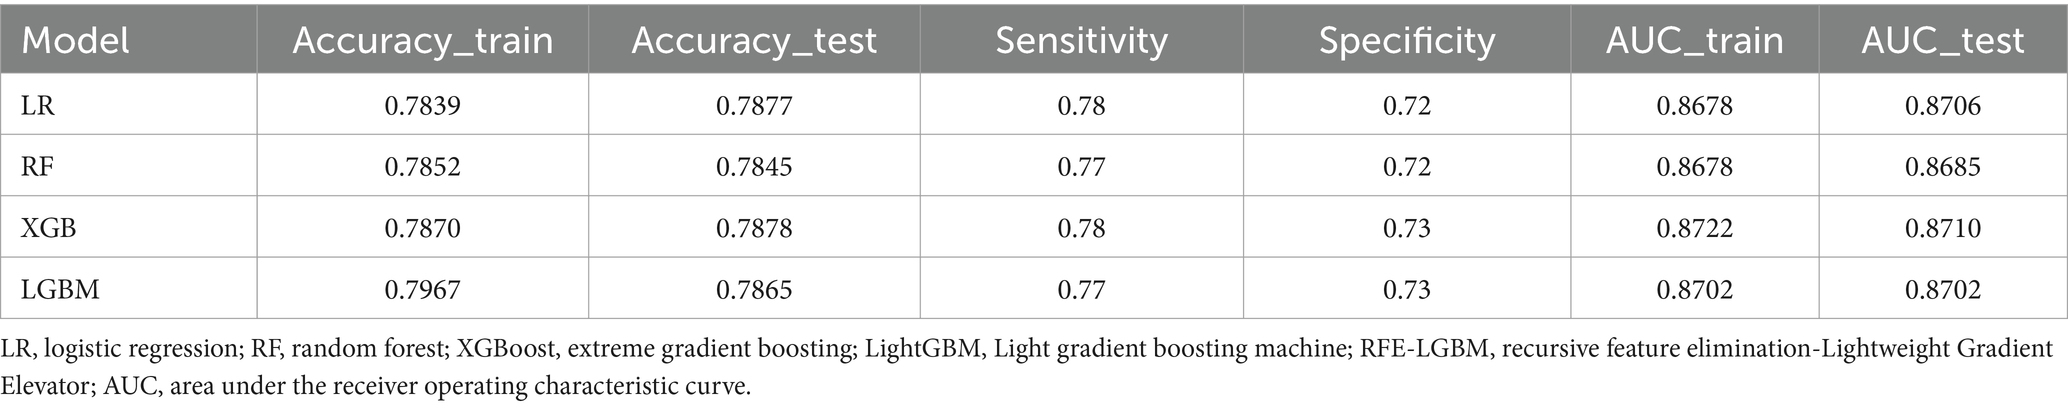
Table 3. The results of classification algorithms based on 14 costless features.
Feature importance was assessed in the XGBoost model, and the top 10 most influential features were identified as SBP, age, history of hypertension, FBS, TG, sex, smoking, fruit consumption, awareness of normal BP, and exercise, as shown in Figure 3. Figure 4 visually presents the SHAP values corresponding to the 14 most important features. The x-axis represents the SHAP values, while the y-axis lists the features; each dot symbolizes a sample. The color scale varies from low (blue) to high (red), indicating the feature values. A positive SHAP value indicates contributing to EAS formation, whereas a negative value suggests inhibition. The top 5 features in terms of importance were SBP, age, WC, history of hypertension, and sex.
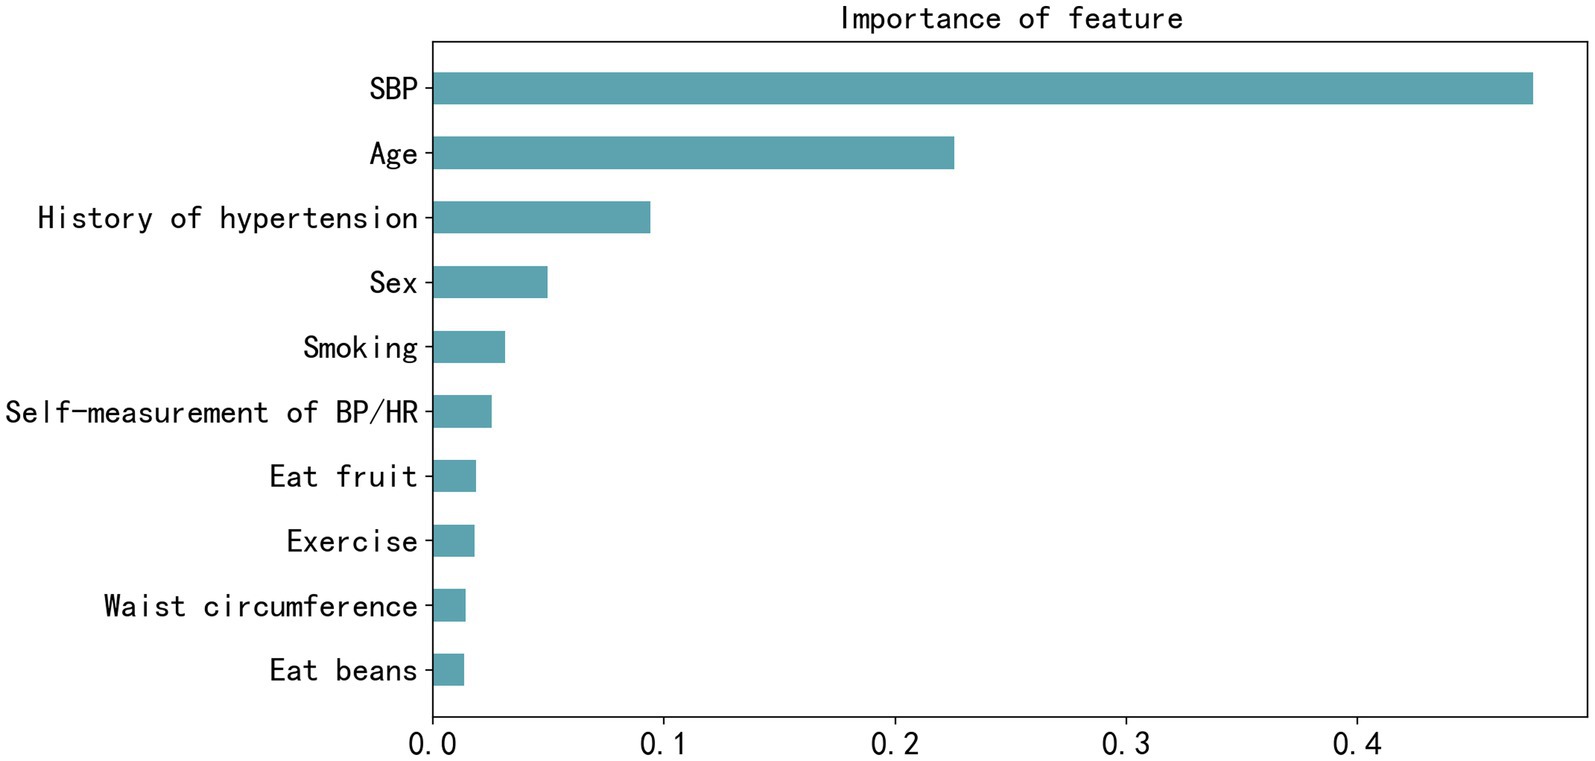
Figure 3. Feature importance plot of the best-performing extreme gradient boosting model measured by F-score. SBP, systolic blood pressure; BP, blood pressure; HR, heart rate.
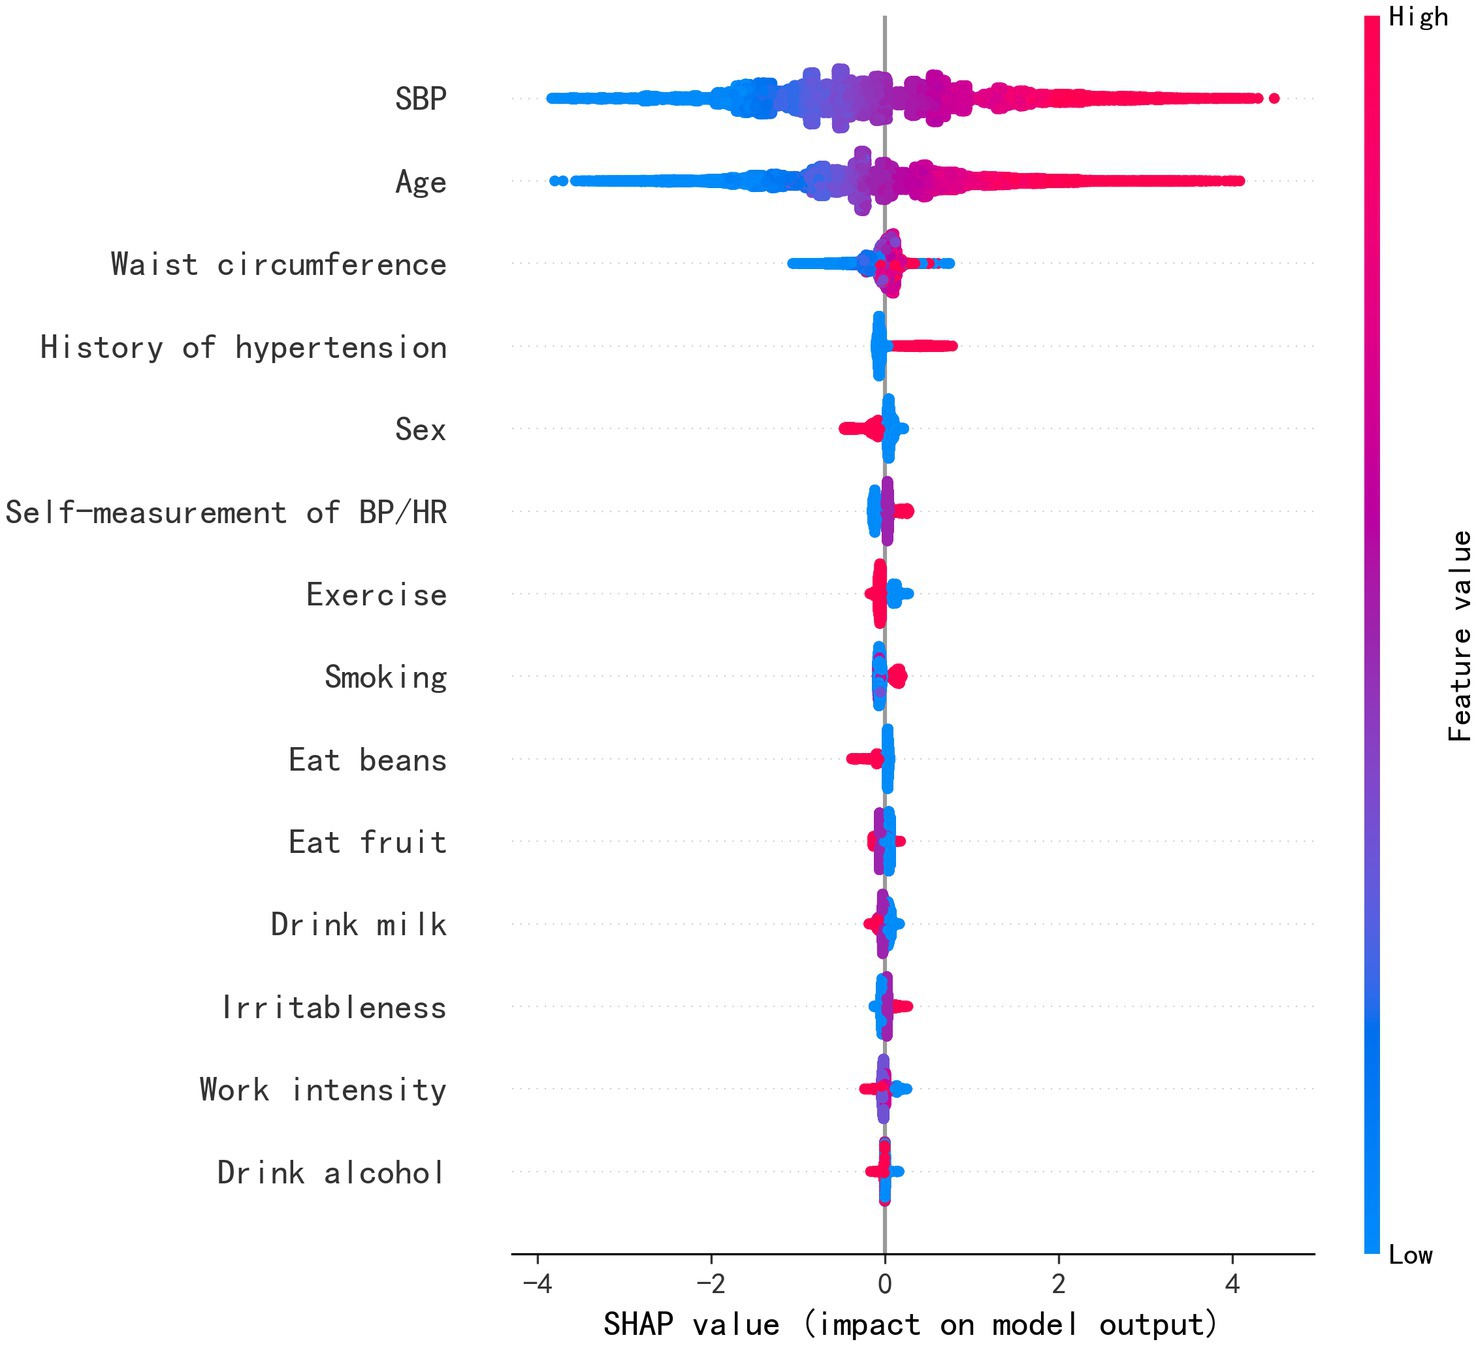
Figure 4. Feature weight sorting by Shapley additive explanations (SHAP) value. SBP, systolic blood pressure; BP, blood pressure; HR, heart rate.
4 Discussion
In this study, we established four ML models for arterial stiffness screening in a large-scale physical examination population using easily accessible measurements and questionnaire indicators. Among them, XGBoost demonstrated superior performance in validation. Interestingly, while including optional laboratory features led to a minor enhancement in model performance, the gains may not justify the increased complexity and costs. This model holds promise for predicting early-stage vascular aging, particularly in regions with elevated epidemiological risks.
Traditional CVD risk factors played a noticeable role in affecting arterial stiffness (AS). A meta-analysis (21) highlighted age and blood pressure as the primary determinants of arterial stiffness. Additionally, history of hypertension and waist circumference were also influential factors. Regarding the more costly and invasive laboratory indices, abnormalities in glucose metabolism (22), triglyceride (23), HDL-c, uric acid (24), and glomerular filtration rate (GFR) (25) as determined by serum creatinine have all been linked to varying degrees with arterial stiffness. Our model, which incorporated 21 features—including both questionnaire items and select laboratory indices—aligns well with findings from previous studies. However, one exception was total cholesterol (26, 27), where its potential anti-stiffening effects remain a matter of debate. A notable model for assessing arterial stiffness is the SAGE scoring system. This model, derived from a cohort of 3,943 outpatients and using multiple logistic regression, incorporated variables such as SBP, age, glycemia, and GFR. Impressively, it achieved a 0.77 ROC in its validation cohort (28).
Most traditional models related to cardiovascular risk integrate both laboratory and clinical parameters (29–31). Securing these variables often entails financial expenditures, making the broad application of such models somewhat limited in the general population (32). In our earlier exploration, we compared results derived from both self-assessment items and blood tests with those garnered exclusively from self-assessment features. Intriguingly, the differences were minimal, which we attribute primarily to the overwhelming influence of factors such as blood pressure, age, and waist circumference. A notable strength of our study is its reliance on non-invasive, easily obtainable indicators that come at a minimal cost, which are sufficient to craft a scalable EAS model. However, using a vast number of these indicators poses challenges. These raw datasets tend to be non-linear, intricate, and possibly inter-correlated or influenced by a plethora of confounding variables (33). This complexity could lead to significant deviations and diminished accuracy when building models. Given this backdrop, ML algorithms emerge as a preferable approach, offering a remedy to these pitfalls. We initially employed LASSO and RFE-LGBM to filter out superfluous features and avert overfitting caused by collinearity. Ultimately, leveraging four distinct ML algorithms to assess EAS proved more effective than relying on a single model. Notably, XGBoost marginally surpassed the other three in metrics such as accuracy, sensitivity, specificity, and AUC.
Contrary to conventional methodologies such as logistic regression, which operate under the presumption of variables being independent and purely linear (34), XGBoost adopts a non-parametric approach. It integrates a regularized loss function and marries gradient-boosting algorithms with decision trees, preserving inter-feature correlations (35). We theorize that this unique characteristic underpins XGBoost’s standout performance.
Another study that focused on assessing the risk of EAS in diabetic patients reported ROC values of 0.928 and 0.821 using a gradient-boosting algorithm for a discovery dataset of 760 Chinese individuals and a validation dataset of 912 Japanese individuals, respectively (19). In comparison, our study’s significantly larger dataset ensured a more normal distribution and, consequently, more precise analyses. The ROC values in our study were 0.8826 and 0.8754 for the training and test datasets, respectively. The closer alignment of these values suggests a superior model fit (36). Furthermore, by targeting the general population rather than specialized groups, our model may boast broader applicability.
Currently, PWV assessment is used for patients suspected or diagnosed with CVD and individuals undergoing self-funded health examinations in Chinese hospitals. However, it is challenging to implement PWV screening for the general population outside of hospital settings to enhance the management of CVD. Moreover, the subject’s general physical examination reveals the need for a more standardized approach in developing personalized medical examination programs, particularly concerning vessel checks. Currently, the formulation of these programs is largely influenced by the individual’s economic status, resulting in either missed diagnoses due to inadequate testing or unnecessary resource wastage through over-testing. For instance, the number of physical examinees in China surged from 444 to 549 million in 3 years, according to the China Health Statistics Yearbook, with the average cost per examination amounting to 755.8¥ (37). This typically includes visceral color ultrasound and selected blood tests such as lipid, glucose, hepatic and renal function, and complete blood count (38). However, this cost does not necessarily cover more specialized, expensive tests such as arterial stiffness assessments, CT scans, or gastrointestinal endoscopies. This suggests that early identification measures in primary care remain inadequate, even for those who undergo routine physicals, let alone those who have not visited a hospital. Therefore, incorporating a convenient and easily accessible assessment model into primary care could offer a cost-free initial screening for the general population. This would allow healthcare providers to tailor preventive strategies to those at higher risk. Machine learning models serve as a viable pathway for achieving this, particularly for asymptomatic individuals. At the current stage, the process of transforming a model derived from the research process into a practical clinical tool involves a productization process. This includes placing the model in the cloud or making it into a web-based version, accessible from anywhere. It also involves connecting certain data links, allowing data to be transferred from medical devices to the servers that host the model. We plan to make this model into an easily accessible web-based version.
4.1 Limitations
Our study is not free from limitations. First, given its cross-sectional design, it is not possible to infer causal relationships from the data. However, previous studies had established definite causality that we could follow. Our initial intention for the research was to assess the current status of arterial aging, thus making the study design reasonable. Second, the standards for evaluating certain lifestyle factors, such as fruit and bean consumption or exercise habits, were not unified and objectively quantified. This could potentially decrease the prediction’s precision. Finally, since the study relies on data from physical examinations conducted in China, there may be restrictions on the applicability of the results to other ethnicities or cultures.
5 Conclusion
The primary aim of our research was to provide an effective model for evaluating the risk of early Arterial Stiffening (EAS) using only questionnaires and physical measurements. Overall, we found that the model’s diagnostic accuracy and assessment capabilities were satisfactory. Incorporating this risk assessment model into primary healthcare settings could significantly improve the prevention and management of arterial aging across the broader populace.
Data availability statement
The raw data supporting the conclusions of this article will be made available by the authors, without undue reservation.
Ethics statement
The studies involving humans were approved by the Ethics Committee of the Third Xiangya Hospital. The studies were conducted in accordance with the local legislation and institutional requirements. The participants provided their written informed consent to participate in this study.
Author contributions
RM: Conceptualization, Funding acquisition, Writing – original draft, Writing – review & editing. QD: Formal analysis, Writing – review & editing. XL: Data curation, Investigation, Writing – review & editing. YC: Data curation, Investigation, Writing – review & editing. JW: Project administration, Supervision, Writing – review & editing. JC: Conceptualization, Formal analysis, Methodology, Writing – review & editing.
Funding
The author(s) declare that financial support was received for the research, authorship, and/or publication of this article. This study was supported by the Wisdom Accumulation and Talent Cultivation Project of the Third Xiangya Hospital of Central South University, the Natural Science Foundation of Hunan (2021JJ40941).
Conflict of interest
The authors declare that the research was conducted in the absence of any commercial or financial relationships that could be construed as a potential conflict of interest.
Publisher’s note
All claims expressed in this article are solely those of the authors and do not necessarily represent those of their affiliated organizations, or those of the publisher, the editors and the reviewers. Any product that may be evaluated in this article, or claim that may be made by its manufacturer, is not guaranteed or endorsed by the publisher.
Supplementary material
The Supplementary material for this article can be found online at: https://www.frontiersin.org/articles/10.3389/fpubh.2024.1365479/full#supplementary-material
References
1. Wang, JC, and Bennett, M. Aging and atherosclerosis: mechanisms, functional consequences, and potential therapeutics for cellular senescence. Circ Res. (2012) 111:245–59. doi: 10.1161/CIRCRESAHA.111.261388
2. Zhou, YF, Wang, Y, Wang, G, Zhou, Z, Chen, S, Geng, T, et al. Association between statin use and progression of arterial stiffness among adults with high atherosclerotic risk. JAMA Netw Open. (2022) 5:e2218323. doi: 10.1001/jamanetworkopen.2022.18323
3. Nowak, KL, Rossman, MJ, Chonchol, M, and Seals, DR. Strategies for achieving healthy vascular aging. Hypertension. (2018) 71:389–402. doi: 10.1161/HYPERTENSIONAHA.117.10439
4. Lemogoum, D, Ngatchou, W, Janssen, C, Leeman, M, Van Bortel, L, Boutouyrie, P, et al. Effects of hunter-gatherer subsistence mode on arterial distensibility in Cameroonian pygmies. Hypertension. (2012) 60:123–8. doi: 10.1161/HYPERTENSIONAHA.111.187757
5. Calimport, SRG, Bentley, BL, Stewart, CE, Pawelec, G, Scuteri, A, Vinciguerra, M, et al. To help aging populations, classify organismal senescence. Science. (2019) 366:576–8. doi: 10.1126/science.aay7319
6. Aging Biomarker ConsortiumZhang, L, Guo, J, Liu, Y, Sun, S, Liu, B, et al. A framework of biomarkers for vascular aging: a consensus statement by the aging biomarker consortium. Life Med. (2023) 2:lnad033. doi: 10.1093/lifemedi/lnad033,
7. Mitchell, GF, Hwang, SJ, Vasan, RS, Larson, MG, Pencina, MJ, Hamburg, NM, et al. Arterial stiffness and cardiovascular events: the Framingham heart study. Circulation. (2010) 121:505–11. doi: 10.1161/CIRCULATIONAHA.109.886655
8. Vlachopoulos, C, Terentes-Printzios, D, Laurent, S, Nilsson, PM, Protogerou, AD, Aznaouridis, K, et al. Association of estimated pulse wave velocity with survival: a secondary analysis of SPRINT. JAMA Netw Open. (2019) 2:e1912831. doi: 10.1001/jamanetworkopen.2019.12831
9. Reference Values for Arterial Stiffness’ Collaboration. Determinants of pulse wave velocity in healthy people and in the presence of cardiovascular risk factors: ‘establishing normal and reference values’. Eur Heart J. (2010) 31:2338–50. doi: 10.1093/eurheartj/ehq165
10. Cunha, PG, Boutouyrie, P, Nilsson, PM, and Laurent, S. Early vascular ageing (EVA): definitions and clinical applicability. Curr Hypertens Rev. (2017) 13:8–15. doi: 10.2174/1573402113666170413094319
11. Mahmud, A, and Feely, J. Effect of smoking on arterial stiffness and pulse pressure amplification. Hypertension. (2003) 41:183–7. doi: 10.1161/01.hyp.0000047464.66901.60
12. Damay, VA, Setiawan,, Lesmana, R, Akbar, MR, Lukito, AA, Tarawan, VM, et al. Aerobic exercise versus electronic cigarette in vascular aging process: first histological insight. Int J Vasc Med. (2023) 2023:8874599. doi: 10.1155/2023/8874599
13. Keehn, L, Mangino, M, Spector, T, Chowienczyk, P, and Cecelja, M. Relation of pulse wave velocity to contemporaneous and historical blood pressure in female twins. Hypertension. (2023) 80:361–9. doi: 10.1161/HYPERTENSIONAHA.122.19311
14. Li, A, Yan, J, Zhao, Y, Yu, Z, Tian, S, Khan, AH, et al. Vascular aging: assessment and intervention. Clin Interv Aging. (2023) 18:1373–95. doi: 10.2147/cia.S423373
15. Stacey, RB, Bertoni, AG, Eng, J, Bluemke, DA, Hundley, WG, and Herrington, D. Modification of the effect of glycemic status on aortic distensibility by age in the multi-ethnic study of atherosclerosis. Hypertension. (2010) 55:26–32. doi: 10.1161/HYPERTENSIONAHA.109.134031
16. Taylor, AJ, Cerqueira, M, Hodgson, JM, Mark, D, Min, J, O'Gara, P, et al. ACCF/SCCT/ACR/AHA/ASE/ASNC/NASCI/SCAI/SCMR 2010 appropriate use criteria for cardiac computed tomography. A report of the American College of Cardiology Foundation appropriate use criteria task force, the Society of Cardiovascular Computed Tomography, the American College of Radiology, the American Heart Association, the American Society of Echocardiography, the American Society of Nuclear Cardiology, the North American Society for Cardiovascular Imaging, the Society for Cardiovascular Angiography and Interventions, and the Society for Cardiovascular Magnetic Resonance. J Am Coll Cardiol. (2010) 56:1864–94. doi: 10.1016/j.jacc.2010.07.005
17. Barrios, JP, and Tison, GH. Advancing cardiovascular medicine with machine learning: progress, potential, and perspective. Cell Rep Med. (2022) 3:100869. doi: 10.1016/j.xcrm.2022.100869
19. Li, Q, Xie, W, Li, L, Wang, L, You, Q, Chen, L, et al. Development and validation of a prediction model for elevated arterial stiffness in Chinese patients with diabetes using machine learning. Front Physiol. (2021) 12:714195. doi: 10.3389/fphys.2021.714195
20. Yamashina, A, Tomiyama, H, Arai, T, Hirose, K-i, Koji, Y, Hirayama, Y, et al. Brachial-ankle pulse wave velocity as a marker of atherosclerotic vascular damage and cardiovascular risk. Hypertens Res. (2003) 26:615–22. doi: 10.1291/hypres.26.615
21. Cecelja, M, and Chowienczyk, P. Dissociation of aortic pulse wave velocity with risk factors for cardiovascular disease other than hypertension: a systematic review. Hypertension. (2009) 54:1328–36. doi: 10.1161/HYPERTENSIONAHA.109.137653
22. Tomiyama, H, Hashimoto, H, Hirayama, Y, Yambe, M, Yamada, J, Koji, Y, et al. Synergistic acceleration of arterial stiffening in the presence of raised blood pressure and raised plasma glucose. Hypertension. (2006) 47:180–8. doi: 10.1161/01.HYP.0000198539.34501.1a
23. Wang, L, Zhi, F, Gao, B, Ni, J, Liu, Y, Mo, X, et al. Association between lipid profiles and arterial stiffness: a secondary analysis based on a cross-sectional study. J Int Med Res. (2020) 48:300060520938188. doi: 10.1177/0300060520938188
24. Saijo, Y, Utsugi, M, Yoshioka, E, Horikawa, N, Sato, T, Gong, YY, et al. Relationships of C-reactive protein, uric acid, and glomerular filtration rate to arterial stiffness in Japanese subjects. J Hum Hypertens. (2005) 19:907–13. doi: 10.1038/sj.jhh.1001913
25. Yoshida, M, Tomiyama, H, Yamada, J, Koji, Y, Shiina, K, Nagata, M, et al. Relationships among renal function loss within the normal to mildly impaired range, arterial stiffness, inflammation, and oxidative stress. Clin J Am Soc Nephrol. (2007) 2:1118–24. doi: 10.2215/CJN.01880507
26. Liu, J, Fan, F, Liu, B, Li, K, Jiang, Y, Jia, J, et al. Association between remnant cholesterol and arterial stiffness in a Chinese community-based population: a cross-sectional study. Front Cardiovasc Med. (2022) 9:993097. doi: 10.3389/fcvm.2022.993097
27. Chen, H, Chen, Y, Wu, W, Cai, Z, Chen, Z, Yan, X, et al. Total cholesterol, arterial stiffness, and systolic blood pressure: a mediation analysis. Sci Rep. (2021) 11:1330. doi: 10.1038/s41598-020-79368-x
28. Xaplanteris, P, Vlachopoulos, C, Protogerou, AD, Aznaouridis, K, Terentes-Printzios, D, Argyris, AA, et al. A clinical score for prediction of elevated aortic stiffness: derivation and validation in 3943 hypertensive patients. J Hypertens. (2019) 37:339–46. doi: 10.1097/HJH.0000000000001904
29. Liu, X, Shen, P, Zhang, D, Sun, Y, Chen, Y, Liang, J, et al. Evaluation of atherosclerotic cardiovascular risk prediction models in China: results from the CHERRY study. JACC Asia. (2022) 2:33–43. doi: 10.1016/j.jacasi.2021.10.007
30. Xing, X, Yang, X, Liu, F, Li, J, Chen, J, Liu, X, et al. Predicting 10-year and lifetime stroke risk in Chinese population. Stroke. (2019) 50:2371–8. doi: 10.1161/STROKEAHA.119.025553
31. Hippisley-Cox, J. C Coupland, and P brindle, development and validation of QRISK3 risk prediction algorithms to estimate future risk of cardiovascular disease: prospective cohort study. BMJ. (2017) 357:j2099. doi: 10.1136/bmj.j2099
32. Duval, S, and Van't, JR. Hof, LM Steffen, and RV Luepker, estimation of cardiovascular risk from self-reported knowledge of risk factors: insights from the Minnesota heart survey. Clin Epidemiol. (2020) 12:41–9. doi: 10.2147/clep.S219708
33. Batool, S, Taj, IA, and Ghafoor, M. Ejection fraction estimation from echocardiograms using optimal left ventricle feature extraction based on clinical methods. Diagnostic. (2023) 13:2155. doi: 10.3390/diagnostics13132155
34. Stoltzfus, JC. Logistic regression: a brief primer. Acad Emerg Med. (2011) 18:1099–104. doi: 10.1111/j.1553-2712.2011.01185.x
35. Thomas, J, Hepp, T, Mayr, A, and Bischl, B. Probing for sparse and fast variable selection with model-based boosting. Comput Math Methods Med. (2017) 2017:1421409. doi: 10.1155/2017/1421409
36. Muscarella, R, Galante, PJ, Soley-Guardia, M, Boria, RA, Kass, JM, Uriarte, M, et al. ENMeval: an R package for conducting spatially independent evaluations and estimating optimal model complexity for Maxent ecological niche models. Methods Ecol Evol. (2014) 5:1198–205. doi: 10.1111/2041-210X.12261
37. Gao, X, Wu, F, Chu, J, Wu, S, and Zeng, Q. Development trend of physical examination volume and revenue in health-checkup institutions in China from 2010 to 2019. Chin J Health Manage. (2023) 17:96–101.
Keywords: machine learning, XGBoost, arterial stiffness, physical examination, questionnaire, feature
Citation: Miao R, Dong Q, Liu X, Chen Y, Wang J and Chen J (2024) A cost-effective, machine learning-driven approach for screening arterial functional aging in a large-scale Chinese population. Front. Public Health. 12:1365479. doi: 10.3389/fpubh.2024.1365479
Edited by:
Dmytro Chumachenko, National Aerospace University – Kharkiv Aviation Institute, UkraineReviewed by:
Vinod Kumar, Institute of Microbial Technology (CSIR), IndiaUdhaya Kumar, Baylor College of Medicine, United States
Copyright © 2024 Miao, Dong, Liu, Chen, Wang and Chen. This is an open-access article distributed under the terms of the Creative Commons Attribution License (CC BY). The use, distribution or reproduction in other forums is permitted, provided the original author(s) and the copyright owner(s) are credited and that the original publication in this journal is cited, in accordance with accepted academic practice. No use, distribution or reproduction is permitted which does not comply with these terms.
*Correspondence: Jianwen Chen, andjaGVuQGh1dGIuZWR1LmNu; Jiangang Wang, NjAwNDEwQGNzdS5lZHUuY24=
†These authors have contributed equally to this work