 Endeshaw A. Derso1,2,3*†
 Kassahun A. Gelaye3
 Maria G. Campolo1Amare T. Woldemariam3,4,5Angela Alibrandi1
- 1Department of Economics, University of Messina, Messina, Italy
- 2Department of Statistics, College of Natural and Computational Science, University of Gondar, Gondar, Ethiopia
- 3Lihiket (Excellence) Institutional Development and Postdoctoral Fellowship Programme, Department of Epidemiology and Biostatistics, Institute of Public Health, University of Gondar, Gondar, Ethiopia
- 4Department of Human Nutrition, Institute of Public Health, College of Medicine and Health Sciences, University of Gondar, Gondar, Ethiopia
- 5Department of Women's and Children's Health, Karoliniska Institutet, Stockholm, Sweden
Objective: Childhood morbidities are crucial for improving long-term public health outcomes. This study aimed to examine the existence of child-specific and regional variation in childhood morbidity based on the cross-cutting study of the Performance Monitoring for Action Ethiopia community survey (PMA-ET), and its relationship to socioeconomic and demographic variables in families.
Methods: We enrolled 2,581 children suffering from different illnesses from six regions of the country of the survey at 6 weeks postpartum. Generalized linear mixed models (GLMMs) with maximum likelihood estimation were used to assess children's comorbidity status, and the DHARMa package in R to provide readily interpretable scaled residuals and test functions for typical model misspecification problems for the fitted GLMMs.
Results: GLMMs with two random intercept models show the presence of child morbidity variations. Cough, fever, and diarrhea were found to be the most frequent types of children's illnesses among the main illness categories that were recorded. Cooking fuel, wealth quartiles, mothers' marital status, mother age, parity, residence, mother's education status, and availability of electricity were significantly associated with children's morbidity.
Conclusions: These data show that variations in children's comorbidity were associated with both regional and child-specific characteristics. Thus, general principles for designing policies and interventions are required to reduce child comorbidity.
1 Introduction
Child morbidity the perception of being unwell as a result of specific conditions or illnesses. This term pertains to the prevalence of health issues that affect the wellbeing of children. Infectious diseases, such as pneumonia, diarrhea, and malaria, are the leading causes of global under-five child deaths (1, 2). Alarming statistics reveal that two-thirds of global child mortality occurs in underdeveloped countries. As a result, in order to reduce global child mortality, the urgent need to address child morbidity in low and middle income countries is evident, particularly as these region are struggling to meet the Sustainable Development Goal (SDG) target related to child mortality reduction (target 3.2), which aims to bring child deaths per thousand live birth down to 25 by the year 2023 (3, 4).
While there has been a notable decline in global under-five child mortality in recent decades, the progress in developing and under-developed regions, such as Africa and Bangladesh, has not been satisfactory (4, 5). Reports from the World Health Organization indicate that the Sub-Saharan Africa and the South Asia bear the burden of ~80% of all child deaths worldwide (6). A recent study conducted in Tanzania stated that, 63 child deaths per thousand live births occurred in the 2016 estimate in Tanzania, though it was declined by 42%. A separated study conducted in Tanzanian, drawing data from 35 hospitals, identified respiratory distress as the primary cause of early neonatal death, accounting for approximately 21% of cases (4, 7, 8). Despite the fact that Ethiopia's infant mortality rate fell from 34.010 deaths per 1,000 live births in 2020 to 29.524 deaths per 1,000 live births in 2023 (9), child morbidity was still significant, particularly among children under the age of one (10).
Therefore, to successfully design a national program for childhood morbidity intervention, it is necessary to identify determinants in a local context. Hence, several earlier studies suggested that environmental, socioeconomic, demographic, and health-associated factors lead to childhood morbidity globally (11–18). For instance, mother's age, mother's education, family wealth, handwashing, sanitation, child's gender, child's anemia level, husband's education level, mother's job status, mother's marital status, breastfeeding status, and exposure to morbidity information have been found to have an effect on child morbidity (10, 12, 13, 15, 19–28). Two-parent families have more stable family structures and stronger social support networks for their children's to improve their child health (29–31). Likewise, the rate of children's illness also differs across geographical regions, their residence, high-parity-births, and the availability of electricity (11, 15, 32–35). Obstructive sleep apnea (OSA) can also cause serious morbidity in middle-age women and even it may lead to an increased risk of high blood pressure, high cholesterol, prediabetes, and other heart and blood vessel conditions in children (36, 37), compared to older children, infants with OSA have different comorbidities (38).
Furthermore, previous studies in Ethiopia have identified a wide range of risk factors, including socioeconomic, environmental, demographic, and other elements that influence childhood morbidity (35, 39–43). However, most of these studies focus on predicting factors associated with a single health condition, even though children in Ethiopia suffer from multiple health problems due to limited access to health services and poor household socioeconomic environments in the country. Furthermore, understanding the cause and expected outcome of morbidity in children will be insufficient if the focus is on specific diseases or categories of illnesses (44, 45). Besides, previous studies also did not account for potential variation among clusters of individuals or groups and none of them deals with insights to unravel the intricate relationship between child health and cluster context in Ethiopia. Thus, to account for this source of variability, we propose a generalized linear mixed models (GLMMs) that can be used to analyze data that is collected from multiple subjects within different clusters or clustered data, and handle random effects that used to model the variability in the response variable due to the grouping structure of the data (46). GLMMs can model both common and individual behaviors, contain more information, have more variability, and are more efficient than pure time series or cross-sectional data (47).
Therefore, in this paper, we specifically focus on studying within-subject variation and between-subject effects in GLMMs to understand how child comorbidity varies within and between subjects by considering the child's id and region as random effects and to identify the factors associated with this heterogeneity. Our model incorporates diverse potential predictors for comorbidity sourced from the 2019 Performance Monitoring for Action Ethiopia (PMA-ET) community survey datasets. These datasets systematically gather information on child health and household characteristics, drawing from a nationally representative sample of households. It's worth noting that this dataset captures valuable information that is presently underutilized by other extensive surveys, such as demographic and health surveys like DHS (48).
In terms of parameter estimation, a likelihood-based approach is often recommended, with Akaike's information criteria serving as a tool for model selection in likelihood-based estimation (49). Furthermore, we use a simulation-based approach of the DHARMa package in R to create readily interpretable scaled (quintile) residuals for fitted GLMMs (50). Our analysis of advanced current methodological approaches with a recent data set of interest will provide robust information for the best possible planning of health services as well as a better understanding of the state of children's health.
2 Materials and methods
PMA Ethiopia generates timely cross-sectional and longitudinal data on reproductive, maternal, and new-born health indicators. We use the data from a nationally representative longitudinal study (cohort one study) conducted from October 2019 to August 2021 which collects details on mothers' characteristics and child health from a nationally representative sample of households.
2.1 Sampling and study design settings
PMA Ethiopia used a sampling method called multistage stratified cluster sampling to select households for their study. They selected households from specific clusters or enumeration areas (EAs), with the areas being chosen based on their size within different groups. In some regions, the strata were determined by the region and whether it was urban or rural, while in other regions, the strata were just based on the regions themselves. Within the regions that were part of the study, a census was conducted to identify all households and women between the ages of 15–49 who were regular members of the household.
All women who were aged 15–49 were screened, and those who reported being pregnant or having given birth in the past 6 weeks were eligible for the survey. Explicit inclusion criteria consisted of women aged 15–49 years who had recent births, as defined by the PMA-ET survey design. No additional exclusion criteria were applied due to limitations inherent in the original dataset, which did not provide further exclusion-related information. From this group, consenting eligible women were enrolled in the study and completed a baseline interview and were then reinter viewed at 6 weeks, 6 months, and 1 year postpartum by a trained interviewer. This study employs a cross-sectional analysis using data collected from baseline and six-week postpartum interviews. Specifically, we analyzed child morbidity variation and its association with socio-demographic, maternal, and child health-related factors at the six-week postpartum period. The baseline interview collected information about women's socio-demographic characteristics. PMA-ET was able to interview the minimum number of women per EA and achieve a sample that was representative on both national and regional levels. During the interview, women were asked about the socioeconomic characteristics of their households and the health status of their children. Among the 2,871 women contacted for the panel baseline interview, 2,855 enrolled pregnant or recently post-partum women in our survey, 2,664 completed six-week postpartum interviews (conducted at baseline and 6 weeks postpartum), 2,581 women with live births used for the analysis (71 women with miscarriage or abortion excluded; see Figure 1). Confounding variables were selected based on consistent associations reported in previous studies on child morbidity in similar settings; the validity and reliability of the data collection instruments were established by the original PMA-ET study team (48).
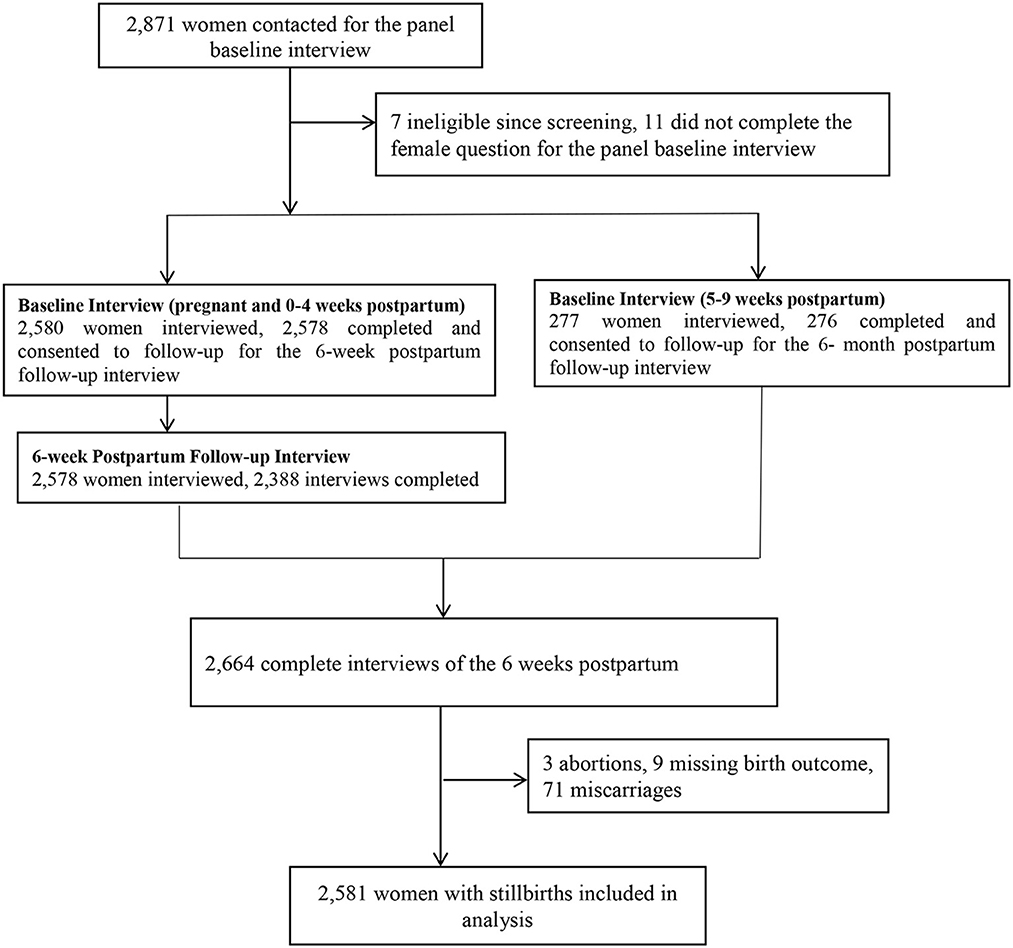
Figure 1. Data extraction for 6 week postpartum follow-up interview flowchart.
2.2 The variables
Our study includes a range of potential predictors for child comorbidity from the PMA-ET dataset (see Table 1), including the mother's age, mother's education, mother's parity, region, residence, types of cooking fuel, sanitary classification, availability of electricity, and wealth. The outcome variable considered is binary, taking a value of one if a child developed at least one complication (namely cough, fever, diarrheal, vomiting, eye infection, skin rash, poor feeding, difficulty breathing, etc.) in the postpartum interview.
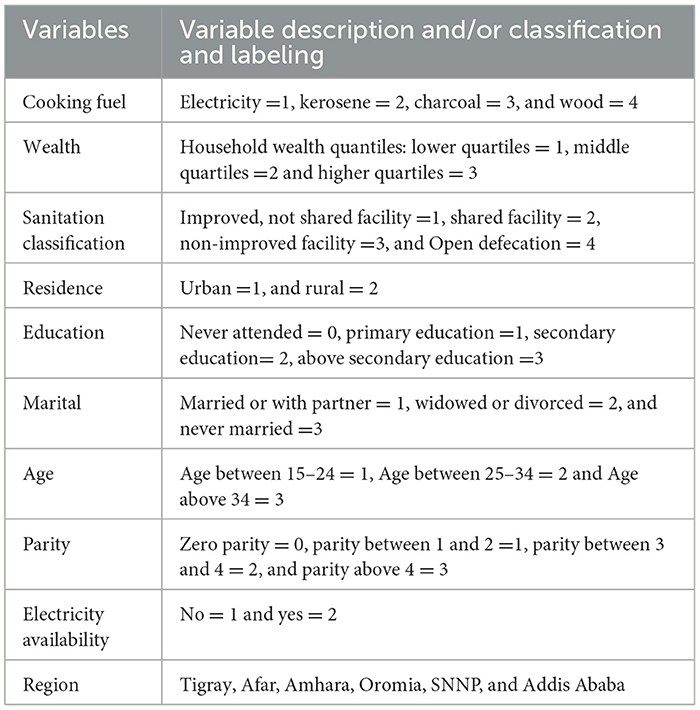
Table 1. Sociodemographic covariates and their labeling for child comorbidity study.
Notational
Considering the random effects data utilized in this study, we used the child's id to visualize an interclass correlation while the six regions represent the intraclass correlation to capture the variation in child comorbidity of our study. Thus, samples were grouped by six different regions of the country, namely Afar, Amhara, Oromia, Tigray SNNP, and Addis Ababa. Analyzing categorical variables in GLMMs, one of the categories is used as a reference category, and the other categories are then measured against the reference category in analyzing categorical variables in GLMMs (46). Besides, region and child's ID are uniquely labeled; we can specify random effects as (1|region) and (1|child_ID).
The categorization of sociodemographic variables (Table 1) was based on commonly used groupings in existing literature related to child morbidity and public health research in similar settings (11, 13). Age groups, education levels, wealth indices, and residence status were categorized following standard demographic health survey (DHS) practices to maintain comparability across studies. Missing data were assessed prior to analysis; the PMA-ET dataset underwent a rigorous quality control process, and minimal missingness was detected. During our data cleaning phase, we verified the completeness of key variables using frequency distributions and summary statistics, confirming that there were no significant missing values in the final analytic sample. Sensitivity analysis was not performed, as the minimal level of missing data and the robust sample size were deemed sufficient to support the stability of the primary findings.
2.3 Methods
2.3.1 Generalized linear mixed model
Generalized Linear Mixed Models (GLMMs) were developed to address the need for analyzing non-normally distributed responses that exhibit correlation or clustering. GLMMs account for variation in cluster data by incorporating random effects into the model to capture the heterogeneity of observation within clusters (51–53). GLMMs are used for fully parametric subject-specific inference for clustered or repeated measurement responses in the exponential family (54). It is particularly useful in biomedical studies as it can account for the correlation between observations that arise from the hierarchical structure of the data and in recent years, the use of GLMMs in Biomedical study has increased, and now it is considered one of the most powerful and challenging tools in the field (55, 56). The link function had been used to account for the correlation between the data within each cluster and to model non-normal outcome variables. In GLMMs, the logit link function maximizes the likelihood of the data under the model, maps the probability of a binary outcome to a linear predictor, and has straightforward interpretations in terms of the odds ratio (53, 57, 58).
2.3.2 Model specification of GLMMs
Let yij be the binary response measured for ith cluster, for i = 1, 2,…,N, j = 1,2,…, ni, and xij is the ith row of the matrix for the fixed effects and yi is the ni-dimension vectors of all measurements available for ith child, conditional on the random vector bi with q dimensions, and which is assumed to be drawn independently from a distribution belong to exponential family. Furthermore, bi captures the unobserved factors specific to each cluster that affect the child comorbidity and is assumed to be drawn independently from the normal distribution with mean zero and variance i.e. bi ~N(0, ), where refers to the variation in the population distribution and, consequently, the degree of subject heterogeneity. Thus, the probability density function of the response yij, which is independent of the distribution of yi is given by (46, 59, 60).
Here θij isthe linear predictor ( is the link function, ϕ is the dispersion parameter and c (yij, ϕ) normalizing constant.
The function g (μij) is the inverse of the link function ψ (θij). The relationship between g (μij) and fi(yij/bi, β, ϕ) is given by the following equation:
By using Laplace approximation, Equation 2 approximates to the function;
The function g(.) is a known link function that belongs to the GLMM framework that is used to map the expected values of the response variable to the linear predictor, xij is the ith row of the matrix for the fixed effects, zij is the ith row of the matrix for the random effects associated with bi, β is the parameter vector of unknown fixed effects and ψ is scall parameter or cumulant generating function.
Under this GLMMs settings, the logit function is commonly chosen as the link function g(μij) is defined as
Here the conditional expectation equals to the conditional probability of a response given the random effects and covariance values, i.e., μij = ϵ(yij|bi, xij) = P (yij|bi, xij).
This model can also write as
Where the inverse link functions is the logistic cumulative distribution function (CDF), which is used to quantify the binary response, namely:
In GLMMs, the logistic distribution can facilitate the process of estimating the distribution's parameters by maximum likelihood estimation or other techniques and has the advantage of making a straightforward parameter estimation (61).
2.3.3 Estimation
Likelihood-based approaches rely on the likelihood function to estimate the parameters in GLMMs. With this model, the joint distribution of both the vectors of response and the vectors of random effects are fully specified and we might use the same methods to estimate these models (62). Given the above model specification for the GLMMs based on the assumption that the binary responses yij (conditioned on the random effects bi) are conditionally independent, the joint probability of the response vector yi and the random effect vector bi for f (bi) distribution of the ith random effect can be explained as follows:
Then the likelihood function of the parameters β and is given by:
Since yij is a binary response, has a value of 0 or 1, The conditional mean of yij is related to the linear predictor by a logit link function. Thus, zij= 1 for all i= 1,2… 2,581 and j= 1,2… ni, the linear predictor of Equation 4 was equivalent to:
Thus, Equation 8 can be put in the simplified form as:
The values of β and that maximize this likelihood function are the ML estimates of β and . However, from Equation 10, it is not possible to use the entire likelihood function since there are no closed-form solutions. Thus, it is necessary to employ estimates of the probability function to find a solution for this problem. Laplace's approximation approach serves as the foundation for all likelihood-based techniques and the GLMM's parameters are estimated using the glmer function in the lme4 package of R for this likelihood approximation (63, 64).
2.3.4 Laplace's approximation
The Laplace approximation is a quadrature method for estimating integrals of this kind was developed by Laplace and published in 1774,
Where both g(t) and f(t) are continuous smooth functions, f(t) is nonzero at t0, and g(t) is a twice-differentiable function on (a; b) with a maximum in the interval (a; b). The underlying principle of Laplace's approach is that, for large λ, the integral's bulk will come from the integral's contribution around a certain point, t0. That resulting integral may be proven to represent the kernel of a normal distribution, which can then be integrated, using second-order Taylor series expansions for g(t) and f(t). The integrand in the function is comparable to the likelihood of a GLMMs, which contains exponential functions from the exponential family of probability distributions, as can be seen by examining the form above (63, 64).
2.3.5 Akaike's information criterion
Akaike's information criterion (AIC), is a popular model selection criterion based on likelihood, with the optimal model being the one that minimizes AIC. It frequently works in tandem with the Deviance Information Criterion (DIC) and the Bayesian Information Criterion (BIC) (49). For data set D = {(yi,)}, where yi is the outcome vector and is a set of fixed effects and for maximum likelihood estimator under computing model.
For p dimension of β, AIC can be formulated as:
2.3.6 The likelihood ratio test for variance components in GLMMs
GLMM's are used to describe responses from exponential families with a combination of fixed and random effects, and variance components in GLMMs come from random effects (65). This is equivalent to testing that the variance component equals zero and the hypothesis of interest is:
For the maximized log-likelihood under the null hypothesis l1 and the variance component estimated lo, the test statistics for variance components of the likelihood ratio test are given by:
Here G2 follows chi-square distribution with 1 degree of freedom.
3 Results
3.1 Explanatory data analysis
Exploratory analysis of clustered data intends to identify characteristics of random variation that distinguish individual children as well as patterns of systematic variation across groups of children. Among the main illness categories that were recorded (see Table 2), cough, fever, and diarrheal were found to be the most frequent types of children's illnesses, with percentages of 25.67, 18.52, and 14.08, respectively. Moreover, fast birthing, no stool, difficulty in birth, and swelling occurred at all lower rates under 1 year of age. A total of 2,322 episodes of any illness were noted among the children who were considered in the PMA 2019 survey.
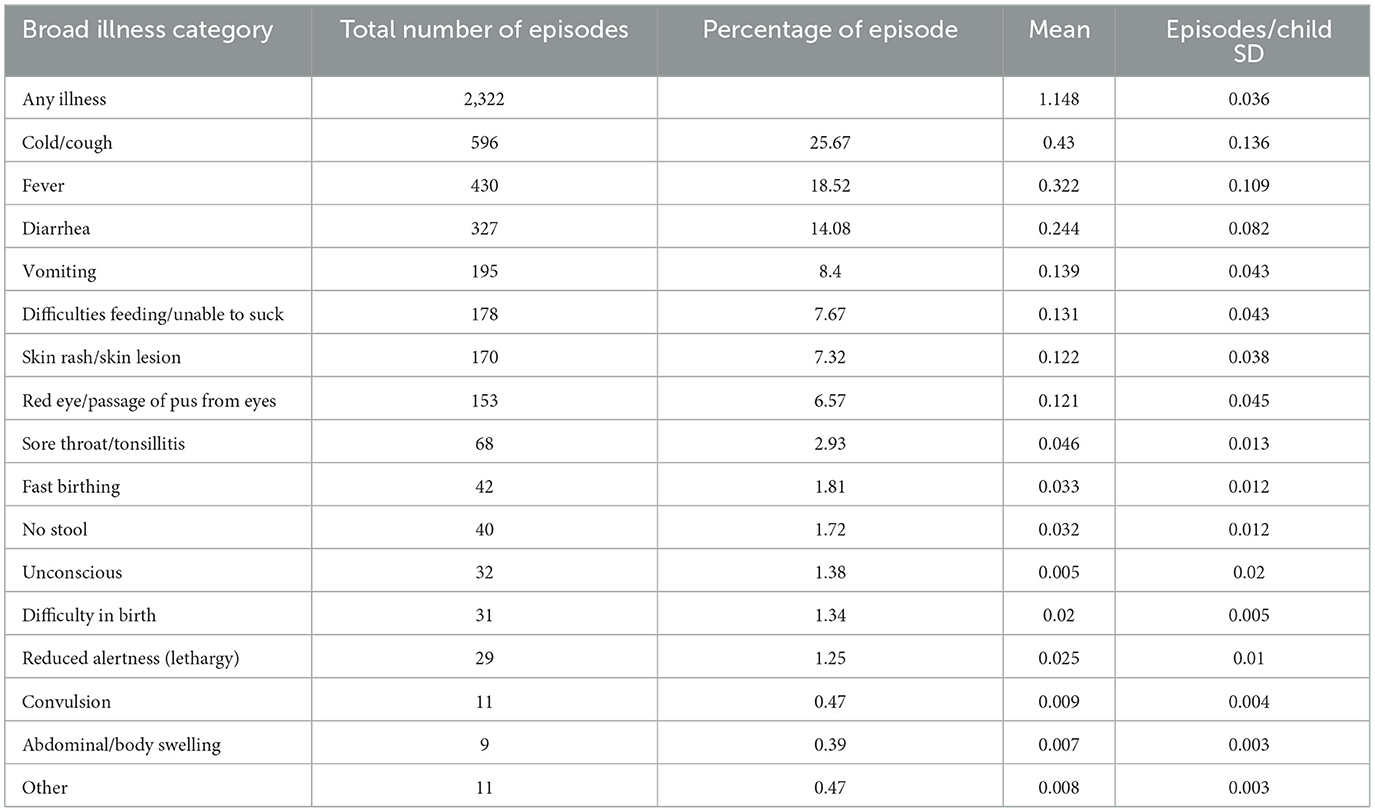
Table 2. Distribution of the broad categories of illness among children, PMA-ET 2019 survey.
The density of residuals and distribution of responses give insight into how the responses and predictors are related to one another (66, 67). As shown in Figure 1, the bottom left of it depicts the density of residuals (see left plot of Figure 2), in which the residuals are obviously bimodal (not normal), and the bottom right side of the plot is the distribution of responses (see right plot of Figure 2). With these distributions, non-normally distributed responses are possible accommodated, including non-linear links between the mean of the child morbidity and the predictors, as well as some form of correlation in the data. Thus, GLMMs with logit link functions are an ideal method of detecting child morbidity for the given datasets.
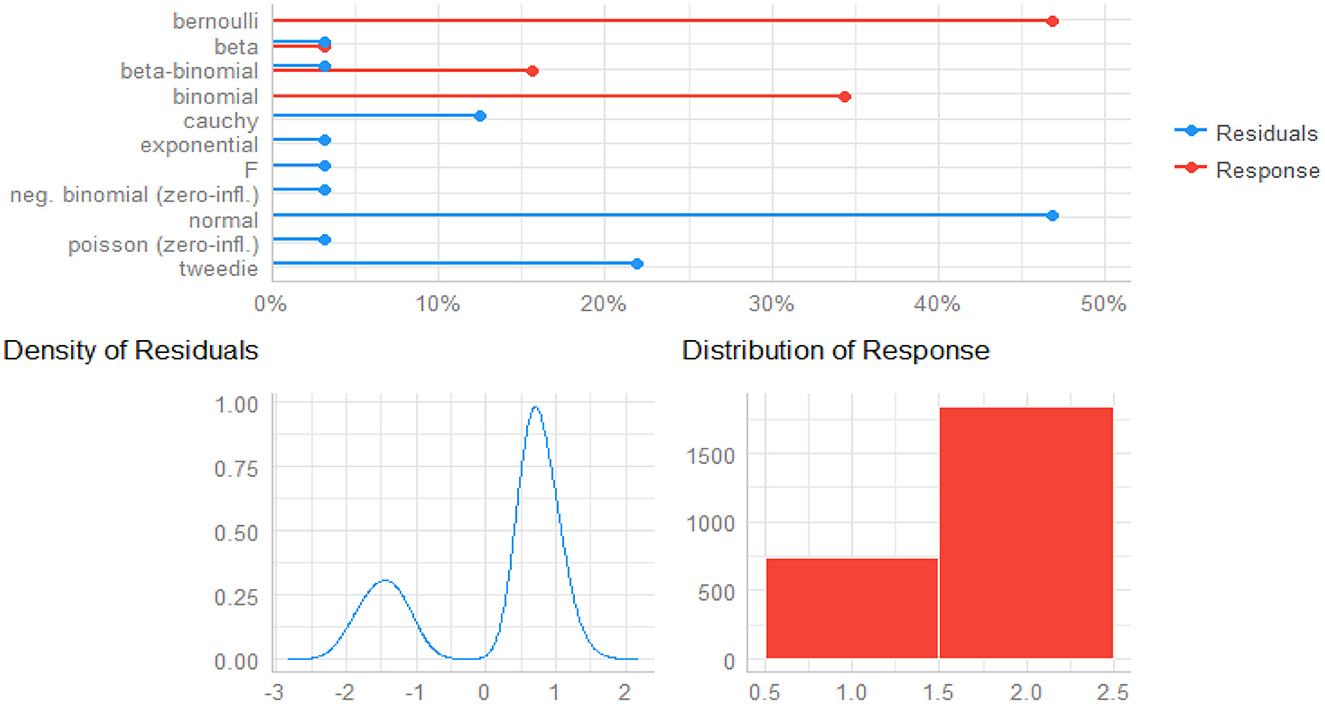
Figure 2. Predicted distribution of residuals and response for child comorbidity study.
A Pearson's chi-square test of a bivariate analysis has been carried out to look at the relationship between a few chosen variables (68). The following table (see Table 3) represents the contingency table analysis of the morbidity status of children, along with Pearson's chi-square value to determine if a particular regression coefficient is significant. Mother's age is the only variable that is not significantly (P-value = 0.632) related to child morbidity among all the factors that were taken into consideration at the 5% significance level. Furthermore, morbidity is predominant among children whose mothers use charcoal for fuel (37.16%), never attended education (30.20%), live in rural areas (47.77%), and have lower quartiles of wealth (32.70%).
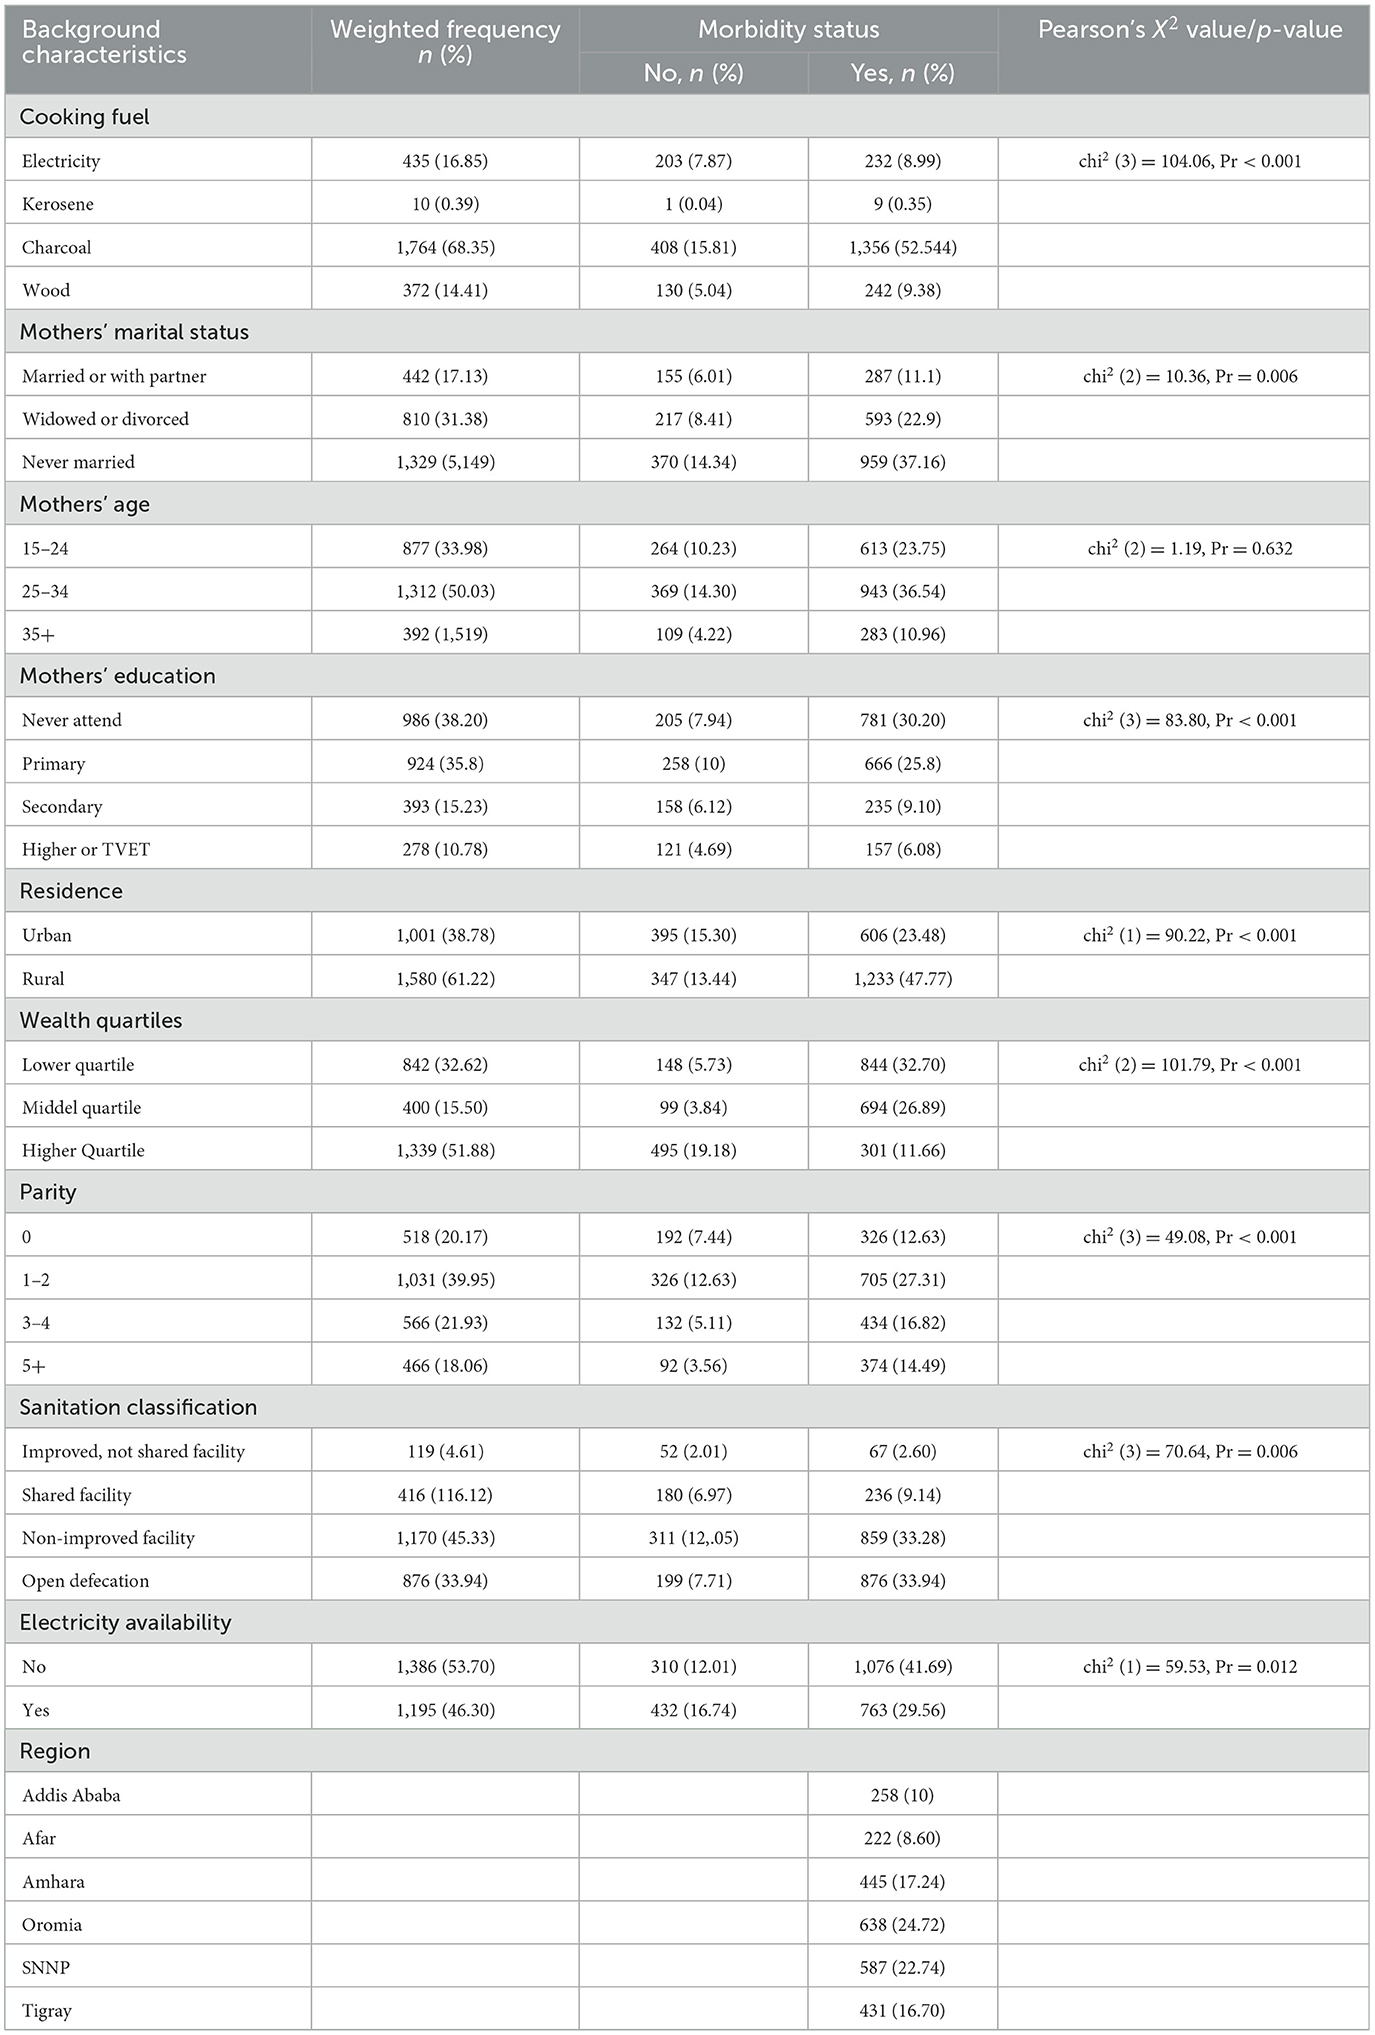
Table 3. Characteristics of the study participants by morbidity and their mother's sociodemographic status, PMA-ET 2019 survey (n = 2,581).
3.2 Generalized linear mixed model analysis
3.2.1 Type-III tests of fixed effects
In GLMMs, Type-III tests are applied to evaluate each term's significance while taking into consideration the effect of every other term (69). Table 4 of the Type III analysis of the likelihood ratio test of all the fixed effects (except sanitation class) significantly affects child morbidity.
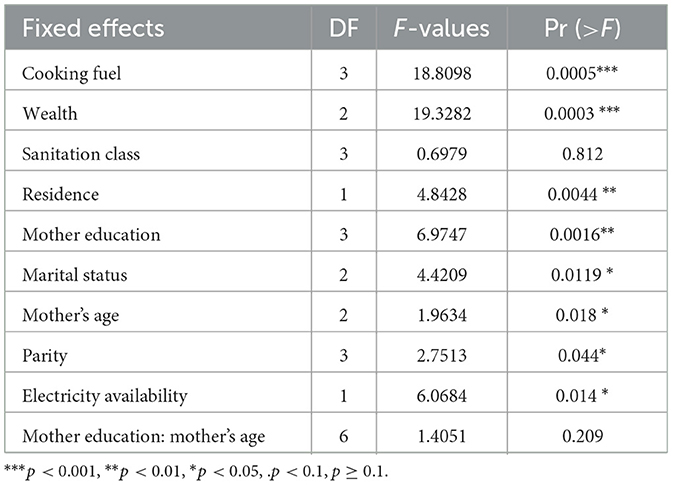
Table 4. Type III tests of fixed effects from GLMMs of child morbidity, PMA-ET 2019 survey (n = 2,581).
The following table (see Table 5) presents the estimates, odds ratio, significance level, and confidence intervals of the estimates of the fixed effects based on the likelihood ratio chi-square test result using the glmer function of the lme4 package in R (70). The estimates tell us the amount of increase in the predicted log odds of comorbidity equals one, which would be predicted by a one-unit increase (going from one category to another category) in the predictor, holding other predictors constant. Based on the results, wealth status significantly affects the child morbidity status, and it is observed that children from middle quartiles (OR = 0.47, P = 0.002; 95% CI: −0.766, −0.167) and higher quartiles (OR = 0.62, P = 0.001; 95% CI: −1.05, −0.415) are less likely to suffer illness than children from lower quartiles. Our study also demonstrated that children from a mother with primary, secondary, and higher education are 41%, 52%, and 51% respectively, less likely to be ill than mothers who never attended school.
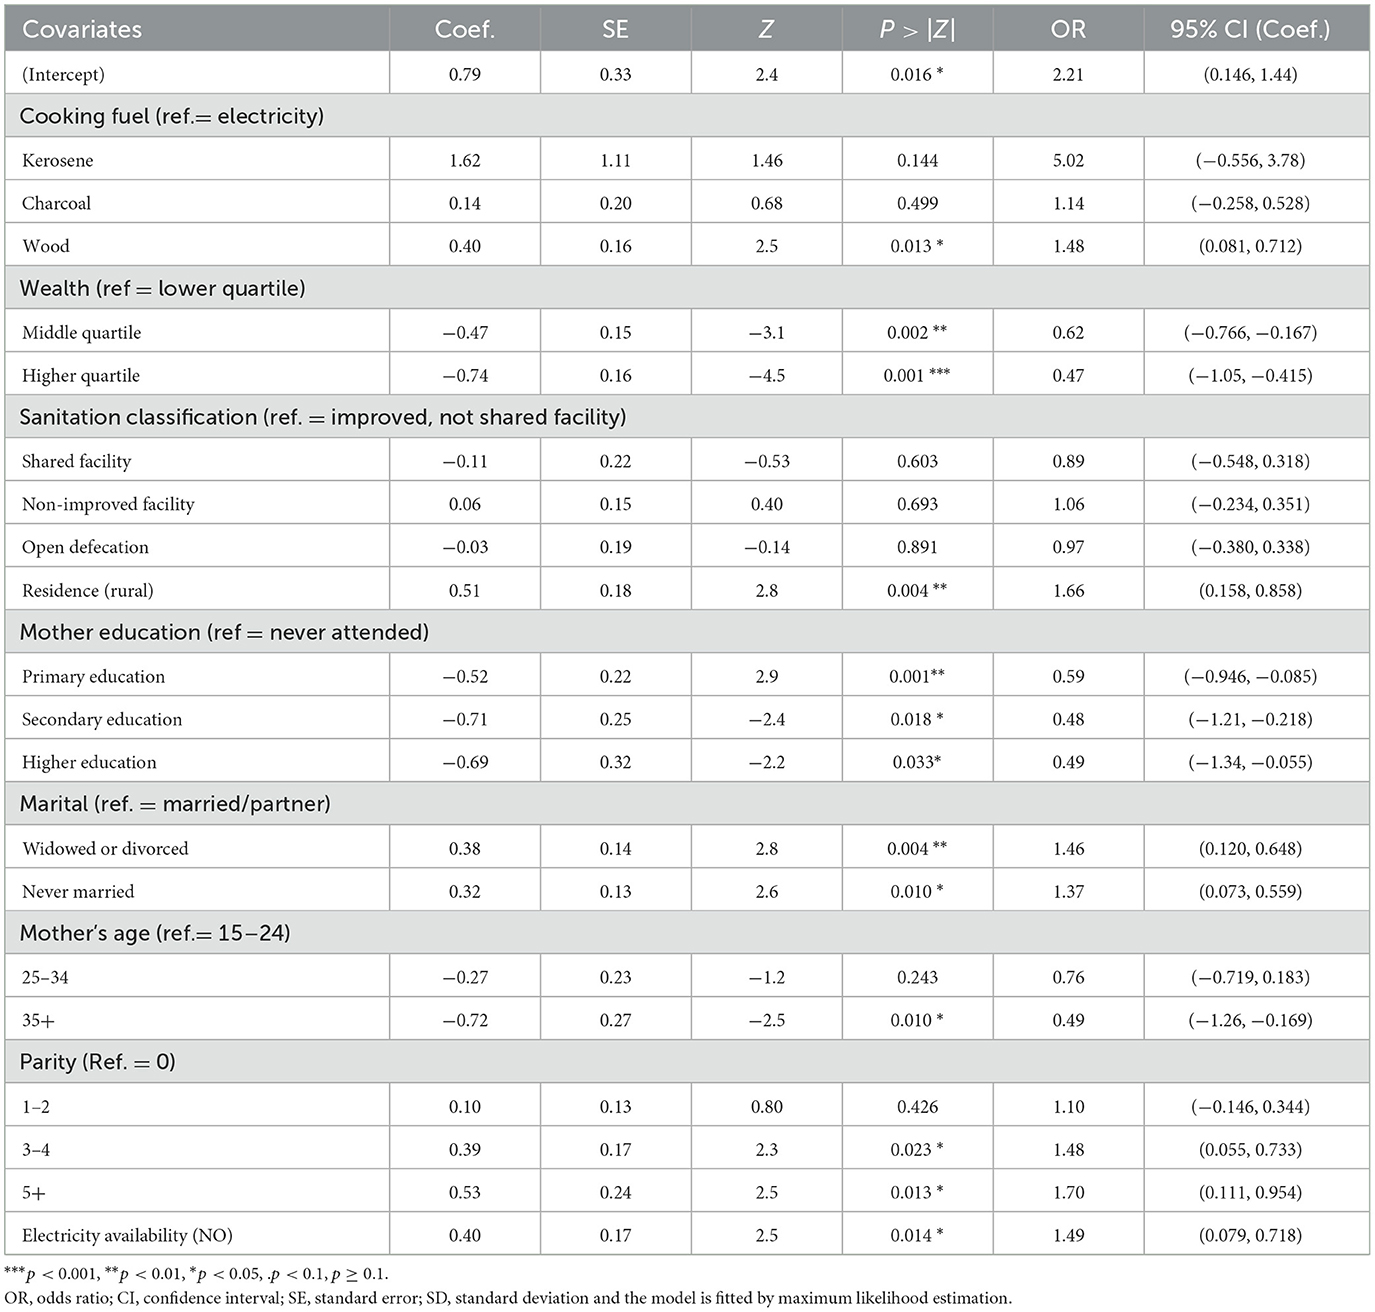
Table 5. Estimates of fixed effects from GLMMs for children's comorbidity, PMA-ET 2019 survey (n = 2,581).
Similarly, children who lived in rural areas (OR = 1.66, P = 0.004; 95% CI: 0.158, 0.858) are 1.66 times more likely to get affected by morbidity than children who lived in urban areas, and using wood as a fuel is 1.14 times more likely than using electricity to get child morbidity. Likewise, the absence of electricity (OR = 1.49; P = 0.014; 95% CI: 0.079, 0.718) is more likely for children's illness as compared to children who can access electricity. This study's findings also suggest that a woman with a parity of 3–4 and 5+, never married, and divorced or widowed mothers' marriage statuses are more likely to have comorbidity than their counterparts.
3.2.2 Interaction effects
The interaction between a mother's education (never attending primary education, secondary education, or higher education) and a mother's age (age between 15 and 24, age between 25 and 34, and age above 35) is presented in Table 6. As the result indicated, children from mothers above 35 years of age are less likely to be ill compared to children whose mother's age is < 34 for secondary and higher mother education groups (OR = 2.3, OR = 1.67, P-value = 0.022, P-value = 0.015, respectively).
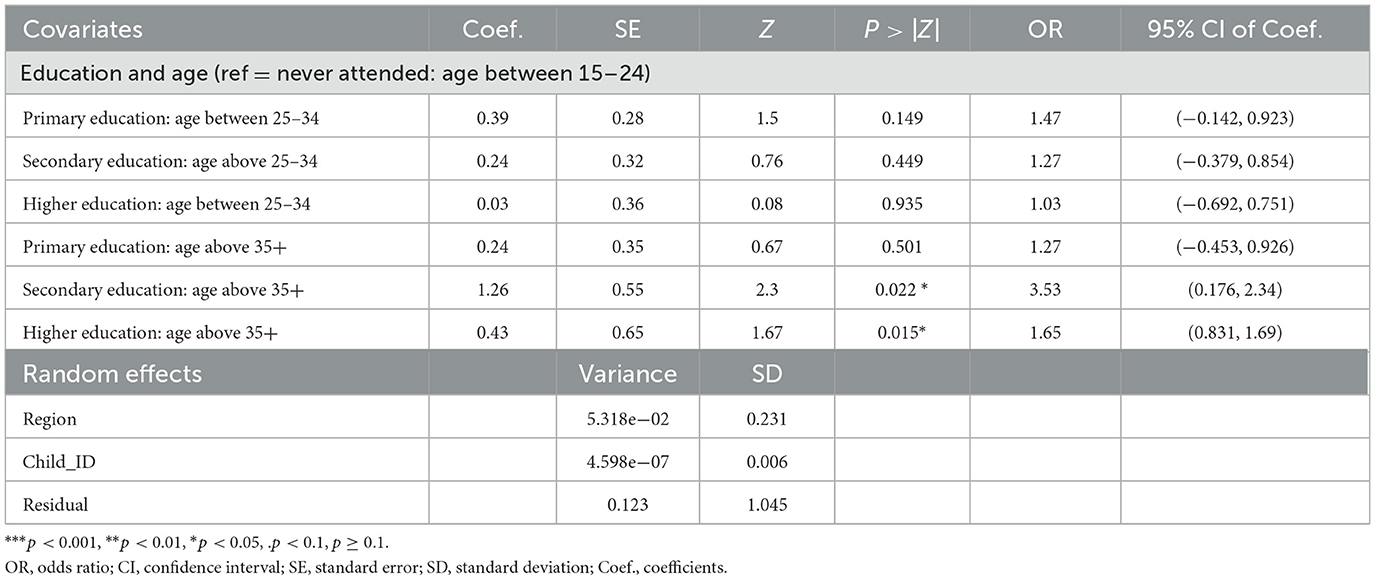
Table 6. Estimates of the two-way interaction effects and the variance parameter of the random effect models from GLMMs for child morbidity, PMA-ET 2019 survey (n = 2,581).
3.2.3 Model comparison and diagnosis
Comparing the models is an important step in the modeling process to see which ones best fit the data (71, 72). Akaike's information criterion (AIC) is a widely used model selection criteria based on the maximum likelihood estimator (49). Results of the AIC, log-likelihood ratio test (LRT), BIC and other useful information on the fit of the model are presented in Table 7. Accordingly, the model with two random intercepts (the random intercept of region and Child's id) has a lower AIC (AIC = 2,929.9) and is statistically significant (P < 0.001) in comparison to one random intercept model (AIC = 2,942.6). It is also supported in the loglikelihood ratio test (LRT) with a significance P-value (P < 0.001). This suggests that two random intercept models from GLMMs permit data correlation and provide more effective overall performance compared to one random intercept model.
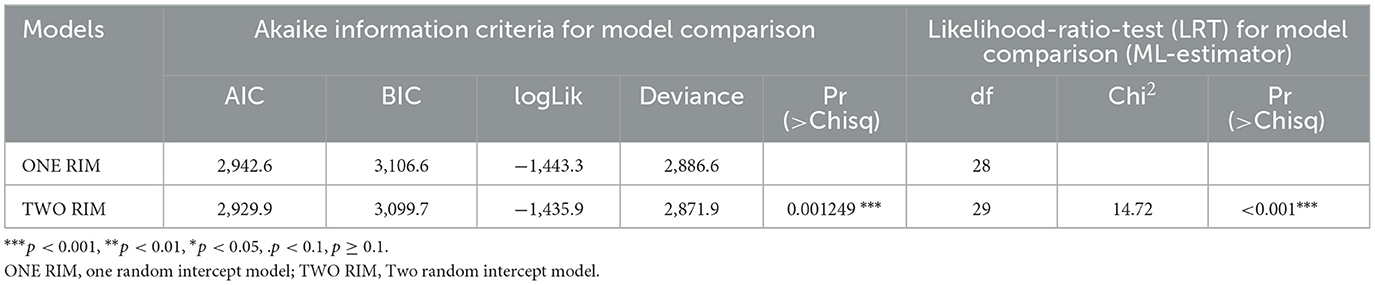
Table 7. The Likelihood-Ratio-Test (LRT) and Akaike information criteria for random intercept models comparison from GLMMS of child morbidity (n = 2,581).
In GLMMs, random intercept plots are employed to illustrate the distribution of random effects (51, 77). Figures 3A, B displays the diagnostic plots for random intercepts corresponding to two random effects, providing a visual representation of the variability in child morbidity. These plots inform us about the existence of variability at the cluster level for child morbidity. The estimated variance in the intercept, specific to both region and children, is found to be very close to zero. Hence, the inclusion of random effects is a prudent modeling decision, given the considerable variation observed in estimations of both regional and children-specific effects.
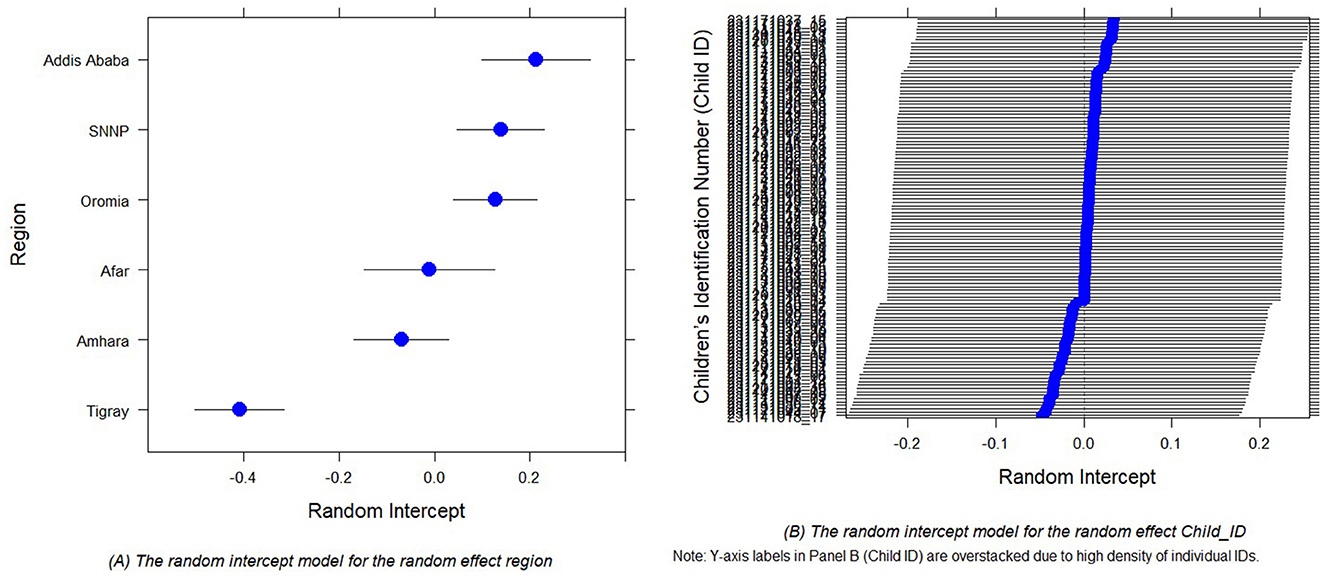
Figure 3. Random intercept plots for the random effect region (A) and random effect Child_ID (B) of the child comorbidity study.
3.2.4 Residuals diagnosis in GLMMs
Residuals in GLMMs have a coarse structure due to random effects and grouping of data. As a result, these models should not use techniques like QQ plots or Shapiro–Wilk tests to verify residual normality as standard linear models (73–75). Therefore, we use the “Diagnostics for HierArchical Regression models (DHARMa)' package to create readily interpretable scaled (quantile) residuals for fitted GLMMs (50) and binned residual plots in dividing the data into bins based on fitted value (53).
Figure 4 displays the plots of residuals vs. fitted values for fitted GLMMs (binned residuals). From the plot, most of the residuals fall within the error bound (indicated in blue points), and fewer residuals are outside of the error boundaries (indicated in red points). Thus, most of the binned residual fell within the 95% confidence interval of error bounds, which indicates that the model is a good fit for the data.
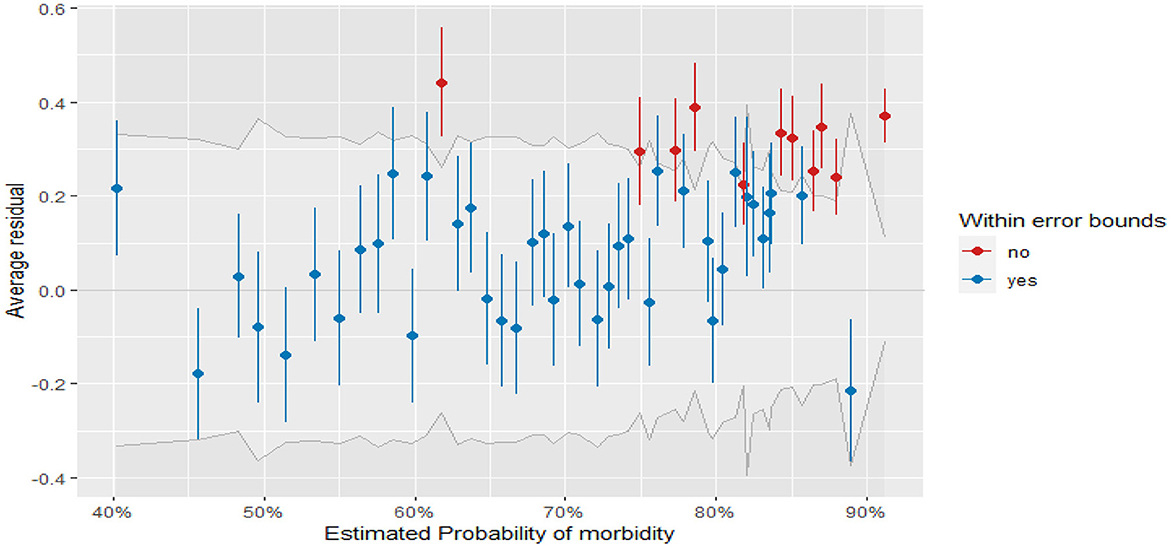
Figure 4. Binned residual plot for the children's comorbidity study.
Furthermore, in the DHARMa package in R, the QQ plot compares the observed residual to the expected under the assumptions of normality, and the points in the QQ plot fall along a straight line for normally distributed residuals (50, 53). The plot also displays the Kolmogorov-Smirnov test (KS test), dispersion test, and outlier test (76). From Figure 4, the points on the QQ plot fall along a straight line which indicates that the model can account for the variation in child morbidity and the model is not systematically overestimating or underestimating child morbidity (see the left of Figure 5). Moreover, the insignificant values of the KS test, dispersion test, and outlier test (P = 0.6764, P = 0.88, P = 0.82485, respectively) suggest that the residuals of the model are normally distributed, homoscedasticity variance, and no influential observations in the data. Similarly, the right of Figure 5 depicts a plot of the residual against the predicted values. The red solid line at y = 0.5 represents the median of the residual, while a dashed red line represents the theoretical median of the residual under the assumption of uniform distribution (78). Therefore, the two lines are close together at y = 0.5 indicating that the residuals are uniformly distributed.
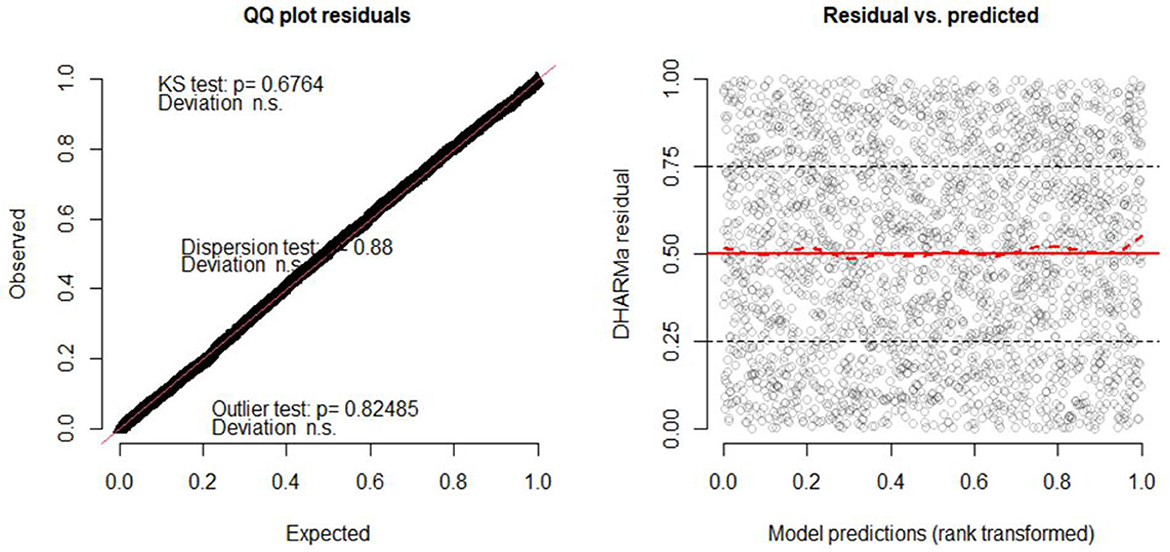
Figure 5. Quartile residuals for children comorbidity study in GLMMs.
4 Discussion and conclusion
4.1 Discussion
We tried to check the presence of variability in child morbidity and determine major predictive factors for child morbidity using the GLMMs. We used PMA datasets in STATA-17 and the 4.3.0 version of R for our data analysis. Based on AIC and the likelihood ratio test values, a two-random intercept model was found to be more favorable in illustrating the presence of child morbidity variability between children and within regions. From our study using GLMMs, based on the likelihood chi-square and Type III test, we found that the factors that significantly affect the children's comorbidity were cooking fuel, wealth quartiles, mothers' marital status, mother age, parity, residence mother's education status, and availability of electric city. However, sanitation classification is not influential for the presence of children comorbidity in Ethiopia.
Children from divorced and never-married families are at high risk of suffering illness and experiencing more health problems than children from two-partner families. Like studies carried out (29–31), our result suggests that a lack of a stable family structure and the absence of one of her or his family members contribute to the negative effects on children's health. Similarly, our findings demonstrated that children with high parity had a higher risk of morbidity than children with low parity, based on PMA-ET datasets. The study found that increased parity is associated with higher odds of child morbidity, and our result is in accordance with (24, 26) that higher child morbidity is associated with high parity.
Furthermore, the results showed that children who live in rural locations and lack electricity are more likely than their counterparts to experience morbidity difficulty. It demonstrates that living in rural areas and not having access to electricity are positively connected with child morbidity and this result is in accordance with (11, 15, 34). Moreover, the household wealth index has a negative correlation with morbidity in children and it is a significant socioeconomic determinant influencing children's health in Ethiopia. The lower quartile families had bad nutrition, limited education, poor cleanliness, and poor hygiene. This suggests that compared to children from middle and high quartiles, children from lower households are more likely to experience children's illness. The findings align with those reported by Chalasani and Rutstein (20), Hong et al. (23), and Takele et al. (27), indicating that an increase in household income is associated with a reduction in the incidence of illness among children.
The results we found also showed a negative correlation between childhood morbidity and the age of the mother. This suggests that children whose mothers were younger than 24 have a higher rate of illness. Our findings support the findings of Hviid et al. (79), who noticed that children of mothers 35 years of age and older had lower rates of child morbidity than children of younger mothers. However, our results also contradict those of Nourkami-Tutdibi et al. (80), who found that children of mothers 35 years of age and older had higher rates of child morbidity than children of younger mothers. Another significant risk factor for children's comorbidity is the mother's academic achievement. The risk of morbidity is higher in children whose mothers have not received any education compared to children whose mothers have completed at least primary education. It implies that educated mothers are also more likely to have an income and better access to child health care and have access to information about the health, eating habits, and development of their children, which can enhance the health of their children. These results confirm the results obtained from previous studies (21, 22, 25).
This study has several limitations that should be considered when interpreting the findings. The sampling design of the PMA-ET survey may have introduced selection bias, potentially leading to an overrepresentation of mothers with better access to health services, higher education, and urban residence. This could have affected both internal and external validity, likely underestimating child morbidity among disadvantaged and hard-to-reach populations. Furthermore, child morbidity was assessed through maternal self-reports without objective clinical verification, introducing the possibility of information bias. Symptoms may have been underreported due to recall or social desirability bias, or alternatively overreported by more health-conscious mothers, resulting in potential underestimation or overestimation of true morbidity rates. Additionally, some important confounders, such as water quality, sanitation practices, and access to prenatal care, were not directly measured or controlled, raising the risk of residual confounding that could bias associations in either direction.
The cross-sectional nature of the data further limits the ability to establish clear causal relationships, raising concerns about reverse causality. For instance, while poor household conditions might increase child morbidity, it is also plausible that caring for a sick child could lead to economic strain and worsening household circumstances. Moreover, although missing data were minimal, we evaluated their presence through frequency checks and data summaries to ensure the completeness of key variables. No formal sensitivity analysis was conducted, as the missingness was negligible and unlikely to influence the robustness of the findings. Future studies should prioritize longitudinal designs, include objective clinical validation of child health outcomes, and capture a wider range of confounding factors to better clarify causal pathways and improve the generalizability of results.
4.2 Conclusion
According to our result, GLMMs are better suited to handle complex data structures like hierarchical data. This model also offers more precise estimates of random effects on this child comorbidity study to capture heterogeneity and look at how it relates to different variables like socioeconomic status, use of health services, and health outcomes. Cooking fuel, wealth quartiles, mothers' marital status, mother age, parity, residence mother's education status, and availability of electric city were significantly associated with children's morbidity. Improving the socio-economic standings of mothers through socio economic and education reduces the prevalence of child morbidity under the age of one.
Data availability statement
The datasets presented in this study can be found in online repositories. The names of the repository/repositories and accession number(s) can be found at: https://www.pmadata.org/data/available-datasets.
Ethics statement
Ethical approval was not required for the study involving humans in accordance with the local legislation and institutional requirements. Written informed consent to participate in this study was not required from the participants or the participants' legal guardians/next of kin in accordance with the national legislation and the institutional requirements.
Author contributions
ED: Conceptualization, Writing – original draft. KG: Supervision, Conceptualization, Project administration, Writing – review & editing. MC: Formal analysis, Validation, Writing – review & editing. AW: Investigation, Software, Writing – review & editing. AA: Data curation, Methodology, Supervision, Validation, Writing – review & editing.
Funding
The author(s) declare that financial support was received for the research and/or publication of this article. The authors acknowledge support from the University of Messina through the APC initiative.
Acknowledgments
We express our gratitude to Performance Monitoring for Action, Ethiopia, for providing the PMA datasets and granting us permission to carry out this study.
Conflict of interest
The authors declare that the research was conducted in the absence of any commercial or financial relationships that could be construed as a potential conflict of interest.
Publisher's note
All claims expressed in this article are solely those of the authors and do not necessarily represent those of their affiliated organizations, or those of the publisher, the editors and the reviewers. Any product that may be evaluated in this article, or claim that may be made by its manufacturer, is not guaranteed or endorsed by the publisher.
Abbreviations
AIC, Akaike Information criteria; BIC, Bayesian Information criteria; DHARMa, Diagnostics for HierArchical Regression models; KS, Kolmogorov-Smirnov test (KS test); ML, maximum likelihood; PMA-ET, Performance Monitoring for Action-Ethiopia; SNNP, South Nation and Nationalities People.
References
1. Black RE, Allen LH, Bhutta ZA, Caulfield LE, De Onis M, Ezzati M, et al. Maternal and child undernutrition: global and regional exposures and health consequences. Lancet. (2008) 371:243–60. doi: 10.1016/S0140-6736(07)61690-0
2. Olufunlayo TF, Roberts AA, MacArthur C, Thomas N, Odeyemi KA, Price M, et al. Improving exclusive breastfeeding in low and middle-income countries: a systematic review. Matern Child Nutrit. (2019) 15:e12788. doi: 10.1111/mcn.12788
3. Liu L, Oza S, Hogan D, Chu Y, Perin J, Zhu J, et al. Global, regional, and national causes of under-5 mortality in 2000–15: an updated systematic analysis with implications for the Sustainable Development Goals. Lancet. (2016) 388:3027–35. doi: 10.1016/S0140-6736(16)31593-8
5. Ezbakhe F, Pérez-Foguet A. Child mortality levels and trends. Demogr Res. (2020) 43:1263–96. doi: 10.4054/DemRes.2020.43.43
6. UNICEF and Worl Health Organization. Levels and Trends Child Mortality-Report 2023: Estimates Developed by the United Nations Inter-Agency Group for Child Mortality Estimation. (2024). Available online at: https://policycommons.net/artifacts/11755691/levels-and-trends-child-mortality-report-2023/12646949/
7. Afnan-Holmes H, Magoma M, John T, Levira F, Msemo G, Armstrong CE, et al. Tanzania's countdown to 2015: an analysis of two decades of progress and gaps for reproductive, maternal, newborn, and child health, to inform priorities for post-2015. Lancet Global Health. (2015) 3:e396–409. doi: 10.1016/S2214-109X(15)00059-5
8. Mmbaga BT, Lie RT, Olomi R, Mahande MJ, Kvåle G, Daltveit AK. Cause-specific neonatal mortality in a neonatal care unit in Northern Tanzania: a registry based cohort study. BMC Pediatr. (2012) 12:116. doi: 10.1186/1471-2431-12-116
9. Ebrahim NB, Atteraya MS. Inequalities of infant mortality in Ethiopia. Int J Environ Res Public Health. (2023) 20:6068. doi: 10.3390/ijerph20126068
10. Takele K, Zewotir T, Ndanguza D. Risk factors of morbidity among children under age five in Ethiopia. BMC Public Health. (2019) 19:942. doi: 10.1186/s12889-019-7273-4
11. Adedokun ST, Yaya S. Childhood morbidity and its determinants: evidence from 31 countries in sub-Saharan Africa. BMJ Global Health. (2020) 5:e003109. doi: 10.1136/bmjgh-2020-003109
12. Dagne H, Andualem Z, Dagnew B, Taddese AA. Acute respiratory infection and its associated factors among children under-five years attending pediatrics ward at University of Gondar Comprehensive Specialized Hospital, Northwest Ethiopia: Institution-based cross-sectional study. BMC Pediatr. (2020) 20:1–7. doi: 10.1186/s12887-020-1997-2
13. Getachew A, Guadu T, Tadie A, Gizaw Z, Gebrehiwot M, Cherkos DH, et al. Diarrhea prevalence and sociodemographic factors among under-five children in rural areas of North Gondar Zone, Northwest Ethiopia. Int J Pediatr. (2018) 2018:6031594. doi: 10.1155/2018/6031594
14. Gupta KB, Walia BNS. A longitudinal study of morbidity in children in a rural area of Punjab. Indian J Pediatr. (1980) 47:297–301. doi: 10.1007/BF02831322
15. Kamal MM, Hasan MM, Davey R. Determinants of childhood morbidity in Bangladesh: evidence from the demographic and health survey 2011. BMJ Open. (2015) 5:e007538. doi: 10.1136/bmjopen-2014-007538
16. Kandala N. Bayesian geo-additive modelling of childhood morbidity in Malawi. Appl Stoch Models Bus Ind. (2006) 22:139–54. doi: 10.1002/asmb.624
17. Sabbah I, Vuitton D, Droubi N, Sabbah S, Mercier M. Morbidity and associated factors in rural and urban populations of South Lebanon: a cross-sectional community-based study of self-reported health in 2000. Trop Med Int Health. (2007) 12:907–19. doi: 10.1111/j.1365-3156.2007.01886.x
18. Santika NKA, Efendi F, Rachmawati PD, Has EMM, Kusnanto K, Astutik E. Determinants of diarrhea among children under two years old in Indonesia. Child Youth Serv Rev. (2020) 111:104838. doi: 10.1016/j.childyouth.2020.104838
19. Alebel A, Tesema C, Temesgen B, Gebrie A, Petrucka P, Kibret GD. Prevalence and determinants of diarrhea among under-five children in Ethiopia: a systematic review and meta-analysis. PLoS ONE. (2018) 13:e0199684. doi: 10.1371/journal.pone.0199684
20. Chalasani S, Rutstein S. Household wealth and child health in India. Popul Stud. (2014) 68:15–41. doi: 10.1080/00324728.2013.795601
21. Davis-Kean PE, Sexton HR, Magnuson KA. How Does Parents' Education Level Influence Parenting and Children's Achievement. Ann Arbor, MI: Institute for Social Research, University of Michigan (2005).
22. Desai S, Alva S. Maternal education and child health: is there a strong causal relationship? Demography. (1998) 35:71–81. doi: 10.2307/3004028
23. Hong R, Banta JE, Betancourt JA. Relationship between household wealth inequality and chronic childhood under-nutrition in Bangladesh. Int J Equity Health. (2006) 5:15. doi: 10.1186/1475-9276-5-15
24. Kozuki N, Lee AC, Silveira MF, Sania A, Vogel JP, Adair L, et al. The associations of parity and maternal age with small-for-gestational-age, preterm, and neonatal and infant mortality: a meta-analysis. BMC Public Health. (2013) 13:S2. doi: 10.1186/1471-2458-13-S3-S2
25. Qian Y, Hu Y. Mothers' Education has a Powerful Role Shaping their Children's Futures. University of British Columbia (2023).
26. Sonneveldt E, DeCormier Plosky W, Stover J. Linking high parity and maternal and child mortality: what is the impact of lower health services coverage among higher order births? BMC Public Health. (2013) 13:1–8. doi: 10.1186/1471-2458-13-S3-S7
27. Takele K, Zewotir T, Ndanguza D. Understanding correlates of child stunting in Ethiopia using generalized linear mixed models. BMC Public Health. (2019) 19:626. doi: 10.1186/s12889-019-6984-x
28. Troeger CE, Khalil IA, Blacker BF, Biehl MH, Albertson SB, Zimsen SR, et al. Quantifying risks and interventions that have affected the burden of diarrhoea among children younger than 5 years: an analysis of the Global Burden of Disease Study 2017. Lancet Infect Dis. (2020) 20:37–59. doi: 10.1016/S1473-3099(19)30401-3
29. Amato PR, Sobolewski JM. The effects of divorce and marital discord on adult children's psychological well-being. Am Sociol Rev. (2001) 900–21. doi: 10.1177/000312240106600606
30. Lamb ME, Sternberg KJ, Thompson RA. The effects of divorce and custody arrangements on children's behavior, development, and adjustment. Fam Court Rev. (1997) 35:393–404. doi: 10.1111/j.174-1617.1997.tb00482.x
31. Wallerstein JS, Lewis J. The long-term impact of divorce on children: a first report from a 25-year study. Fam Concil Cts Rev. (1998) 36:368. doi: 10.1111/j.174-1617.1998.tb00519.x
32. Ghosh K, Gupta SS, Chakraborty AS. Childhood morbidity and its association with socio-economic and health care condition among under 5 years children in West Bengal: an evidence from NFHS-5, 2019-20. Int J Med Public Health. (2021) 11:760. doi: 10.5530/ijmedph.2021.3.29
33. Hossain MI, Islam MR, Saleheen AAS, Rahman A, Zinia FA, Urmy UA. Determining the risk factors of under-five morbidity in Bangladesh: a Bayesian logistic regression approach. Discov Soc Sci Health. (2023) 3:21. doi: 10.1007/s44155-023-00052-2
34. Rolfe S, Garnham L, Godwin J, Anderson I, Seaman P, Donaldson C. Housing as a social determinant of health and wellbeing: developing an empirically-informed realist theoretical framework. BMC Public Health. (2020) 20:1138. doi: 10.1186/s12889-020-09224-0
35. Yohannes AG, Streatfield K, Bost L. Child morbidity patterns in Ethiopia. J Biosoc Sci. (1992) 24:143–55. doi: 10.1017/S0021932000019684
36. Viviana N, Annamaria Z, Pietro A, Alberti G, Loteta S, Carmen A, et al. Association between obstructive sleep apnea and hearing loss: a literary review. Acta Medica Mediterr. (2019) 35:3411–6. Available online at: https://hdl.handle.net/11570/3147592
37. Pease E, Shekunov J, Savitz ST, Golebiowski R, Dang V, Arbon J, et al. Association between early childhood sleep difficulties and subsequent psychiatric illness. J Clin Sleep Med. (2023) 19:2059–63. doi: 10.5664/jcsm.10756
38. Qubty WF, Mrelashvili A, Kotagal S, Lloyd RM. Comorbidities in infants with obstructive sleep apnea. J Clin Sleep Med. (2014) 10:1213–6. doi: 10.5664/jcsm.4204
39. Ahmed M, Billoo AG, Murtaza G. Risk factors of persistent diarrhoea in children below five years of age. J Pak Med Assoc. (1995) 45:290–2.
40. Dagnew B, Andualem Z, Angaw DA, Alemu Gelaye K, Dagne H. Duration of exposure and educational level as predictors of occupational respiratory symptoms among adults in Ethiopia: a systematic review and meta-analysis. SAGE Open Med. (2021) 9:20503121211018121. doi: 10.1177/20503121211018121
41. Melese B, Paulos W, Astawesegn FH, Gelgelu TB. Prevalence of diarrheal diseases and associated factors among under-five children in Dale District, Sidama zone, Southern Ethiopia: a cross-sectional study. BMC Public Health. (2019) 19:1–10. doi: 10.1186/s12889-019-7579-2
43. Teklemariam S, Getaneh T, Bekele F. Environmental determinants of diarrheal morbidity in under-five children, Keffa-Sheka zone, south west Ethiopia. Ethiop Med J. (2000) 38:27–34.
44. Ezeonwu BU, Chima OU, Oguonu T, Ikefuna AN, Nwafor I. Morbidity and mortality pattern of childhood illnesses seen at the children emergency unit of federal medical center, Asaba, Nigeria. Ann Med Health Sci Res. (2014) 4:239–44. doi: 10.4103/2141-9248.141966
45. Starfield B, Katz H, Gabriel A, Livingston G, Benson P, Hankin J, et al. Morbidity in childhood—a longitudinal view. N Engl J Med. (1984) 310:824–9. doi: 10.1056/NEJM198403293101305
46. Li H, Jin L, Yu D. Generalized linear mixed models for the analysis of categorical data: a case study in cognitive psychology. In: Proceedings of the 2nd International Conference on Medical and Health Informatics. New York, NY: ACM (2018). p. 252–6. doi: 10.1145/3239438.3239461
47. Dean CB, Nielsen JD. Generalized linear mixed models: a review and some extensions. Lifetime Data Anal. (2007) 13:497–512. doi: 10.1007/s10985-007-9065-x
48. Zimmerman L, Desta S, Yihdego M, Rogers A, Amogne A, Karp C, et al. Protocol for PMA-Ethiopia: a new data source for cross-sectional and longitudinal data of reproductive, maternal, and newborn health. Gates Open Res. (2020) 4:126. doi: 10.12688/gatesopenres.13161.1
49. Akaike, H. (1973). Information theory and an extension of the maximum likelihood principle. In:Petrov BN, Csaki F, , editors. Proceedings of the 2nd International Symposium on Information Theory. Budapest: Akademiai Kiado. p. 267–81.
50. Hartig F. DHARMa: Residual Diagnostics for Hierarchical (Multi-Level/Mixed) Regression Models. R Package Version 0.3, 3(5). Boston, MA: R Studio (2020).
51. Broström G, Holmberg H. Generalized linear models with clustered data: fixed and random effects models. Comput Stat Data Anal. (2011) 55:3123–34. doi: 10.1016/j.csda.2011.06.011
53. Gelman A, Hill J. Data Analysis Using Regression and Multilevel/Hierarchical Models. Cambridge University Press (2006). Available online at: https://books.google.it/books?hl=en&lr=&id=lV3DIdV0F9AC&oi=fnd&pg=PR17&dq=Data+Analysis+Using+Regression+and+Multilevel/Hierarchical+Models.&ots=6nhOBdQCV4&sig=EENZW174fzyPhh28g6I7Al4bT9w&redir_esc=y#v=onepage&q=Data%20Analysis%20Using%20Regression%20and%20Multilevel%2FHierarchical%20Models.&f=false (accessed June 3, 2025).
54. Gueorguieva R. A multivariate generalized linear mixed model for joint modelling of clustered outcomes in the exponential family. Stat Modelling. (2001) 1:177–93. doi: 10.1191/147108201128159
55. Johnson PCD, Barry SJE, Ferguson HM, Müller P. Power analysis for generalized linear mixed models in ecology and evolution. Methods Ecol Evol. (2015) 6:133–42. doi: 10.1111/2041-210X.12306
56. Stroup WW. Generalized Linear Mixed Models: Modern Concepts, Methods and Applications. Boca Raton, FL: CRC Press (2012).
57. McCulloch CE, Searle SR. Generalized, Linear, and Mixed Models. Hoboken, NJ: John Wiley and Sons (2004). Available online at: https://books.google.it/books?hl=en&lr=&id=bWDPukohugQC&oi=fnd&pg=PR6&dq=Generalized,+Linear,+and+Mixed+Models.&ots=sSCcER4CFq&sig=Qga54Ivq371SnbQsjuSoV4MzRis&redir_esc=y#v=onepage&q=Generalized%2C%20Linear%2C%20and%20Mixed%20Models.&f=false (accessed June 3, 2025).
58. Pinheiro J, Bates D. Mixed-Effects Models in S and S-PLUS. Cham: SPRINGER science and Business Media (2006). Available online at: https://books.google.it/books?hl=en&lr=&id=RFDe_BKxvRIC&oi=fnd&pg=PA3&dq=Mixed-Effects+Models+in+S+and+S-PLUS.&ots=mRw5zCYYM7&sig=fgo_cO3BLB6c_Xyx3xdn9hM2Lm0&redir_esc=y#v=onepage&q=Mixed-Effects%20Models%20in%20S%20and%20S-PLUS.&f=false (accessed June 3, 2025).
59. Coelho R, Infante P, Santos MN. Comparing GLM, GLMM, and GEE modeling approaches for catch rates of bycatch species: a case study of blue shark fisheries in the South Atlantic. Fish Oceanogr. (2020) 29:169–84. doi: 10.1111/fog.12462
60. Molenberghs G, Verbeke G. Models for Discrete Longitudinal Data. New York, NY: Springer (2005). Available online at: https://library.wur.nl/WebQuery/titel/2116341 (accessed June 3, 2025).
61. Gibbons RD, Bock RD. Trend in correlated proportions. Psychometrika. (1987) 52:113–24. doi: 10.1007/BF02293959
62. McCulloch CE. Maximum likelihood algorithms for generalized linear mixed models. J Am Stat Assoc. (1997) 92:162–70. doi: 10.1080/01621459.1997.10473613
63. Bates D, Mächler M, Bolker B, Walker S. Fitting Linear Mixed-Effects Models using lme4. arXiv. (2014) [Preprint]. arXiv:1406.5823. doi: 10.48550/arXiv.1406.5823
64. Tuerlinckx F, Rijmen F, Verbeke G, De Boeck P. Statistical inference in generalized linear mixed models: a review. Br J Math Stat Psychol. (2006) 59:225–55. doi: 10.1348/000711005X79857
65. Sinharay S, Stern HS. Variance component testing in generalized linear mixed models. ETS Res Rep Ser. (2003) 2003:1–28. doi: 10.1002/j.2333-8504.2003.tb01906.x
66. Litière S, Alonso A, Molenberghs G. The impact of a misspecified random-effects distribution on the estimation and the performance of inferential procedures in generalized linear mixed models: impact of a misspecified random-effects distribution in GLMM. Stat Med. (2008) 27:3125–44. doi: 10.1002/sim.3157
67. Roos M, Held L. Sensitivity analysis in Bayesian generalized linear mixed models for binary data. Bayesian Anal. (2011) 6:259–78. doi: 10.1214/11-BA609
68. DeMaris A. A tutorial in logistic regression. J Marriage Fam. (1995) 956–68. doi: 10.2307/353415
69. Kuznetsova A, Brockhoff PB, Christensen RH. lmerTest package: tests in linear mixed effects models. J Stat Softw. (2017) 82:1–26. doi: 10.18637/jss.v082.i13
70. Bates D, Maechler M, Bolker B, Walker S, Christensen RHB, Singmann H. lme4: Linear Mixed-Effects Models Using ‘Eigen' and S4 (R Package Version 0.999375-20), 1–26. Available online at: http://cran.r-project.org/web/packages/lme4/lme4.pdf
71. Brooks RJ, Tobias AM. Choosing the best model: level of detail, complexity, and model performance. Math Comput Model. (1996) 24:1–14. doi: 10.1016/0895-7177(96)00103-3
72. Muñoz J, Felicísimo ÁM. Comparison of statistical methods commonly used in predictive modelling. J Veg Sci. (2004) 15:285–92. doi: 10.1111/j.1654-1103.2004.tb02263.x
73. Bosker R, Snijders TA. Multilevel analysis: an introduction to basic and advanced multilevel modeling. Multilevel Anal. (2011) 1–368. doi: 10.1007/978-3-642-04898-2_387
74. Demidenko E, Stukel TA. Influence analysis for linear mixed-effects models. Stat Med. (2005) 24:893–909. doi: 10.1002/sim.1974
75. Kent JT. Robust properties of likelihood ratio tests. Biometrika. (1982) 69:19–27. doi: 10.1093/biomet/69.1.19
76. Sculley M. Standardization of the Striped Marlin (Kajikia audax) Catch per Unit Effort Data Caught by the Hawaii-based Longline Fishery from 1994-2017 Using Generalized Linear Models. ISC/2019/BILLWG-01/XX. (2019). Available online at: https://isc.fra.go.jp/pdf/BILL/ISC19_BILL_1/ISC19_BILLWG_WP1-6.pdf
77. Ware JH. Linear models for the analysis of longitudinal studies. Am Stat. (1985) 39:95–101. doi: 10.1080/00031305.1985.10479402
78. Hartig F. DHARMa: Residual Diagnostics for Hierarchical (Multi-level/Mixed) Regression Models (R Package Version [Version 0.3.2.0]) (2017). Available online at: https://CRAN.R-project.org/package=DHARMa
79. Hviid MM, Skovlund CW, Mørch LS, Lidegaard Ø. (2017). Maternal age and child morbidity: a Danish national cohort study. PLoS ONE 12:e0174770. doi: 10.1371/journal.pone.0174770
Keywords: AIC, children comorbidity, DHARMa, GLMMs, Laplace approximation, random effect
Citation: Derso EA, Gelaye KA, Campolo MG, Woldemariam AT and Alibrandi A (2025) Neighborhood-level heterogeneity in childhood morbidity through generalized linear mixed models. Front. Public Health 13:1456068. doi: 10.3389/fpubh.2025.1456068
Received: 27 June 2024; Accepted: 15 May 2025;
Published: 21 July 2025.
Edited by:
Legesse Kassa Debusho, University of South Africa, South AfricaReviewed by:
Manuel de Jesús Castillejos López, National Institute of Respiratory Diseases-Mexico (INER), MexicoMohammed Ahmed, Haramaya University, Ethiopia
Copyright © 2025 Derso, Gelaye, Campolo, Woldemariam and Alibrandi. This is an open-access article distributed under the terms of the Creative Commons Attribution License (CC BY). The use, distribution or reproduction in other forums is permitted, provided the original author(s) and the copyright owner(s) are credited and that the original publication in this journal is cited, in accordance with accepted academic practice. No use, distribution or reproduction is permitted which does not comply with these terms.
*Correspondence: Endeshaw A. Derso, ZW5kdWFzc0BnbWFpbC5jb20=
†ORCID: Endeshaw A. Derso orcid.org/0000-0003-3239-5230