 Xiaoyue Ge
 De an Wu2
- 1The Academy of Chinese Health Risks of West China Hospital, Sichuan University, Chengdu, China
- 2School of Mathematics, University of Electronic Science and Technology of China, Chengdu, China
Aims: In order to accurately and quantitatively grasp the current situation and trend of Chinese people’s life-safety performance and to provide scientific basis and suggestions for the government, scientific research institutions, enterprises and the public to do a good job in life-safety protection.
Methods: The establishment process of life-safety disparity index (LDI) included six steps, including (i) concept building (ii) framework formulation; (iii) indicator selection; (iv) database building; (v) weight determination; and (vi) LDI scores calculation. The indicator scheme for LDI based on this framework was constructed after multiple rounds of panel discussions with our expert advisory committee. We adopted the Data envelopment analysis-Compromise planning (DEA-CP) model to determine the weights for each indicator and calculate score.
Results: The weighted indicator scheme of LDI comprised 6 first-grade indicators, 21 s-grade indicators, and 65 third-grade indicators. According to the pilot analysis based on the data from 31 provinces of China mainland, the maximum value of LDI was 100.00, the minimum value was 54.75, and the maximum value was 1.83 times the minimum value. According to the score, China mainland was divided into 5 life-safety guarantee zones, including high security zone, medium to high security zone, medium security zone, low to medium security zone, and low security zone.
Conclusion: LDI, which has been strictly verified, would represent the world’s first assessment tool that builds a conceptual framework from the overall perspective of ensuring life-safety.
1 Introduction
In 2000–2019, before the COVID-19 pandemic in the new millennium, the world has achieved remarkable progress in health. The child mortality has reduced by half, the maternal mortality rate has dropped by one third, the incidence rates of many infectious diseases have declined, and the risk of premature death caused by noncommunicable diseases and injuries has declined. The global life expectancy at birth has risen from 67 years in 2000 to 73 years in 2019 (1).
The COVID-19 has had an unprecedented impact on every country in the world. Up to 28 of April 2024, a total of 775.38 million people worldwide have been infected and 7.05 million people have died (2). According to WHO data, years of life lost estimates show that a total of 336.8 million life-years have been lost globally due to the COVID-19 pandemic in 2020–2021. The global life expectancy at birth has dropped from 73 years in 2019 to 71.3 years in 2021 (3). The outbreak of COVID-19 has made countries all over the world pay more attention to ensuring people’s life-safety and biosecurity.
To achieve the goal of universal coverage of health care in China, the new round of health sector reform announced in 2009, a series of strategies and measures were proposed, summarized as “four beams and eight pillars”(Si Liang Ba Zhu) (4). As of 2011, the health insurance scheme reached a high point in coverage of 95%. The average life expectancy of the Chinese has increased from 35 years in 1949 to 78.6 years in 2023 (5). There is a large gap in the life expectancy of different provinces in China. Shanghai has the longest life expectancy, which is 82.55 years, while Tibet has the shortest life expectancy, which is 72.19 years, with a difference of 10.36 years. The serious inequality of this indicator shows that there are still many problems in ensuring the life-safety of people in China. As a developing country with a population of 1.408 billion, accounting for 17.4% of the global population, ensuring the safety of every individual in China poses a significant challenge. Recognizing this challenge, we propose six steps toward development of the Life-safety Disparity Index (LDI) as a potential tool for the systematic evaluation of life-safety performance in various provinces of China.
2 Methods
LDI was constructed in six steps, including (i) concept building (ii) framework formulation; (iii) indicator selection; (iv) database building; (v) weight determination; and (vi) LDI scores calculation.
2.1 Concept
According to the WHO’s latest charter, health is a state of physical, mental and social perfection, not just the absence of disease or frailty (6). Health care and medicine are important means to protect human health.
Life-safety usually refers to the state and ability of human beings to deal with themselves, natural, human and other adverse factors, and to ensure their normal life and social activities. The self-factors include lifestyle, diet, aging, metabolism, etc. The natural factors include climate, hydrology, geology, altitude, etc. The human factors include biological laboratory leakage, biological terror, biological warfare, etc. Health is the inherent requirement and the core expression of life-safety.
Biosecurity refers to the state and ability of a country or region to effectively respond to the impacts and threats caused by all dangerous organisms, as well as the abuse and misuse of biotechnology, in order to maintain and safeguard people’s life-safety, ecological security and national security. Biosecurity includes public health security, which core is to protect people’s life-safety, agricultural biosecurity, biodiversity and ecological security, biotechnology and laboratory security, national border biosecurity, national defense biosecurity, biosecurity supportability building (7).
Most institutions and experts generally endorse that national security refers to a stable state of no external aggression and threats, no internal chaos and hidden dangers (8). Biosecurity is a part of China’s national security.
LDI refers to the gap in the ability and effect of ensuring life-safety between different countries, regions and departments, mainly including the quantity, quality, structure and benefit of health level, medical capacity, disease prevention and control, ecological environment, medical expenditure, health industry, public health policies, etc.
2.2 Index framework formulation
We developed the framework based on the concept of life-safety and LDI, including 6 core components: health level, medical capabilities, disease prevention and control, ecological environment, health expenditure and health industry.
2.3 Indicator selection
We constructed 73 initial indicators after four rounds of expert consultation. In the first round, based on the framework, the first, second, and third grade indicators were preliminarily determined. In the second round, large-scale collection of indicator data begined based on core data sources. In the third round, we integrated indicators based on the collected indicator data and condense the number of indicators. In the fourth round, we further optimized the indicators using proportion algorithms. However, due to high data missing or lack of official data, 8 indicators were deleted, ultimately forming an indicator system with 6 first-grade indicators, 21 s-grade indicators, and 65 third-grade indicators.
2.4 Data sources
The raw data used in this study, except for the altitude from the topographic map (topographic map), were all from the China Health Statistics Yearbook, China Statistical Yearbook, Urban and Rural Construction, Statistical Analysis Report on the Operation of the Drug Distribution Industry released by the Ministry of Commerce, the Ecological Environment Statistical Bulletin and other report released by government and the relevant departments.
2.5 Weight determination and LDI scores calculation
LDI used an improved Data envelope analysis-Compromise planning (DEA-CP) model (9). The advantage of this model was that it could intelligently determine the weight of each indicator to avoid the subjective error of artificial weight determination. The score of the best performing life-safety unit (country, region, department, institution, etc.) in the same indicator was 100. Afterwards, comparing the remaining units with the optimal unit and calculating the gap between different units for the same indicator. The LDI was a comprehensive calculation of the gap between multiple indicators. It is a two-stage comprehensive evaluation model:
First Stage: The traditional DEA model is used to calculate the optimal efficiency score for each life-safety unit (country, region, department, institution, etc.), allowing each unit to adopt the weights most favorable to itself, resulting in an ideal score vector.
Second Stage: Compromise Programming is employed to minimize the overall deviation between the actual scores of all evaluation units and the ideal scores. The L2 norm (Euclidean distance) is used for optimization, solving for a unified weight within the feasible weight domain to ensure fairness and consistency, avoiding the issue of weight dispersion in DEA.
3 Results
3.1 LDI indicator and weight scheme
The indicator scheme for LDI comprised of 6 first-grade indicators, 21 s-grade indicators, and 65 third-grade indicators (Figure 1). DEA-CP was used to determine the weights assigned. Table 1 showed the indicator and weight scheme of LDI.
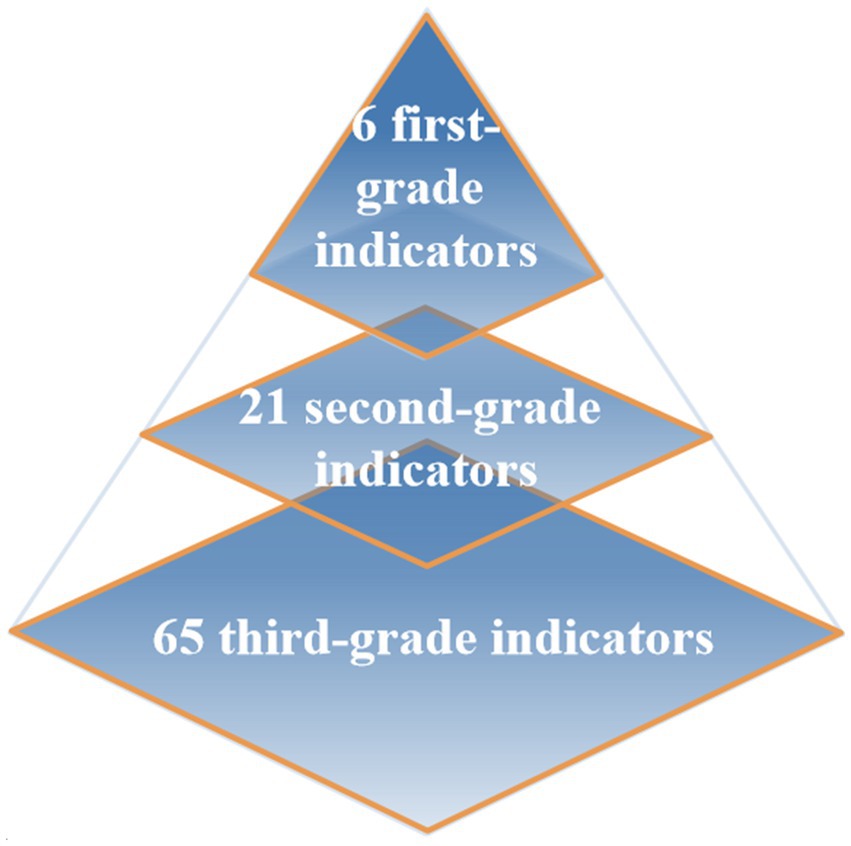
Figure 1. Indicator structure of LDI.
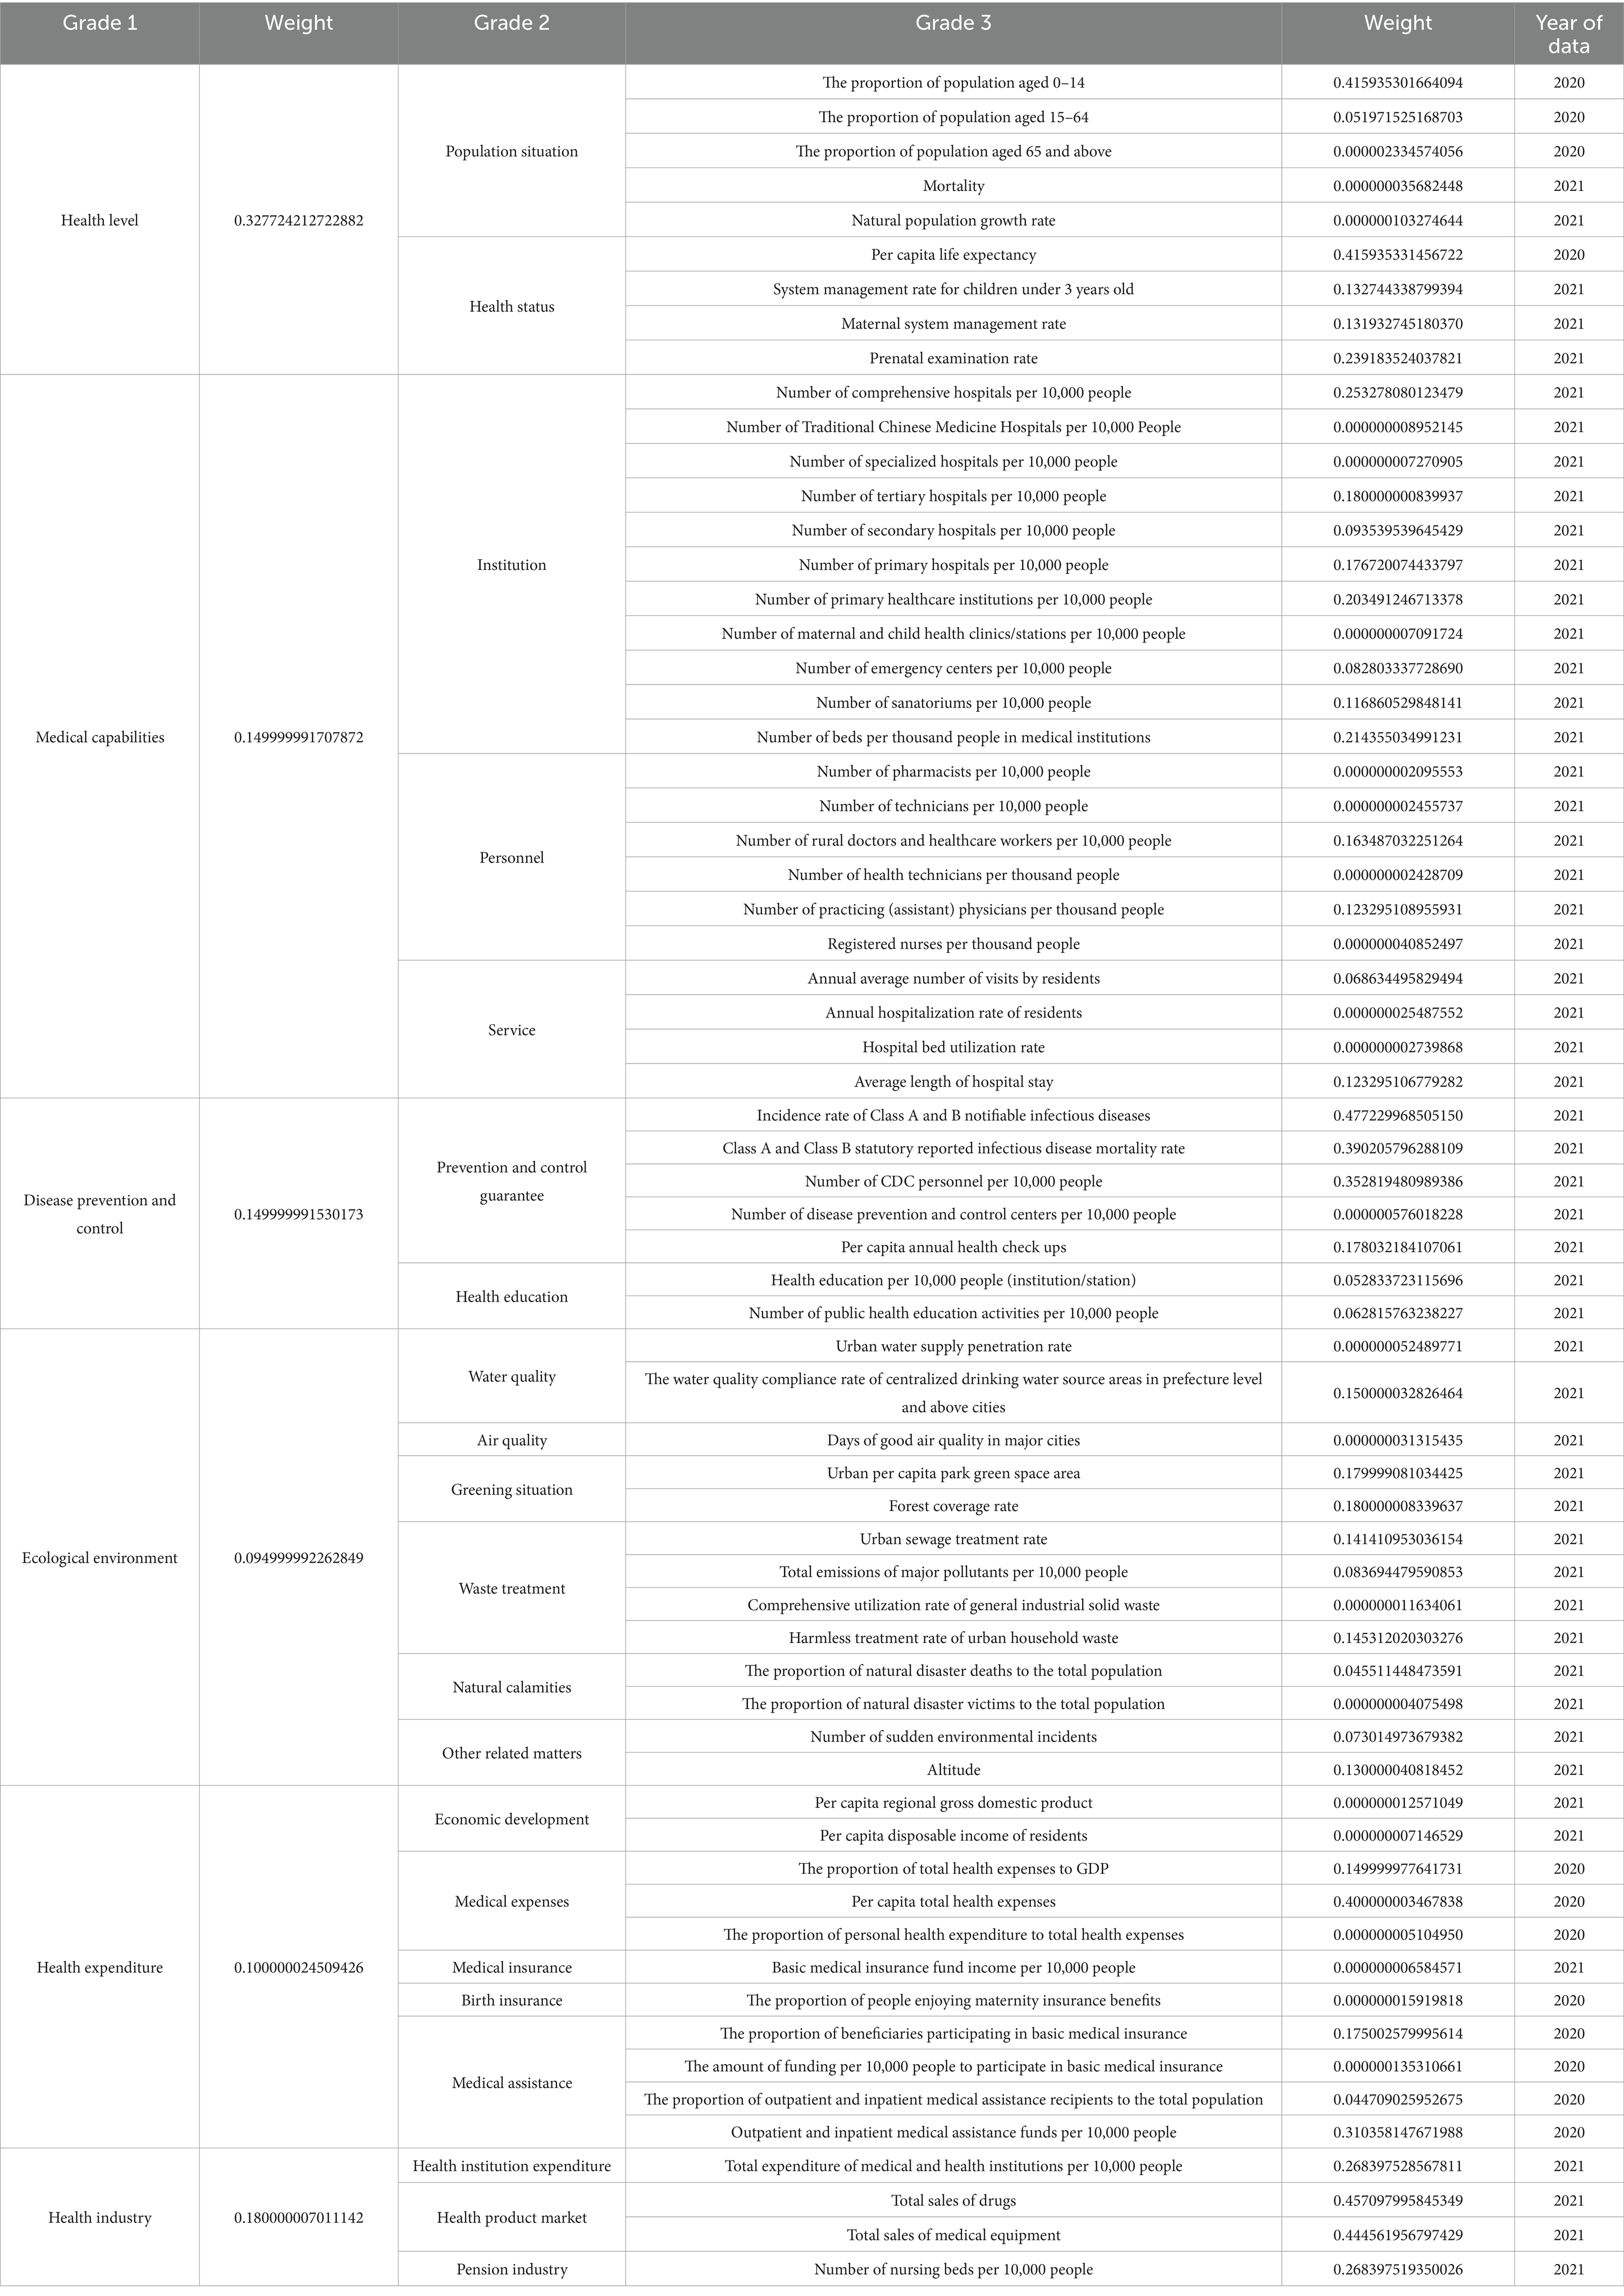
Table 1. LDI indicator system.
3.2 LDI pilot analysis
We calculated the LDI score for the provinces included (Table 2).
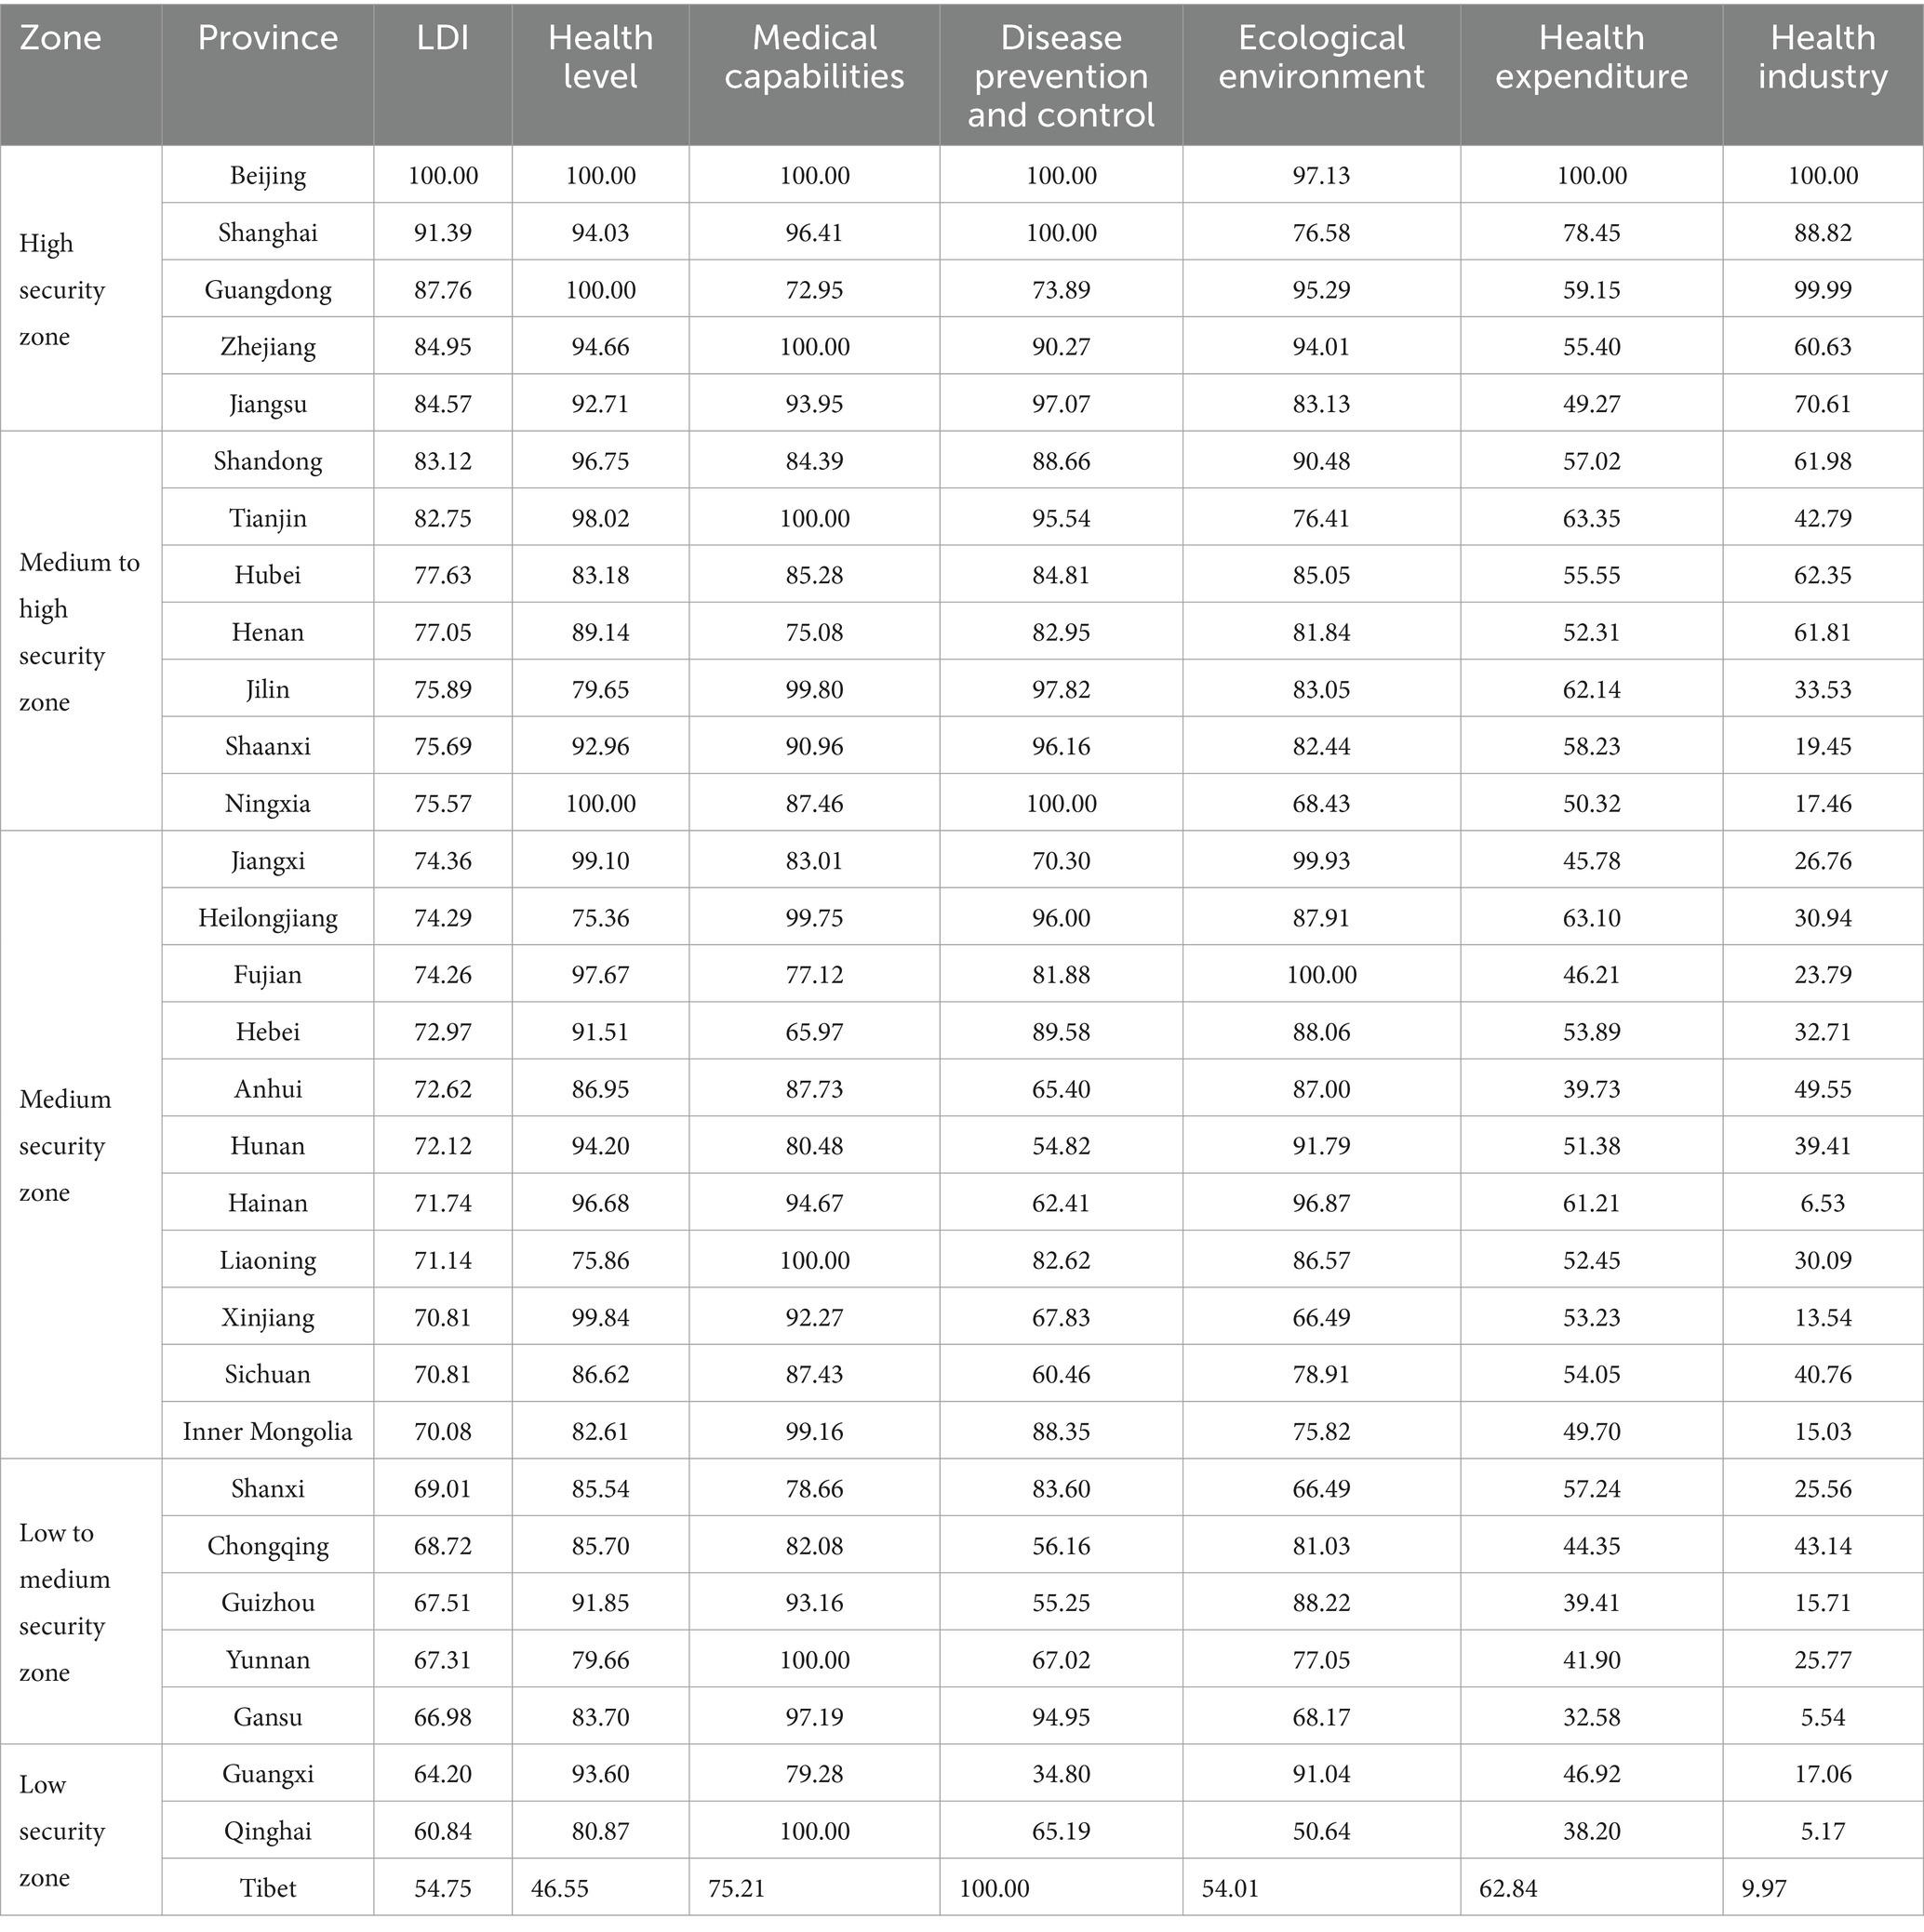
Table 2. LDI score of provinces in China.
As shown in Table 2, the highest value of the LDI was 100.00 and the lowest value was 54.75. China mainland was divided into 5 life-safety guarantee zones according to the score, including high security zone, medium to high security zone, medium security zone, low to medium security zone, and low security zone. Provinces with scores greater than or equal to 84 were defined as high security zones, including Beijing, Shanghai, Guangdong, Zhejiang, and Jiangsu, and provinces with scores between 75 and 84 were defined as the medium to high security zone, including Shandong, Tianjin, Hubei, Henan, Jilin, Shaanxi, Ningxia, and provinces with scores between 70 and 75 were defined as the medium security zone, including Jiangxi, Heilongjiang, Fujian, Hebei, Anhui, Hunan, Hainan, Liaoning, Xinjiang, Sichuan, Inner Mongolia, and provinces with scores between 65 and 70 were defined as low to medium security zone, including Shanxi, Chongqing, Guizhou, Yunnan and Gansu, and provinces with scores less than 65 were defined as low security zone, including Guangxi, Qinghai and Tibet.
The LDI indicator system comprises six first-level indicators. Based on the scores of the six first-level indicators for each province in Table 2, a six-element radar chart has been created for each province. This chart provides a more intuitive representation of the performance of each region’s six first-level indicators, highlighting their strengths and weaknesses (Figures 2–6).
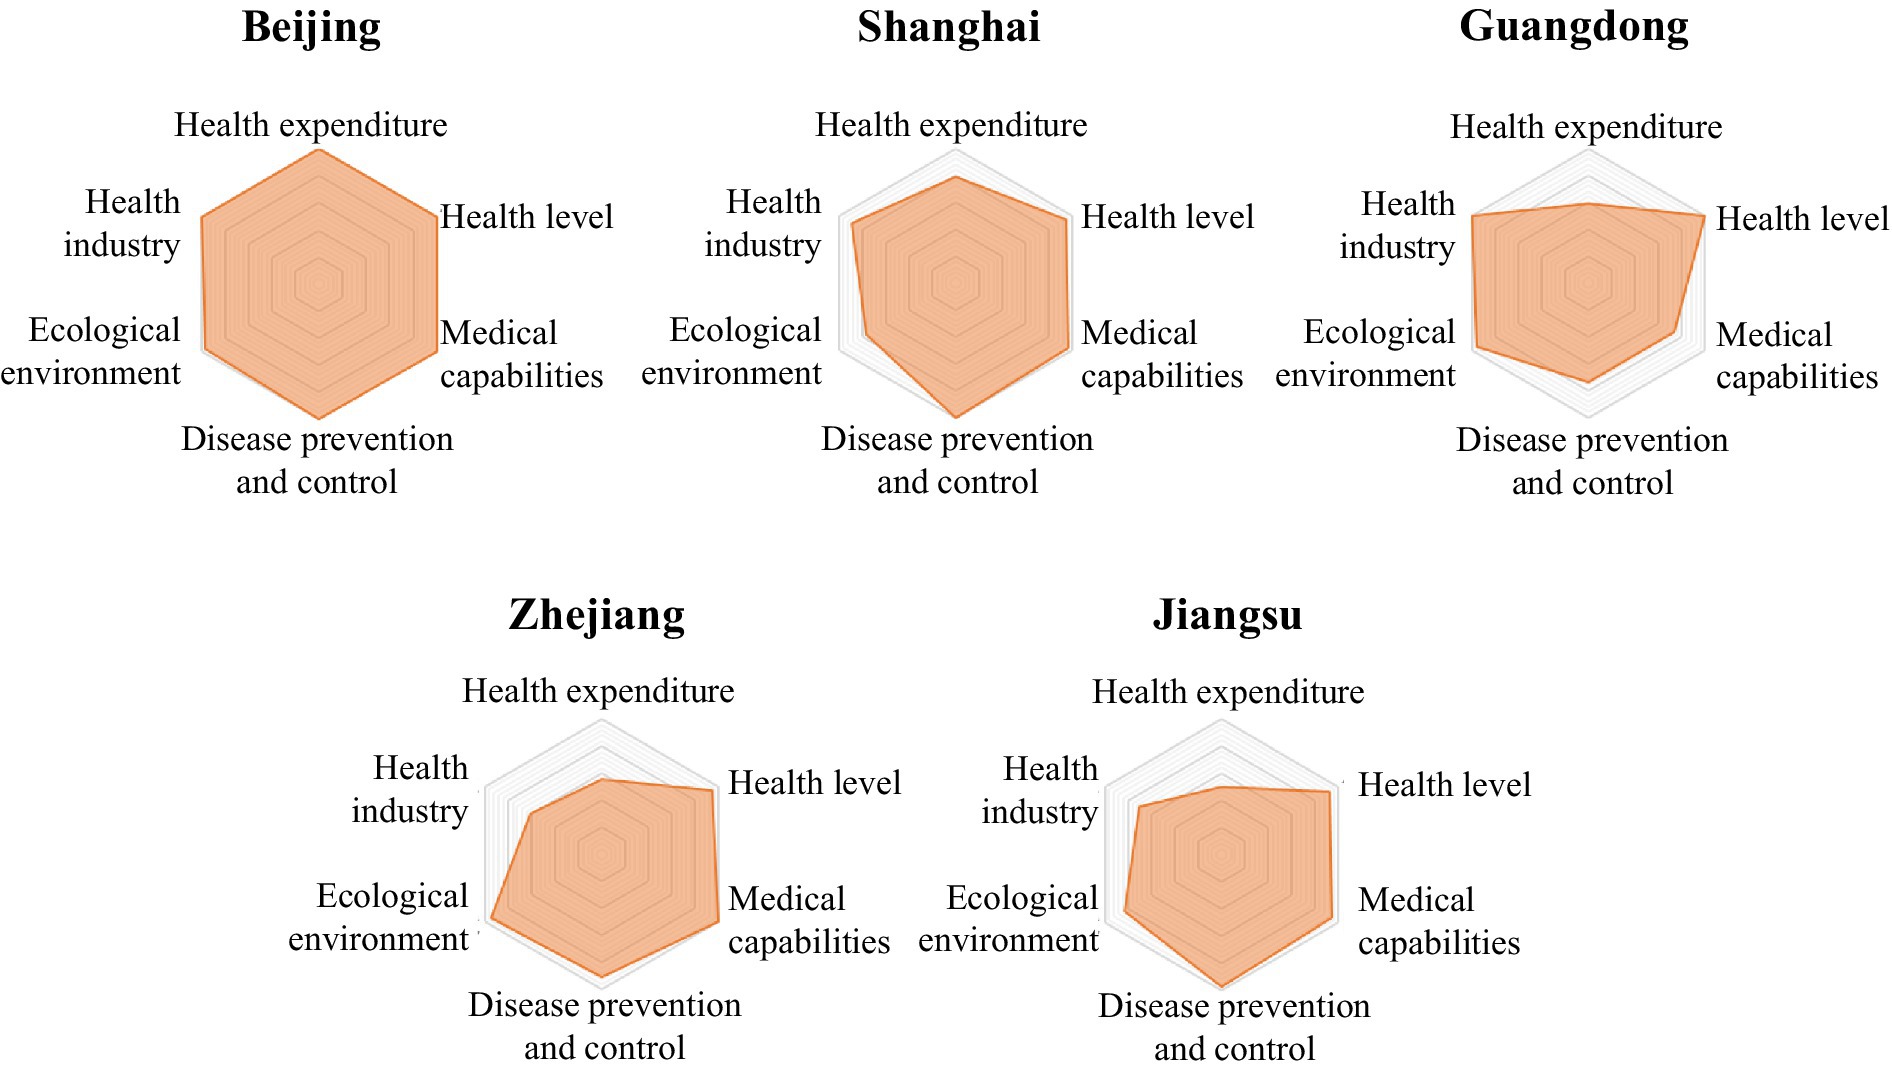
Figure 2. Radar map of LDI in high security zone.
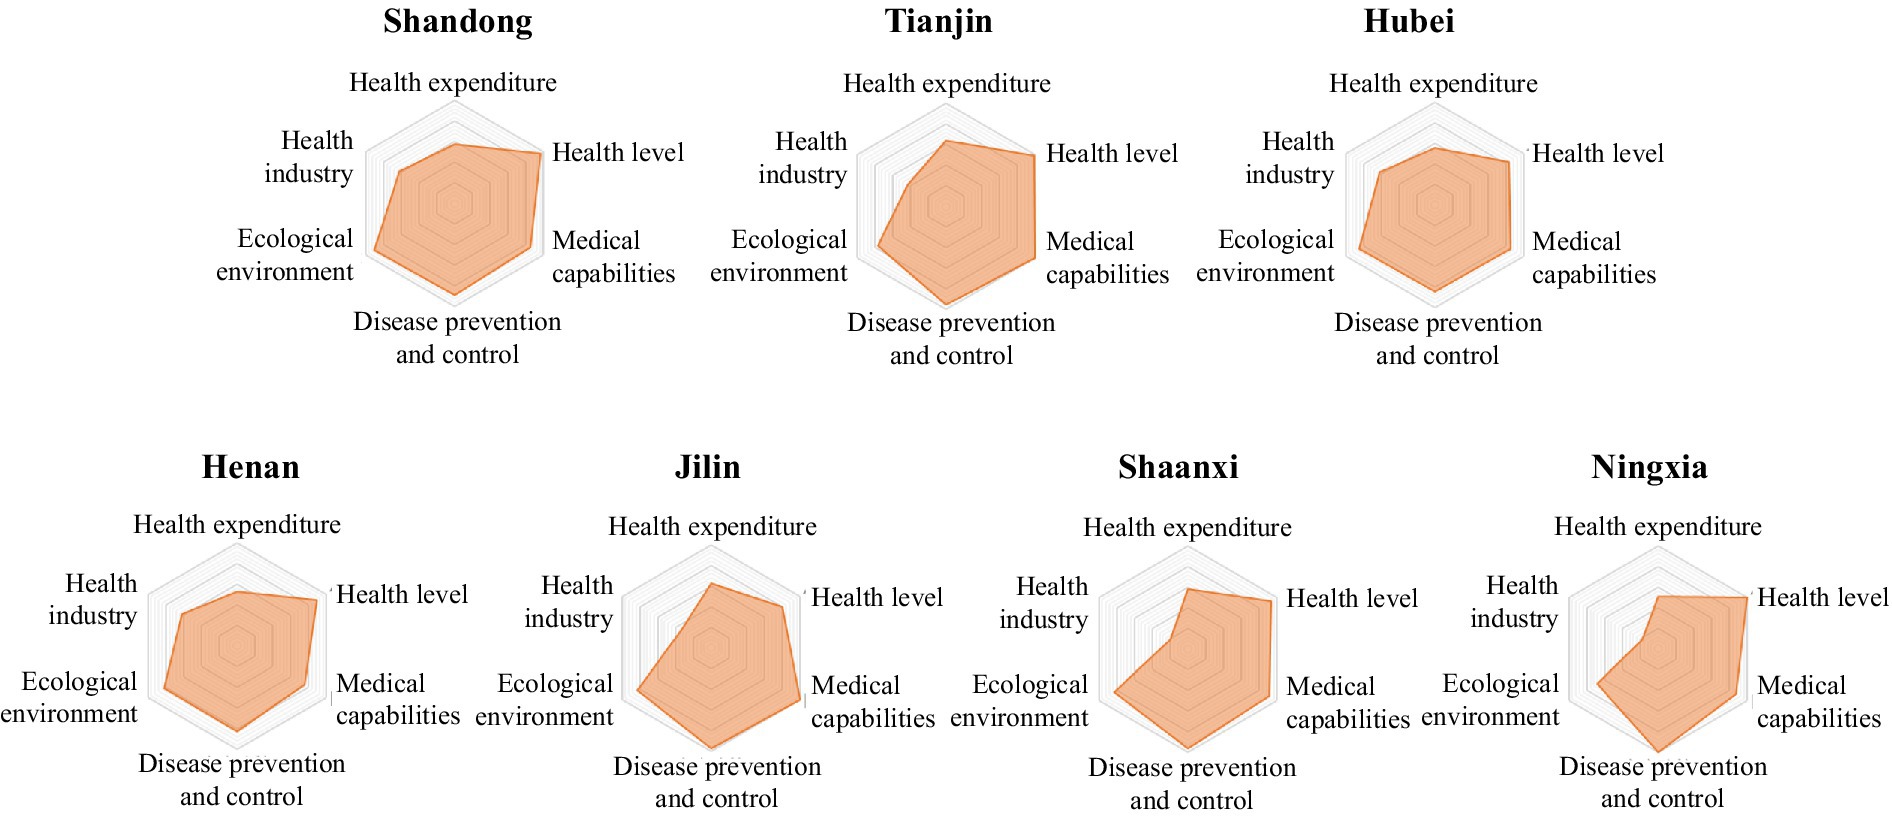
Figure 3. Radar map of LDI in medium to high security zone.
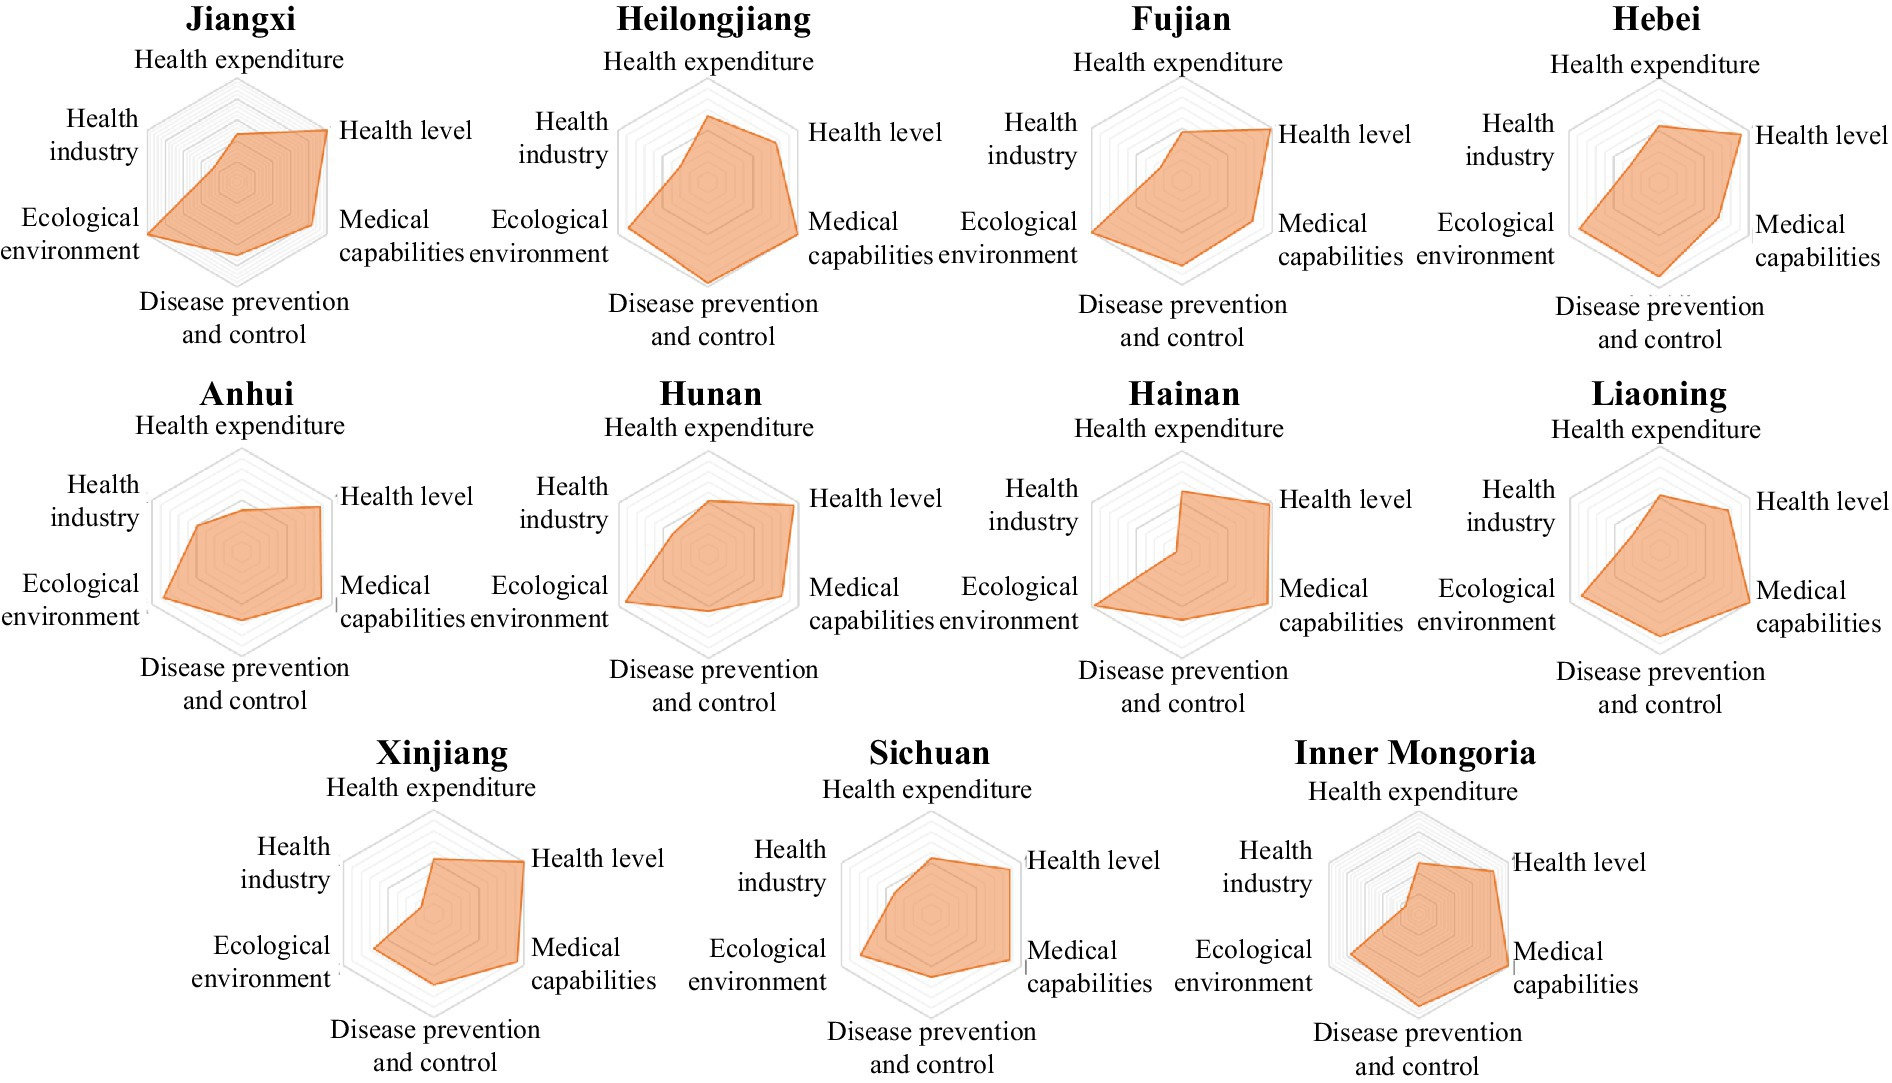
Figure 4. Radar map of LDI in medium security zone.
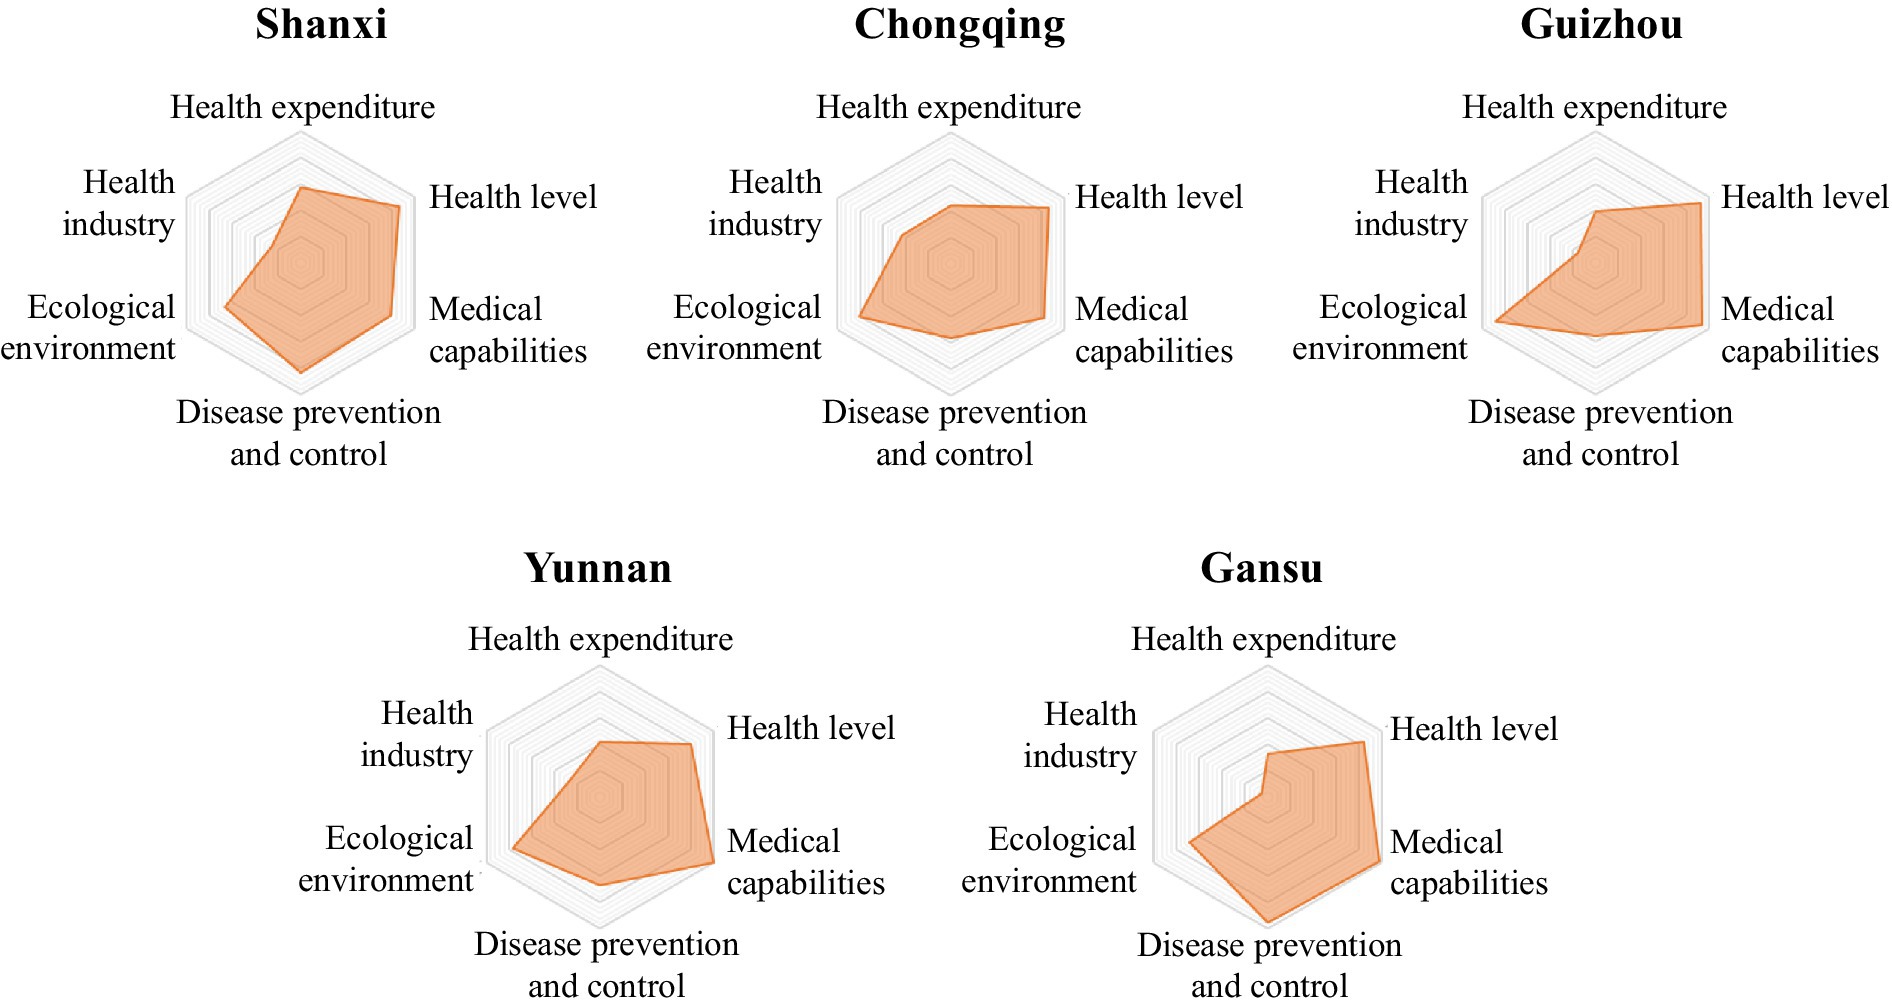
Figure 5. Radar map of LDI in low to medium security zone.
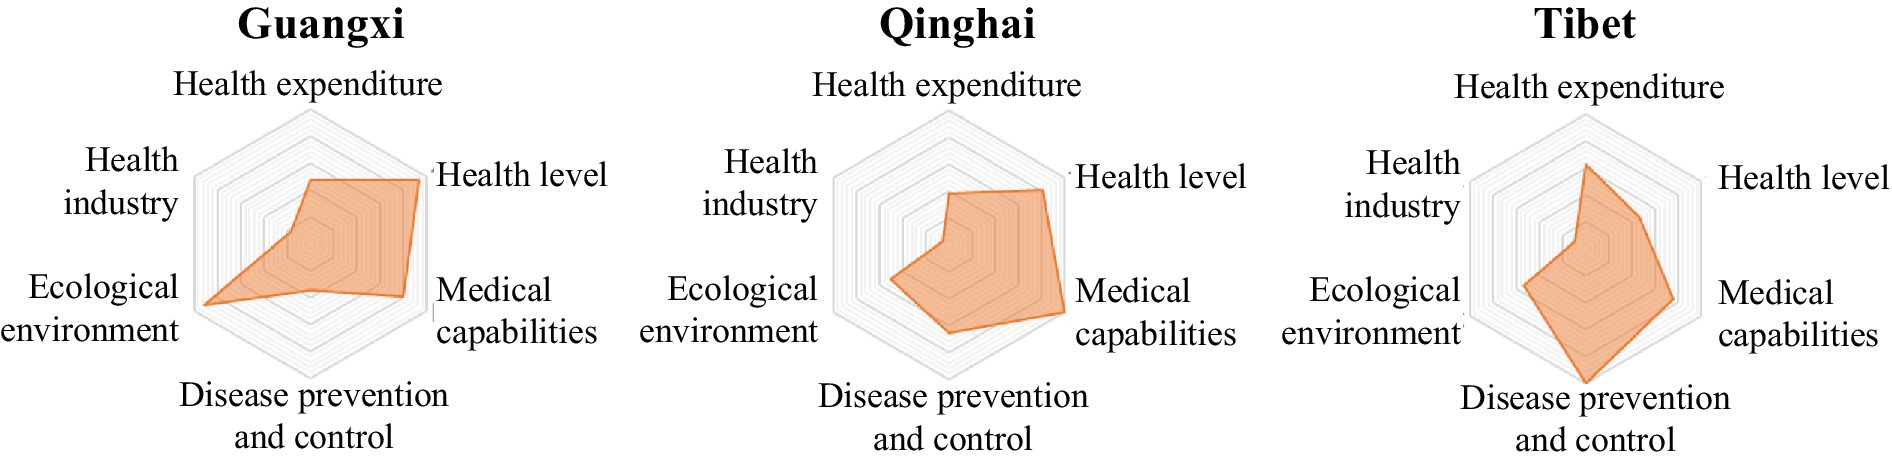
Figure 6. Radar map of LDI in low security zone.
3.2.1 High security zone
The common characteristics of provinces in the high security zone were high health level, strong medical security capabilities, perfect disease prevention and control system, good ecological environment, adequate medical spending, and developed health industry. The six first-level indicators were balanced and efficient, and the shortcomings in ensuring life-safety were not obvious, or the shortcomings were easy to make up (Figure 2).
1 The LDI of Beijing was 100.00, ranking first. The indices of medical expenditure and health industry both were 100.00, ranking first. The indices of health level, medical capacity, disease prevention and control, and ecological environment were 100.00, 100.00, 100.00 and 97.13 respectively, ranking second, third, fourth and third.
2 The LDI of Shanghai was 91.39, ranking second. The medical expenditure index was 78.45, ranking second; the health industry index was 88.82, ranking third; the disease prevention and control index was 100.00, ranking third; the medical capacity index was 96.41, ranking 11th; the health level index was 94.03, ranking 12th; and the ecological environment index was 76.58, ranking 23rd.
3 The LDI of Guangdong province was 87.76, ranking second. The health industry index was 99.99, ranking second; the health level index was 100.00, ranking third; the ecological environment index was 95.29, ranking 5th, the medical expenditure index was 59.15, ranking 8th; the disease prevention and control index was 73.89, ranking 20th; the medical capacity index was 72.95, ranking second-to-last.
4 The LDI of Zhejiang province was 84.95, ranking fourth. The medical capacity index was 100.00, ranking 4th; the ecological environment index was 94.01, ranking 6th; the health industry index was 60.63, ranking 8th; the health level index was 94.66, ranking 10th; the disease prevention and control index was 90.27, ranking 11th; the medical expenditure index was 55.40, ranking 13th.
5 The LDI of Jiangsu province was 84.57, ranking fifth. The health industry index was 70.61, ranking 6th; the disease prevention and control index was 97.07, ranking 6th; the medical capacity index was 93.95, ranking 13th; the health level index was 92.71, ranking 15th; the ecological environment index was 83.13, ranking 16th; the medical expenditure index was 49.27, ranking 22nd.
3.2.2 Medium to high security zone
The common characteristics of provinces in the medium to high security zone were high health level, strong medical security ability, perfect disease prevention and control system construction, and relatively balanced ecological environment construction. However, there was an obvious economic gap with the high security zone, resulting in the relative shortage of resource allocation of the two elements of medical expenditure and health industry. Therefore, this security zone should increase medical investment and strengthen the development of the health industry (Figure 3).
6 The LDI of Shandong province was 83.12, ranking 6th. The health industry index was 61.98, ranking 6th; the health level index was 96.75, ranking 8th; the ecological environment index was 90.48, ranking 9th; the medical expenditure index was 57.02, ranking 11th; the disease prevention and control index was 88.66, ranking 13th; the medical capacity index was 84.39, ranking 21st.
7 The LDI of Tianjin province was 82.75, ranking seventh. The medical expenditure index was 63.35, ranking 3rd; the medical capacity index was 100.00, ranking 5th; the health level index was 98.02, ranking 6th; the disease prevention and control index was 95.54, ranking 9th; the health industry index was 42.79, ranking 11th; the ecological environment index was 76.41, ranking 24th.
8 The LDI of Hubei province was 77.63, ranking eighth. The health industry index was 62.35, ranking 5th; the medical expenditure index was 55.55, ranking 12th; the disease prevention and control index was 84.81, ranking 15th; the ecological environment index was 85.05, ranking 15th; the medical capacity index was 85.28, ranking 20th; and the health level index was 83.18, ranking 24th.
9 The LDI of Henan province was 77.05, ranking ninth. The health industry index was 61.81, ranking 7th; the medical expenditure index and health level index were 52.31 and 89.14 respectively, both ranking 18th; the disease prevention and control index was 82.95, ranking 17th; the ecological environment index was 81.84, ranking 19th; the medical capacity index was 75.08, ranking third to last.
10 The LDI of Jilin Province was 75.89, ranking 10th. The disease prevention and control index was 97.82, ranking 5th; the medical expenditure index was 62.14, ranking 6th; the medical capacity index was 99.80, ranking 7th; the health industry index was 33.53, ranking 14th; the ecological environment index was 83.05, ranking 17th; the health level index was 79.65, ranking fourth.
11 The LDI of Shaanxi province was 75.69, ranking 11th. The disease prevention and control index was 96.16, ranking 7th; the medical expenditure index was 58.23, ranking 9th; the health level index was 92.96, ranking 14th; the medical capacity index was 90.96, ranking 16th; the ecological environment index was 82.44, ranking 18th; the health industry index was 19.45, ranking 22nd.
12 The LDI of Ningxia Hui Autonomous Region was 75.57, ranking 12th. The health level index was 100.00, ranking first; the disease prevention and control index was 100.00, ranking first; the medical capacity index was 87.46, ranking 18th; the medical expenditure index was 50.32, ranking 20th; the health industry index was 17.46, ranking 23rd; the ecological environment index was 68.43, ranking 26th.
3.2.3 Medium security zone
The common characteristics of provinces in the medium security zone were basic balance and medium efficiency between health level, medical ability, disease prevention and control, ecological environment, but the medical ability of Hebei province and the capacity of disease prevention and control of Anhui, Hunan, Hainan, Xinjiang, Sichuan provinces were not strong. The inadequate medical spending and health industry of this security zone were more obvious. Some of the disadvantages in this zone may be easily ameliorated, and some of them require long-term accumulation to be ameliorated (Figure 4).
13 The LDI of Jiangxi province was 74.36, ranking 13th. The ecological environment index was 99.93, ranking 2nd; the health level index was 99.10, ranking 5th; the health industry index was 26.76, ranking 18th; the disease prevention and control index was 70.30, ranking 21st; the medical capacity index was 83.01, ranking 22nd; the medical expenditure index was 45.78, ranking 25th.
14 The LDI of Heilongjiang province was 74.29, ranking 14th. The medical expenditure index was 63.10, ranking fourth; the medical capacity index was 99.75, ranking 8th; the disease prevention and control index was 96.00, ranking 8th; the ecological environment index was 87.91, ranking 12th; the health industry index was 30.94, ranking 16th; and the health level index was 75.36, ranking 30th.
15 The LDI of Fujian province was 74.26, ranking 15th. The ecological environment index was 100.00, ranking first; the health level index was 97.67, ranking 7th; the disease prevention and control index was 81.88, ranking 19th; the health industry index was 23.79, ranking 21st; the medical expenditure index was 46.21, ranking 24th; the medical capacity index was 77.12, ranking 27th.
16 The LDI of Hebei province was 72.97, ranking 16th. The ecological environment index was 88.06, ranking 11th; the disease prevention and control index was 89.58, ranking 12th; the medical expenditure index and the health industry index were 53.89 and 32.71 respectively, both ranking 15th; the health level index was 91.51, ranking 17th; the medical capacity index was 65.97, ranking 31st.
17 The LDI of Anhui province was 72.62, ranking 17th. The health industry index was 49.55, ranking 9th; the ecological environment index was 87.00, ranking 13th; the medical capacity index was 87.73, ranking 17th; the health index was 86.95, ranking 19th; the disease prevention and control index was 65.40, ranking 24th; the medical expenditure index was 39.73, ranking 28th.
18 The LDI of Hunan province was 72.12, ranking 18th. The ecological environment index was 91.79, ranking 7th; the health level index was 94.20, ranking 11th; the health industry index was 39.41, ranking 13th; the medical expenditure index was 51.38, ranking 19th; the medical capacity index was 80.48, ranking 24th; the disease prevention and control index was 54.82, ranking 30th.
19 The LDI of Hainan province was 71.74, ranking 19th. The ecological environment index was 96.87, ranking 4th; the medical expenditure index was 61.21, ranking 7th; the health level index was 96.68, ranking 9th; the medical capacity index was 94.67, ranking 12th; the disease prevention and control index was 62.41, ranking 26th; and the health industry index was 6.53, ranking 29th.
20 The LDI of Liaoning province was 71.14, ranking 20th. The medical capacity index was 100.00, ranking first; the ecological environment index was 86.57, ranking 14th; the medical expenditure index and the health industry index were 52.45 and 30.09 respectively, both ranking 17th; the disease prevention and control index was 82.62, ranking 18th; the health level index was 75.86, ranking 29th.
21 The LDI of Xinjiang Uygur Autonomous Region was 70.81, ranking 21st. The health level index was 99.84, ranking 4th; the medical capacity index was 92.27, ranking 15th; the medical expenditure index was 53.23, ranking 16th; the disease prevention and control index was 67.83, ranking 22nd; the health industry index was 13.54, ranking 27th; and the ecological environment index was 66.49, ranking 29th.
22 The LDI of Sichuan province was 70.81, ranking 22nd. The health industry index was 40.76, ranking 12th; the medical expenditure index was 54.05, ranking 14th; the medical capacity index was 87.43, ranking 19th; the health level index was 86.62, ranking 20th; the ecological environment index was 78.91, ranking 21st; the disease prevention and control index was 60.46, ranking 27th.
23 The LDI of Inner Mongolia was 70.08, ranking 23rd. The medical capacity index was 99.16, ranking 9th; the disease prevention and control index was 88.35, ranking 14th; the medical expenditure index was 49.70, ranking 21st; the health level index and the ecological environment index were 82.61 and 75.82 respectively, both ranking 25th; the health industry index was 15.03, ranking 26th.
3.2.4 Low to medium security zone
The common characteristics of provinces in the low to medium security zone were weak economic development, obvious shortcomings in medical expenditure and health industry, and obviously weak disease prevention and control capacity of Chongqing, Guizhou and Yunnan provinces, and the ecological environment index of Shanxi and Gansu were obviously small due to their geological reasons (Figure 5). Therefore, the five provinces should take economic development as the center, and strengthen medical expenditure and health industry development, but also pay attention to disease prevention and control, as well as ecological environment construction.
24 The LDI of Shanxi Province was 69.01, ranking 24th. The medical expenditure index was 57.24, ranking 10th; the disease prevention and control index was 83.60, ranking 16th; the health industry index was 25.56, ranking 20th; the health level index was 85.54, ranking 22nd; the medical capacity index was 78.66, ranking 26th; the ecological environment index was 66.49, ranking 28th.
25 The LDI of Chongqing was 68.72, ranking 25th. The health industry index was 43.14, ranking 10th; the ecological environment index was 81.03, ranking 20th; the health level index was 85.70, ranking 21st; the medical capacity index was 82.08, ranking 23rd; the medical expenditure index was 44.35, ranking 26th; the disease prevention and control index was 56.16, ranking 28th.
26 The LDI of Guizhou province was 67.51, ranking 26th. The ecological environment index was 88.22, ranking 10th; the medical capacity index was 93.16, ranking 14th; the health level index was 91.85, ranking 16th; the health industry index was 15.71, ranking 25th; the medical expenditure index and disease prevention and control index were 39.41 and 55.25 respectively, both ranking 29th.
27 The LDI of Yunnan province was 67.31, ranking 27th. The medical capacity index was 100.00, ranking 6th; the health industry index was 25.77, ranking 19th; the ecological environment index was 77.05, ranking 22nd; the disease prevention and control index was 67.02, ranking 23rd; the health level index and the medical expenditure index were 79.66 and 41.90 respectively, both ranking 27th.
28 The LDI of Gansu province was 66.98, ranking 28th. The medical capacity index was 97.19, ranking 10th; the disease prevention and control index was 94.95, ranking 10th; the health level index was 83.70, ranking 23rd; the ecological environment index was 68.17, ranking 27th; the health industry index was 5.54, ranking 30th; and the medical expenditure index was 32.58, ranking 31st.
3.2.5 Low security zone
The common characteristics of provinces in the low security zone were insufficient medical expenditure, low health level, poor medical capacity, weak disease prevention and control, poor ecological environment and weak health industry (Figure 6). The ability of this zone to protect people’s life-safety was poor, which requires the comprehensive force of multiple elements. However, at the same time, some disadvantages of Qinghai and Tibet were caused by external factors such as geography, environment and altitude that cannot be changed. Therefore, these three provinces should make up for the factors that they can change, and try their best to narrow the gap with other provinces.
29 The LDI of Guangxi Zhuang Autonomous Region was 64.20, ranking 29th. The ecological environment index was 91.04, ranking 8th; the health level index was 93.60, ranking 13th; the medical expenditure index was 46.92, ranking 22nd; the health industry index was 17.06, ranking 24th; the medical capacity index was 79.28, ranking 25th; the disease prevention and control index was 34.80, ranking 31st.
30 The LDI of Qinghai province was 60.84, ranking 30th. The medical capacity index was 100.00, ranking second; the disease prevention and control index was 65.19, ranking 25th; the health level index was 80.87, ranking 26th; the medical expenditure index was 38.20, ranking 30th; the ecological environment index and the health industry index were 50.64 and 5.17 respectively, both ranking 31st.
31 The LDI of Tibet Autonomous Region was 54.75, ranking 31st. The disease prevention and control index was 100.00, ranking second; the medical expenditure index was 62.84, ranking fifth; the medical capacity index and the health industry index were 75.21 and 9.97 respectively, both ranking 28th; the ecological environment index was 54.01, ranking 30th; the health level index was 46.55, ranking 31st.
4 Discussion
By reviewing more than 1,200 literatures, we found that there are two types of health index. One type index is to evaluate the health status of major countries around the world and form a global index distribution, such as the Global Health Security Index (GHS) (10), the Human Development Index (HDI) (11), the Global One Health Index (GOHI) (12, 13), the Bloomberg Global Health Index (14), European Health Index (15), International Dietary Health Index (16). Another type index is to evaluate the health status of cities or regions in one country, aiming to understand the health level of the people in one country, such as the “China Health Index” (17), the “England Health Index” (18, 19), and the “Iran Comprehensive Social Health Index” (20). However, these studies have primarily focused on health, rather than life-safety. There is no unified concept of life-safety, and the relationship between life-safety and health is not clear. This study gives the concept of life-safety, and clarifies the relationship between life-safety and health. The indicator system of LDI is divided into three levels, providing clear determinants for the assessment of life-safety status and promoting a common understanding of these determinants.
At present, the methods of assigning weights to indicators mainly include experts grading method, analytic hierarchy process (AHP), TOPSIS method, or equal weight method. AHP requires manual setting of indicator weights. TOPSIS relies on preset weights. Although the equal weight method avoids the subjective error of artificial weighting, it loses the flexibility of the evaluation method. There are certain subjective factors and subjective errors in the processing process of these methods. DEA-CP combines the flexibility of DEA (first stage) with the global optimization of compromise programming (second stage), effectively addressing the challenge of weight allocation in multi-attribute comprehensive evaluation. Meanwhile, the use of the L2 norm ensures a unique solution to the model, avoiding the issue of multiple evaluation units tying for first place in traditional DEA, thereby improving the distinction in rankings. This study is the first to use the DEA-CP model, which can intelligently assign weights to each indicator, avoiding subjective errors and ensuring the objectivity and accuracy of evaluation results.
To ensure the validity of the data, we use authoritative data publicly available by the Chinese government or provinces as the main source of LDI data, which may result in limitations on the inclusion of some indicators. Due to a lack of data (such as data on indicators related to personal lifestyle habits), some sensitive indicators were not included in the analysis.
According to the LDI framework analysis (Table 1), medical capabilities and disease prevention-control demonstrate substantial weighting coefficients, which substantiates their critical role in safeguarding life-safety. It is suggested to increase expenditure on public health services, increase the construction of public infrastructure to ensure the life-safety of people, strengthen public propaganda, enhance people’s awareness of life-safety, and improve people’s lifestyle through reasonable diet, moderate exercise, smoking and drinking cessation, and psychological balance. Strengthening the construction of the public health system is also an essential measure to ensure the life-safety, including enhancing the ability to respond to sudden infectious diseases, and increasing the prevention and control of chronic diseases through improving the comprehensive prevention and control mechanism of chronic diseases, promoting integrated services for prevention, treatment, and rehabilitation, and other means.
5 Conclusion
Ensuring life-safety requires the joint collaboration of the central government, provinces, cities, and individuals in economic, medical, environmental, individual, and social aspects. Health level is the core manifestation of life-safety, medical capacity as well as disease prevention and control are important means to ensure life-safety. The ecological environment is an external factor that ensures life-safety. The medical expenditure and health industry determined by the economy are the foundation of life-safety guarantee. Individuals, including factors such as diet, exercise, psychology, and genetics, are important factors in ensuring people’s health. A stable social environment with complete policies and conducive to safeguarding life-safety is crucial.
From LDI, it can be seen that China as a country with a large population and vast territory, there is a significant gap in the ability of each province to ensure the life-safety. The disparity in economic foundations has led to the concentration of medical resources in developed provinces, resulting in an uneven distribution of medical resources among regions. Therefore, it is suggested that the government can attract high-quality medical resources to stay in underdeveloped areas through policy guidance, such as improving the treatment of doctors in underdeveloped areas, optimizing the evaluation criteria for doctor titles, etc. At the same time, by establishing intelligent internet hospitals, we can bridge the gap between hospitals and patients, so that people in underdeveloped areas and grass-roots people can also get high-quality medical services.
LDI is the world’s first research tool that builds an evaluation framework from a holistic perspective of life-safety. LDI can be utilized to quantitatively evaluate the life-safety performance within each country globally, and pinpoint disparities in ensuring people’s life-safety across regions within that country, thereby providing a solid foundation for policy-making in each nation. If LDI is intended to assess the life-safety status and disparities between countries or across the globe, it must take into account the influence of the global economy, policies, and the mutual interactions among nations on the life-safety status, which requires adjusting the indicator system of the index.
In the future, we will establish an indicator system suitable for evaluating the life-safety status among countries, and then employ the DAE-CP method to assess the life-safety status of each country, aiming to enhance global people’s life-safety and facilitate the establishment of a community with a shared future for mankind.
Data availability statement
The original contributions presented in the study are included in the article/supplementary material, further inquiries can be directed to the corresponding author.
Author contributions
XG: Data curation, Methodology, Supervision, Writing – original draft, Writing – review & editing. DW: Data curation, Methodology, Software, Validation, Writing – original draft, Writing – review & editing, Visualization. XS: Data curation, Methodology, Supervision, Validation, Writing – original draft, Writing – review & editing, Conceptualization, Investigation, Software. JZ: Data curation, Methodology, Supervision, Validation, Writing – original draft, Writing – review & editing. JJ: Conceptualization, Data curation, Project administration, Supervision, Writing – original draft, Writing – review & editing. BZ: Formal analysis, Methodology, Software, Writing – original draft, Writing – review & editing. HW: Conceptualization, Data curation, Methodology, Supervision, Validation, Visualization, Writing – original draft, Writing – review & editing.
Funding
The author(s) declare financial support was received for the research and/or publication of this article. This work was supported by 1.3.5 Project for Disciplines of Excellence from West China Hospital of Sichuan University (No. ZYGD21007).
Conflict of interest
The authors declare that the research was conducted in the absence of any commercial or financial relationships that could be construed as a potential conflict of interest.
Correction note
A correction has been made to this article. Details can be found at: 10.3389/fpubh.2025.1649485.
Publisher’s note
All claims expressed in this article are solely those of the authors and do not necessarily represent those of their affiliated organizations, or those of the publisher, the editors and the reviewers. Any product that may be evaluated in this article, or claim that may be made by its manufacturer, is not guaranteed or endorsed by the publisher.
References
1. World Health Organization. World health statistics 2023: monitoring health for the SDGs, sustainable development goals. Geneva: World Health Organization (2023).
2. World Health Organization. The WHO COVID-19 dashboard. (2020). Available online at: https://data.who.int/dashboards/covid19/cases?n=c (Accessed 28 April, 2024).
3. The World Bank. Databank Health Nutrition and Population Statistics. (2014). Available online at: https://databank.worldbank.org/source/health-nutrition-and-population-statistics (Accessed 11 March, 2024).
4. Meng, Qingyue, and Tang, Shenglan. Universal coverage of health care in China: challenges and opportunities. World health report (2010). 7.
5. National Health Commission of the People’s Republic of China. Statistical bulletin on the development of China’s health care industry in 2023. (2023). Available online at: https://www.gov.cn/lianbo/bumen/202408/content_6971241.htm (Accessed August 29, 2024).
6. Bian, J, and Yang, C. WHO definitions of health, illness and disability and overview of developments. J Mod Stomatol. (2022) 36:145–7.
7. Wang, H, Zhu, S, Zhang, J, You, L, Yin, Z, Zhu, Q, et al. China’s biosecurity strategy and countermeasures. Beijing: Citic Press Corporation. (2022). p. 12–15.
8. Xiao, J, and Tan, W. The concept of "national security" in the National Security law. J Henan Police Coll. (2019) 28:5–10.
9. Wang, H, Wu, D, Yin, Z, Zhu, S, Jin, Q, Zhang, J, et al. Gap economics-the economic gap and trend between China and the United States, and that of China’s provinces and regions. Beijing: Scientific and Technical Documentation Press. (2019). 64–71.
10. Nuclear Threat Initiative (NTI), Johns Hopkins Center for Health Security at the Bloomberg School of Public Health, Economist Impact. Global health and security index. (2019). Available online at: https://www.ghsindex.org/ (Accessed 11 January, 2024).
11. HDR. Human Development Index. (1990). Available online at: https://hdr.undp.org/ (Accessed 11 January, 2024).
12. Zhang, X, Liu, J, Han, L, Zhang, X-X, Liu, J-s, Han, L-F, et al. One health: new evaluation framework launched. Nature. (2022) 604:625. doi: 10.1038/d41586-022-01108-0
13. Zhang, X, Liu, J, Han, L, Zhang, XX, Liu, JS, Han, LF, et al. Towards a global one health index: a potential assessment tool for one health performance. Infect Dis Poverty. (2022) 11:57. doi: 10.1186/s40249-022-00979-9
14. Bloomberg. Bloomberg world’s healthiest countries. (2019). Available online at: https://www.bloomberg.com/news/articles/2019-02-24/spain-tops-italy-as-world-s-healthiest-nation-while-u-s-slips#xj4y7vzkg (Accessed 11 January, 2024).
15. Fernandez-Crehuet, JM, Rosales-Salas, J, and Ramos, S. State of health in the European Union: a European health index. J Healthc Qual Res. (2019) 34:308–13. doi: 10.1016/j.jhqr.2019.07.001
16. Wang, J, Masters, WA, Bai, Y, Mozaffarian, D, Naumova, EN, and Singh, GM. The international diet-health index: a novel tool to evaluate diet quality for cardiometabolic health across countries. BMJ Glob Health. (2020) 5:e002120. doi: 10.1136/bmjgh-2019-002120
18. Stuttard, JP, and Davies, SC. The health index for England. Lancet. (2021) 397:665. doi: 10.1016/S0140-6736(21)00201-4
19. Health Index. England Health Index. (2020). Available online at: https://healthindex.lcp.com/ (Accessed 11 January, 2024).
Keywords: life-safety, health, life-safety disparity index, model, China, life-safety guarantee zone
Citation: Ge X, Wu D, Shi X, Zhang J, Jiang J, Zhang B and Wang H (2025) Life-safety disparity index: a comprehensive, valid, and reliable tool to assess Chinese people’s life-safety performance. Front. Public Health. 13:1476051. doi: 10.3389/fpubh.2025.1476051
Edited by:
Eman Leung, The Chinese University of Hong Kong, ChinaReviewed by:
Helena Carvalho, University Institute of Lisbon (ISCTE), PortugalValentin Marian Antohi, Dunarea de Jos University, Romania
Mehmet Özkeskin, Ege University, Türkiye
Copyright © 2025 Ge, Wu, Shi, Zhang, Jiang, Zhang and Wang. This is an open-access article distributed under the terms of the Creative Commons Attribution License (CC BY). The use, distribution or reproduction in other forums is permitted, provided the original author(s) and the copyright owner(s) are credited and that the original publication in this journal is cited, in accordance with accepted academic practice. No use, distribution or reproduction is permitted which does not comply with these terms.
*Correspondence: Hongguang Wang, d2FuZ2hvbmdndWFuZ0BuaWJzLmFjLmNu