 Huanhuan Huang
 Siqi Jiang1,2
 Xinyu Yu
 Qinghua Zhao
- 1Department of Nursing, The First Affiliated Hospital of Chongqing Medical University, Chongqing, China
- 2Nursing Research Center, The First Affiliated Hospital of Chongqing Medical University, Chongqing, China
- 3Department of orthopedics, The First Affiliated Hospital of Chongqing Medical University, Chongqing, China
Background: Sarcopenia leads to substantial health and well-being impairments in older adults, underscoring the need for early detection to facilitate intervention. Despite its importance, community settings face challenges with data accessibility, model interpretability, and predictive accuracy.
Objective: To develop a local, data-driven, machine learning-based predictive model aimed at identifying high-risk sarcopenia populations among community-dwelling older adults.
Methods: The study encompassed 910 participants over 60 years old from the National Basic Public Health Services (NBPHS) program. Sarcopenia was ascertained by the Asian Working Group for Sarcopenia (AWGS) criteria. We leveraged Logistic Regression and seven additional machine learning models for risk prediction, employing the LASSO method for feature selection, employing LASSO regression with 10-fold cross-validation for feature selection. The optimal lambda.1se threshold identified four key predictors forming the w-ACT model (weight, Age, Calf circumference, Triglycerides). A comprehensive set of 10 diagnostic indicators was utilized to assess model performance.
Results: The Random Forest-based w-ACT model demonstrated superior performance, with an AUC of 0.872 (95%CI: 0.793,0.950) (validation set) and MCC of 0.566, 0.841 (95%CI: 0.777,0.904) (test set) and MCC of 0.511. Key predictors included weight, age, calf circumference, and triglycerides. SHAP analysis confirmed clinical interpretability.
Conclusion: The w-ACT model offers a reliable, interpretable tool for community-based sarcopenia screening, leveraging accessible variables to guide preventive care.
1 Introduction
Sarcopenia, characterized by the progressive loss of muscle mass, strength, and function, is a prevalent condition among older adults (1). Its prevalence ranges from 10 to 27% in individuals aged over 60 years (2). The impact of sarcopenia on older adults is multifaceted, encompassing various dimensions of health and well-being. Research has demonstrated that sarcopenia is correlated with functional impairment, physical disability, and an elevated susceptibility to adverse health-related outcomes (3). Furthermore, as the largest metabolic organ of the human body, the dysfunction of skeletal muscle is also associated with the increased risk of osteoporosis (4), diabetes metabolism (5), cardiovascular diseases (6), and other chronic diseases, which ultimately leads to the decease of physical activity, and limitations in health-related quality of life (7). Given the detrimental impact of sarcopenia, multiple consensus underscores the significance of early detection, intervention, and management strategies (8, 9).
In recent years, propelled by advancements in machine learning and artificial intelligence, researchers have employed statistical or machine learning models to forecast specific health-related outcomes (10). These models have the capacity to analyze complex healthcare data and provide valuable insights for disease risk, treatment response, or healthcare resource utilization (11). The prediction of sarcopenia has been a subject of extensive research, with various models and tools being developed to identify and predict the risk of sarcopenia in different patient populations. For instance, Shin et al. developed a predictive model for sarcopenia utilizing multiple biomarkers in community-dwelling older adults (12). Similarly, Xu et al. developed a multivariable model based on ultrasound imaging features of the gastrocnemius muscle to identify patients with sarcopenia (13). Several researchers developed and validated of a nomogram for predicting sarcopenia in community-dwelling older adults (14, 15).
While current studies collectively support the feasibility of using physiological, biochemical, and imaging indicators to predict sarcopenia, existing sarcopenia prediction models face critical limitations in community settings. One of the primary limitations is the availability of data. The development of predictive models typically requires a large amount of clinical data. However, compared to hospital settings, there may be difficulties in obtaining older adult patients’ information and test results in community setting. Thus, the reliance on specific modalities such as ultrasound and serum biomarkers for risk stratification may pose limitations in terms of accessibility and standardization (16, 17). Another critical limitation is the transferability of model. Current evidence emphasizes specific population groups, such as cancers patients (18) and chronic patients (19–21), which may hinder the widespread application of community screening of certain prediction models, necessitating the development of cost-effective, universal screening methods. Additionally, the lack of data from China using precise assessments for sarcopenia, such as skeletal muscle area or skeletal muscle mass index, underscores the need for more comprehensive and standardized diagnostic criteria. Thus, this highlights the importance of highly actionable, wide applicability, and well-performance insights in the implementation of prediction models in sarcopenia.
China’s National Basic Public Health Services (NBPHS) program, launched in 2009 by the Chinese government, is a nationwide healthcare initiative designed to enhance population health by delivering essential preventive and primary care services (22). A key component of the program is annual health examinations for adults aged 60 and above, conducted at local community health centers (23). The NBPHS dataset offers several unique advantages. Firstly, unlike hospital-based datasets, NBPHS captures community-dwelling older adults without selection bias (e.g., excluding those with severe comorbidities). Secondly, prior studies relied on niche biomarkers (e.g., serum leptin) or imaging (e.g., CT) that are impractical for community screening. NBPHS data bridge this gap by using accessible, low-cost variables scalable to resource-limited settings. More importantly, the program’s nationwide infrastructure and standardized protocols ensure that any risk models developed from these data can be immediately integrated into existing community health workflows.
In this study, we developed and validated a machine learning model (w-ACT: weight, Age, Calf circumference, Triglycerides) using routinely collected NBPHS variables to predict sarcopenia risk among community-dwelling older adults. Through comparative analysis of eight algorithms, our Random Forest-based model achieved superior performance while maintaining clinical interpretability. The final w-ACT model incorporates four readily accessible predictors—weight, Age, Calf circumference, and Triglycerides—addressing critical gaps in community screening through three key innovations: (1) replacing specialized biomarkers with routine examination metrics, (2) demonstrating cross-regional generalizability through external validation, and (3) providing transparent risk stratification. This approach establishes a practical framework for integrating sarcopenia risk assessment into China’s primary care system while maintaining diagnostic accuracy comparable to resource-intensive methods.
2 Materials and methods
2.1 Study design
This study follows the Declaration of Helsinki and has been approved by the Ethics Committee of Chongqing Medical University (Approval number: 2022-125), written consent was obtained each participant. This study adheres to the Transparent Reporting of a Multivariable Prediction Model for Individual Prognosis or Diagnosis (TRIPOD) reporting guidelines (24). The flowchart of the methodology was shown in Figure 1.
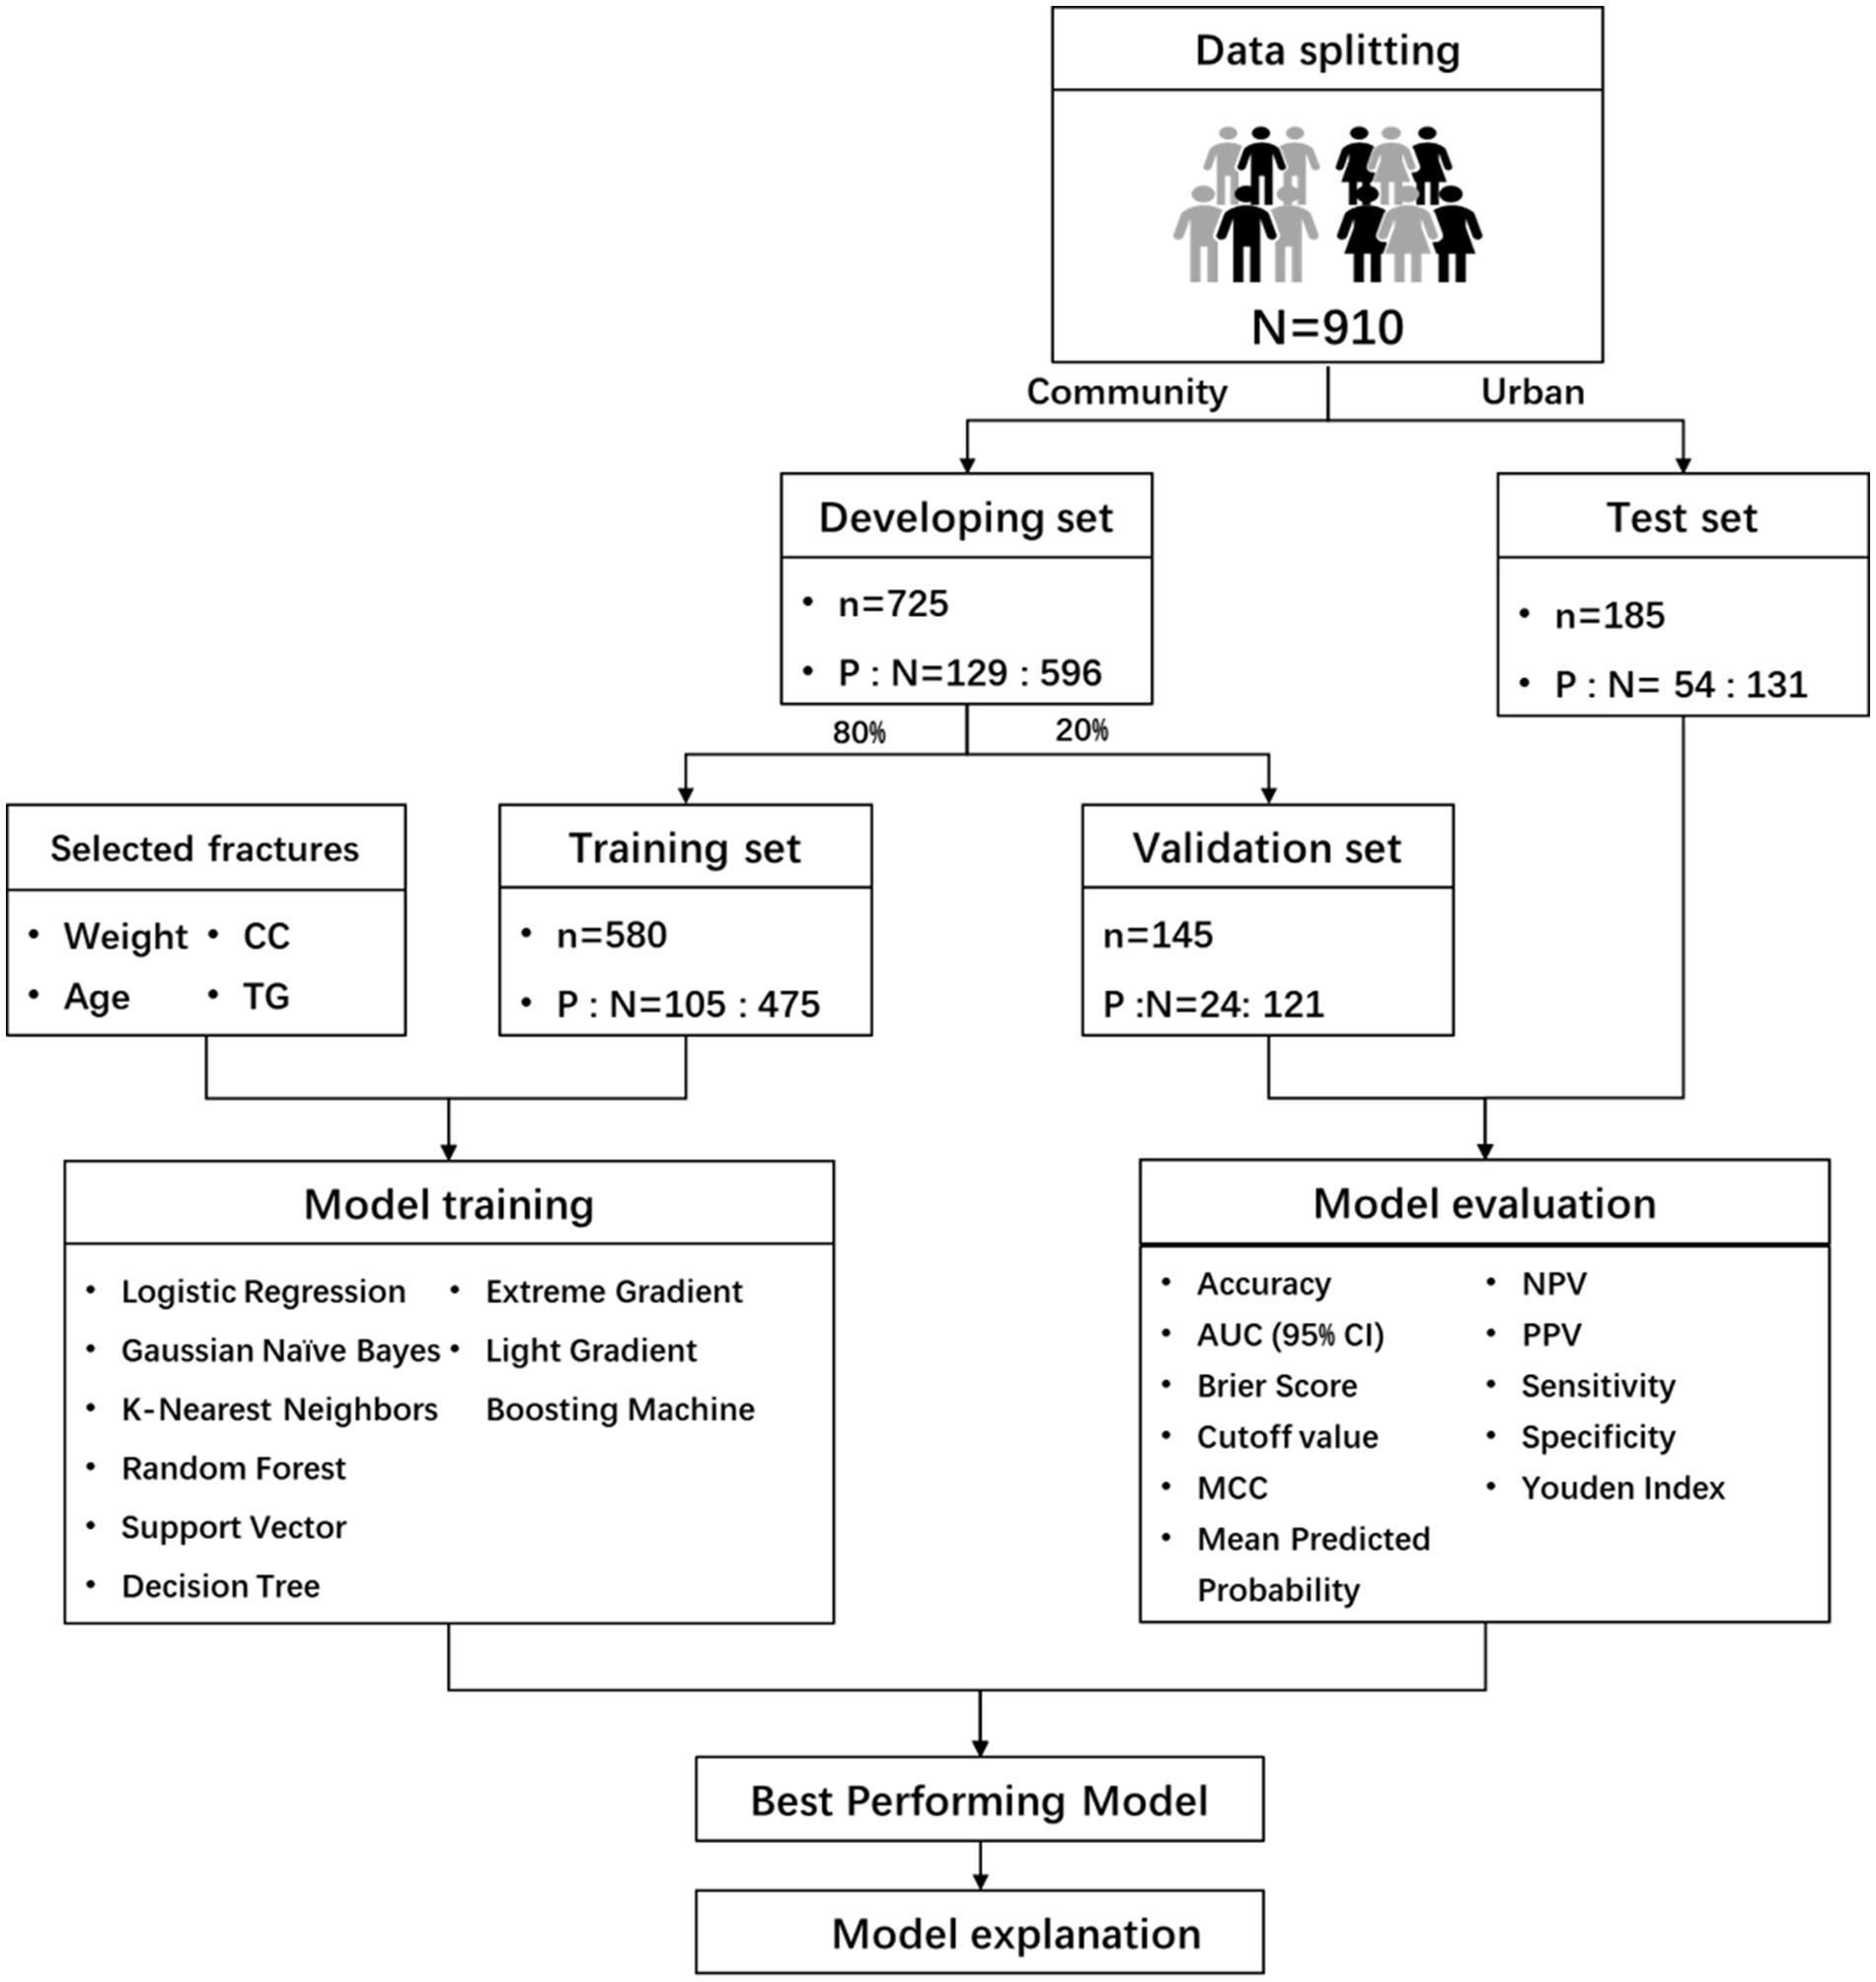
Figure 1. Flowchart summary of study methodology.
2.2 Participants and data sources
2.2.1 Inclusion and exclusion criteria
Inclusion criteria for the study were: participation in the NBPHS program, age over 60 years, and voluntary participation with informed consent. Exclusion criteria include: contraindications for Bioelectrical Impedance Analysis (BIA) such as pacemakers or artificial joints; presence of clinically visible edema or use of diuretics affecting BIA; severe cognitive impairment (Minimum Mental State Examination score ≤ 10); severe disability (Activities of Daily Living scale score ≤ 40); patients in the terminal or acute phase of illness; and patients with muscle and nerve diseases such as genetic muscular dystrophy, mitochondrial diseases, myalgia, and myopathy.
2.2.2 Sample size
To develop a robust prediction model, we followed four-step sample size calculation (25). Considering a binary outcome model, we set an acceptable difference of 0.05 in R2 and a margin of error of 0.05 for intercept estimation. With a primary outcome measure proportion of 0.175 from our previous study, 22 predictor variables, an expected shrinkage factor ≤10%, a C-statistic of 0.939 (26), and a Cox & Snell R2 of 0.382, we calculated a minimum sample size of 565 participants for model development, equating to 99 events and 4.49 events per predictor.
2.2.3 Outcome variable
Outcome of interest was sarcopenia (0 = non-sarcopenic group, 1 = sarcopenic group) and assessed by Asian Working Group for Sarcopenia (AWGS) in 2019 (1).
2.3 Data sources
2.3.1 Setting
Participants were recruited from four community health centers in Chongqing and one rural center from May to October 2023.
2.3.2 Data collection
According to the third edition of the NBPHS guidelines (27), this study includes four categories: general background information, lifestyle and health assessment, physical examination, and auxiliary examinations, totaling 59 predictive indicators.
2.4 Data preprocessing and features selecting
For model development, community dataset data were split 8:2 for training and internal validation using the caret package. County data were used for external validation. To handle missing values, multiple imputation was used instead of direct exclusion to prevent bias and loss of statistical power. Features with over 30% missing values were removed (28, 29). Data was normalized using Z-score transformation, and random oversampling addressed class imbalance, referring to previous research (30). The LASSO method with a 10-fold cross-validation was used to select features. No participants were excluded due to missing data; multiple imputation allowed full utilization of all available records while minimizing bias.
2.5 Model developing, evaluating and explaining
For model development, we followed guidelines for biomedical machine learning prediction models (31) and used Logistic Regression and seven ML models with the Tidymodels package. Models were validated with internal and external datasets. Discrimination was assessed using 10 indicators. Scores ranged from 1 to 8, with higher scores indicating better performance, except for the Brier Score. The overall model performance score was calculated by summing individual scores. Unlike accuracy or F1-score, Matthews Correlation Coefficient (MCC) accounts for all four confusion matrix categories (TP, TN, FP, FN), making it particularly informative for binary classification with imbalanced classes (32). Thus, MCC was selected as the primary comparison metric. This method has been reported in previous studies (33, 34).
The best-performing model was analyzed using SHAP (SHapley Additive exPlanations) values to quantify and visualize feature importance, including the directionality and magnitude of each predictor’s effect on sarcopenia risk (35), supplemented by the iBreakDown package for perturbation-based validation (36).
2.6 Statistical analysis
For continuous variables with normal distribution, mean and SD are reported; for skewed data, mean and IQR are used. Independent t-tests compare continuous variables, while chi-square or Fisher’s exact tests compare categorical variables between participants with and without sarcopenia. Analyses were done using R software version 4.0.2, with significance at p < 0.05.
3 Results
3.1 Participants characteristics
A total of 1,000 older adult individuals were initially screened. After excluding 15 participants with incomplete data, 53 with missing diagnostic data, and 22 with BIA contraindications, our final analytical sample comprised 910 participants. The cohort’s mean age was 71.76 ± 5.67 years, with 44.2% being male. Sarcopenia prevalence was 20.1% (183 cases). Complete demographic characteristics stratified by sarcopenia status are presented in Table 1, while detailed demographic and clinical characteristics for each subset provided in Supplementary Table S1 (training), Supplementary Table S2 (validation), and Supplementary Table S3 (test).
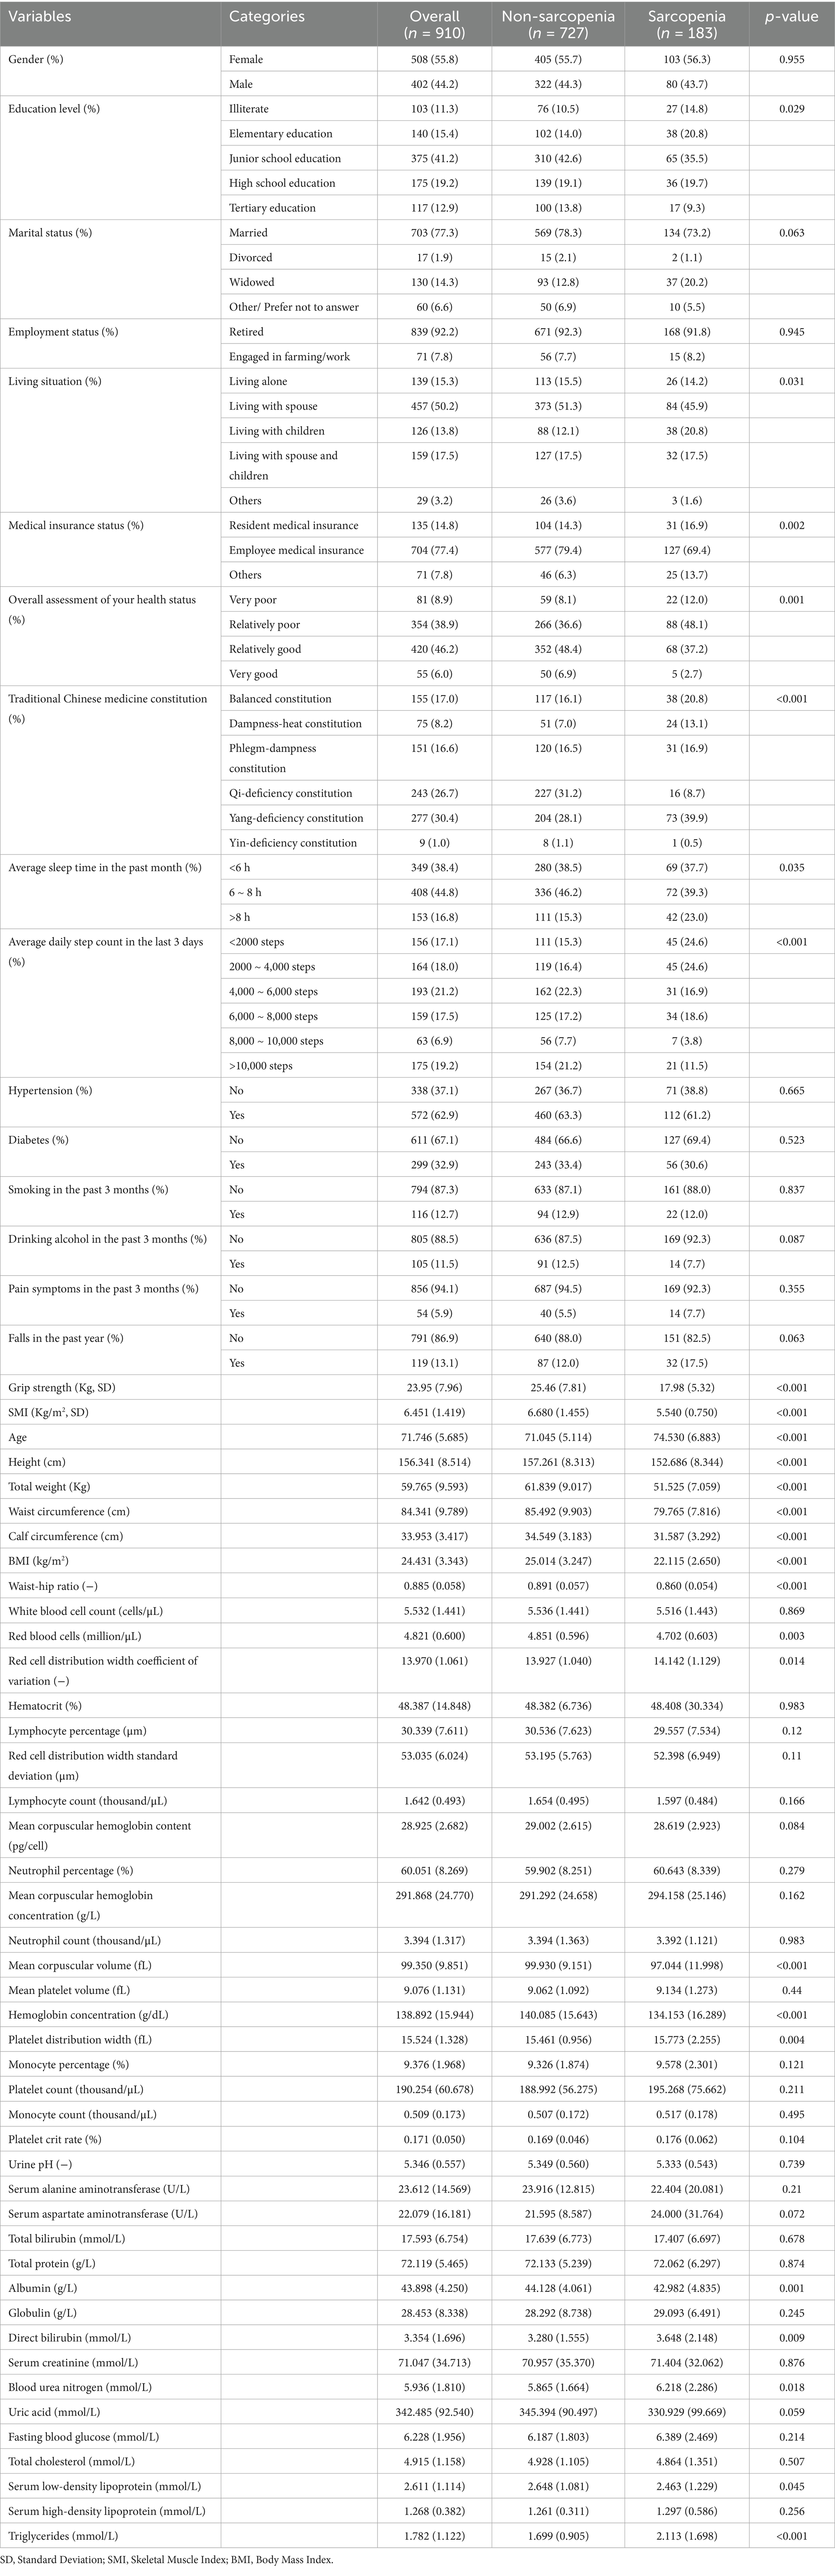
Table 1. Demographic and clinical characteristics of full participants (n = 910).
3.2 Features selecting
The Lasso regression with 10-fold cross-validation was trained using distinct features from sarcopenic and non-sarcopenic groups, as shown in Figure 2. The optimal lambda.1se threshold was applied for model selection, yielding four significant predictors: weight, age, calf circumference, and triglycerides.
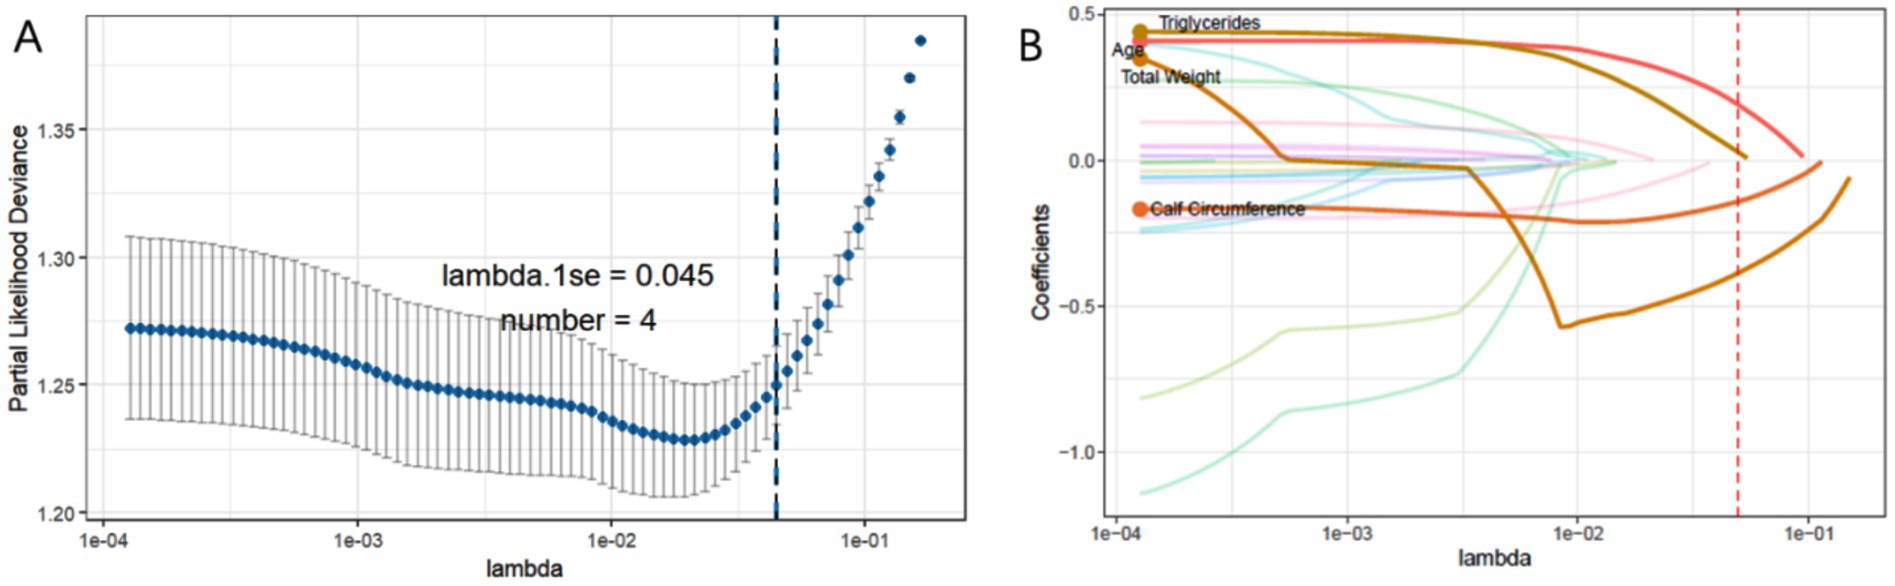
Figure 2. (A) The process of selecting the most suitable λ through 10-fold cross-validation in the Lasso model. (B) LASSO coefficient profiles.
3.3 Model developing and performance evaluating
In the model’s comprehensive scoring system, the Random Forest (RF) showed the best predictive performance in internal validation, with a score of 61 (Figure 3A; Table 2), followed by Logistic Regression (LR) with 57 and Gradient Boosting Machine (GBM) with 54. In the external validation set, the top scores were for RF (64), Extreme Gradient Boosting (XGB) (63), and Gaussian Naïve Bayes (GNB) (37) (Figure 3B; Table 3). Model comparison through ROC curve analysis was shown in Supplementary Figures S1, S2.
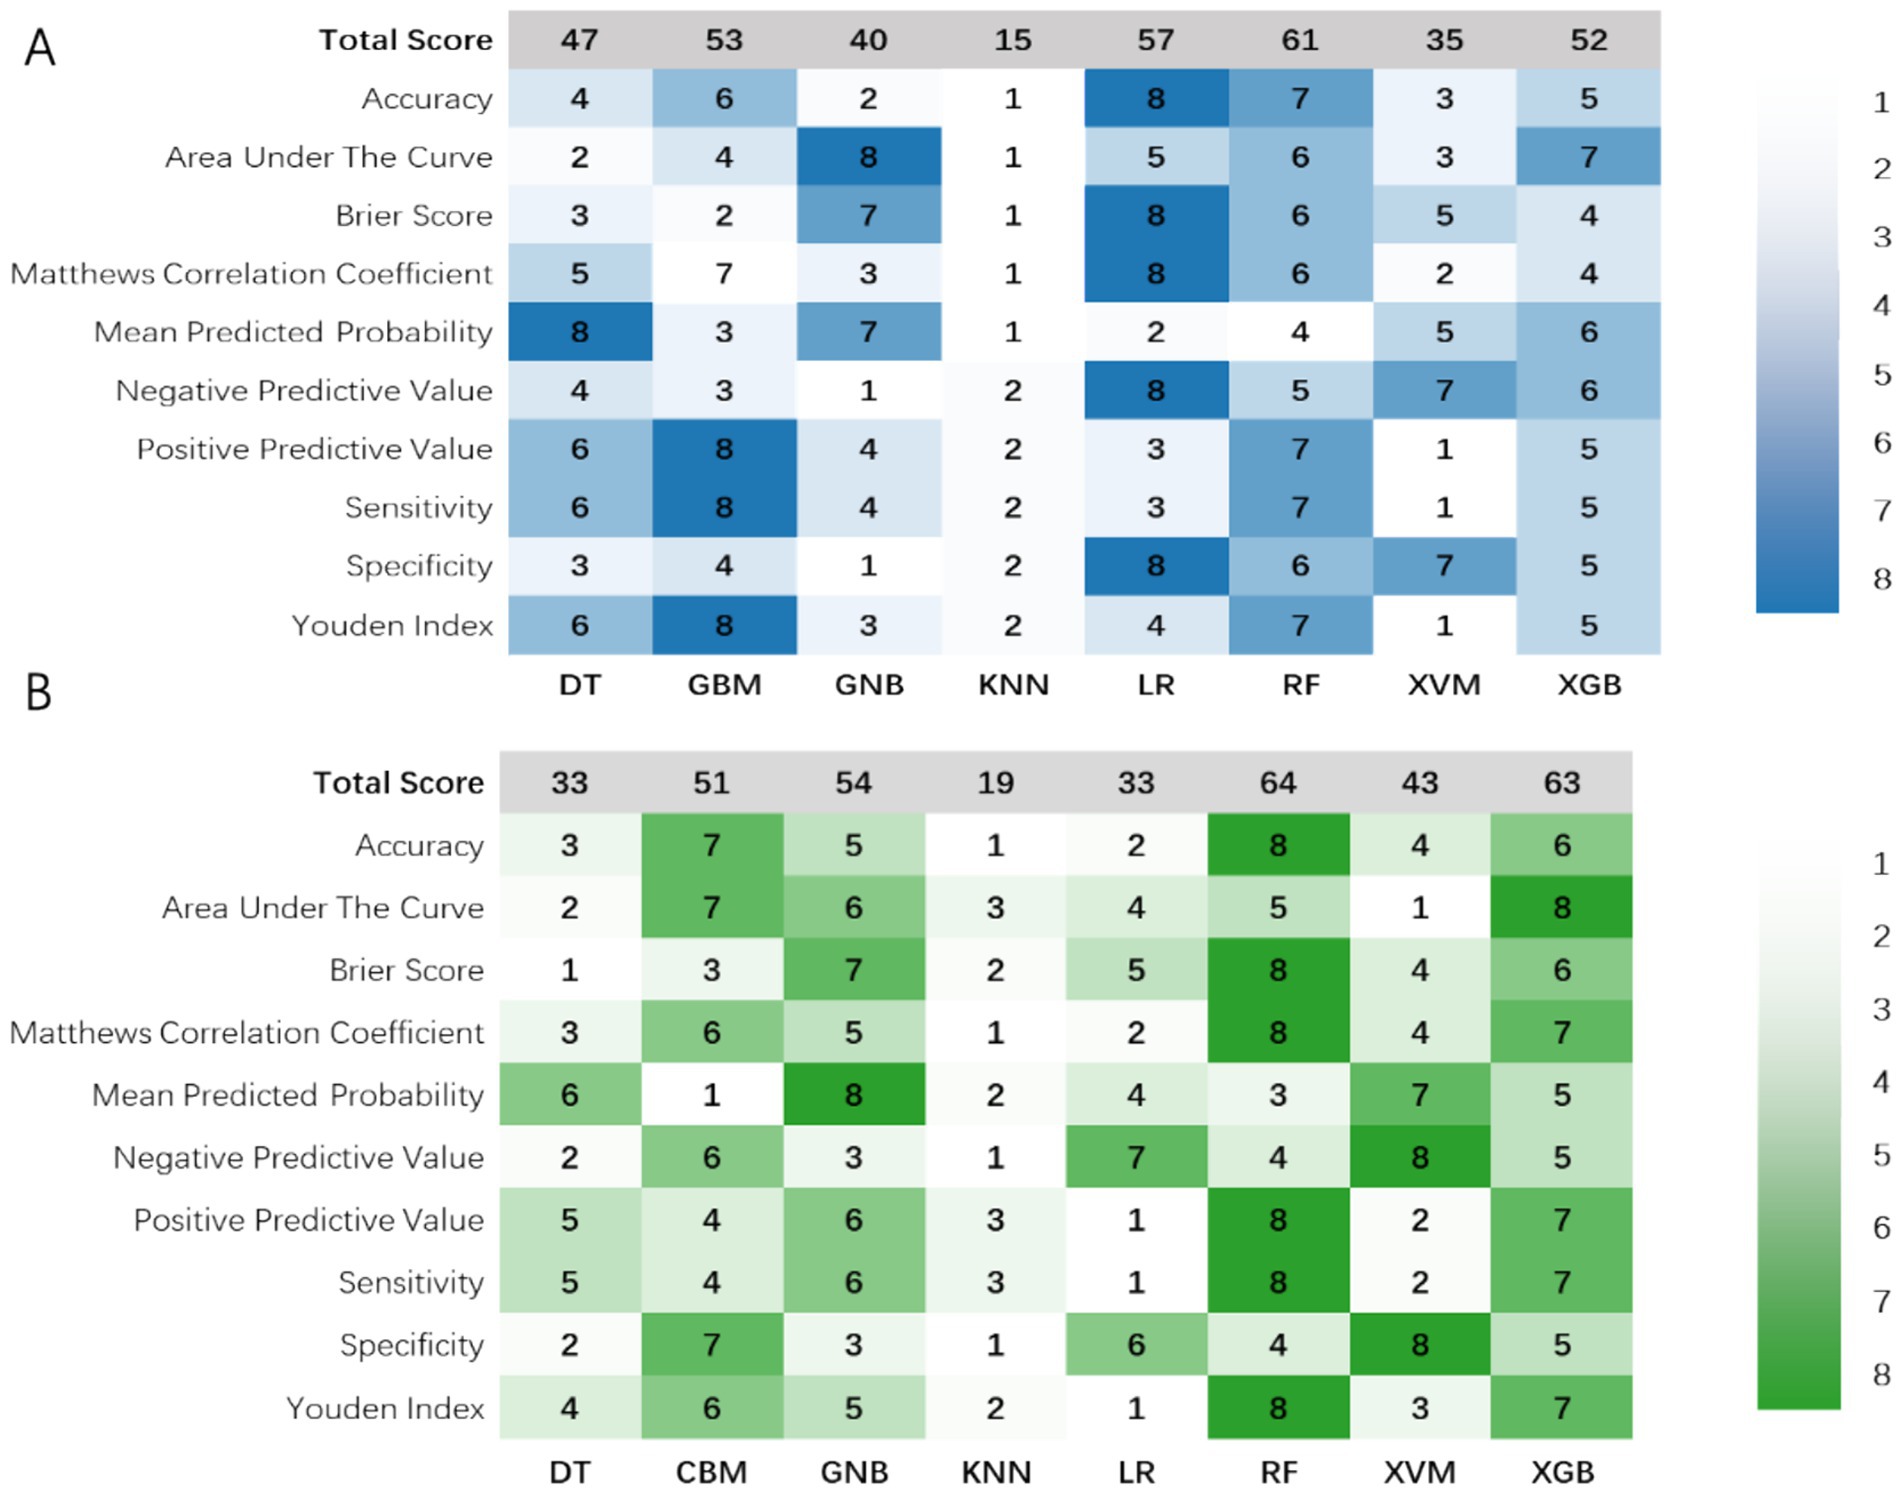
Figure 3. Visualization of the 10 prediction measures using a heat map in the (A) internal validation set and (B) external validation set after evaluation using a scoring system. DT, Decision Tree; GNB, Gaussian Naïve Bayes; GBM, Light Gradient Boosting Machine; KNN, K-Nearest Neighbors; LR, Logistic Regression; RF, Random Forest; SVM, Support Vector Machine; XGB, Extreme Gradient Boosting.
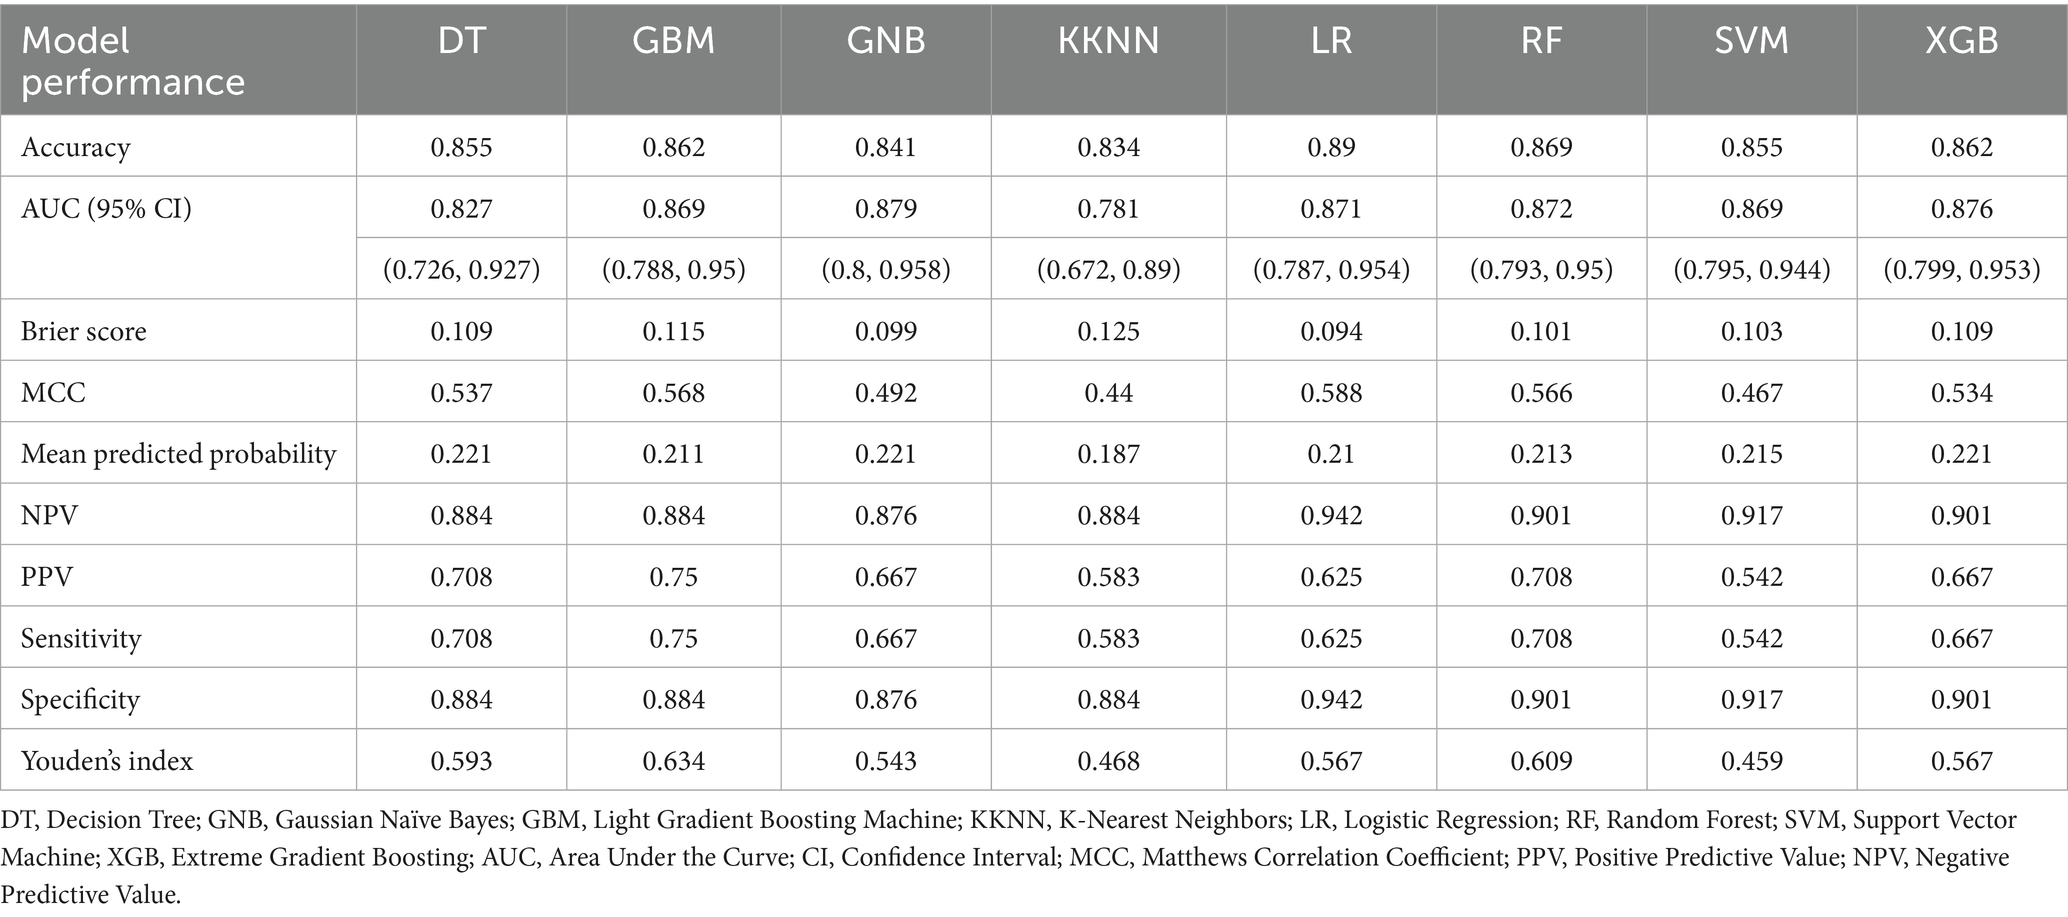
Table 2. The 10 diagnostic parameters of the eight algorithms in validation set.
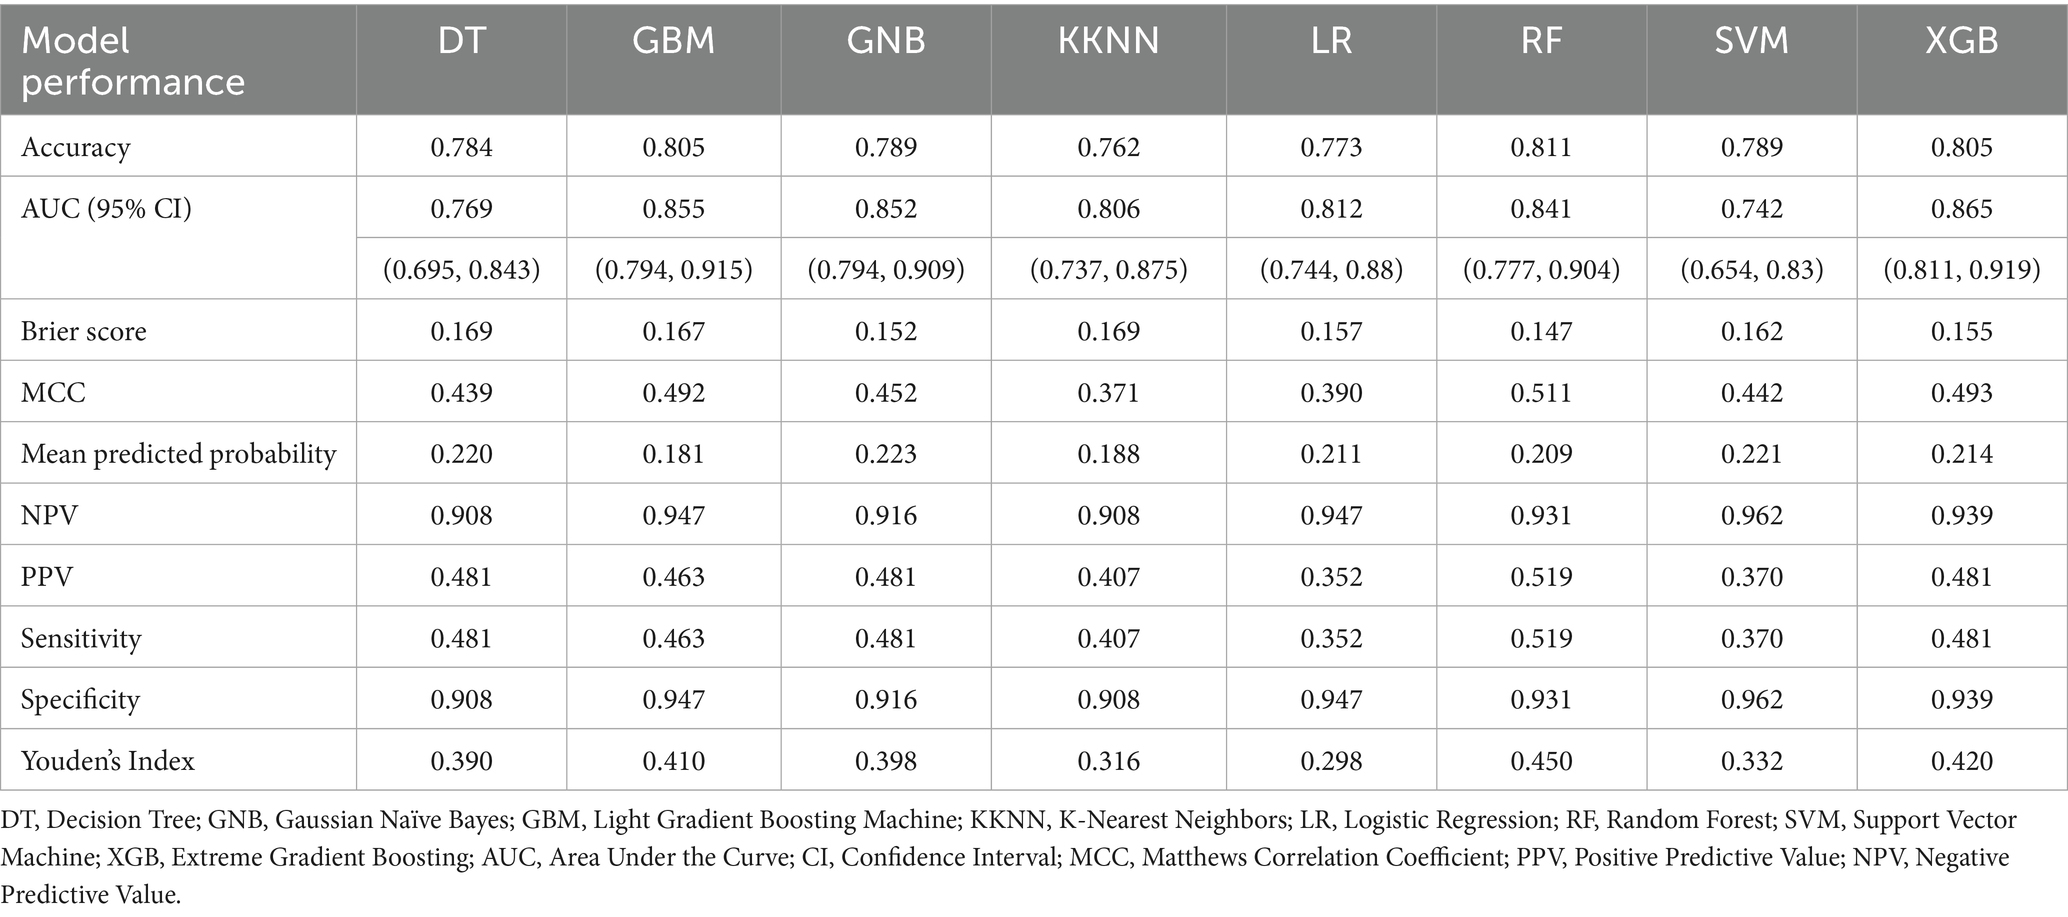
Table 3. The 10 diagnostic parameters of the eight algorithms in test set.
RF and XGB both demonstrated good performance across both datasets, with RF being particularly outstanding in both internal and external validations, making it a top choice as the primary model. LR performs well with linearly separable problems but needs improvement in its generalization to external datasets. Thus, it is considered best to use RF as the baseline model due to its reliable performance and strong generalization capabilities across various datasets. The RF-based predictive model has been set as the optimal model and is named the w-ACT model after the initial letters of the risk factors.
3.4 Model explaining
In the internal validation set, SHAP analysis and permutation importance scoring revealed the hierarchical contribution of w-ACT model features (Figure 4). Weight emerged as the strongest predictor, followed by Age and Triglycerides, with Calf Circumference showing relatively lower but still meaningful contribution. The consistency between SHAP values (directionality) and permutation importance (magnitude) confirmed the model’s clinical plausibility.
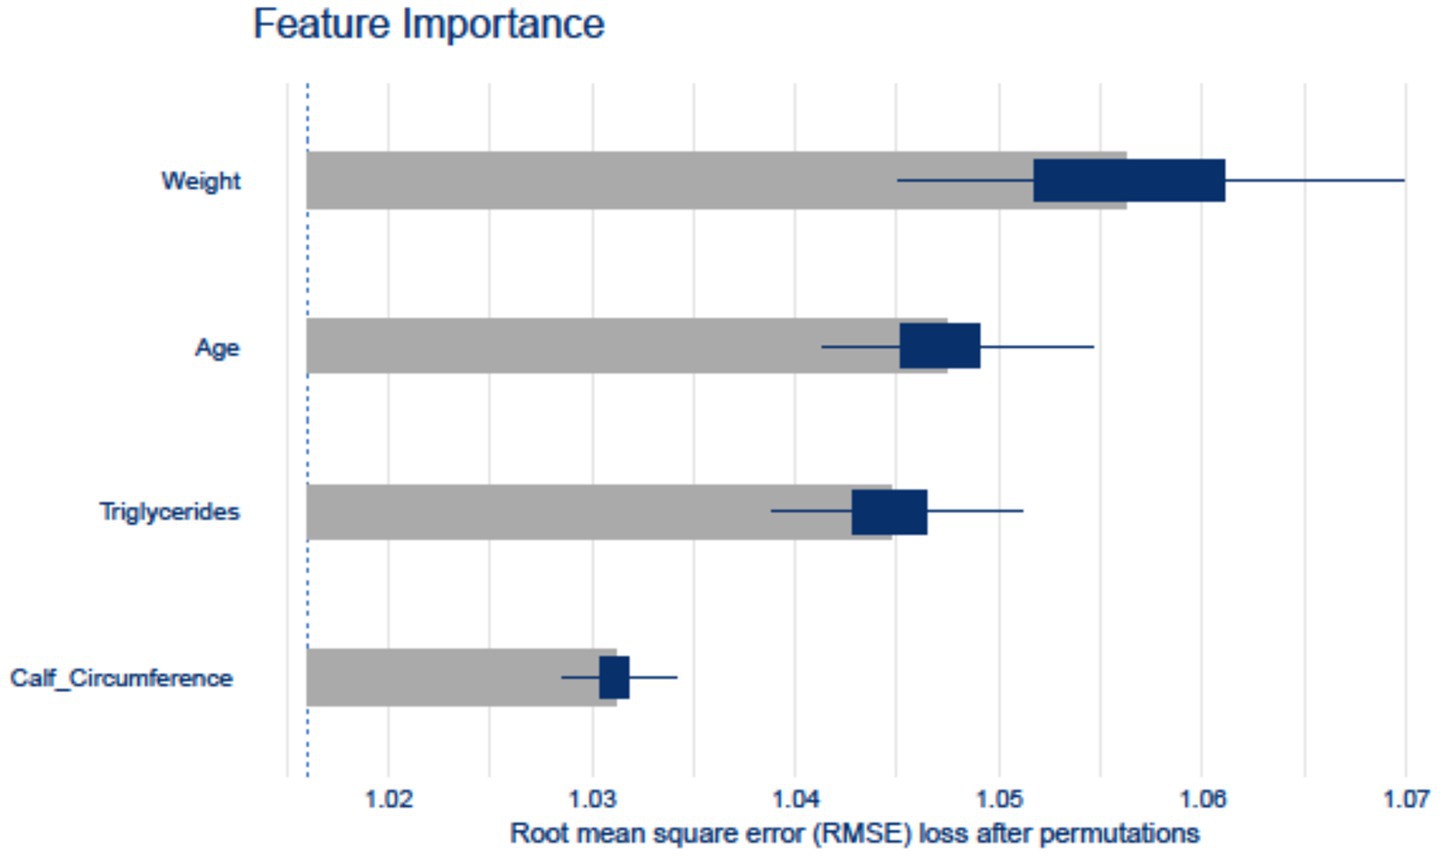
Figure 4. Feature importance computed by the Random Forest model. The horizontal axis represents various features, while the vertical axis represents their respective importance scores.
4 Discussion
Recent research has sought to develop risk prediction models for sarcopenia in community-dwelling older adult populations, facing challenges in data accessibility, interpretability, and predictive accuracy. To address these issues, we utilized local data from the NBPHS program and applied advanced machine learning techniques to create the w-ACT model. Our findings demonstrate that the w-ACT model outperformed traditional LR and other common ML models in both internal and external validations, highlighting its potential to improve the identification of at-risk older adult populations and inform preventive interventions.
We identified a sarcopenia prevalence of approximately 20.11% among community-dwelling older adults in Chongqing, which is notably higher than rates reported in other regions of China utilizing the AWGS 2019 diagnostic criteria—ranging from 14.62% on the Yunnan-Guizhou Plateau to 13.47% in Tianjin (38) and 10.29 to 13.47% in Shanghai (39, 40). The observed discrepancies may be attributed to regional demographic variations. Chongqing, a typical mountainous city with a severe aging population, has an aging rate of 21.87% according to the results of the seventh national census, ranking fifth nationwide and first in the western region (41). In additional, it may be also contributed by the complex interplay of lifestyle and dietary norms characteristic of Chongqing’s residents (42). A pervasive pattern of high oil and salt intake, common among the city’s inhabitants, may be contributing to this disparity. Moreover, nutritional surveys indicate that over 50.5% of the middle-aged and older adult population are overweight or obese. Future research should explore these factors to develop targeted interventions that preserve muscle health and improve the well-being of the aging population.
The w-ACT tool’s design prioritizes immediate clinical utility through three key characteristics. Firstly, seamless integration with existing workflows. The selected indicators (age, weight, CC, TG) are routinely collected in NBPHS service projects, which promote equal access to public health services. The four risk factors—age, weight, CC, and TG—are readily obtainable across various older adult care settings. This allows direct implementation without requiring additional tests or equipment.
Secondly, these risk factors provide significant interpretability. The model’s clinical adoption potential stems from its deliberate avoidance of computationally significant but clinically obscure features - a common criticism of ML healthcare applications. Our four predictors were selected not only for statistical contribution but for their established clinical meaning and measurability in resource-limited settings Consistent with existing guidelines, age, low weight, and CC are established risk factors for sarcopenia, and their non-invasive measurement methods facilitate assessment in diverse settings (1). Notably, CC serves as an index of free fat muscle mass (FFM) and has been recognized by the WHO as a sensitive indicator of muscle mass in older adults (43). Our study also identified triglycerides as a potential risk factor, aligning with previous research (44–46). Researches has established a bidirectional causal relationship between triglycerides and sarcopenia, particularly regarding muscle quality (47, 48). Although the specific mechanisms remain incompletely understood, theories such as the “cycle metabolism theory” suggest that elevated blood lipid levels may contribute to fat accumulation in skeletal muscle, ultimately leading to mitochondrial dysfunction and insulin resistance (49). Thus, the inclusion of these four risk factors enhances both the credibility of the model and facilitates clinical practitioners’ understanding of its predictive foundation.
Thirdly, Despite the advantages of machine learning algorithms, the comparative performance of ML versus traditional LR remains debated (50). While some studies suggest that ML does not consistently outperform LR (51, 52), aligning with the majority of literature (37, 51, 53), our findings indicate superior predictive performance of the ML, especially RF algorithm, which emerged as the top performer among the models assessed. The observed differences may stem from prior research primarily focusing on singular predictive metrics, without considering a comprehensive range of evaluation metrics. Notably, the RF algorithm is praised for its resistance to overfitting, adaptability to categorical variables, accuracy in error rate estimation, and capability of ranking variables by relative importance. These characteristics have led to its successful application in stoke (54), cancer (55), and postoperative functional (56) prediction. Thus, our findings furnish additional evidence for the application of the RF algorithm in risk prediction and serve as a reference for peers in evaluating model performance and selecting algorithms.
Some limitations should be mentioned. First, the cross-sectional NBPHS design precludes causal inference, though we mitigated this via instrumental variable analysis (57). To definitively address these limitations, we will launch the Chongqing Aging and Sarcopenia Evaluation (CHASE) cohort. This prospective study is specifically designed to document predictor trajectories preceding sarcopenia onset and validate dynamic predictions. Second, although internal-external validation was conducted, demonstrating the same level of reliability, the external validation sample size (n = 182) may limit the assessment of overfitting risks, particularly given the model’s complexity. While our permutation-based feature importance analysis (Figure 4) shows biologically plausible weightings, the possibility of overfitting to specific subpopulations cannot be entirely excluded. Additionally, dealing with imbalanced data is a challenging issue in both deep learning models and traditional models for practical classification problems (58). While oversampling improved model training, its theoretical impact on population prevalence estimates cannot be fully excluded - though our external validation using original unbalanced data suggests robust generalizability. Third, while our model demonstrated consistent performance across internal and external sets, its generalizability to populations with different ethnic compositions or healthcare systems requires further validation, particularly given regional variations in sarcopenia prevalence and risk factors. Normalization assumptions may not perfectly fit all variables, but this approach represents the most widely accepted compromise for mixed-type clinical data (59, 60).
5 Conclusion
This study developed a ML-based predictive model to identify early-stage high-risk individuals for sarcopenia among older adult residents in the community. Weight, triglycerides, age, and calf circumference were identified as significant factors associated with sarcopenia, and RF exhibited superior predictive performance in eight approaches. The interpretability of this model (termed w-ACT model) was achieved using SHAP values, providing valuable insights into the contributions of these variables to sarcopenia risk.
Data availability statement
The raw data supporting the conclusions of this article will be made available by the authors, upon reasonable request.
Ethics statement
The studies involving humans were approved by the Medical Ethics Committee of The First Affiliated Hospital of Chongqing Medical University (No. 2022-125). The studies were conducted in accordance with the local legislation and institutional requirements. The participants provided their written informed consent to participate in this study.
Author contributions
HH: Conceptualization, Data curation, Formal analysis, Methodology, Resources, Software, Supervision, Visualization, Writing – original draft, Writing – review & editing. SJ: Data curation, Formal analysis, Investigation, Writing – original draft, Writing – review & editing. ZC: Conceptualization, Methodology, Project administration, Software, Supervision, Validation, Writing – original draft, Writing – review & editing. XY: Data curation, Formal analysis, Investigation, Methodology, Writing – original draft, Writing – review & editing. KR: Writing – original draft, Writing – review & editing, Data curation. QZ: Conceptualization, Project administration, Resources, Supervision, Validation, Writing – original draft, Writing – review & editing.
Funding
The author(s) declare that financial support was received for the research and/or publication of this article. This study was jointly funded by the Doctoral Program of Social Science Planning Program of Chongqing (NO. 2024BS055) and the 2024 hospital-level Postgraduate Teaching Reform Program of the First Clinical College of Chongqing Medical University (NO. CYYY-YJSJGXM-202402).
Acknowledgments
The authors would like to thank all the participants who contributed their time to the study.
Conflict of interest
The authors declare that the research was conducted in the absence of any commercial or financial relationships that could be construed as a potential conflict of interest.
Generative AI statement
The author(s) declare that no Gen AI was used in the creation of this manuscript.
Publisher’s note
All claims expressed in this article are solely those of the authors and do not necessarily represent those of their affiliated organizations, or those of the publisher, the editors and the reviewers. Any product that may be evaluated in this article, or claim that may be made by its manufacturer, is not guaranteed or endorsed by the publisher.
Supplementary material
The Supplementary material for this article can be found online at: https://www.frontiersin.org/articles/10.3389/fpubh.2025.1522903/full#supplementary-material
Abbreviations
NBPHS, National Basic Public Health Services; DT, Decision tree; GNB, Gaussian naïve Bayes; GBM, Light gradient boosting machine; KKNN, K-nearest neighbors; LR, Logistic regression; RF, Random forest; SVM, Support vector machine; XGB, Extreme gradient boosting; AUC, Area under the curve; CI, Confidence interval; MCC, Matthews correlation coefficient; PPV, Positive predictive value; NPV, Negative predictive value.
References
1. Chen, L-K, Woo, J, Assantachai, P, Auyeung, T-W, Chou, M-Y, Iijima, K, et al. Asian working Group for Sarcopenia: 2019 consensus update on sarcopenia diagnosis and treatment. J Am Med Dir Assoc. (2020) 21:300–307.e2. doi: 10.1016/j.jamda.2019.12.012
2. Petermann-Rocha, F, Balntzi, V, Gray, SR, Lara, J, Ho, FK, Pell, JP, et al. Global prevalence of sarcopenia and severe sarcopenia: a systematic review and meta-analysis. J Cachexia Sarcopenia Muscle. (2022) 13:86–99. doi: 10.1002/jcsm.12783
3. Xia, L, Zhao, R, Wan, Q, Wu, Y, Zhou, Y, Wang, Y, et al. Sarcopenia and adverse health-related outcomes: an umbrella review of meta-analyses of observational studies. Cancer Med. (2020) 9:7964–78. doi: 10.1002/cam4.3428
4. Petermann-Rocha, F, Ferguson, LD, Gray, SR, Rodríguez-Gómez, I, Sattar, N, Siebert, S, et al. Association of sarcopenia with incident osteoporosis: a prospective study of 168, 682 UK biobank participants. J Cachexia Sarcopenia Muscle. (2021) 12:1179–88. doi: 10.1002/jcsm.12757
5. Mesinovic, J, Zengin, A, De Courten, B, Ebeling, PR, and Scott, D. Sarcopenia and type 2 diabetes mellitus: a bidirectional relationship. Diabetes Metab Syndr Obes. (2019) 12:1057–72. doi: 10.2147/DMSO.S186600
6. Xia, M-F, Chen, L-Y, Wu, L, Ma, H, Li, X-M, Li, Q, et al. Sarcopenia, sarcopenic overweight/obesity and risk of cardiovascular disease and cardiac arrhythmia: a cross-sectional study. Clin Nutr. (2021) 40:571–80. doi: 10.1016/j.clnu.2020.06.003
7. Zhang, H-W, Tsai, Z-R, Chen, K-T, Hsu, S-L, Kuo, Y-J, Lin, Y-C, et al. Enhanced risk of osteoporotic fracture in patients with sarcopenia: a National Population-Based Study in Taiwan. J Pers Med. (2022) 12:791. doi: 10.3390/jpm12050791
8. Cruz-Jentoft, AJ, Bahat, G, Bauer, J, Boirie, Y, Bruyère, O, Cederholm, T, et al. Sarcopenia: revised European consensus on definition and diagnosis. Age Ageing. (2019) 48:601. doi: 10.1093/ageing/afz046
9. Chumlea, WMC, Cesari, M, Evans, WJ, Ferrucci, L, Fielding, RA, Pahor, M, et al. International working group on sarcopenia. J Nutr Health Aging. (2011) 15:450–5. doi: 10.1007/s12603-011-0092-7
10. Dankers, FJWM, Traverso, A, Wee, L, and van Kuijk, SMJ. Prediction modeling methodology In: P Kubben, M Dumontier, and A Dekker, editors. Fundamentals of clinical data science. Cham: Springer International Publishing (2019). 101–20.
11. Purushotham, S, Meng, C, Che, Z, and Liu, Y. Benchmarking deep learning models on large healthcare datasets. J Biomed Inform. (2018) 83:112–34. doi: 10.1016/j.jbi.2018.04.007
12. Shin, HE, Won, CW, and Kim, M. Development of multiple biomarker panels for prediction of sarcopenia in community-dwelling older adults. Arch Gerontol Geriatr. (2023) 115:105115. doi: 10.1016/j.archger.2023.105115
13. Xu, X, Chen, Y, Cai, W, Huang, J, Yao, X, Zhao, Q, et al. A multivariable model based on ultrasound imaging features of gastrocnemius muscle to identify patients with sarcopenia. J Ultrasound Med. (2023) 42:2045–55. doi: 10.1002/jum.16223
14. Mo, Y-H, Su, Y-D, Dong, X, Zhong, J, Yang, C, Deng, W-Y, et al. Development and validation of a nomogram for predicting sarcopenia in community-dwelling older adults. J Am Med Dir Assoc. (2022) 23:715–721.e5. doi: 10.1016/j.jamda.2021.11.023
15. Huang, S-W, Long, H, Mao, Z-M, Xiao, X, Chen, A, Liao, X, et al. A nomogram for optimizing sarcopenia screening in community-dwelling older adults: AB3C model. J Am Med Dir Assoc. (2023) 24:497–503. doi: 10.1016/j.jamda.2023.02.001
16. Mueller, N, Murthy, S, Tainter, CR, Lee, J, Riddell, K, Fintelmann, FJ, et al. Can sarcopenia quantified by ultrasound of the rectus femoris muscle predict adverse outcome of surgical intensive care unit patients as well as frailty? A prospective, observational cohort study. Ann Surg. (2016) 264:1116–24. doi: 10.1097/SLA.0000000000001546
17. Yu, S, Chen, L, Zhang, Y, Wu, P, Wu, C, Lang, J, et al. A combined diagnostic approach based on serum biomarkers for sarcopenia in older patients with hip fracture. Australas J Ageing. (2022) 41:e339–47. doi: 10.1111/ajag.13064
18. Zhang, F-M, Chen, X-L, Wu, Q, Dong, W-X, Dong, Q-T, Shen, X, et al. Development and validation of nomograms for the prediction of low muscle mass and radiodensity in gastric cancer patients. Am J Clin Nutr. (2021) 113:348–58. doi: 10.1093/ajcn/nqaa305
19. Peng, H, Zhang, Q, Luo, L, Lei, S, Xiong, T, Long, L, et al. A prognostic model of acute-on-chronic liver failure based on sarcopenia. Hepatol Int. (2022) 16:964–72. doi: 10.1007/s12072-022-10363-2
20. Li, R, Lin, S, Tu, J, Chen, Y, Cheng, B, Mo, X, et al. Establishment and evaluation of a novel practical tool for the diagnosis of pre-sarcopenia in young people with diabetes mellitus. J Transl Med. (2023) 21:393. doi: 10.1186/s12967-023-04261-w
21. Ge, J, Zeng, J, Ma, H, Sun, S, Zhao, Z, Jing, Y, et al. A new index based on serum creatinine and cystatin C can predict the risks of sarcopenia, falls and fractures in old patients with low bone mineral density. Nutrients. (2022) 14:5020. doi: 10.3390/nu14235020
22. Xinhua. China increases subsidies for basic public health services. (2021). Available online at: https://english.www.gov.cn/statecouncil/ministries/202107/14/content_WS60ee9948c6d0df57f98dcdb4.html (Accessed November 10, 2023).
23. Qin, J, Zhang, Y, Fridman, M, Sweeny, K, Zhang, L, Lin, C, et al. The role of the basic public health service program in the control of hypertension in China: results from a cross-sectional health service interview survey. PLoS One. (2021) 16:e0217185. doi: 10.1371/journal.pone.0217185
24. Collins, GS, Reitsma, JB, Altman, DG, and Moons, KGM. Transparent reporting of a multivariable prediction model for individual prognosis or diagnosis (TRIPOD): the TRIPOD statement. Diabet Med. (2015) 32:146–54. doi: 10.1111/dme.12654
25. Riley, RD, Ensor, J, Snell, KIE, Harrell, FE, Martin, GP, Reitsma, JB, et al. Calculating the sample size required for developing a clinical prediction model. BMJ. (2020) 368:m441. doi: 10.1136/bmj.m441
26. Ishii, S, Tanaka, T, Shibasaki, K, Ouchi, Y, Kikutani, T, Higashiguchi, T, et al. Development of a simple screening test for sarcopenia in older adults. Geriatr Gerontol Int. (2014) 14:93–101. doi: 10.1111/ggi.12197
27. National Basic Public Health Services. National Health and Family Planning Commission Notice on the Issuance of the “National Basic Public Health Service Standards (Third Edition)”. (2017). Available online at: http://www.nhc.gov.cn/jws/s3578/201703/d20c37e23e1f4c7db7b8e25f34473e1b.shtml (Accessed October 6, 2023).
28. Jahangiri, M, Kazemnejad, A, Goldfeld, KS, Daneshpour, MS, Mostafaei, S, Khalili, D, et al. A wide range of missing imputation approaches in longitudinal data: a simulation study and real data analysis. BMC Med Res Methodol. (2023) 23:161. doi: 10.1186/s12874-023-01968-8
29. Yang, Y, Tan, J, He, Y, Huang, H, Wang, T, Gong, J, et al. Predictive model for diabetic retinopathy under limited medical resources: a multicenter diagnostic study. Front Endocrinol (Lausanne). (2022) 13:1099302. doi: 10.3389/fendo.2022.1099302
30. Zhang, Y, Xiang, T, Wang, Y, Shu, T, Yin, C, Li, H, et al. Explainable machine learning for predicting 30-day readmission in acute heart failure patients. iScience. (2024) 27:110281. doi: 10.1016/j.isci.2024.110281
31. Luo, W, Phung, D, Tran, T, Gupta, S, Rana, S, Karmakar, C, et al. Guidelines for developing and reporting machine learning predictive models in biomedical research: a multidisciplinary view. J Med Internet Res. (2016) 18:e323. doi: 10.2196/jmir.5870
32. Chicco, D, and Jurman, G. The advantages of the Matthews correlation coefficient (MCC) over F1 score and accuracy in binary classification evaluation. BMC Genomics. (2020) 21:6. doi: 10.1186/s12864-019-6413-7
33. Yi, M, Cao, Y, Wang, L, Gu, Y, Zheng, X, Wang, J, et al. Prediction of medical disputes between health care workers and patients in terms of hospital legal construction using machine learning techniques: externally validated cross-sectional study. J Med Internet Res. (2023) 25:e46854. doi: 10.2196/46854
34. Lei, M, Wu, B, Zhang, Z, Qin, Y, Cao, X, Cao, Y, et al. A web-based calculator to predict early death among patients with bone metastasis using machine learning techniques: development and validation study. J Med Internet Res. (2023) 25:e47590. doi: 10.2196/47590
35. Bowen, D, and Ungar, L. Generalized SHAP: Generating multiple types of explanations in machine learning. arXiv:2006.07155v2. (2020). doi: 10.48550/arXiv.2006.07155
36. Maksymiuk, S, Gosiewska, A, and Biecek, P. Landscape of R packages for explainable artificial intelligence. arXiv:2009.13248. (2021). doi: 10.48550/arXiv.2009.13248
37. Zhou, H, Liu, L, Zhao, Q, Jin, X, Peng, Z, Wang, W, et al. Machine learning for the prediction of all-cause mortality in patients with sepsis-associated acute kidney injury during hospitalization. Front Immunol. (2023) 14:1140755. doi: 10.3389/fimmu.2023.1140755
38. Wang, J, Liu, C, Zhang, L, Liu, N, Wang, L, Wu, J, et al. Prevalence and associated factors of possible sarcopenia and sarcopenia: findings from a Chinese community-dwelling old adults cross-sectional study. BMC Geriatr. (2022) 22:592. doi: 10.1186/s12877-022-03286-y
39. Bian, D, Li, X, Xiao, Y, Song, K, Wang, L, Shen, J, et al. Relationship between social support, sarcopenia, and cognitive impairment in Chinese community-dwelling older adults. J Nutr Health Aging. (2023) 27:726–33. doi: 10.1007/s12603-023-1973-2
40. Lu, L, He, X, Song, Y, Zhuang, M, Wu, X, and Chen, N. Prevalence and risk factors of sarcopenia without obesity and sarcopenic obesity among Chinese community older people in suburban area of Shanghai: a cross-sectional study. Front Aging Neurosci. (2022) 14:1034542. doi: 10.3389/fnagi.2022.1034542
41. Ren, X, Bai, D, Zhang, Y, Lin, H, Zhang, S, Li, D, et al. Residents of mountainous areas have a higher low Back pain prevalence than flat areas of Chongqing, China: a cross-sectional study. JPR. (2023) 16:1169–83. doi: 10.2147/JPR.S401894
42. Chen, L-K, Arai, H, Assantachai, P, Akishita, M, Chew, STH, Dumlao, LC, et al. Roles of nutrition in muscle health of community-dwelling older adults: evidence-based expert consensus from Asian working Group for Sarcopenia. J Cachexia Sarcopenia Muscle. (2022) 13:1653–72. doi: 10.1002/jcsm.12981
43. World Health Organization. Physical status: the use of and interpretation of anthropometry, report of a WHO expert committee. (1995). Available online at: https://www.who.int/publications-detail-redirect/9241208546 (Accessed February 20, 2024).
44. Hwang, J, and Park, S. Gender-specific risk factors and prevalence for sarcopenia among community-dwelling young-old adults. Int J Environ Res Public Health. (2022) 19:7232. doi: 10.3390/ijerph19127232
45. Habib, SS, Alkahtani, S, Alhussain, M, and Aljuhani, O. Sarcopenia coexisting with high adiposity exacerbates insulin resistance and dyslipidemia in Saudi adult men. DMSO. (2020) 13:3089–97. doi: 10.2147/DMSO.S260382
46. Buchmann, N, Nikolov, J, Spira, D, Demuth, I, Steinhagen-Thiessen, E, Eckardt, R, et al. Identifying sarcopenia in metabolic syndrome: data from the Berlin aging study II. J Gerontol Ser A. (2016) 71:265–72. doi: 10.1093/gerona/glv089
47. Huang, H, Yu, X, Jiang, S, Wang, C, Chen, Z, Chen, D, et al. The relationship between serum lipid with sarcopenia: results from the NHANES 2011–2018 and bidirectional Mendelian randomization study. Exp Gerontol. (2024) 196:112560. doi: 10.1016/j.exger.2024.112560
48. Yu, X, Jiang, S, Chen, Z, Ren, K, Li, S, Luo, Y, et al. Association of triglyceride-glucose index and its combinations with sarcopenia among community-dwelling older adults: based on the Chongqing aging and sarcopenia evaluation (CHASE) cohort. Front Physiol. (2025) 16:1595517. doi: 10.3389/fphys.2025.1595517
49. Li, C-W, Yu, K, Shyh-Chang, N, Jiang, Z, Liu, T, Ma, S, et al. Pathogenesis of sarcopenia and the relationship with fat mass: descriptive review. J Cachexia Sarcopenia Muscle. (2022) 13:781–94. doi: 10.1002/jcsm.12901
50. Sim, J-A, Huang, X, Horan, MR, Stewart, CM, Robison, LL, Hudson, MM, et al. Natural language processing with machine learning methods to analyze unstructured patient-reported outcomes derived from electronic health records: a systematic review. Artif Intell Med. (2023) 146:102701. doi: 10.1016/j.artmed.2023.102701
51. Song, X, Liu, X, Liu, F, and Wang, C. Comparison of machine learning and logistic regression models in predicting acute kidney injury: a systematic review and meta-analysis. Int J Med Inform. (2021) 151:104484. doi: 10.1016/j.ijmedinf.2021.104484
52. Christodoulou, E, Ma, J, Collins, GS, Steyerberg, EW, Verbakel, JY, and Van Calster, B. A systematic review shows no performance benefit of machine learning over logistic regression for clinical prediction models. J Clin Epidemiol. (2019) 110:12–22. doi: 10.1016/j.jclinepi.2019.02.004
53. Hirano, Y, Kondo, Y, Hifumi, T, Yokobori, S, Kanda, J, Shimazaki, J, et al. Machine learning-based mortality prediction model for heat-related illness. Sci Rep. (2021) 11:9501. doi: 10.1038/s41598-021-88581-1
54. Fang, G, Xu, P, and Liu, W. Automated ischemic stroke subtyping based on machine learning approach. IEEE Access. (2020) 8:118426–32. doi: 10.1109/access.2020.3004977
55. Izmirlian, G. Application of the random Forest classification algorithm to a SELDI-TOF proteomics study in the setting of a Cancer prevention trial. Ann N Y Acad Sci. (2004) 1020:154–74. doi: 10.1196/annals.1310.015
56. Gao, D, Feng, W, Qiao, Y, Jiang, X, and Zhang, Y. Development and validation of a random forest model to predict functional outcome in patients with intracerebral hemorrhage. Neurol Sci. (2023) 44:3615–27. doi: 10.1007/s10072-023-06824-7
57. Chen, M, Li, J, Chen, C, Zhao, Q, and Huang, H. The relationships between quality of life with health literacy, social support and resilience in older stroke survivors: a structural equation model. Nurs Open. (2024) 11:e70020. doi: 10.1002/nop2.70020
58. Krawczyk, B. Learning from imbalanced data: open challenges and future directions. Prog Artif Intell. (2016) 5:221–32. doi: 10.1007/s13748-016-0094-0
59. Mazurowski, MA, Habas, PA, Żurada, JM, Lo, JY, Baker, JA, and Tourassi, GD. Training neural network classifiers for medical decision making: the effects of imbalanced datasets on classification performance. Neural Netw. (2008) 21:427–36. doi: 10.1016/j.neunet.2007.12.031
Keywords: sarcopenia, older adults, risk, machine learning, community
Citation: Huang H, Jiang S, Chen Z, Yu X, Ren K and Zhao Q (2025) A w-ACT model for sarcopenia among community-dwelling older adults based on National Basic Public Health Services: development and validation study. Front. Public Health. 13:1522903. doi: 10.3389/fpubh.2025.1522903
Edited by:
Giuseppe Caminiti, Università Telematica San Raffaele, ItalyReviewed by:
Chang Won Jeong, Wonkwang University, Republic of KoreaAndri Matos, Eastwick College and the HoHoKus Schools, United States
Copyright © 2025 Huang, Jiang, Chen, Yu, Ren and Zhao. This is an open-access article distributed under the terms of the Creative Commons Attribution License (CC BY). The use, distribution or reproduction in other forums is permitted, provided the original author(s) and the copyright owner(s) are credited and that the original publication in this journal is cited, in accordance with accepted academic practice. No use, distribution or reproduction is permitted which does not comply with these terms.
*Correspondence: Huanhuan Huang, aHh1ZWhhb0AxMjYuY29t; Qinghua Zhao, cWgyMDA2M0AxNjMuY29t