 Peil Yu
 Xinxin Zhang1
 Ping Zeng
 Ke Wang
- 1Department of Biostatistics, School of Public Health, Xuzhou Medical University, Xuzhou, Jiangsu, China
- 2Center for Medical Statistics and Data Analysis, Xuzhou Medical University, Xuzhou, Jiangsu, China
- 3Jiangsu Engineering Research Center of Biological Data Mining and Healthcare Transformation, Xuzhou Medical University, Xuzhou, Jiangsu, China
Background: Sarcopenia (SP), is recognized as a complication of cardiovascular disease (CVD), but few relevant diagnostic models have been developed. This study aims to establish an interpretable diagnostic model for the occurrence of SP in older adult CVD patients living in Chinese community-dwelling (CD).
Methods: We randomly selected participants with CVD recruited from CHARLS from 2011 to 2015 and divided them into a training set and a test set. In the training set, we processed and screened the predictor variables and addressed the data imbalance by the synthetic minority oversampling technique (SMOTE). Subsequently, we built four machine learning (ML) models to predict SP. After 100 iterations, we selected the best performing model for risk stratification by comparing model discrimination and calibration. Then, we analyzed the relationship between ML risk and SP using scatterplots and logistic regression (LR). Finally, the Shapley’s Additive Explanatory Plot (SHAP) illustrates how each feature level affects the predicted probability of SP.
Results: We ultimately included 1,088 CD older adults, 18.61% of whom reported SP. The optimal model, XGBoost, was selected for prediction and risk stratification. After both univariate (odds ratio [OR]: 12.45, p = 4.74 × 10⁻¹⁰) and multivariate analyses (OR: 6.98, p = 3.96 × 10⁻¹⁰), participants with higher ML scores had a higher risk of SP. In sex-specific subanalyses, BMI, height, age, DBP, HDL, etc. were all significant predictors.
Conclusion: This study develops a novel clinically-integrated tool that can be used to easily predict SP in the older adults population with CVD, providing a basis for the development of personalized therapeutic measures.
1 Introduction
Cardiovascular disease (CVD) is a group of diseases involving the heart and peripheral vasculature, which is characterized by the interplay of atherosclerosis and myocardial ischemia leading to impaired cardiac function. Statistically, it accounts for 31% of deaths in the global population (1) and up to 40% in China, making it the leading cause of death (2). Previous studies have shown that CVD is associated with irreversible damage and decreased function of multiple organs such as the liver (3) and lungs (4), usually affecting the body’s metabolic, detoxification, and neurological functions. Recent studies have found that chronic inflammatory states and reduced exercise tolerance are associated with CVD; and that the accelerated muscle loss resulting from both is a precursor to the development of sarcopenia (SP), which has become a recognized complication of CVD (5, 6).
Irving Rosenberg first defined SP as muscle atrophy in the older adults (7), and the Asian sarcopenia working group expanded it to include age-related loss of skeletal muscle mass, plus low muscle strength, and/or low physical performance (8). In general, a decrease in skeletal muscle mass usually begins to appear after the age of 40, and the incidence of SP is about 1–33% among people over 50 years old. Among subjects aged 60–70, 5–13% are affected by it, while among older adults aged 80 and above, this proportion can even reach as high as 50%. Studies have shown that SP is widely recognized as a risk factor for CVD and that the overall prevalence of SP in patients with high blood pressure (HBP) and coronary heart disease (CHD) is quite high (9). A systematic evaluation and meta-analysis reported that the prevalence of stroke-related SP was 42% (95% CI 33–52%) and that the prevalence of SP was even higher in the early post-stroke period (10). Research has shown that various characteristics of CVD (such as neuroendocrine disorders, endothelial dysfunction, etc.) affect the balance between protein synthesis and degradation in skeletal muscle, leading to SP (11). These risks can exacerbate the occurrence of related adverse outcomes such as falls, cachexia, and even death in SP patients, and vice versa (12). Therefore, we urgently need to determine methods for early screening of SP in patients with CVD.
Currently, SP diagnosis requires measurement of bone mass. Still, there are some methodological limitations, such as bioimpedance analysis (BIA) which is limited to specific groups of people, and X-ray computed tomography (CT) which exposes the body to radiation and is expensive (13, 14). Currently, there is a paucity of review literature that systematically summarizes and analyzes studies on SP prediction using machine learning (ML) techniques (15). It is worth noting that now with the rapid development of AI-assisted diagnostic technologies, relevant predictive models for this disease have been developed and have high accuracy and sensitivity (13, 16–18). For example, one study used clinical and laboratory metrics data from the West China Health and Aging Trends (WCHAT) study to predict SP using Support Vector Machine (SVM), Random Forest (RF), Extreme Gradient Boosting (XGBoost), and Wide and Deep (W&D) models, and showed that the W&D model had the highest area under the receiver operating curve (AUC) and accuracy (13). Another study using the National Health and Nutrition Examination Survey (NHANES) database in type 2 diabetes developed a novel and practical column chart based on three independent factors: gender, height, and waist circumference, which may be useful to clinicians in predicting the risk of pre-sarcopenia in young people with diabetes mellitus (16). Nevertheless, there is a lack of research on ML’s diagnostic prediction of SP in CVD patients. In addition, although ML has performed well in previous studies, there is limited evidence of its application in Asian populations and interpretable risk prediction models to assist in disease diagnosis. Logistic regression (LR), random forest (RF) (19), support vector machine (SVM) (20), and XGBoost (21) were selected for this study in view of their excellent performance in dealing with high-dimensional and complex data; RF effectively reduces the risk of overfitting, SVM can find the optimal classification hyperplane in high-dimensional space, and XGBoost, with its powerful learning ability and fast training speed, has shown excellent performance in many medical prediction research, and XGBoost has shown excellent performance in many medical prediction studies with its strong learning ability and fast training speed.
In order to address the above limitations, this study develops a diagnostic model for SP in Chinese older adults with the help of an ML approach combined with SHAP in a CVD population. The objectives were to (1) screen the main influencing factors affecting the occurrence of SP in the older adults to provide a basis for early intervention; (2) build a highly interpretable SP diagnostic model to provide a non-invasive, economical, and harmless alternative imaging method for early detection of these patients.
2 Methods
2.1 Study population
The China Health and Retirement Longitudinal Study (CHARLS), a nationwide longitudinal survey of people >45 years old and their spouses in China, recruited 17,708 participants from June 2011 to March 2012, with multiple follow-ups after that (22). The database used face-to-face computer-assisted personal interviews (CAPI) to examine nearly 10,000 households in 150 counties and 450 villages across 28 provinces in China over an average of 2–3 years, providing information on relevant social, economic, and health status of community residents (22). Ethical approval for all the CHARLS waves was granted from the Institutional Review Board at Peking University. The IRB approval number for the main household survey, including anthropometrics, was IRB00001052-11,015; the IRB approval number for biomarker collection, was IRB00001052-11,014.
Blood tests and physical measurements were performed in the 2011 and 2015 waves, respectively (not available in 2018), so we used the 2011 and 2015 waves to develop a diagnostic model for SP. We excluded participants diagnosed with SP at baseline and included participants aged ≥60 years with a history of CVD (n = 1,080) who had blood tests and other health-related data available at baseline (Figure 1).

Figure 1. The flowchart for data processing and statistical analysis using the CHARLS in the present work.
2.2 Ascertainment of outcomes
The diagnostic criteria for SP we defined regarding the latest edition of the Asian Working Group on Muscle Attenuation Syndrome 2019 (AWGS2019) (8), which included three components: low muscle mass (<5.61 kg/m2 for females and <7.35 kg/m2 for males), muscle strength (<28.0 kg for males and <18.0 kg for females), or low physical performance (gait speed<1 m/s, chair stand test≥12 s) (23, 24).
First, muscle mass was assessed by appendicular skeletal muscle mass (ASM) and height. The equation model of ASM, which was validated on Chinese residents, was in strong agreement with DXA (25, 26):
Height, weight, and age are given in centimeters, kilograms, and years, respectively. For sex, value 1 represents males and value 2 represents females. Subsequently, we determined the threshold value for low muscle mass based on the lowest 20% of sex for height-adjusted muscle mass (ASM/height2) in the study population (26, 27). Xu Wen et al. applied multiple linear regression to develop a height-weight model using DXA-measured ASM as the dependent variable and anthropometric variables as independent variables. The developed regression model was then cross-validated using data from the CV group. The adjusted R2 of the equation model was 0.90 and the estimated standard error was 1.63 kg.
Additionally, participants’ muscle strength in their dominant and non-dominant hands was assessed by a Yuejian TM WL-1000 dynamometer (22).
Finally, regarding physical performance, we chose to assess gait speed and chair stand tests. To measure gait speed, participants were asked to walk a 2.5-meter route twice at normal speed and take the average. To measure the chair stand test, participants were asked to stand five times in a row from a 47 cm high chair, keeping their arms crossed in front of their chest, and the time taken (in seconds) was recorded.
2.3 Ascertainment of CVD
This study focused on a population of people with CVD and HBP. In previous definitions (28, 29), CVD was identified by assessing two questions, “Have you ever been told by your doctor that you have had a heart attack, angina, CHD, heart failure, or other heart problem?” or “Have you ever been told by a doctor that you have had a stroke?” Study participants also answered the question about HBP, “Have you ever been told by a doctor that you have HBP?”
2.4 Feature selection and data preprocessing
To efficiently and comprehensively extract relevant features, we performed feature selection in three categories, including socio-demographic information, physical、exercise, nutritional factors, and clinical factors. Details of the candidate variables measured at baseline for all participants are shown in Supplementary Table 1. The selection of each feature was based on the following factors: (1) the feature had a missingness rate of less than 30% [populated with multiple imputation (30)], We use the mice package in R studio for multiple imputation, where each regression model can be expressed using the following equation:
where missing denotes the missing value of the target variable, denotes the other predictor variables, are the regression coefficients and is the error term. During interpolation, the regression model needs to be appropriately chosen to match the nature of the data (e.g., linear or logistic regression). The error term is usually assumed to be normally distributed, allowing the interpolation process to reflect the uncertainty in the predictions. Compared to other interpolation methods, it has the following significant advantages: consideration of uncertainty, efficient use of information, applicability to a wide range of analysis methods, and reduction of bias.
(1) The feature was associated with SP or a potential causative factor that turned out to be significant after analyses using logistic regression (LR), and (2) features with low variance and strong correlation (correlation coefficient>0.90) have been remove. The absence of significant linear relationships for the variables was checked using the findLinearCombos function from the Matrix package.
Since different features may have different ranges of values and some ML algorithms are sensitive to the scale of the features, we standardized or normalized the continuous variables and One-Hot the categorical variables.
2.5 Derivation and evaluation of prediction models
We predict whether SP occurs or not in four ML models, namely, LR, support vector machine (SVM), random forest (RF), and extreme gradient boosting (XGBoost), which is a scalable tree boosting system that has a wide range of application scenarios in ML. Its loss function does a second-order Taylor expansion of the error part; and also adds a regularization part and parallel selection of each weak classifier, which prevents model overfitting and improves model generalization (31). We randomly divided 1,080 participants into a training set and a test set in a 7:3 ratio. Preprocessing, parameter tuning, and model training were performed on the training set. Considering the imbalance between positive and negative classes, we chose the synthetic minority oversampling technique (SMOTE) (32) for class balancing treatment. The new data are generated by calculating the distance between samples, finding the nearest neighbor samples of a certain minority class of samples, and then by linear interpolation. The specific process is as follows:
Step 1, select a minority class sample: randomly select a sample from the minority class sample set.
Step 2, find the nearest neighbor samples: among the minority class samples, find the k nearest neighbor samples of by Euclidean distance, and the value of k is set to 5 in this study.
Step 3, randomly select a neighbor sample: from these k nearest neighbor samples, randomly select a sample .
Step 4, generate a new sample: randomly interpolate between and to generate a new sample according to the following equation. Where is a random number between 0 and 1.
Step 5, Repeat the above process: repeat steps 1–4, and in our study we set the ratio of the number of diseased to non-diseased samples to 1:1.
After that, this study used a grid search method with a five-fold CV to optimize the hyperparameter combinations, and the specific tuning parameters are detailed in Supplementary Table 2. Finally, we chose the area under the receiver operating characteristic curve (AUC), accuracy, sensitivity, specificity, and F1 scores to assess the model’s discrimination and the Brier scores to assess the model’s calibration. To ensure the robustness of the results and to limit overfitting, we set up 100 different random seeds to repeat the above process and calculate the average performance of these 100 repetitions (33) (Figure 2). In this paper, the TRIPOD process is strictly followed to construct the prediction model (34).
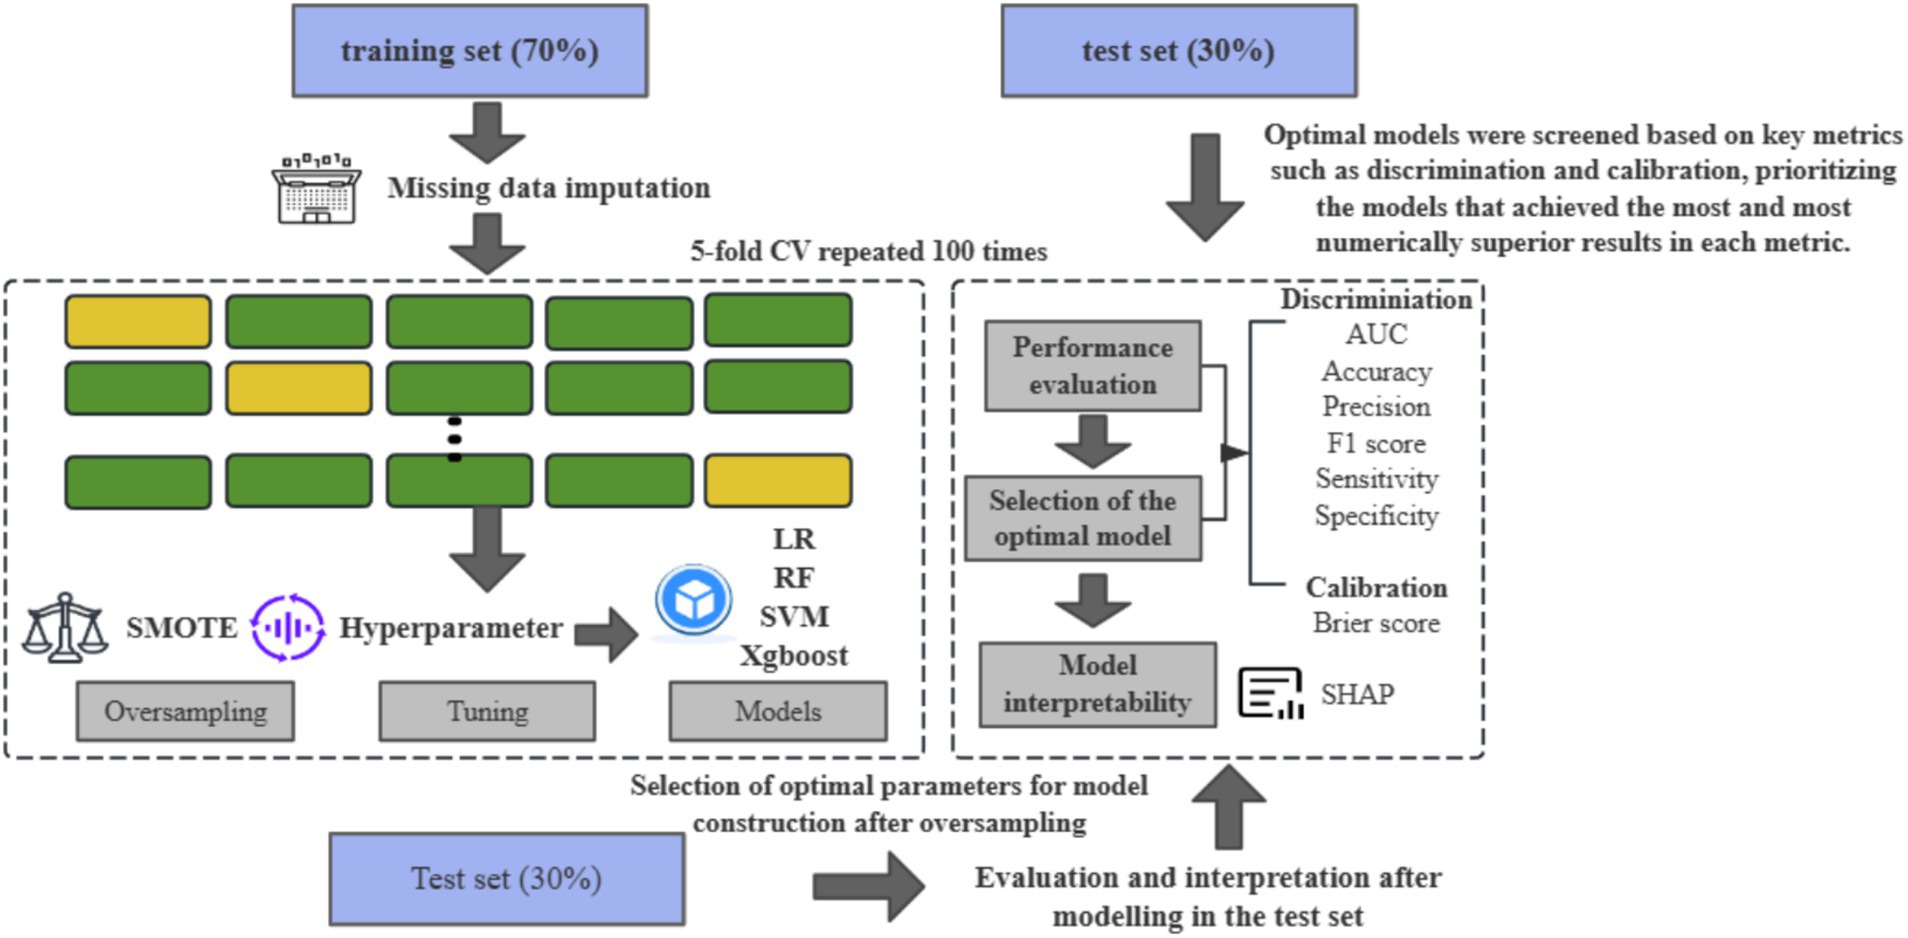
Figure 2. Flow chart of model derivation and test.
2.6 Model interpretation and feature importance
The “black box” problem is considered to be one of the main obstacles to the further development of ML, and we need to increase the interpretability of the results by visualizing the model results both globally and locally. SHapley additive exPlanations (SHAP) (35) assign the contribution of the feature values to the different features. SHAP generates graphical and quantitative interpretations to help interpret the model and make more accurate clinical decisions. Its performance has been validated in previous studies (36). The calculation of SHAP value is based on evaluating all possible combinations of features with the following mathematical formula:
is the SHAP value of the features, is the subset of features (excluding features ); is the total set of features; is the model output of the feature set , and is the model output after feature set plus feature .
Afterward, we calculated the importance of the variables in the optimal model to identify the main predictors of the occurrence of SP in the older adults population with CVD.
2.7 Statistical analysis
First, to better understand the data distribution and characteristics, continuous data are presented as means (standard deviations) and were tested using independent samples t-tests or Mann–Whitney U-tests. Categorical variables were presented as frequencies (percentages) and tested using chi-square tests. The highest Youden’s index was used to define the optimal threshold and to differentiate between low-risk and high-risk participants. Scatterplots were then drawn to describe the high and low ML risk distribution. Finally, the relationship between ML risk and 4-year SP was assessed using univariate and multivariate LR (controlling for the top 5 significant predictors). Statistical significance was based on a two-tailed p value≤0.05.
All analyses and calculations were performed using R version 4.2.1 (caret, XGBoost, kernlab, randomForest, DMwR, and shapviz packages).
3 Results
3.1 Patient characteristics of the internal training and testing sets
The baseline characteristics of all participants in this study are shown in Supplementary Table 3. The baseline characteristics of participants after feature screening are shown in Table 1. The data were divided into a training set (70%) and a test set (30%). The prevalence of SP in the older adults population with CVD was 18.61% of the total number of subjects, 18.63% in the training set (141 subjects), and 18.58% in the validation set (60 subjects). The differences between the training and test sets were not statistically significant on the remaining variables such as gender, any weekly contact with children, taking any medications for HBP, CESD scale, visual or hearing problem, complication, BUN, glucose, age, average hours for one night sleeping time during the past month, DBP, height and waist, except for significant differences on HDL (48.53 vs. 45.32, p = 0.001) and uric acid (UA) (4.65 vs. 4.86, p = 0.018).
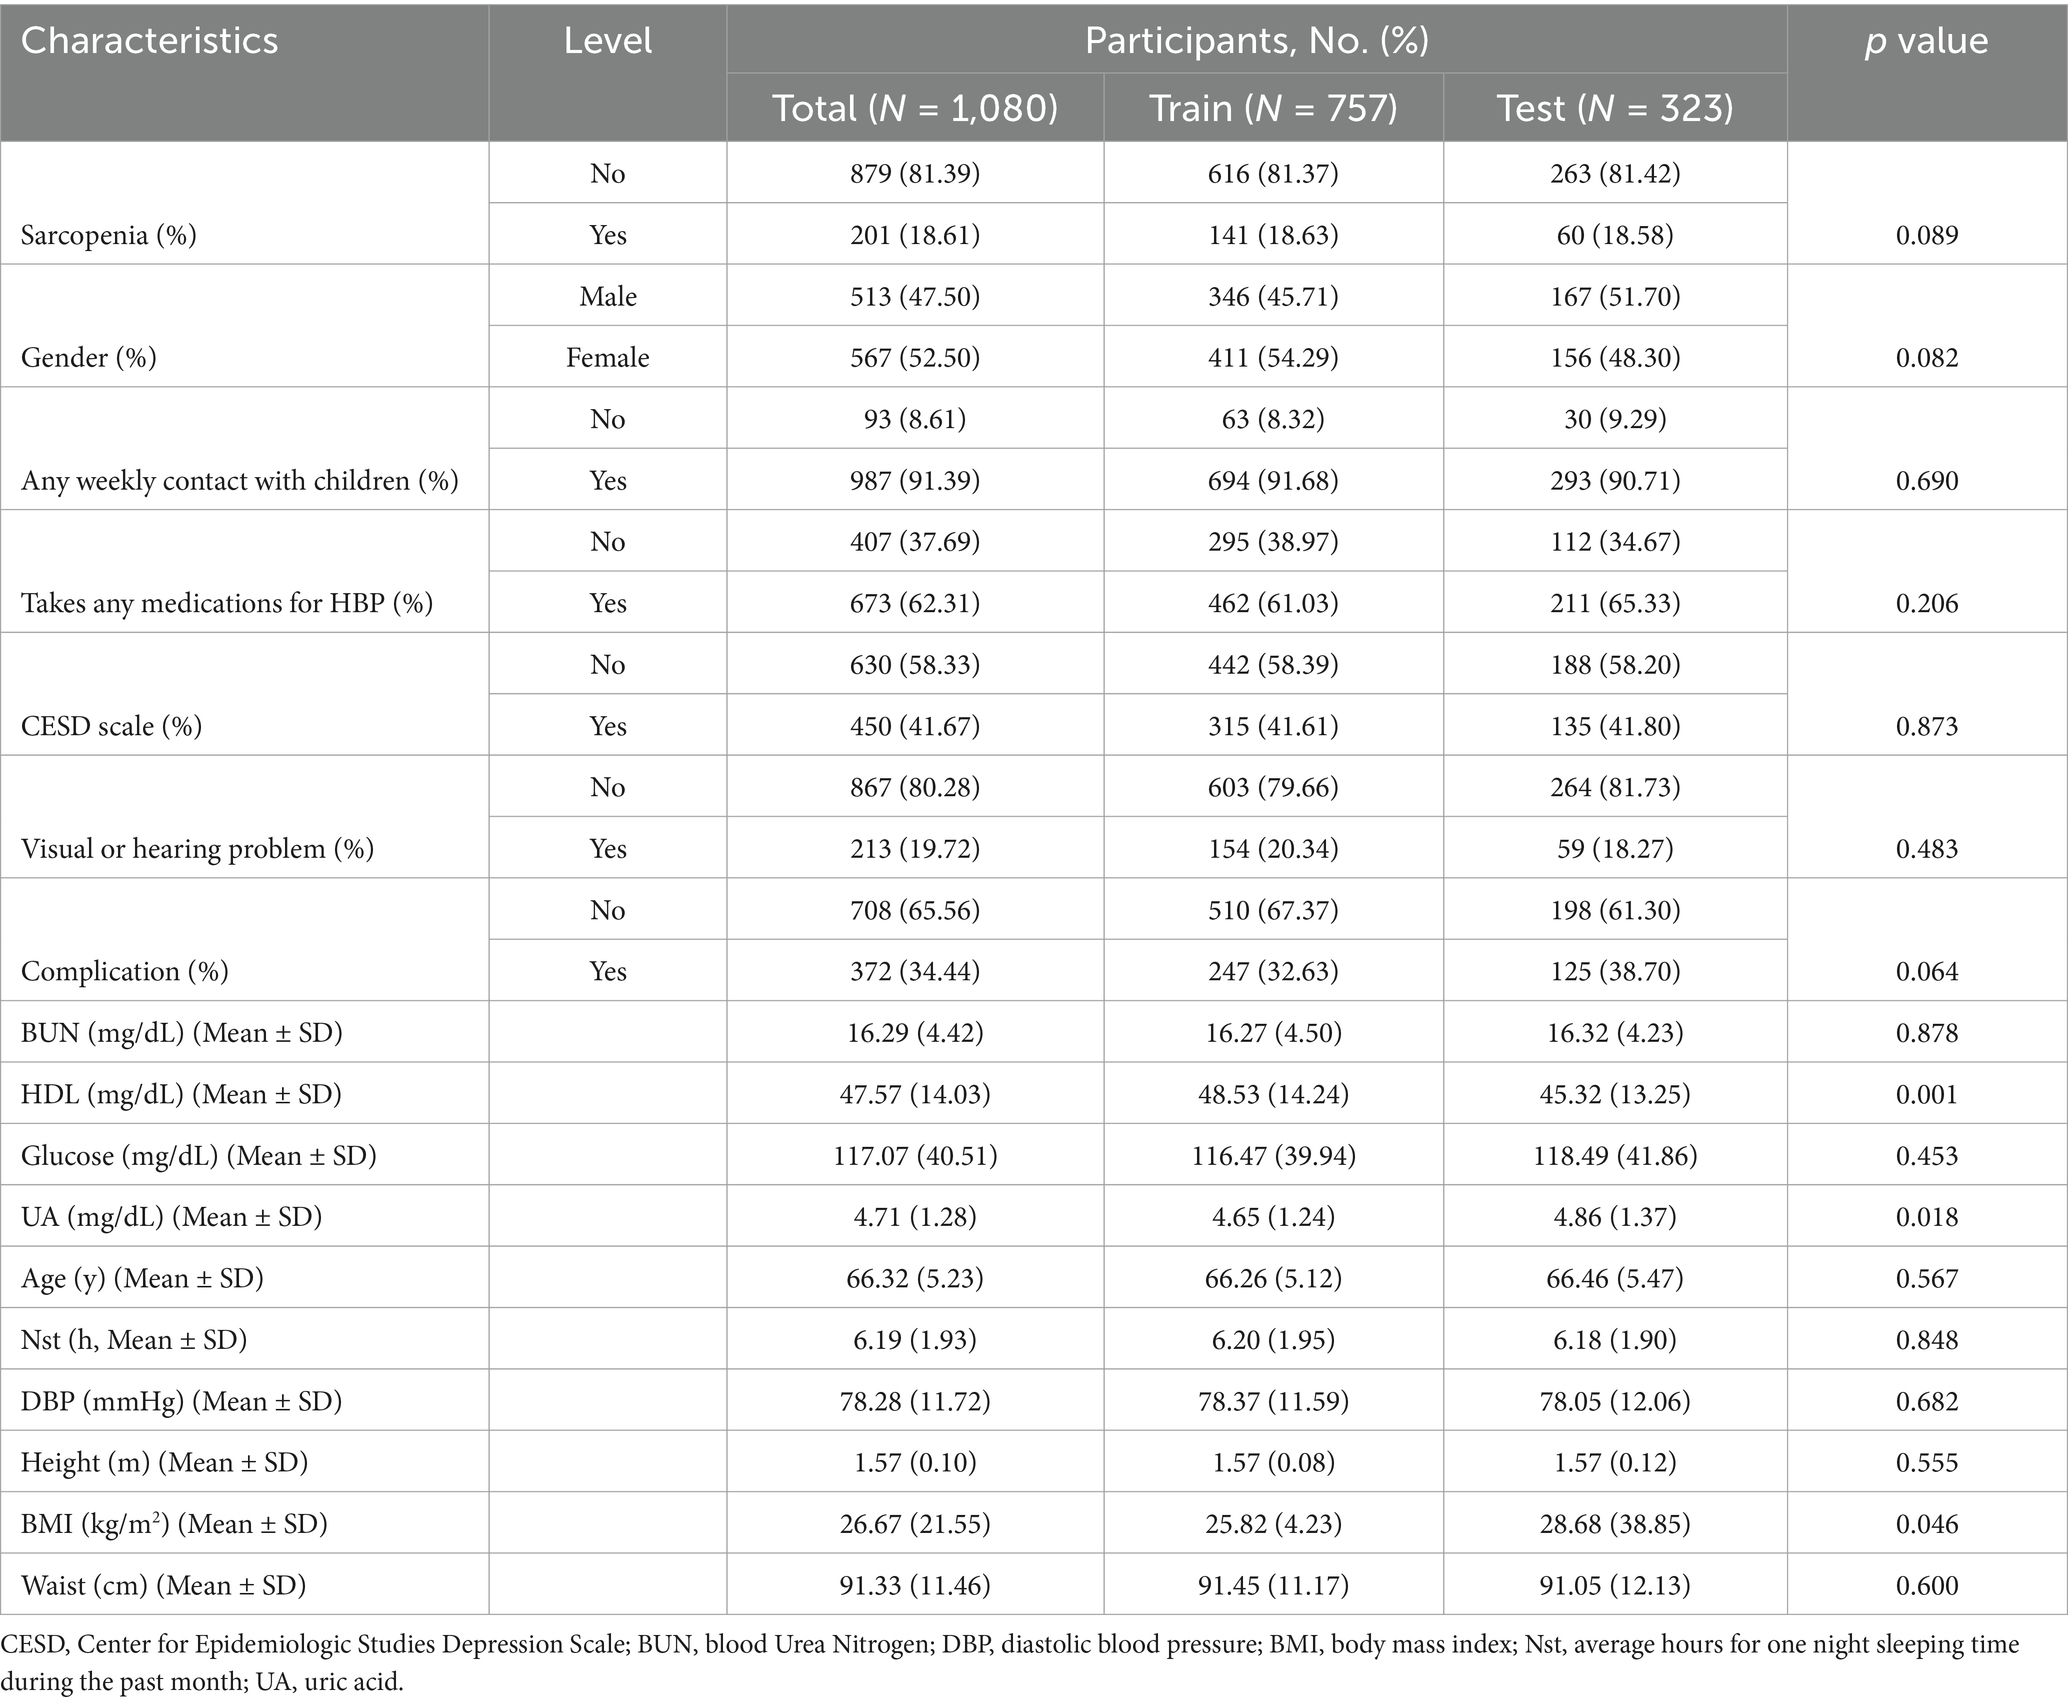
Table 1. Training and testing set demographics.
3.2 ML to predict outcomes
Table 2 shows the prediction performance of the four ML models in the test set. Overall, the new ML models all performed better than the traditional LR model. More specifically, comparing the AUC first, it can be seen from Supplementary Figure S1 that the RF has the highest AUC (all the following values are averages: 0.8769, 95% CI: 0.8367 ~ 0.9171) and the lowest LR (AUC = 0.8459, 95% CI: 0.7922 ~ 0.8996). Next, SVM has the highest precision (0.9681, 95% CI: 0.9429 ~ 0.9932) and specificity (0.9000, 95% CI: 0.8241 ~ 0.9759). However, taken together, the XGBoost had the highest accuracy (0.8050, 95%CI: 0.7575 ~ 0.8467), F1 score (0.8706, 95% CI: 0.8408, 0.9004), sensitivity (0.8061, 95% CI: 0.7583 ~ 0.8539) and Brier score (0.1950, 95% CI: 0.1486 ~ 0.2414) performed best. In addition, its AUC (0.8670, 95% CI: 0.8184 ~ 0.9156) is second only to the RF (Table 2). Therefore, XGBoost was selected for further prediction in this study.
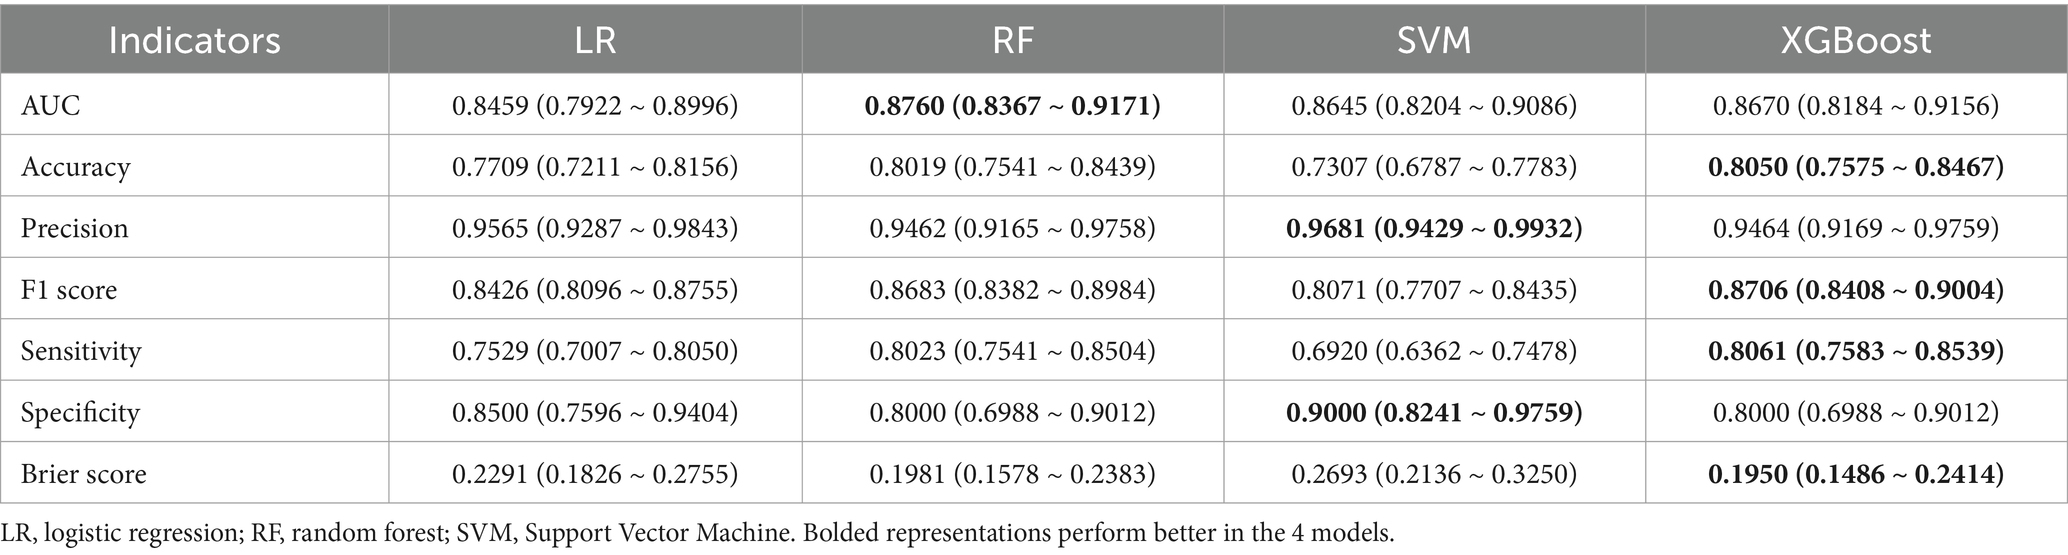
Table 2. Scores of each model on the test set.
3.3 Categorization of prediction score and risk stratification
We categorized patients into high-risk and low-risk groups after establishing the XGBoost in the test set using the maximum Youden’s index as the optimal threshold (0.457, sensitivity = 0.8500, specificity = 0.7985) (Figure 3a). The results of the risk probability scatterplot determined by the optimal model showed a clear aggregation of SP in the older adults population with CVD, further demonstrating the accuracy of the model in stratifying high-risk and low-risk (Figure 3b).
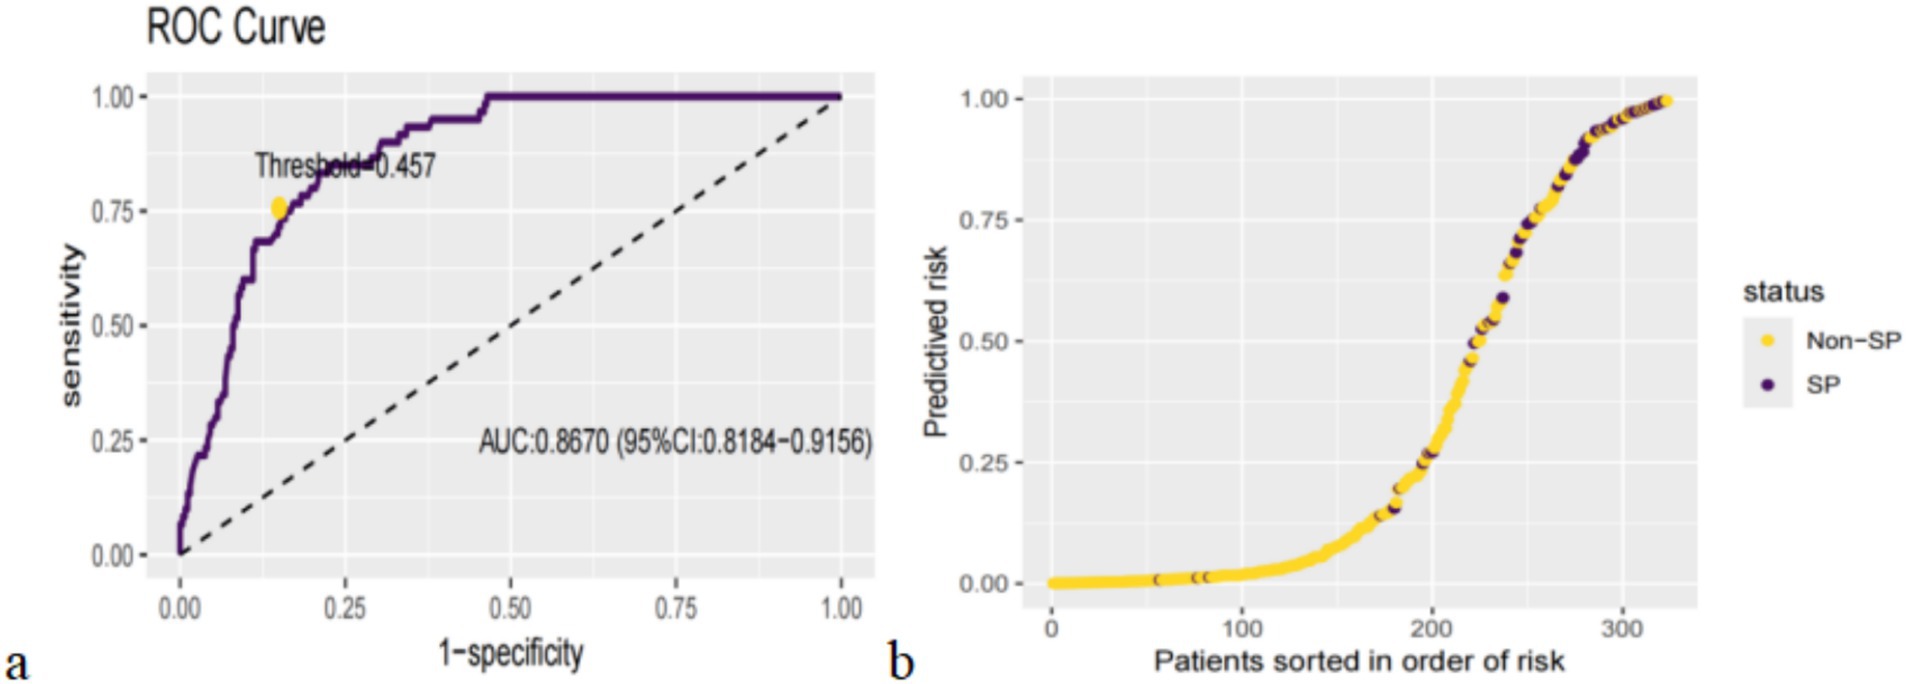
Figure 3. Categorization threshold of prediction score (a) and prediction distributions in participants with SP (b).
3.4 Logistic regression analysis
After categorizing participants into low-risk and high-risk based on thresholds in a one-way LR analysis, high ML risk was significantly associated with SP diagnosis (unadjusted odds ratio [OR]: 12.45; 95%CI: 1.87 ~ 23.02; p = 4.74 × 10⁻¹⁰). After controlling for the five most important predictors (BMI, height, age, waist, and DBP), the correlation remained (adjusted OR: 6.98; 95%CI: 1.33 ~ 12.63; p = 3.96 × 10⁻¹⁰). The results of the multivariate LR analysis are shown in Figure 4.
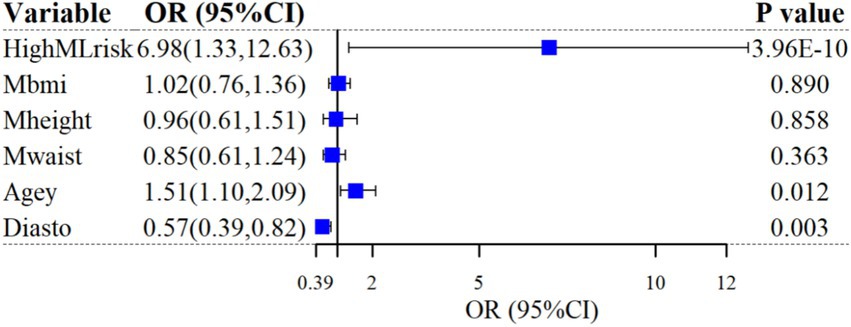
Figure 4. Multivariable logistic regression for SP prediction.
3.5 Visualization of feature importance and interpretation of personalized predictions
SHAP can globally interpret and visualize the contribution of each feature in the XGBoost model to the prediction. In each feature importance row, all patient attributions to the results are represented by dots of different colors, with purple dots representing a negative correlation between the feature and the result, and yellow dots representing a positive correlation (Figure 5a). Figure 5b shows the importance of all screened variables using the optimal model. X and y-axis represent a unified index that responds to the influence of a certain feature in the model and variable importance, respectively. Age, UA, glucose, HDL, CESD scale, BUN, complication, taking any medications for HBP, and visual or hearing problems are positively correlated with SP. In contrast, BMI, height, waist, DBP, average hours for one night sleeping time during the past month, gender, and any weekly contact with children were negatively associated with SP (Figure 5a). We also provide an example to illustrate the function of SHAP in locally explaining individual features (Figure 6). Although the specific contribution of each individual may differ, the overall trend remains consistent with what we perceive.
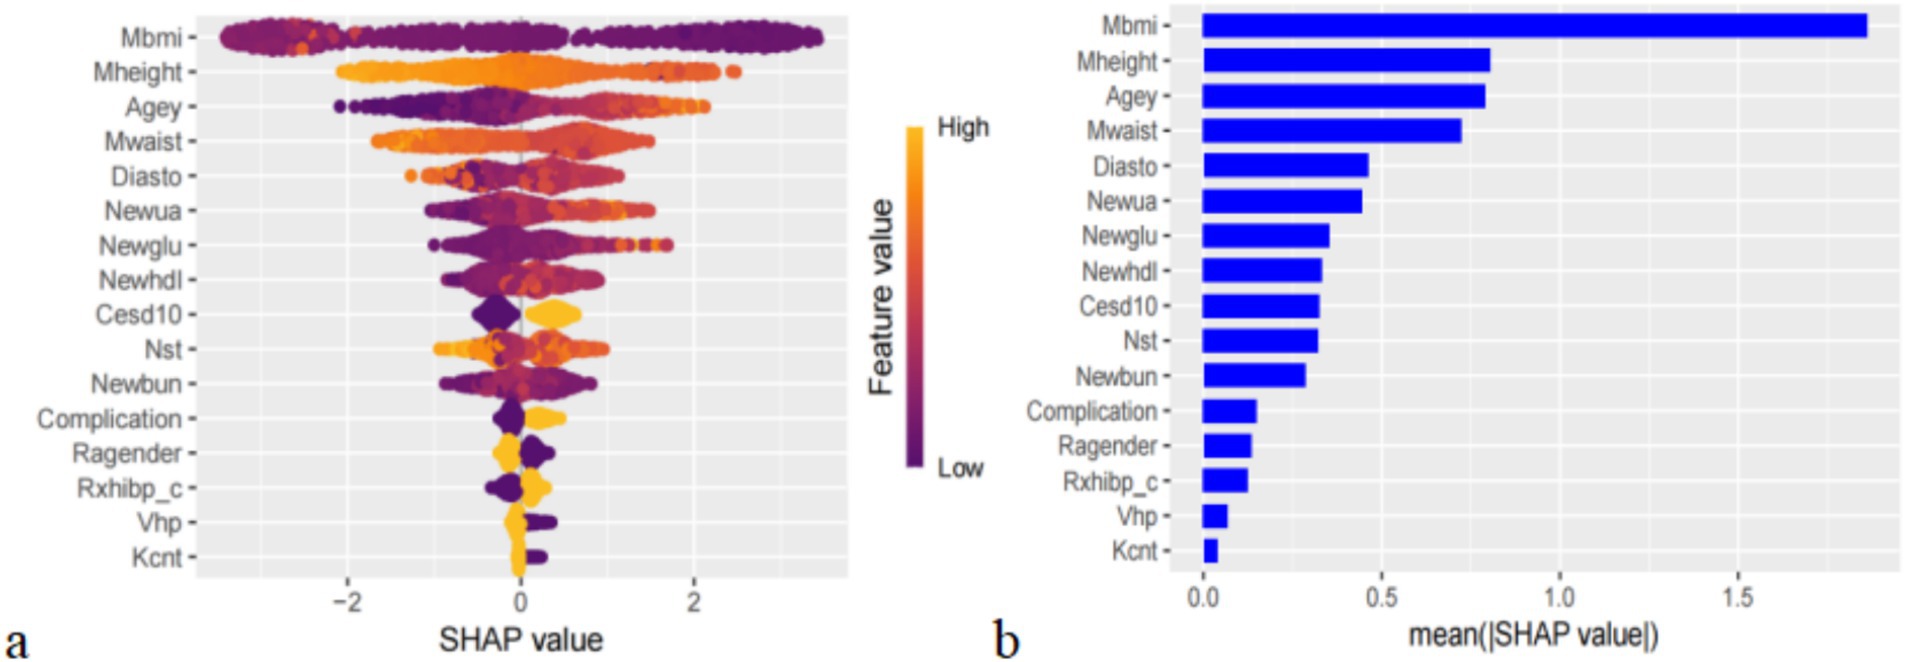
Figure 5. (a) Importance of all screened variables according to the mean (|SHAp value|), (b) the importance of all screened variables using the optimal model.
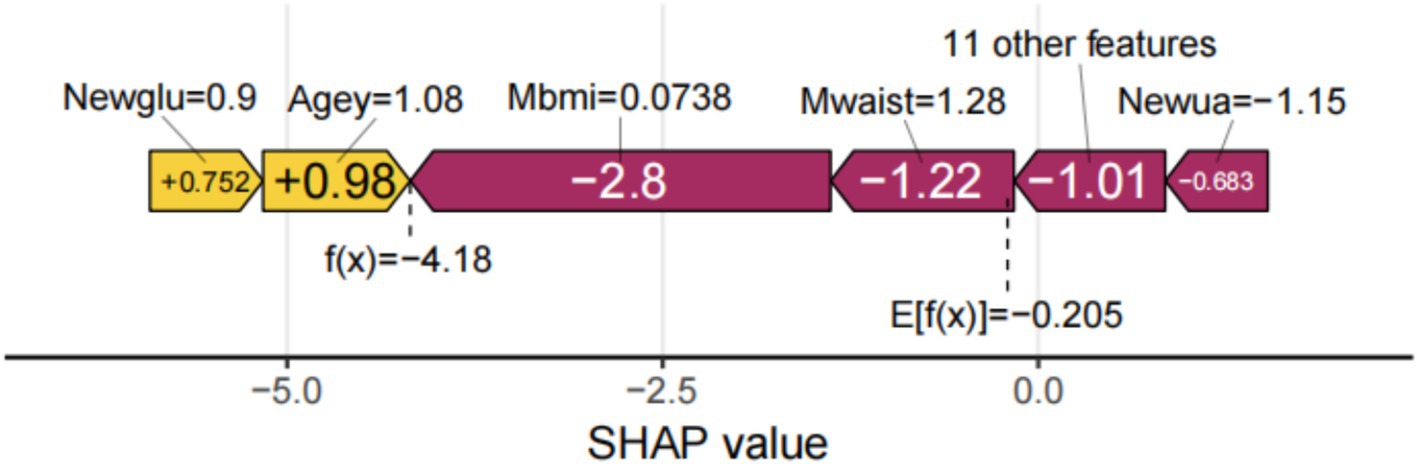
Figure 6. Interpretation of single sample model predictions.
3.6 Gender-based analysis
In the sex-specific subanalysis, we compared the top 10 predictors, average hours for one night sleeping time during the past month and HDL, as significant predictors only in males; they were not among the top 10 predictors in females. Similarly, some factors, such as CESD score and complication, were significant predictors in females only; in males, they were not among the top 10 predictors (Figures 7a,b).
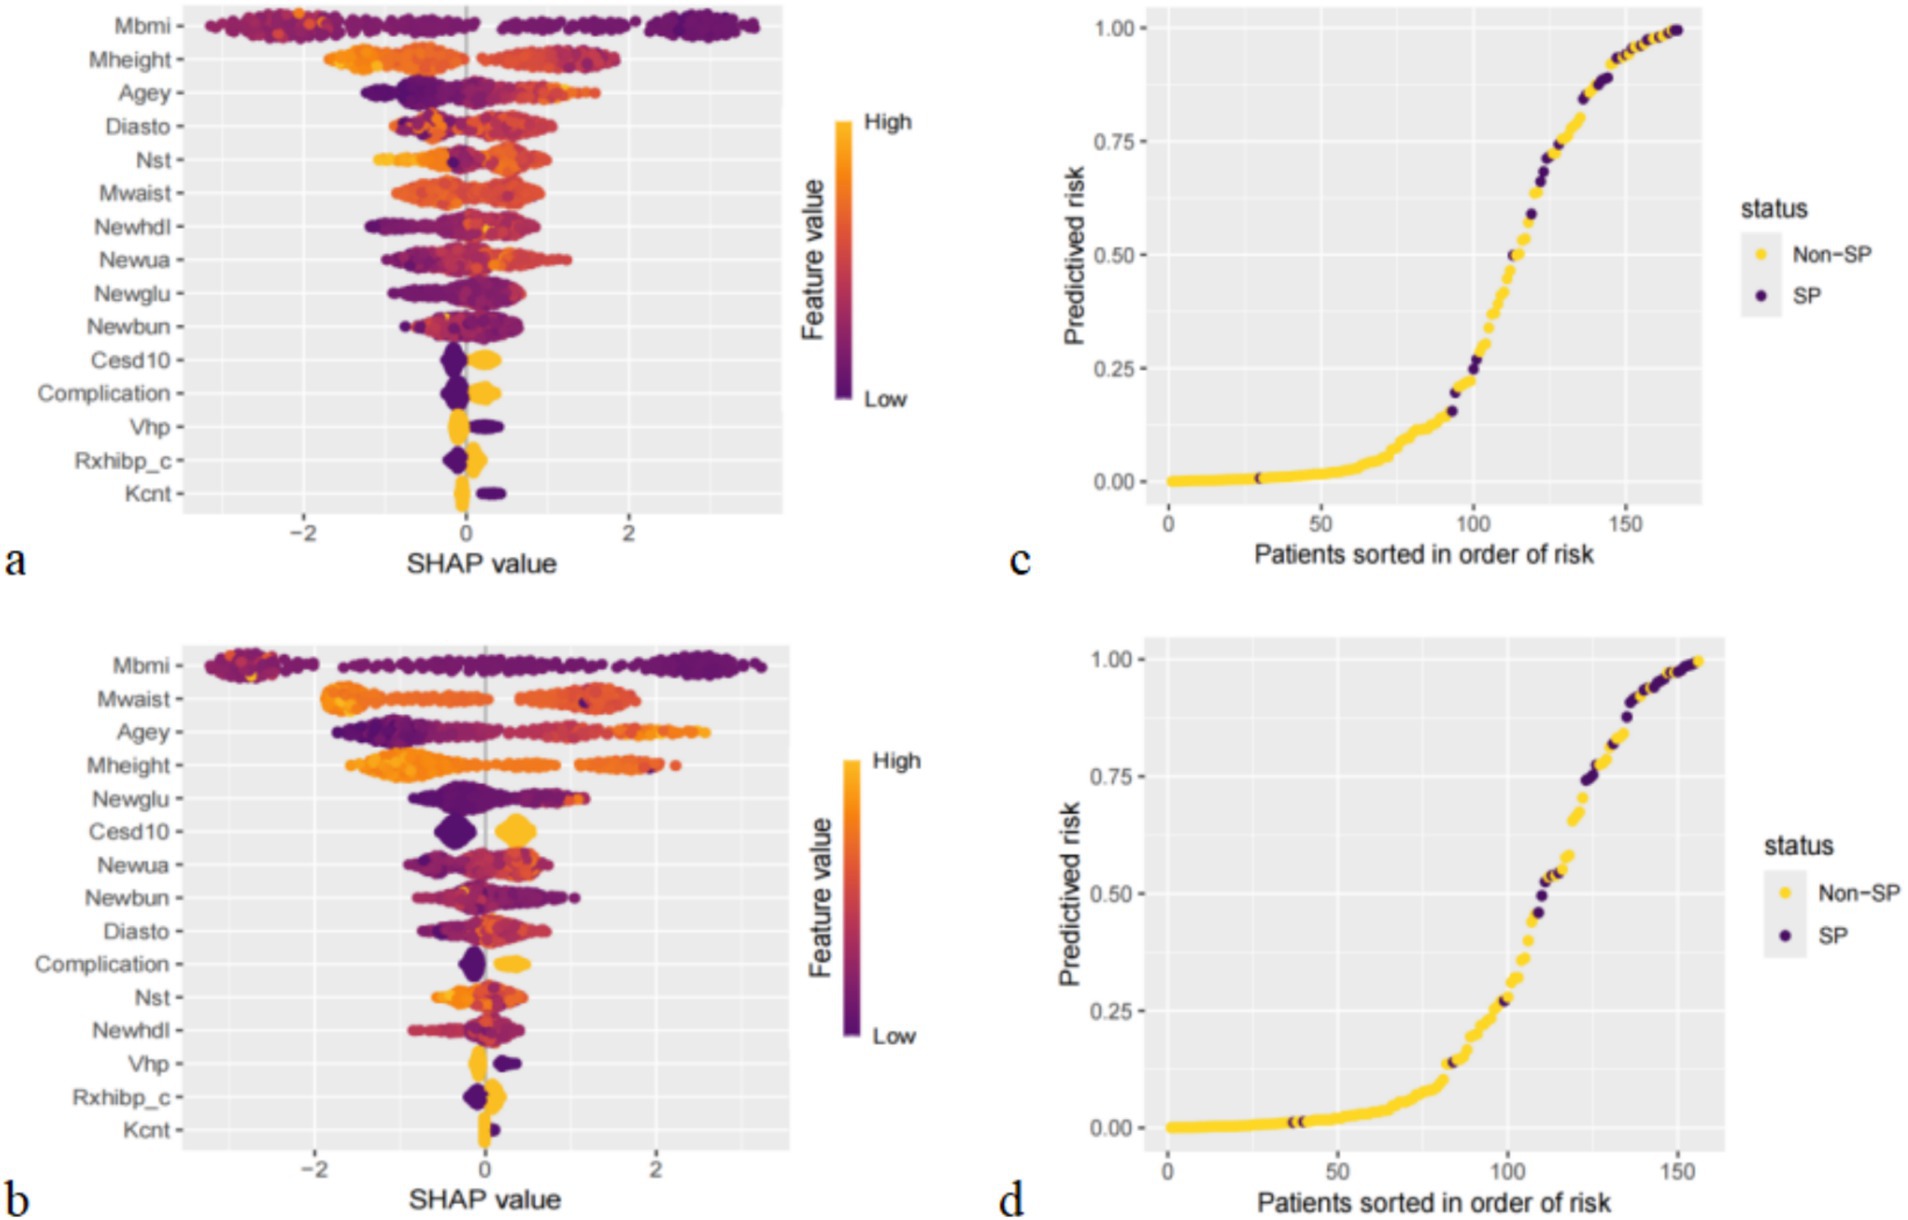
Figure 7. Importance of all screened variables according to the mean (|SHAP value|) for male (a) and female (b), and prediction distributions in participants with SP for male (c) and female (d).
The results of the risk probability scatterplot stratified according to different genders also showed an aggregation of SP in the older adults population with CVD, suggesting that the accuracy of the XGBoost for high-risk and low-risk stratification of different gender groups is also high (Figures 7c,d).
4 Discussion
4.1 Summary and comparison with existing studies
The occurrence of SP in the real world is still not properly and fully recognized clinically, especially in patients with CVD. Our literature review shows that the number of SP patients in CVD is higher than that in diabetes and respiratory diseases (6). In addition, early stroke is particularly likely to be associated with SP (10), suggesting that early diagnosis and intervention are of great importance in the prevention and treatment of SP in the older adults population with CVD.
In the current study, we developed an interpretable diagnostic prediction model for SP in the older adults population with CVD based on factors such as clinical assessment and socio-demographic information, which may be useful for clinicians to predict the risk of SP in CVD patients. Afterward, performance comparisons were made in terms of both calibration and discrimination of the models, and XGBoost had the best overall performance among the four ML models. The ML risk score generated from this model also indicates high accuracy. In addition, SHAP was used to interpret the features in the model both holistically and locally.
Firstly, regarding the clinical aspects, our study found that lower BMI was a relevant factor for the diagnosis of SP in the older adults population with CVD. Previous studies have shown that lower weight older adults are more likely to have a negative impact on nutritional status due to insufficient protein intake, whereas those with a higher BMI consume sufficient protein which may be protective against SP (37). Also, lower heights also have a higher risk of CVD (38) and the perspective that greater height loss is more likely to be diagnosed with SP has been observed in previous cohort studies (39), which is consistent with our findings. Interestingly, waist is also a correlate of SP because high levels of sex hormones stored within waist fat positively affect skeletal muscle (40), which is consistent with our findings.
The absence of adequate blood supply during diastole due to low DBP may affect the nutritional status of the muscle the lower the DBP the more likely it is to develop into SP (41). A meta-analysis (42) mentioned a significant correlation between HBP and SP in older adults, which is similar to the results of our study, which defined taking HBP-related medications as HBP. Our results also showed a significant association between depressive symptoms (43), visual or hearing impairment (44), and having other comorbidities (renal disease, dyslipidemia, diabetes mellitus, and cancer) (45–48) were predictors of SP, which is a recognized finding in previous studies.
Regarding blood tests, we found that BUN associated with kidney function and glucose associated with diabetes may increase the risk of developing SP. Although the current study has not confirmed that BUN and glucose are associated with skeletal muscle, it is hypothesized that they may further increase the prevalence of SP by affecting renal function and the development of diabetes. Miao Lu et al. (49) demonstrated that UA is a potential risk factor for SP in patients with heart failure with preserved ejection fraction (HFpEF), which is consistent with our findings. Meng Wang et al. (50) noted that for every 1-unit increase in HDL levels, there was a 42% increase in the odds of developing SP, and HDL also showed a positive correlation with SP in the current study.
Regarding socio-demographic information, in addition to gender and age mentioned in previous studies (16, 51), we found that any weekly contact with children in person/phone/emails may be a protective factor. Living alone and social isolation were identified as risk factors for SP by Jiaqing Yang (52). In the Chinese CD, many older adults live alone, and they alleviate their loneliness by talking to their children on the phone, which helps to reduce their risk of SP. After that, regarding physical、exercise, and nutritional aspects, the shorter the average hours for one night sleeping time during the past, the more likely it is to develop SP. Ronaldo D. Piovezan (53) pointed out that with age, the decrease in sleep duration and quality favors protein hydrolysis and increases the risk of insulin resistance, which in turn reduces muscle fibers and strength.
The model constructed in this study brings new ideas for personalized treatment of older adults CVD patients. Through accurate risk stratification, appropriate treatment plans can be formulated according to the different levels of low, medium and high, from low-risk life interventions to high-risk intensive treatment, so as to improve the accuracy of treatment and the efficiency of resource utilization.
4.2 Strengths and limitations
Compared with previous studies (54), our work has several advantages. First, considering the possibility of increased sampling error in small, unrepresentative samples, this study used a large Asian-based cohort to increase the accuracy and breadth of the results. Second, the ML model combined with SHAP to analyze the importance and direction of action of each variable in the model helps to identify factors with high impact and improve clinical outcomes through early intervention.
Our study also has limitations. First, in terms of model selection, we did not select deep learning models. In the future, we will try to build deep learning models to predict SP and combine a wider range of data and information for different levels of research. After that, our study lacked external validation from an independent cohort, which may affect the superiority and generalization ability of the model. Finally, in terms of feature selection, we extracted some structured self-reported data and lacked imaging and genetic data. The absence of imaging data, which can visualize muscle morphology and structure (55), and genetic data, which can reflect an individual’s genetic susceptibility (56), may prevent the model from comprehensively capturing the factors affecting the development of SP, thus affecting the accuracy of the prediction. Future studies may consider collecting related data to further improve the prediction model.
5 Conclusion
In an older adult CVD population in a Chinese CD, this study demonstrated the feasibility of using advanced ML methods and easily accessible features for effective prediction of SP risk. The ML-based SP risk prediction model can help physicians identify high-risk older adults CVD patients at an early stage, and combined with SHAP values can guide personalized treatment. At the policy level, this model can be used for mass screening to improve the efficiency of resource allocation, and can also promote relevant policies to facilitate the integration of the technology into the clinic.
Data availability statement
The raw data supporting the conclusions of this article will be made available by the authors, without undue reservation.
Ethics statement
Ethical approval for all the CHARLS waves was granted from the Institutional Review Board at Peking University. The IRB approval number for the main household survey, including anthropometrics, was IRB00001052-11,015; the IRB approval number for biomarker collection, was IRB00001052-11,014. Written informed consent was not required to participate in this study in accordance with the local legislation and institutional requirements.
Author contributions
PY: Conceptualization, Data curation, Formal analysis, Investigation, Validation, Visualization, Writing – original draft, Writing – review & editing. XZ: Investigation, Methodology, Supervision, Writing – original draft. GS: Conceptualization, Investigation, Writing – original draft. PZ: Funding acquisition, Resources, Validation, Visualization, Writing – review & editing. CZ: Investigation, Supervision, Validation, Writing – review & editing. KW: Funding acquisition, Supervision, Validation, Writing – review & editing.
Funding
The author(s) declare that financial support was received for the research and/or publication of this article. This research was supported in part by the Jiangsu Provincial Social Science Foundation General Project (23SHB006), the Research on Philosophy and Social Sciences in Higher Education Institutions in Jiangsu Province (2023SJYB1115), and the Xuzhou Key Research and Development Plan Social Development Project (KC23309).
Acknowledgments
This study is based on the baseline of CHARLS. We would like to thank the CHARLS research team, the field team, and every respondent for their time and efforts that they have devoted to the CHARLS project.
Conflict of interest
The authors declare that the research was conducted in the absence of any commercial or financial relationships that could be construed as a potential conflict of interest.
Generative AI statement
The authors declare that no Gen AI was used in the creation of this manuscript.
Publisher’s note
All claims expressed in this article are solely those of the authors and do not necessarily represent those of their affiliated organizations, or those of the publisher, the editors and the reviewers. Any product that may be evaluated in this article, or claim that may be made by its manufacturer, is not guaranteed or endorsed by the publisher.
Supplementary material
The Supplementary material for this article can be found online at: https://www.frontiersin.org/articles/10.3389/fpubh.2025.1527304/full#supplementary-material
References
1. Evans, MA, Sano, S, and Walsh, K. Cardiovascular disease, aging, and clonal hematopoiesis. Annu Rev Pathol. (2020) 15:419–38. doi: 10.1146/annurev-pathmechdis-012419-032544
2. Zhao, D, Liu, J, Wang, M, Zhang, X, and Zhou, M. Epidemiology of cardiovascular disease in China: current features and implications. Nat Rev Cardiol. (2019) 16:203–12. doi: 10.1038/s41569-018-0119-4
3. Duell, PB, Welty, FK, Miller, M, Chait, A, Hammond, G, Ahmad, Z, et al. Nonalcoholic fatty liver disease and cardiovascular risk: a scientific statement from the American Heart Association. Arterioscler Thromb Vasc Biol. (2022) 42:e168–85. doi: 10.1161/atv.0000000000000153
4. Higbee, DH, Granell, R, Sanderson, E, Davey Smith, G, and Dodd, JW. Lung function and cardiovascular disease: a two-sample Mendelian randomisation study. Eur Respir J. (2021) 58:2003196. doi: 10.1183/13993003.03196-2020
5. Damluji, AA, Alfaraidhy, M, Alhajri, N, Rohant, NN, Kumar, M, Al Malouf, C, et al. Sarcopenia and cardiovascular diseases. Circulation. (2023) 147:1534–53. doi: 10.1161/circulationaha.123.064071
6. Sasaki, KI, and Fukumoto, Y. Sarcopenia as a comorbidity of cardiovascular disease. J Cardiol. (2022) 79:596–604. doi: 10.1016/j.jjcc.2021.10.013
7. Rosenberg, IH. Sarcopenia: origins and clinical relevance. J Nutr. (1997) 127:990s–1s. doi: 10.1093/jn/127.5.990S
8. Chen, LK, Woo, J, Assantachai, P, Auyeung, TW, Chou, MY, Iijima, K, et al. Asian working Group for Sarcopenia: 2019 consensus update on sarcopenia diagnosis and treatment. J Am Med Dir Assoc. (2020) 21:300–307.e2. doi: 10.1016/j.jamda.2019.12.012
9. He, N, Zhang, Y, Zhang, L, Zhang, S, and Ye, H. Relationship between sarcopenia and cardiovascular diseases in the elderly: an overview. Front Cardiovasc Med. (2021) 8:743710. doi: 10.3389/fcvm.2021.743710
10. Su, Y, Yuki, M, and Otsuki, M. Prevalence of stroke-related sarcopenia: a systematic review and meta-analysis. J Stroke Cerebrovasc Dis. (2020) 29:105092. doi: 10.1016/j.jstrokecerebrovasdis.2020.105092
11. Zuo, X, Li, X, Tang, K, Zhao, R, Wu, M, Wang, Y, et al. Sarcopenia and cardiovascular diseases: a systematic review and meta-analysis. J Cachexia Sarcopenia Muscle. (2023) 14:1183–98. doi: 10.1002/jcsm.13221
12. Yin, J, Lu, X, Qian, Z, Xu, W, and Zhou, X. New insights into the pathogenesis and treatment of sarcopenia in chronic heart failure. Theranostics. (2019) 9:4019–29. doi: 10.7150/thno.33000
13. Zhang, H, Yin, M, Liu, Q, Ding, F, Hou, L, Deng, Y, et al. Machine and deep learning-based clinical characteristics and laboratory markers for the prediction of sarcopenia. Chin Med J. (2023) 136:967–73. doi: 10.1097/cm9.0000000000002633
14. Gonzalez, MC, Barbosa-Silva, TG, and Heymsfield, SB. Bioelectrical impedance analysis in the assessment of sarcopenia. Curr Opin Clin Nutr Metab Care. (2018) 21:366–74. doi: 10.1097/mco.0000000000000496
15. Turimov Mustapoevich, D, and Kim, W. Machine learning applications in sarcopenia detection and management: a comprehensive survey. Healthcare. (2023) 11:2483. doi: 10.3390/healthcare11182483
16. Li, R, Lin, S, Tu, J, Chen, Y, Cheng, B, Mo, X, et al. Establishment and evaluation of a novel practical tool for the diagnosis of pre-sarcopenia in young people with diabetes mellitus. J Transl Med. (2023) 21:393. doi: 10.1186/s12967-023-04261-w
17. Ishii, S, Tanaka, T, Shibasaki, K, Ouchi, Y, Kikutani, T, Higashiguchi, T, et al. Development of a simple screening test for sarcopenia in older adults. Geriatr Gerontol Int. (2014) 14:93–101. doi: 10.1111/ggi.12197
18. Chung, H, Jo, Y, Ryu, D, Jeong, C, Choe, SK, and Lee, J. Artificial-intelligence-driven discovery of prognostic biomarker for sarcopenia. J Cachexia Sarcopenia Muscle. (2021) 12:2220–30. doi: 10.1002/jcsm.12840
19. Genuer, R, and Poggi, J M. Random forests with R. Rennes: Universitaires de Rennes Press. (2020).
20. Brereton, RG, and Lloyd, GR. Support vector machines for classification and regression. Analyst. (2010) 135:230–67. doi: 10.1039/b918972f
22. Zhao, Y, Hu, Y, Smith, JP, Strauss, J, and Yang, G. Cohort profile: the China health and retirement longitudinal study (CHARLS). Int J Epidemiol. (2014) 43:61–8. doi: 10.1093/ije/dys203
23. Hu, Y, Peng, W, Ren, R, Wang, Y, and Wang, G. Sarcopenia and mild cognitive impairment among elderly adults: the first longitudinal evidence from CHARLS. J Cachexia Sarcopenia Muscle. (2022) 13:2944–52. doi: 10.1002/jcsm.13081
24. Gao, K, Cao, LF, Ma, WZ, Gao, YJ, Luo, MS, Zhu, J, et al. Association between sarcopenia and cardiovascular disease among middle-aged and older adults: findings from the China health and retirement longitudinal study. EClinicalMedicine. (2022) 44:101264. doi: 10.1016/j.eclinm.2021.101264
25. Wen, X, Wang, M, Jiang, CM, and Zhang, YM. Anthropometric equation for estimation of appendicular skeletal muscle mass in Chinese adults. Asia Pac J Clin Nutr. (2011) 20:551–6.
26. Yang, M, Hu, X, Wang, H, Zhang, L, Hao, Q, and Dong, B. Sarcopenia predicts readmission and mortality in elderly patients in acute care wards: a prospective study. J Cachexia Sarcopenia Muscle. (2017) 8:251–8. doi: 10.1002/jcsm.12163
27. Wu, X, Li, X, Xu, M, Zhang, Z, He, L, and Li, Y. Sarcopenia prevalence and associated factors among older Chinese population: findings from the China health and retirement longitudinal study. PLoS One. (2021) 16:e0247617. doi: 10.1371/journal.pone.0247617
28. Liang, S, Chen, Y, Sun, X, Dong, X, He, G, Pu, Y, et al. Long-term exposure to ambient ozone and cardiovascular diseases: evidence from two national cohort studies in China. J Adv Res. (2023) 62:165–73. doi: 10.1016/j.jare.2023.08.010
29. Shi, Z, Tuomilehto, J, Kronfeld-Schor, N, Alberti, GK, Stern, N, el-Osta, A, et al. The circadian syndrome predicts cardiovascular disease better than metabolic syndrome in Chinese adults. J Intern Med. (2021) 289:851–60. doi: 10.1111/joim.13204
30. Zhang, Z. Multiple imputation with multivariate imputation by chained equation (MICE) package. Ann Trans Med. (2016) 4:30. doi: 10.3978/j.issn.2305-5839.2015.12.63
31. Chen, T, and Guestrin, C. XGBoost: a scalable tree boosting system. Proceedings of the 22nd ACM SIGKDD international conference on knowledge discovery and data mining. San Francisco, CA: Association for Computing Machinery. (2016). p. 785–794.
32. Wang, Z, Wu, C, Zheng, K, Niu, X, and Wang, X. SMOTETomek-based resampling for personality recognition. IEEE Access. (2019) 7:–129689. doi: 10.1109/ACCESS.2019.2940061
33. Wang, K, Tian, J, Zheng, C, Yang, H, Ren, J, Li, C, et al. Improving risk identification of adverse outcomes in chronic heart failure using SMOTE+ENN and machine learning. Risk Manag Healthc Policy. (2021) 14:2453–63. doi: 10.2147/rmhp.S310295
34. Moons, KG, Altman, DG, Reitsma, JB, Ioannidis, JP, Macaskill, P, Steyerberg, EW, et al. Transparent reporting of a multivariable prediction model for individual prognosis or diagnosis (TRIPOD): explanation and elaboration. Ann Intern Med. (2015) 162:W1–W73. doi: 10.7326/m14-0698
35. Lundberg, S, and Lee, S I. A unified approach to interpreting model predictions. (2017). doi: 10.48550/arXiv.1705.07874
36. Lundberg, S M, Erion, G G, and Lee, S I. Consistent individualized feature attribution for tree ensembles. (2018). doi: 10.48550/arXiv.1802.03888
37. Cheng, Q, Zhu, X, Zhang, X, Li, H, du, Y, Hong, W, et al. A cross-sectional study of loss of muscle mass corresponding to sarcopenia in healthy Chinese men and women: reference values, prevalence, and association with bone mass. J Bone Miner Metab. (2014) 32:78–88. doi: 10.1007/s00774-013-0468-3
38. Nüesch, E, Dale, C, Palmer, TM, White, J, Keating, BJ, van Iperen, EPA, et al. Adult height, coronary heart disease and stroke: a multi-locus Mendelian randomization meta-analysis. Int J Epidemiol. (2016) 45:1927–37. doi: 10.1093/ije/dyv074
39. Ji, S, Lee, E, Kim, BJ, Baek, JY, Yi, Y, Jang, IY, et al. Height loss as an indicator of ageing through its association with frailty and sarcopenia: an observational cohort study. Arch Gerontol Geriatr. (2023) 110:104916. doi: 10.1016/j.archger.2022.104916
40. Yoo, MC, Won, CW, and Soh, Y. Association of high body mass index, waist circumference, and body fat percentage with sarcopenia in older women. BMC Geriatr. (2022) 22:937. doi: 10.1186/s12877-022-03643-x
41. Zhang, XZ, Xie, WQ, Chen, L, Xu, GD, Wu, L, Li, YS, et al. Blood flow restriction training for the intervention of sarcopenia: current stage and future perspective. Front Med. (2022) 9:894996. doi: 10.3389/fmed.2022.894996
42. Quan, Y, Wang, C, Wang, L, and Li, G. Geriatric sarcopenia is associated with hypertension: a systematic review and meta-analysis. J Clin Hypertens. (2023) 25:808–16. doi: 10.1111/jch.14714
43. Li, Z, Tong, X, Ma, Y, Bao, T, and Yue, J. Prevalence of depression in patients with sarcopenia and correlation between the two diseases: systematic review and meta-analysis. J Cachexia Sarcopenia Muscle. (2022) 13:128–44. doi: 10.1002/jcsm.12908
44. Ho, KC, Gupta, P, Fenwick, EK, Man, REK, Gan, ATL, and Lamoureux, EL. Association between age-related sensory impairment with sarcopenia and its related components in older adults: a systematic review. J Cachexia Sarcopenia Muscle. (2022) 13:811–23. doi: 10.1002/jcsm.12930
45. Xia, L, Zhao, R, Wan, Q, Wu, Y, Zhou, Y, Wang, Y, et al. Sarcopenia and adverse health-related outcomes: an umbrella review of meta-analyses of observational studies. Cancer Med. (2020) 9:7964–78. doi: 10.1002/cam4.3428
46. Liccini, A, and Malmstrom, TK. Frailty and sarcopenia as predictors of adverse health outcomes in persons with diabetes mellitus. J Am Med Dir Assoc. (2016) 17:846–51. doi: 10.1016/j.jamda.2016.07.007
47. Bi, B, Dong, X, Yan, M, Zhao, Z, Liu, R, Li, S, et al. Dyslipidemia is associated with sarcopenia of the elderly: a meta-analysis. BMC Geriatr. (2024) 24:181. doi: 10.1186/s12877-024-04761-4
48. Ribeiro, HS, Neri, SGR, Oliveira, JS, Bennett, PN, Viana, JL, and Lima, RM. Association between sarcopenia and clinical outcomes in chronic kidney disease patients: a systematic review and meta-analysis. Clin Nutr. (2022) 41:1131–40. doi: 10.1016/j.clnu.2022.03.025
49. Lu, M, Li, Y, Pan, Y, Ding, Y, Wang, K, and Xu, D. Relationship between serum uric acid and sarcopenia in geriatric heart failure patients with preserved ejection fraction. Exp Gerontol. (2024) 191:112445. doi: 10.1016/j.exger.2024.112445
50. Wang, M, Yang, Z, and Zhai, H. Association of high-density lipoprotein cholesterol with sarcopenia in Chinese community-dwelling middle-aged and older adults: evidence from 4-year longitudinal study from the CHARLS. Gerontology. (2024) 70:812–22. doi: 10.1159/000538980
51. Luo, X, Ding, H, Broyles, A, Warden, SJ, Moorthi, RN, and Imel, EA. Using machine learning to detect sarcopenia from electronic health records. Digital Health. (2023) 9:20552076231197098. doi: 10.1177/20552076231197098
52. Yang, J, Huang, J, Yang, X, Li, S, Wu, X, and Ma, X. The association of living alone and social isolation with sarcopenia: a systematic review and meta-analysis. Ageing Res Rev. (2023) 91:102043. doi: 10.1016/j.arr.2023.102043
53. Piovezan, RD, Abucham, J, Dos Santos, RV, Mello, MT, Tufik, S, Poyares, D, et al. The impact of sleep on age-related sarcopenia: possible connections and clinical implications. Ageing Res Rev. (2015) 23:210–20. doi: 10.1016/j.arr.2015.07.003
54. Yin, G, Qin, J, Wang, Z, Lv, F, and Ye, X. A nomogram to predict the risk of sarcopenia in older people. Medicine. (2023) 102:e33581. doi: 10.1097/md.0000000000033581
55. Albano, D, Messina, C, Vitale, J, and Sconfienza, LM. Imaging of sarcopenia: old evidence and new insights. Eur Radiol. (2020) 30:2199–208. doi: 10.1007/s00330-019-06573-2
56. Chen, S, Han, H, Jin, J, Zhou, G, and Li, Z. Osteoarthritis and sarcopenia-related traits: the cross-sectional study from NHANES 2011-2014 and Mendelian randomization study. J Orthop Surg Res. (2023) 18:502. doi: 10.1186/s13018-023-03960-w
Glossary
CVD - Cardiovascular disease
SP - Sarcopenia
HBP - High blood pressure
CHD - Coronary heart disease
BIA - Bioimpedance analysis
CT - Computed tomography
ML - Machine learning
CHARLS - China Health and Retirement Longitudinal Study
CAPI - Computer-assisted personal interviews
ASM - Appendicular skeletal muscle mass
LR - Logistic regression
SVM - Support vector machine
RF - Random forest
XGBoost - Extreme gradient boosting
SMOTE - Synthetic minority oversampling technique
AUC - Area under the receiver operating characteristic curve
SHAP - SHapley additive exPlanations
CESD - Center for Epidemiologic Studies Depression Scale
BUN - Blood Urea Nitrogen
DBP - Diastolic blood pressure
BMI - Body mass index
UA - Uric acid
Keywords: sarcopenia, CHARLS, cardiovascular disease, SHAP, diagnostic performance
Citation: Yu P, Zhang X, Sun G, Zeng P, Zheng C and Wang K (2025) Sarcopenia prediction model based on machine learning and SHAP values for community-based older adults with cardiovascular disease in China. Front. Public Health. 13:1527304. doi: 10.3389/fpubh.2025.1527304
Edited by:
Diogo Luís Marques, University of Beira Interior, PortugalReviewed by:
Chang Won Jeong, Wonkwang University, Republic of KoreaMack Shelley, Iowa State University, United States
Copyright © 2025 Yu, Zhang, Sun, Zeng, Zheng and Wang. This is an open-access article distributed under the terms of the Creative Commons Attribution License (CC BY). The use, distribution or reproduction in other forums is permitted, provided the original author(s) and the copyright owner(s) are credited and that the original publication in this journal is cited, in accordance with accepted academic practice. No use, distribution or reproduction is permitted which does not comply with these terms.
*Correspondence: Ke Wang, eHptdXdrQHh6aG11LmVkdS5jbg==