 Astrid Pozet
 Antoine Falcoz2
 Aurelia Meurisse
- 1CHU de Besançon, Délégation à la Recherche Clinique et à l’Innovation, Besançon, France
- 2CHU de Besançon, INSERM, EFS-BFC, UMR 1098, Methodological and Quality of Life in Oncology Unit, Besançon, France
- 3CHU de Besançon, Centre investigation Clinique, Besançon, France
- 4CHU de Besançon, Pôle Pharmacie, Besançon, France
- 5Université de Franche-Comté, CHU Besançon, INSERM, EFS-BFC, UMR 1098, Pôle Pharmacie, Besançon, France
Objectives: This study aimed to assess health state utility values (HSUVs) in caregivers of older patients with chronic diseases receiving or not receiving social worker support.
Methods: This multicentric open-label randomized study assigned caregivers to receive either an informational booklet alone or one accompanied by social worker support. Caregivers completed EQ-5D-3L each semester for 24 months. We reported caregiver HSUVs at baseline and after 6, 12, 18, and 24 months using EQ-5D-3L utility index scores and exploring their time to deterioration (TTD).
Results: Among 179 included caregivers, the percentage reporting some or extreme problems on five EQ-5D-3L dimensions remained almost stable over time with a median EQ-5D-3L utility index score of 0.89 [0.80–1.00] at baseline (n = 177), 0.80 [0.80–0.89] at M6 (n = 125), and 0.80 [0.73–0.91] at M24 (n = 81). Among the respondents, 62% (n = 109) experienced a deterioration in EQ-5D-3L utility index score, with a median TTD of 9.1 months [95%CI 6.2–14.9] in the control group (CG) and 9.5 months [6.3–14.4] in the supportive intervention group (SIG) (HR = 1.06 [0.73–1.54]), p-value = 0.76.
Conclusion: Our study provides a catalog of HSUVs across different caregiver profiles and at various follow-up time points, which can inform future economic evaluations.
Clinical trial registration: ClinicalTrials.gov, NCT02626377.
Introduction
Informal caregivers’ health-related quality of life (HRQoL) is closely related to the HRQoL of the person they are helping (1, 2). From initial diagnosis to successive phases of stabilization, remission, or progressive decline and palliation, caregiving requires profound changes in the caregiver’s lifestyle, impacting physical, emotional, and social wellbeing. As caregivers navigate these phases, they face practical, organizational, and economic challenges that can significantly affect their HRQoL (3, 4). As part of the overall concept of QoL, monitoring caregiver anxiety, depression symptoms, and burden is of particular importance, and their related scores are useful for detecting early signs of mental health deterioration (5, 6). These scores are used to help caregivers further preserve their wellbeing or prevent health deterioration, which could subsequently jeopardize their ability to care for themselves and the patient. The French multicenter open-label randomized study of Informal Carers of Older people patients (ICE study) showed that depression statistically significantly increased over time [1.4 ± 4.0 between baseline and 12 months (p-value = 0.01) and 1.7 ± 4.1 between baseline and 24 months (p-value = 0.02)] among the 89 informal caregivers of older patients with chronic diseases randomized in the control group (not receiving social support) (7, 8).
Despite the recognized impact of caregiving on HRQoL, there is a lack of studies assessing the economic burden and the long-term consequences of caregiving on informal caregivers of patients with chronic diseases, even though they are essential for rational decision-making in healthcare (9–14). A major challenge in economic evaluation is to provide cost-effectiveness data that are relevant to daily practice and that may optimize the use of healthcare resources. Cost–utility analysis is recommended when HRQoL is identified as an important health effect of the compared interventions (15). Health outcome is measured by the length of life weighted by a valuation of the HRQoL, for instance, via the EuroQOL-5 dimensions instrument (EQ-5D), represented by health-state utility values (HSUVs), to produce quality-adjusted life years (QALYs). The HSUVs range from 1 (best imaginable health state, i.e., perfect health) to 0 (worst imaginable health state, i.e., death) using patient preference-based measures (16, 17).
To our knowledge, no study has specifically evaluated the impact of any intervention on changes in HSUVs over time among informal caregivers. The time-to-HRQoL score deterioration (TTD) approach could provide clinicians with relevant and meaningful data that are more likely to influence clinical decision-making (18).
To address this gap, based on data collected for each informal caregiver included in the ICE study, the primary aim of the present study was to assess their HSUVs at baseline and after 6, 12, 18, and 24 months, depending on whether informal caregivers received social worker support. The secondary aims were to investigate the TTD as well as factors associated with changes in HSUVs.
Methods
Design and study population
As previously presented, informal caregivers included in the ICE study were ≥18 years, identified by the patient or self-identified as the primary caregiver, not employed by a healthcare organization, and residing in the French region Burgundy-Franche-Comté (7, 8). The caregivers supported patients aged ≥60 years with neurodegenerative disease (idiopathic Parkinson’s or Alzheimer’s disease), cancer (breast, prostate, or colorectal), age-related macular degeneration, or neurovascular disease (stroke). Informal caregivers of patients living in institutions and caregivers under legal protection were not included. As previously detailed, they were randomly assigned (1:1 ratio) to receive an information booklet and the intervention from a social worker in the supportive intervention group (SIG) or to exclusively receive an information booklet in the control group (CG) (8). Randomization was conducted by the data manager with an interactive web response system, using the minimization technique with stratification according to center, age (80 years or older versus below 80 years), gender, and stage (severity of the disease). Investigators and caregivers were not masked for group allocation. The theoretical framework justifying social worker interventions is to prevent caregiver QoL deterioration and to better support their involvement and communication, thereby contributing to preserving the quality of care provided to the patient. Social worker intervention used the Linear Analogue Scale Assessment (LASA) questionnaire and semi-directive interviews to support the emergence of caregiver needs and specifically address their needs through counseling regarding home services, medical home care, community services (support group), proposing services to promote safety and assist with daily needs (meal delivery, medical alert service), counseling from a psychologist, admission of caregivers for respite care, and encouraging caregivers to take care of themselves and regularly attend consultation with their physician. Interventions from social workers were scheduled at 6, 12, 18, and 24 months (M6, M12, M18, and M24). The inclusion consisted of a 1-h visit to the caregiver’s home, aimed at evaluating the level of difficulties experienced by the caregiver using the LASA questionnaire and assessing caregiver needs. The visit also aimed to detect early signs of burden through a standardized semi-structured interview. The booklets provided access to relevant external assistance structures and support programs and included information regarding local legislation, administrative procedures, daily living management, and potential consequences related to the caregiving role.
Due to low recruitment and despite several amendments, the initially planned sample size was unachievable. Therefore, the final sample size of the ICE study did not allow for the statistical analyses initially planned, particularly lacking the power to directly compare both groups (7).
Health-state utility value elicitation
HSUVs were elicited using the three-level version of the EuroQOL-5 dimensions instrument (EQ-5D-3L), a validated generic multi-attribute utility instrument (19). This generic preference-based measure is recommended in many jurisdictions, such as France (15). Designed as a self-completion questionnaire to describe HRQoL, it comprises five dimensions: mobility, self-care, usual activities, pain/discomfort, and anxiety/depression. Each of these dimensions can take one of the three response levels reflecting severity: no problems, some problems, and extreme problems. The EuroQOL-5D visual analog scale (EQ VAS) complements the EQ-5D descriptive system and records the respondent’s self-rated health on a vertical scale ranging from 0 (worst imaginable health state) to 100 (best imaginable health state). EQ-5D-3L was self-administered to all informal caregivers according to the predefined schedule in the ICE protocol, at baseline, then every 3 months, and up to 24 months (7).
Endpoints
The primary endpoint was the EQ-5D-3L utility index scores calculated using a specific French time trade-off-derived value set developed by Chevalier et al. (20). Secondary endpoints included EQ VAS, TTD, and associated factors.
Statistical analyses
All analyses were performed using a modified intention-to-treat principle, i.e., including all informal caregivers allocated to randomization and randomized with a calculated EQ-5D-3L utility index score at baseline, i.e., at inclusion. They included all data available at each considered follow-up time point.
The number and the percentage of informal caregivers reporting each level of problem on each item of the EQ-5D-3L were described at baseline, M6, M12, M18, and M24 in the overall population (21). The EQ-5D-3L utility index scores and EQ VAS were described by the median and the interquartile range (i.e., the region between the 25th and 75th percentile) [IQR] in the overall population, in each group, i.e., SIG and CG, and for each potential predictive factor, at M6, M12, M18, and M24. Both were also described by the mean and the standard deviation in the overall population. No statistical comparisons of EQ-5D-3L utility index scores between different measurement times were conducted due to the limited sample size.
Derived from the literature, the TTD of the EQ-5D-3L utility index score was defined as the time interval from inclusion to the occurrence of a decrease of at least 0.08 points of the EQ-5D-3L utility index score compared to baseline (22). TTD of EQ VAS was defined as the time interval from inclusion to the occurrence of a first decrease of at least 7 points of the EQ VAS compared to baseline (22). Informal caregivers with no follow-up EQ-5D-3L were censored 1 day after their inclusion. Informal caregivers with no deterioration observed before their drop-out were censored at the time the last EQ-5D-3L was completed. The TTD curves were estimated using the Kaplan–Meier method and described using the median and 95% confidence intervals (CIs).
Baseline parameters collected at inclusion were explored to identify their association with TTD, among which parameters related to patients included gender, age, and disease and caregivers included gender, age, marital status, living situation, relationship with patient, professional situation, and household incomes. The analyses of associated factors of TTD were performed using a 2-step approach. First, the association of potential predictive factors with TTD was examined using the univariate Cox proportional hazards regression model. Second, all variables with a p-value of < 0.15 in the univariate analysis and the group parameter was entered in a multivariate model. Quantitative and qualitative variables were transformed, whenever possible, into dichotomic variables using different successive cutoff points. The results of univariate and multivariate analyses are presented with the hazard ratio (HR), 95% confidence intervals [95% CIs], and p-values.
Mixed models for repeated measures were used, including all time points of up to M24 and including the following effects: randomization group, time, allocation-by-time interaction, adjustment to baseline score, and baseline score-by-time interaction. Random effects on intercept and time were used to reflect individual variations. Adjusted mean changes at M12 and M24 were reported with a 95% confidence interval for EQ-5D-3L utility index score and EQ VAS in each group. Statistically and minimally important differences in clinical significance were indicated.
Statistical analyses were performed using SAS version 9.4 (SAS Institute Inc., Cary, NC, USA). p-values of <0.05 were considered statistically significant and provided for exploratory purposes, with all tests being two-sided.
Results
From October 2015 to May 2019, 183 caregivers were recruited, and 179 were randomly assigned to the SIG (n = 90) or the CG (n = 89). Among them, 177 (99%) completed the EQ-5D-3L at baseline, including 177 caregivers (99%) with an EQ-5D-3L utility index score and 174 (97%) with an EQ VAS (Figure 1). The completion rates reached reliable percentages (mainly >70%) at all follow-up time points. In the SIG, the completion rates of EQ-5D-3L were 56 out of 75 (75%) and 43 out of 56 (77%) at M12 and M24, respectively, and in the CG, 52 out of 77 (68%) and 38 out of 57 (67%) at M12 and M24, respectively.
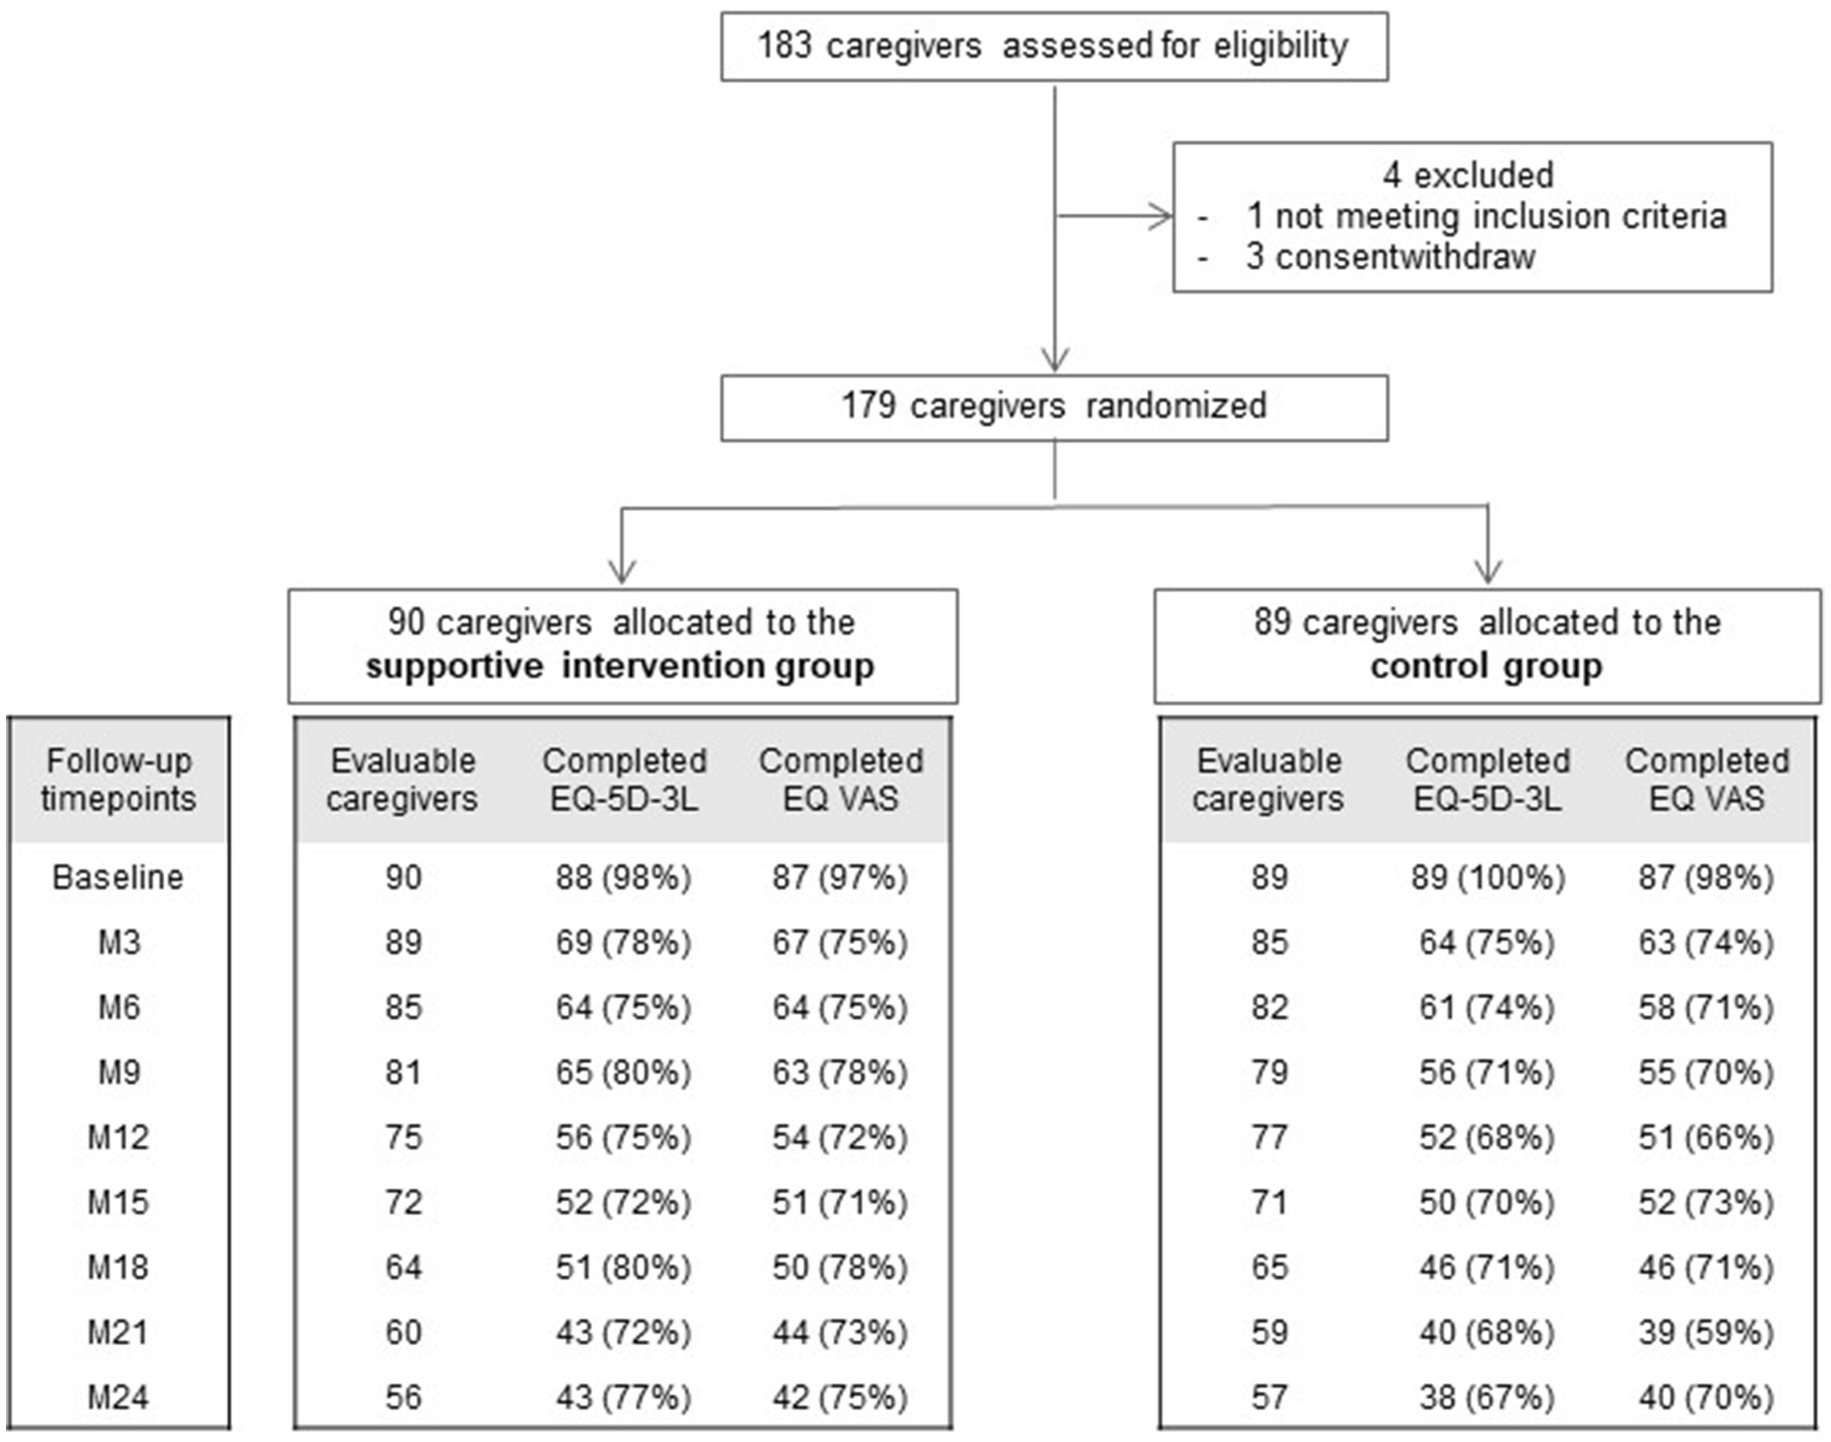
Figure 1. Trial profile (France, 2015–2019). M, month.
Health profiles, EQ-5D-3L utility index scores, and EQ VAS
At baseline, few informal caregivers reported some or extreme problems with mobility (n = 21, 12%), self-care (n = 0, 0%), and usual activities (n = 18, 10%) dimensions (Table 1). Almost two thirds (n = 113, 64%) and half (n = 84, 47%) reported some or extreme problems on the pain/discomfort and anxiety/depression dimensions respectively. The percentage of informal caregivers reporting some or extreme problems on five dimensions has remained almost stable over time: (1) the EQ-5D-3L utility index score with a median of 0.89 [0.80–1.00] at baseline and 0.80 [0.80–0.89] at M6 (n = 125) or 0.80 [0.73–0.91] at M24 (n = 81), and (2) EQ VAS with a median of 75 [60–85] at baseline and 75 [60–85] at M6 (n = 122) or 70 [70–80] at M24 (n = 82). The EQ-5D-3L utility index score also remained almost stable over time regardless of all parameters collected at baseline (Table 2).
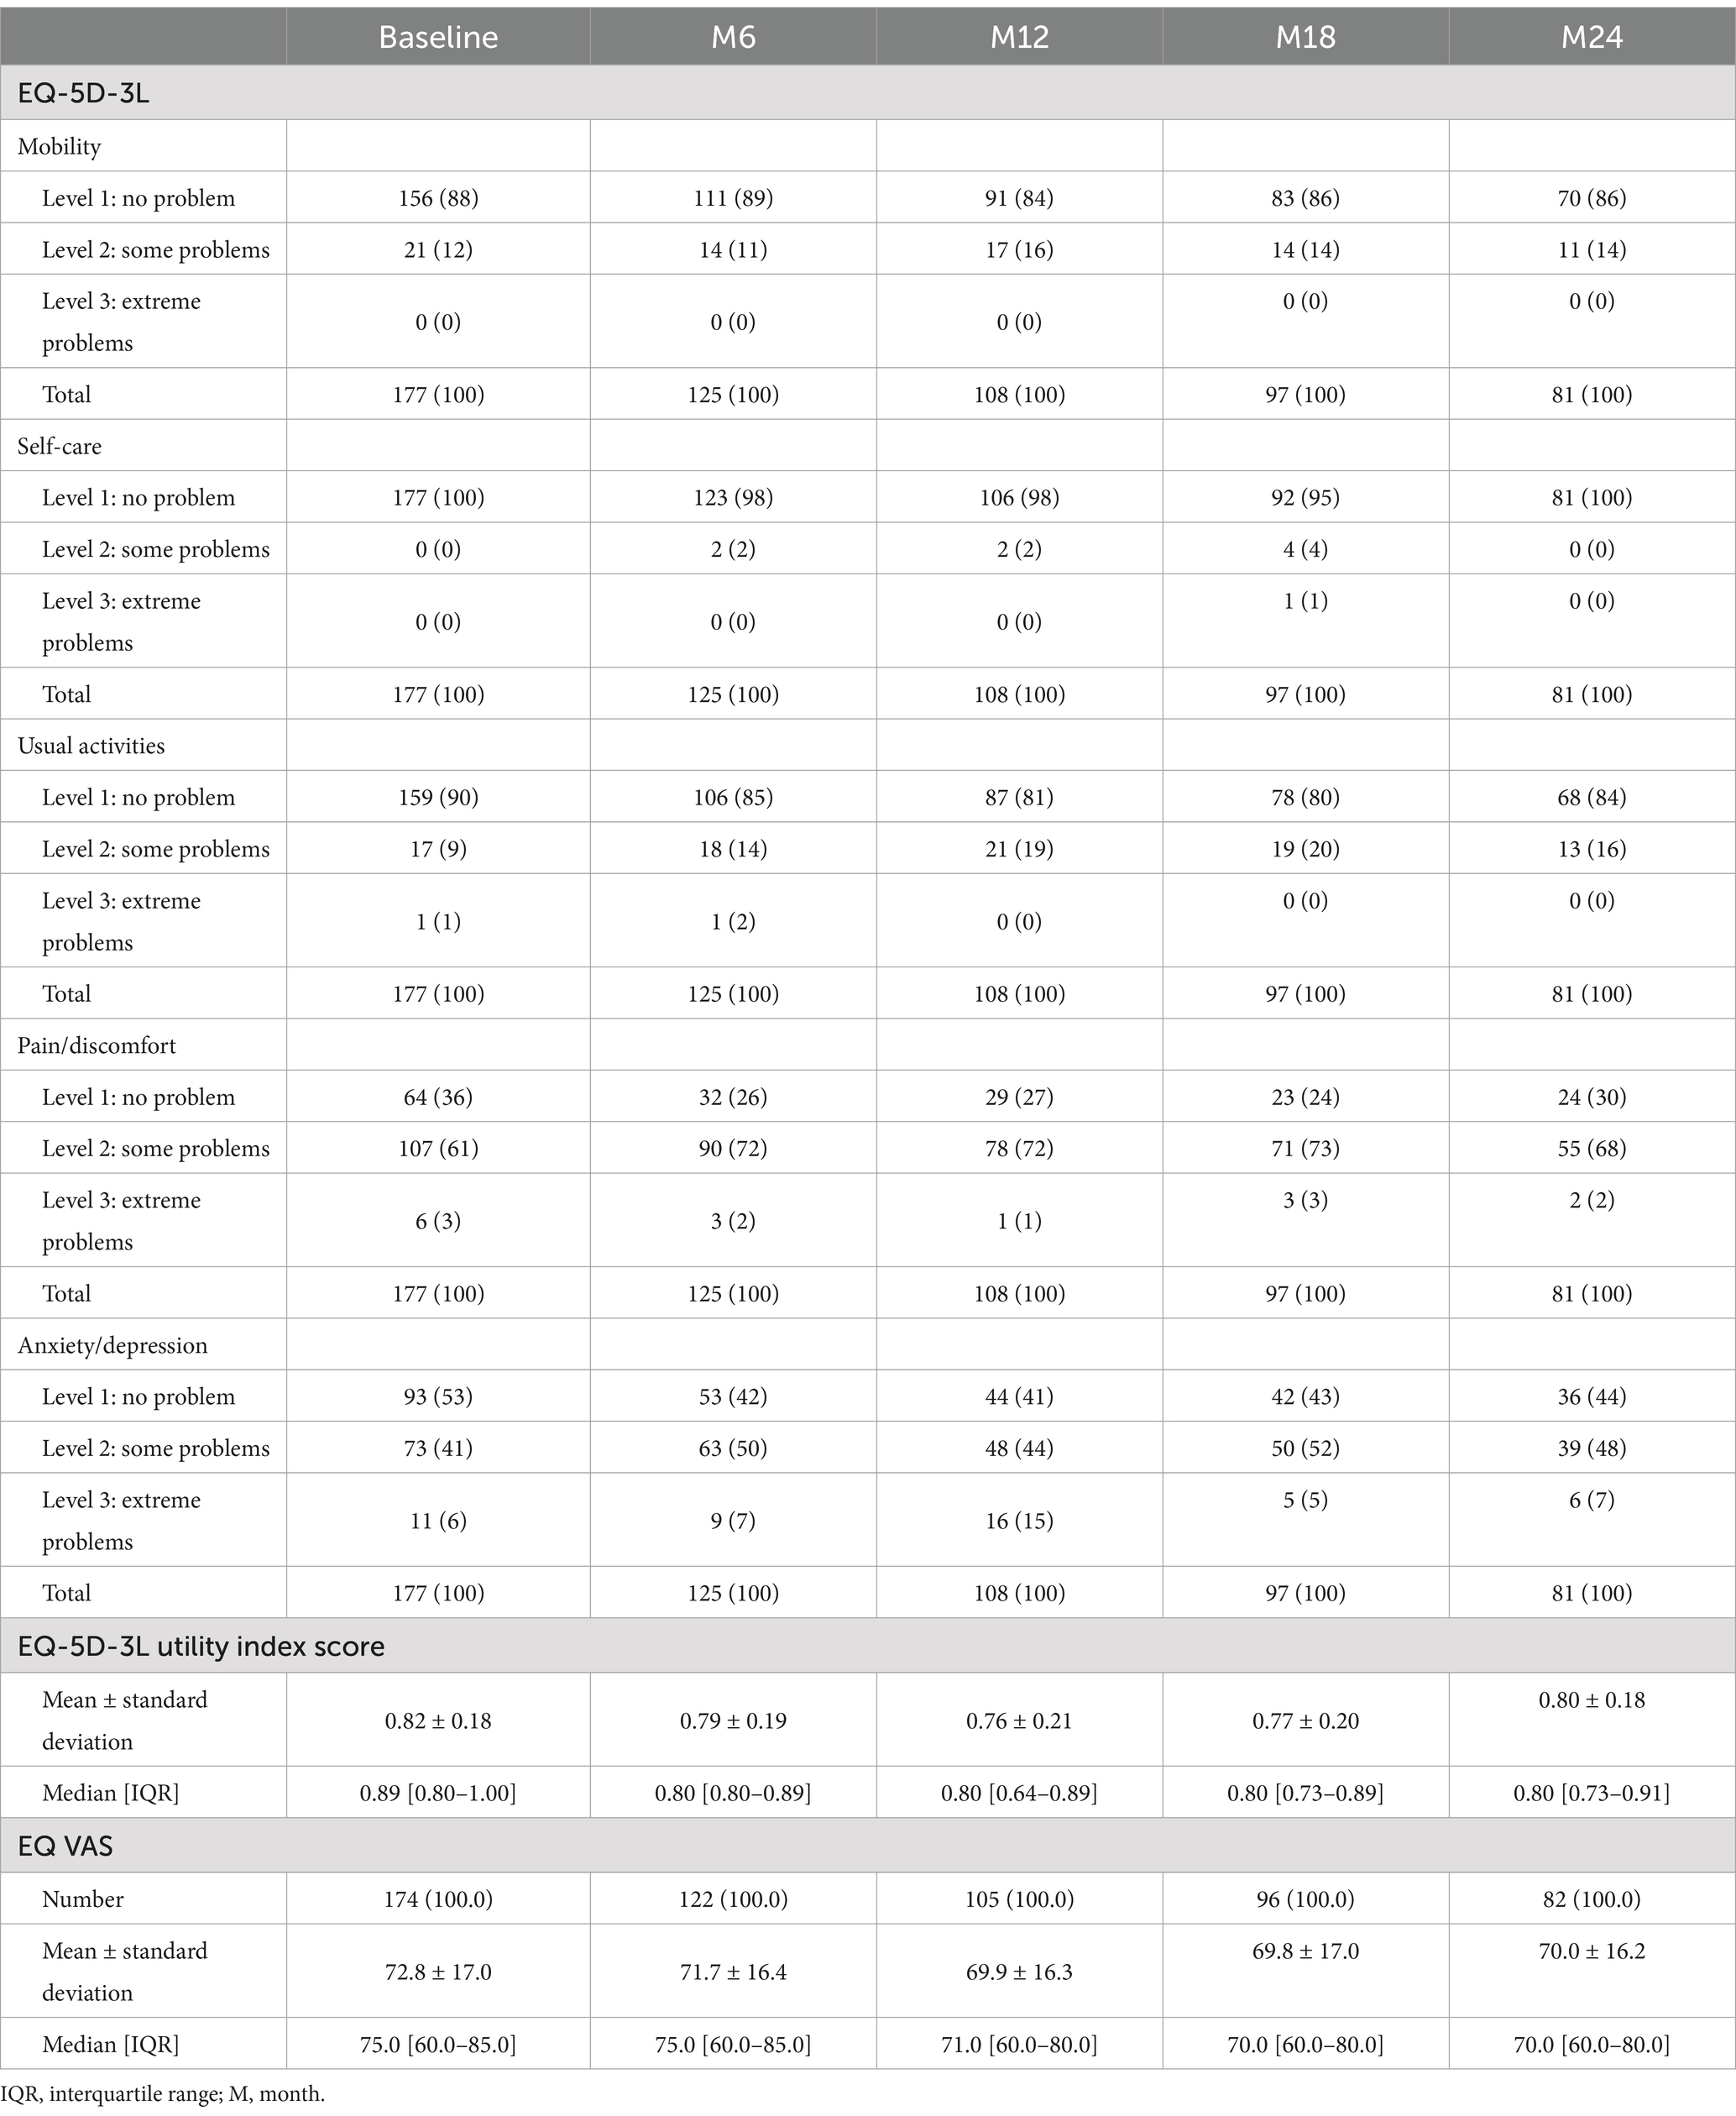
Table 1. Number and percentage of caregivers’ responses to the EQ-5D-3L and EQ-5D-3L utility score and EQ VAS mean and median at each time-point of assessment (France, 2015–2019).
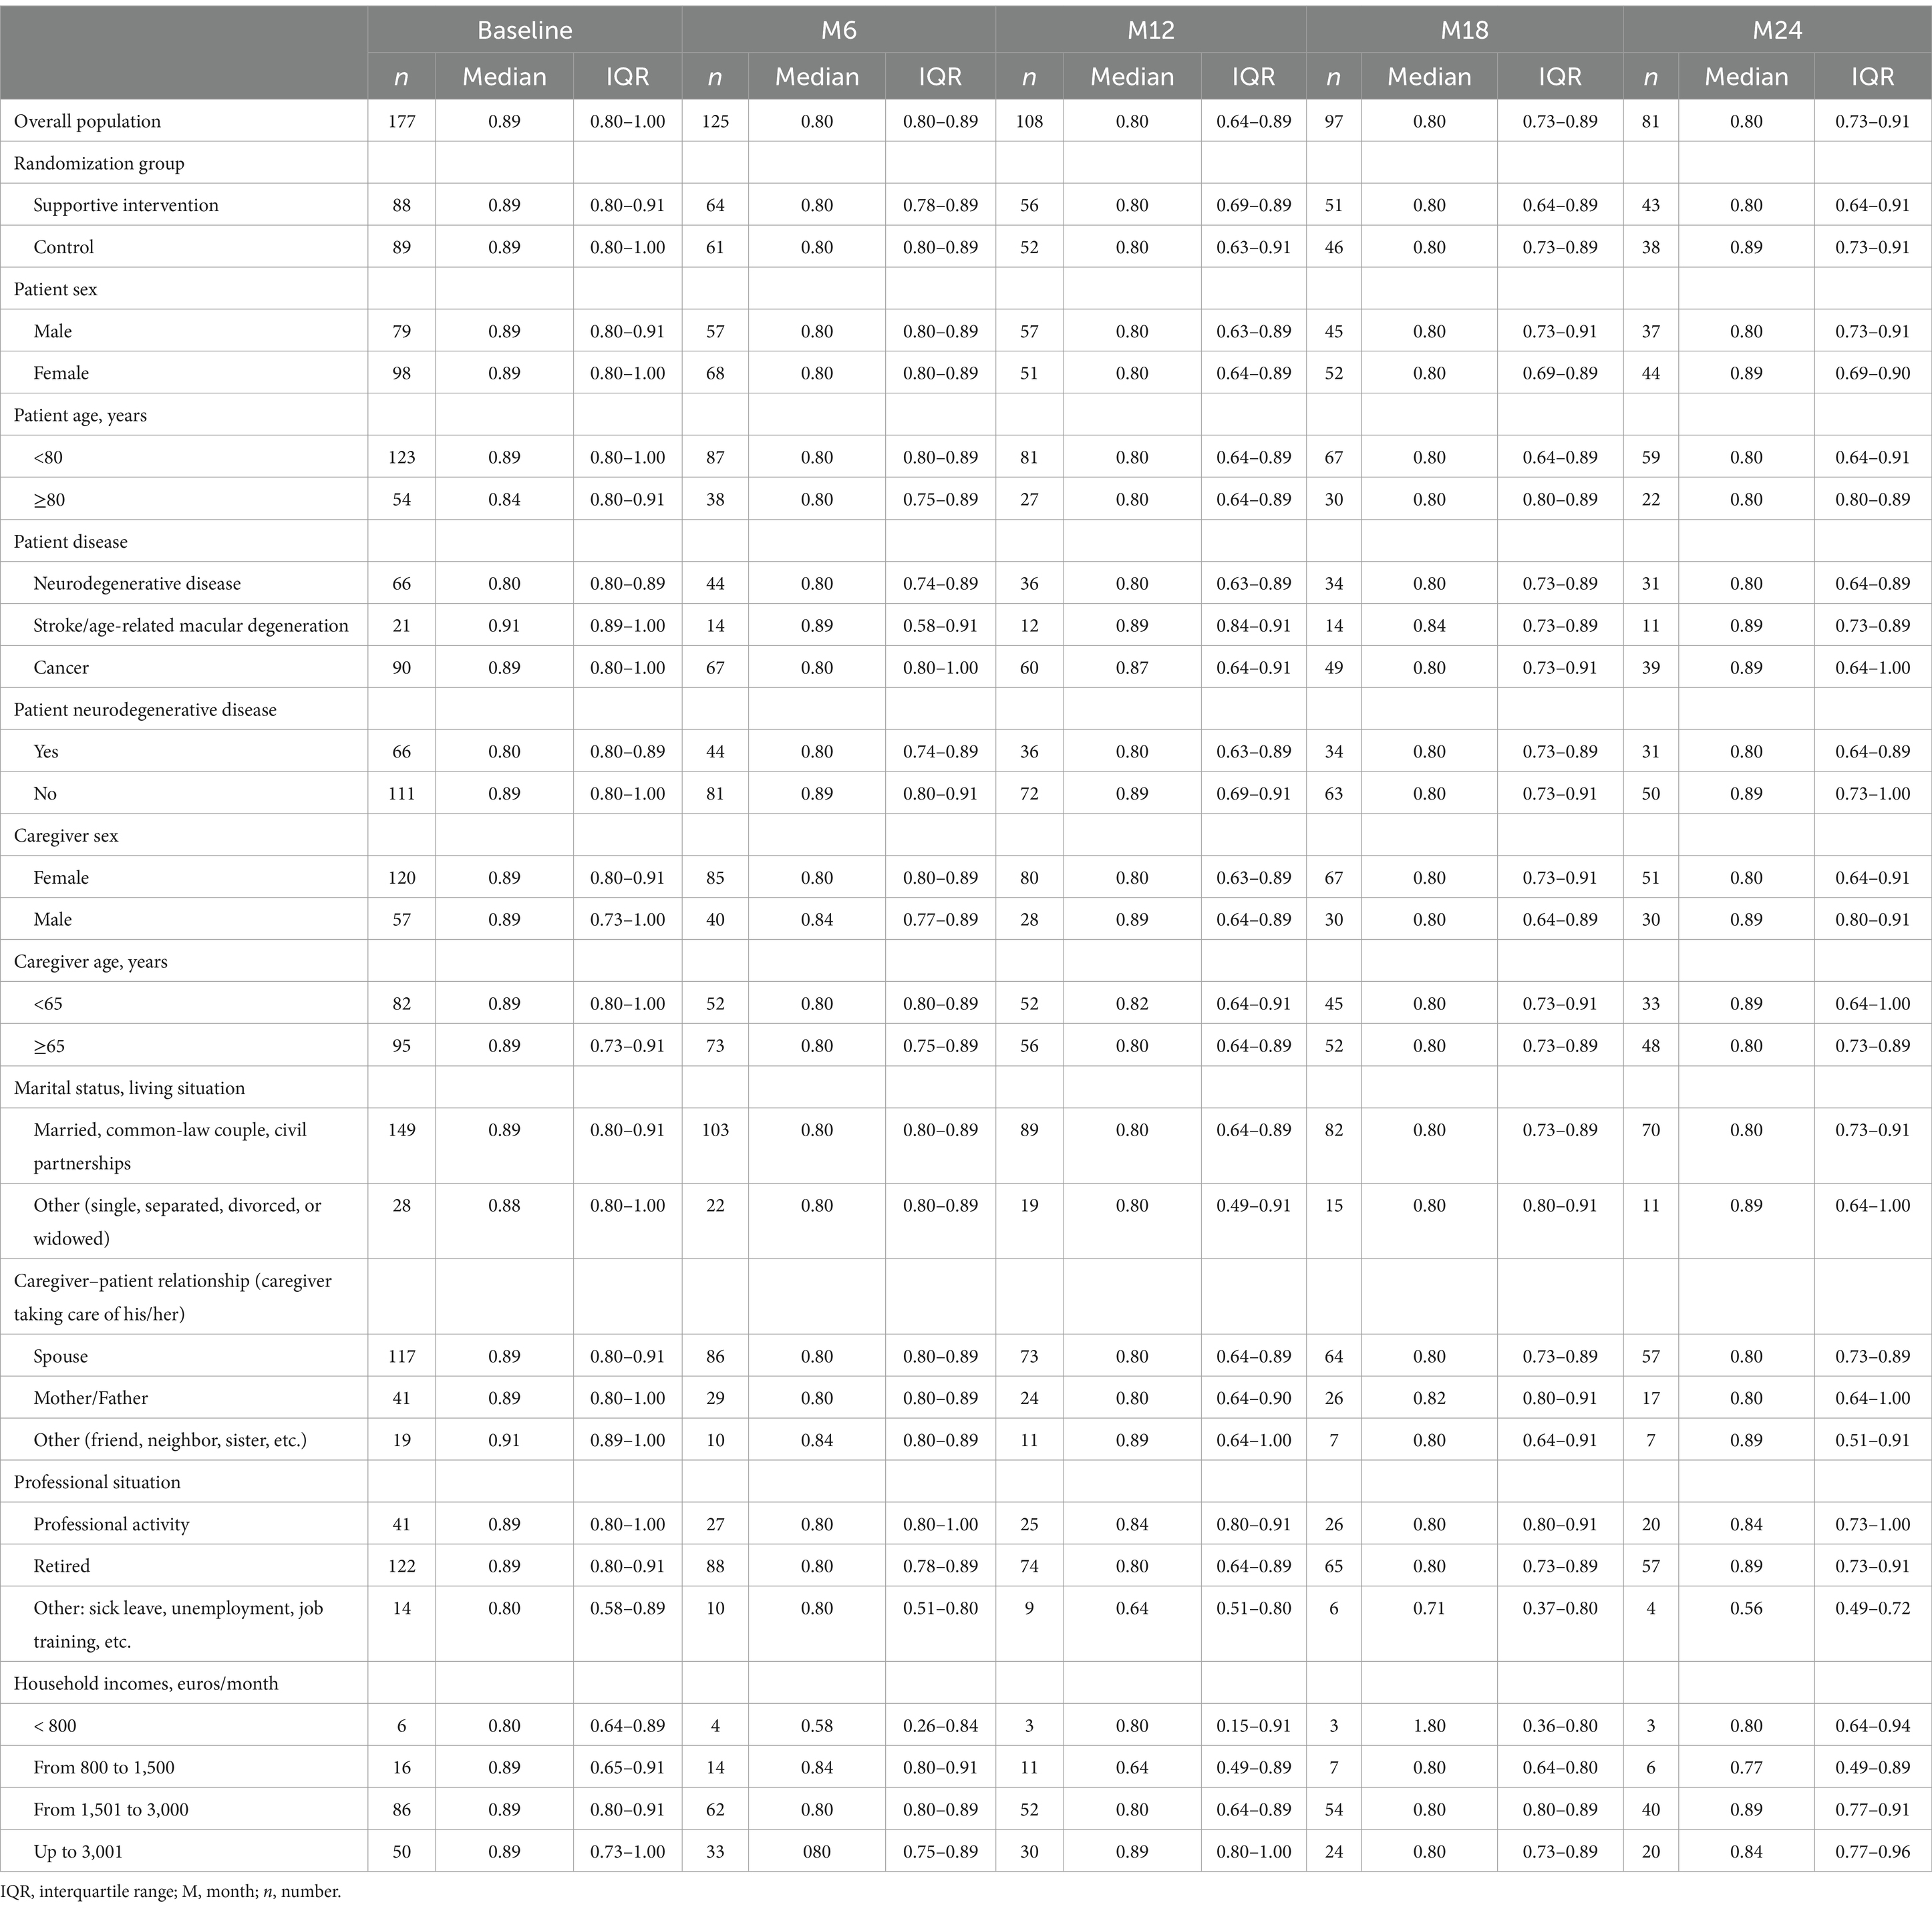
Table 2. EQ-5D-3L utility index score at baseline and 6, 12, 18, and 24 months (France, 2015–2019).
TTD of EQ-5D-3L utility index score and EQ VAS
Among the 177 informal caregivers with EQ-5D-3L utility index scores at baseline, 62% (n = 109) experienced a deterioration in EQ-5D-3L utility index score with a median TTD of 9.1 months [6.2–14.9] in the CG and 9.5 months [6.3–14.4] in the SIG (HR = 1.06 [0.73–1.54], p-value = 0.76) (Table 3; Figure 2). In the univariate and multivariate analyses, the only parameter significantly associated with longer TTD was the caregiver’s professional situation (p-value = 0.08).
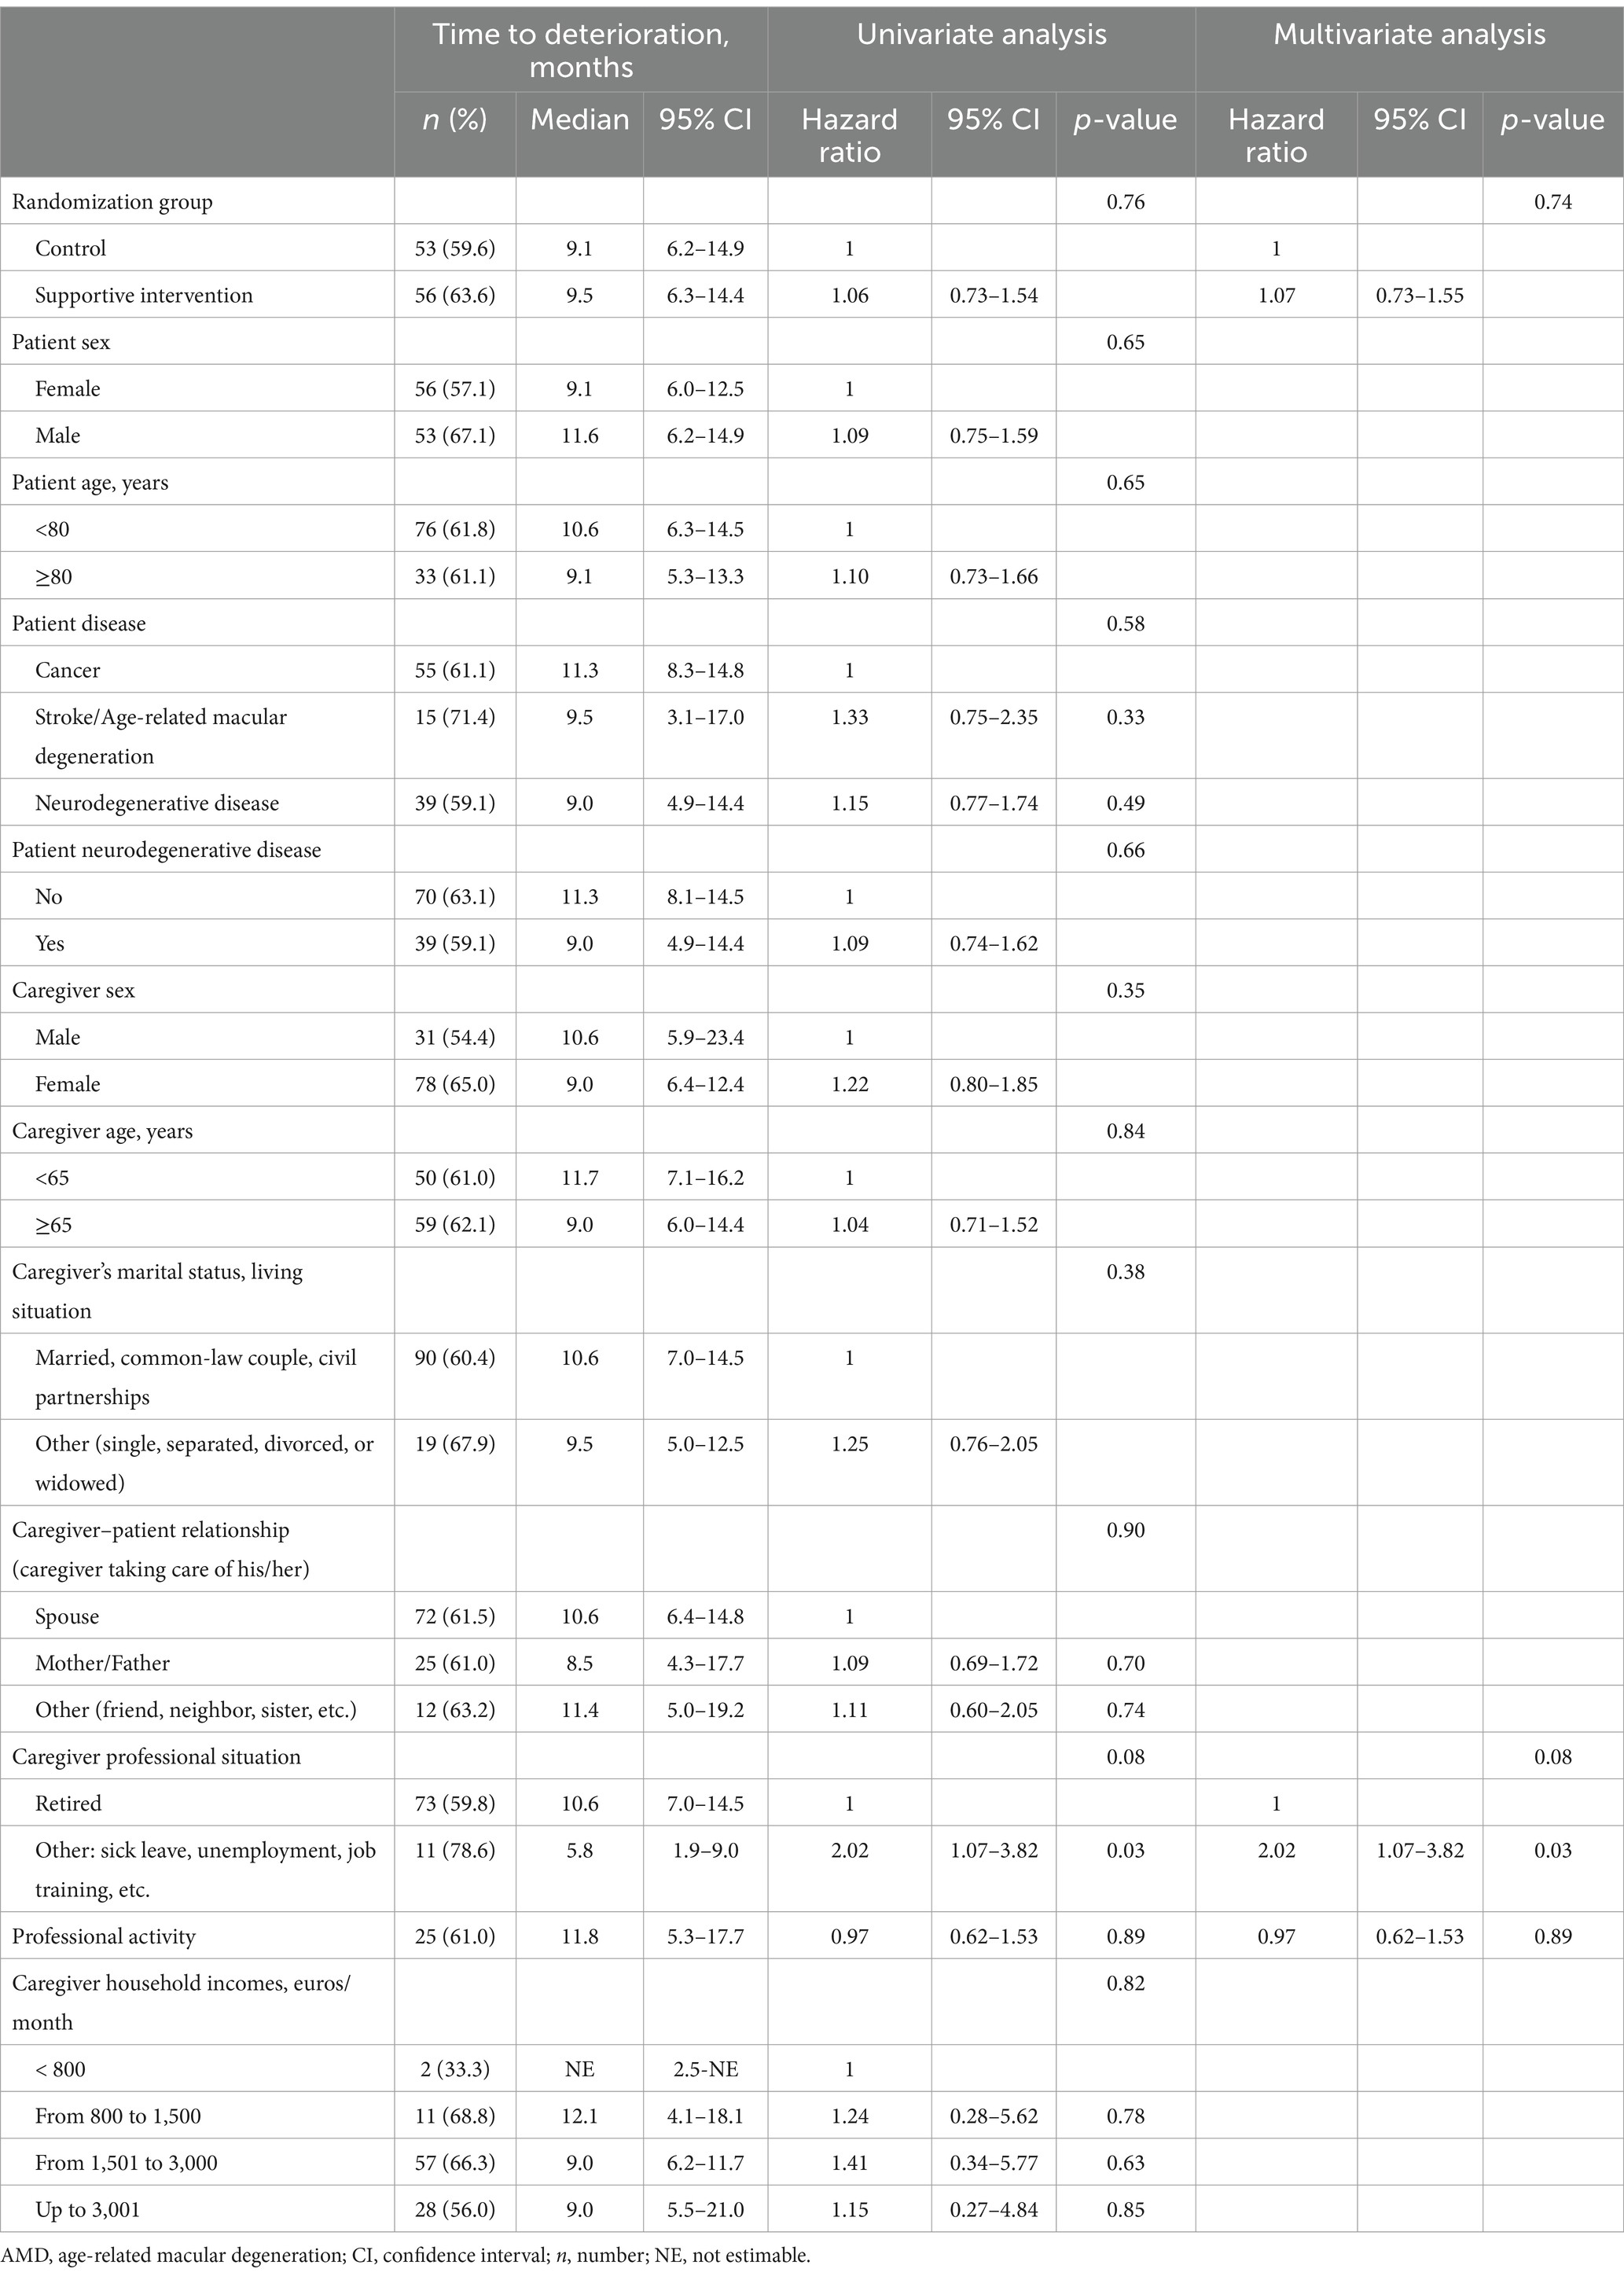
Table 3. Time to deterioration of EQ-5D-3L utility index score (France, 2015–2019).
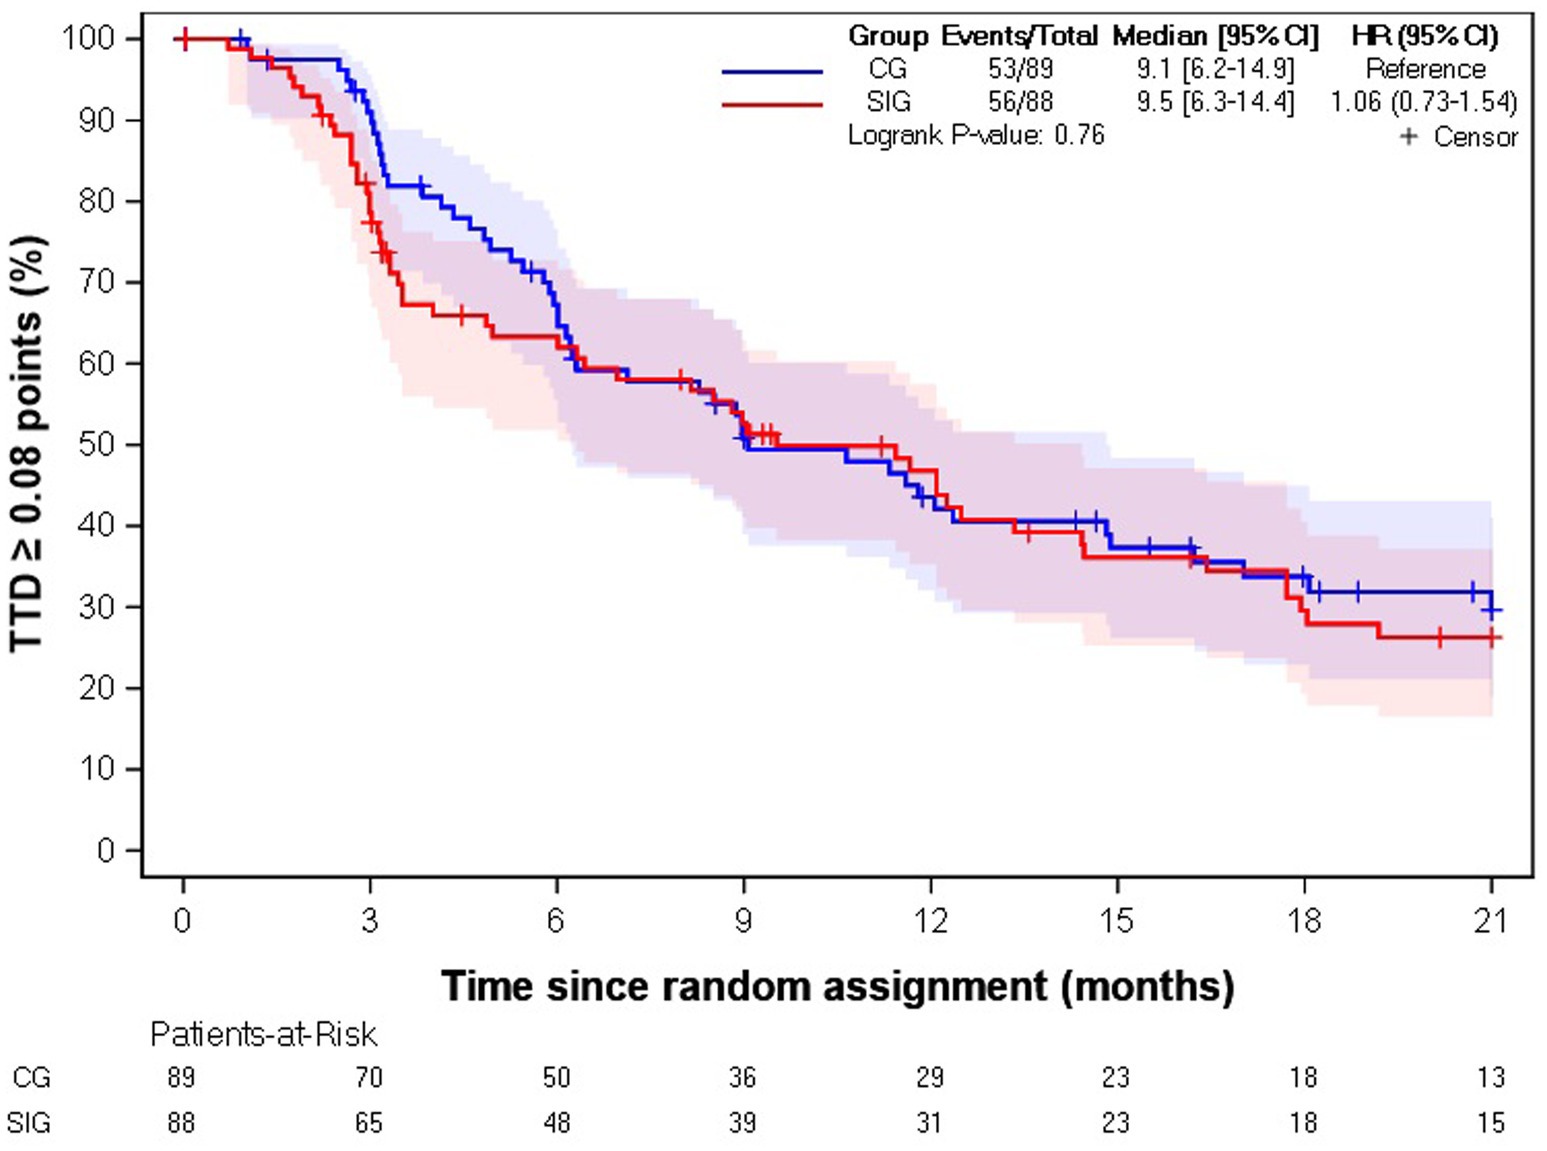
Figure 2. Kaplan–Meier estimation of time to deterioration of EQ-5D-3L utility index score. CG, control group; SIG, supportive intervention group; HR, hazard ratio; CI, confidence interval; TTD, time to deterioration.
Among the 174 informal caregivers with an EQ VAS at baseline, 49% (n = 86) experienced a deterioration in EQ VAS with a median TTD of 9.0 months [6.0–16.1] in the SIG and 21.9 months [10.2-not estimable] in the CG (HR = 1.54 [1.00–2.36], p-value = 0.05) (Figure 3).
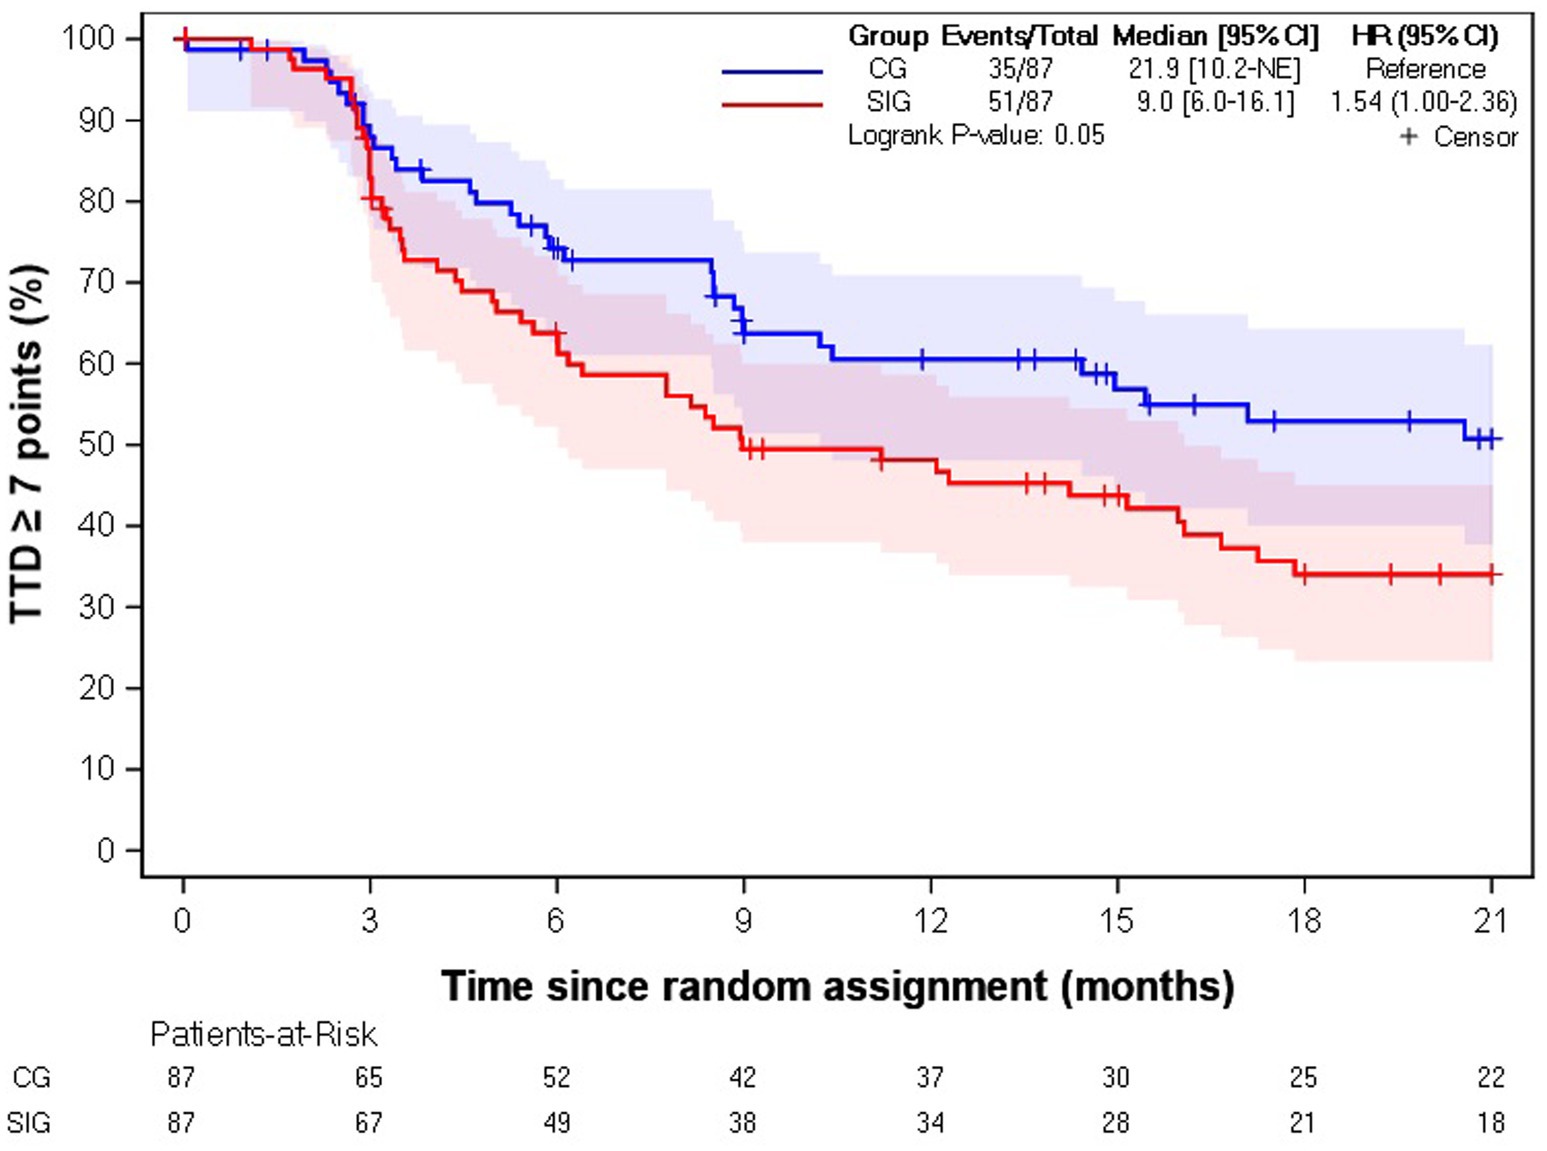
Figure 3. Kaplan–Meier estimation of time to deterioration of EQ VAS score. CG, control group; SIG, supportive intervention group; HR, hazard ratio; CI, confidence interval; TTD, time to deterioration.
Caregivers’ adjusted mean change over time in EQ-5D-3L utility index score and EQ VAS
The mixed models for repeated measures did not show clinically significant differences at M12 or M24 for EQ-5D-3L utility index score and EQ VAS (Supplementary material S1).
Discussion
The present analysis of 177 caregivers with EQ-5D-3L utility index scores at baseline showed that the percentage of informal caregivers reporting some or extreme problems on five dimensions remained stable over time with an EQ-5D-3L utility index score median of 0.89 at baseline and 0.80 as of M6 to M24 regardless of the randomization group. There was no TTD-relevant difference between randomization groups (9.1 months [6.2–14.9] in the CG and 9.5 months [6.3–14.4] in the SIG (HR = 1.06 [0.73–1.54], p-value = 0.76)). However, these results must take into account the specificity of the intervention specially designed for the study (8). Indeed, social workers indicated that their role was primarily one of listening and pointed out that caregivers had not taken full advantage of all the opportunities available to them. Several assumptions may explain these missed opportunities. The protocol scheduled semester visits that were inconsistent with current social worker practice, which generally recommends more frequent visits. This finding may have contributed to limiting the ability of social workers to provide appropriate and timely support. More frequent visits, organized at the request of caregivers, would have facilitated the timely and efficient identification and addressing of these needs. In addition, the global interpretation of changes in EQ-5D-3L utility index scores or EQ VAS should be approached with caution due to attrition biases. Indeed, caregivers who discontinued the study early were the most at risk for limited HRQoL, with poor physical dimensions and high burden at baseline, particularly among caregivers withdrawn at M12 (8).
Understanding how HRQoL is impacted by different factors is essential to fully describe the burden of disease on patients and caregivers. For explanatory purposes, our study identified only caregivers’ professional situation factor as an independent predictor of TTD (p-value = 0.03). Caregivers on sick leave, unemployed, or in job training had a significantly longer TTD compared to retired caregivers (who are typically older), or those with professional activity (who tend to be more active both professionally and personally). Therefore, these results must be interpreted with caution, considering the low recruitment rate, the limited intervention uptake, the significant heterogeneity of this population, and potential biases. These limitations likely affected the statistical power, reducing the ability to detect significant differences in other variables (sex or age of the caregiver, for instance). Furthermore, potential biases, such as non-response bias, may have influenced the results by affecting the representativeness of the sample. This finding suggests that the lack of observed effects can be attributed not only to the intervention and its ineffectiveness but also to the constraints of the method. However, we can assume that the availability of these caregivers could be their common feature.
It is important to note that several factors have been identified as influencing caregiver experiences in various cultural contexts (23, 24). While not assessed in our study, future research should explore their potential role in caregiver burden.
Thus, our study provides a comprehensible catalog of utility value data per health state for different caregiver profiles and at various follow-up time points. These HSUV data can be used in future health economic modeling. Over the past 20 years, interest in the economic evaluation of healthcare interventions has risen. The results of these evaluations have become increasingly important as criteria for the allocation of healthcare resources. Cost–utility analysis is recommended, for instance, by the Canadian Agency for Drugs and Technologies in Health (CADTH), the French National Authority for Health (HAS), and the National Institute for Health and Care Excellence (NICE) in the United Kingdom when HRQoL is identified as a relevant health effect of the interventions studied and compared, particularly for chronic diseases, such as neurodegenerative disease, stroke, age-related macular degeneration, or cancer (15, 25, 26). However, the variability in the quality of conduct and reporting in health economic evaluations has been well documented since 2000, particularly concerning HSUVs, which are most often derived from the literature or missing altogether (27). Thus, our HSUV catalog will contribute to the development of future caregiver-related cost–utility analyses, an area that is currently not widespread.
Conclusion
The present analysis of 179 caregivers showed no clinically relevant changes in EQ-5D-3L utility index score and EQ VAS, regardless of the allocation group, in line with the analysis of Pozet et al. (8). However, it provides an HSUV catalog across different caregiver profiles and at various follow-up time points, which can inform future economic evaluations.
Data availability statement
The raw data supporting the conclusions of this article will be made available by the authors, without undue reservation.
Ethics statement
The studies involving humans were approved by the local ethics committee (Comité de Protection des Personnes Est-II, Besançon) on 4 November 2014 and by the French advisory committee on information processing research in the field of health (Comité Consultatif sur le Traitement de l’Information en Matière de Recherche dans le Domaine de la Santé, CCTIRS) (protocol number 15.022-bis) on 5 March 2015. Approval from the national authority for the protection of privacy and personal data (Commission Nationale Informatique et Libertés, CNIL) was obtained on 23 June 2015. The studies were conducted in accordance with the local legislation and institutional requirements. The participants provided their written informed consent to participate in this study.
Author contributions
AP: Formal analysis, Funding acquisition, Project administration, Resources, Writing – original draft, Writing – review & editing. AF: Formal analysis, Writing – original draft, Writing – review & editing. CR: Investigation, Project administration, Writing – review & editing. TJ: Writing – original draft, Writing – review & editing. AM: Data curation, Writing – review & editing. VN: Conceptualization, Funding acquisition, Investigation, Methodology, Supervision, Validation, Visualization, Writing – original draft, Writing – review & editing.
Funding
The author(s) declare that financial support was received for the research and/or publication of this article. The study received funding from the Agence Nationale de La Recherche (ANR), Institut National du Cancer (INCa), La Ligue Contre le Cancer, Roche Foundation, and la Caisse Nationale de Solidarité pour l’Autonomie (CNSA). The funders had no role in the study design, data collection, data analysis, data interpretation, or writing of the report.
Conflict of interest
The authors declare that the research was conducted in the absence of any commercial or financial relationships that could be construed as a potential conflict of interest.
Generative AI statement
The authors declare that no Gen AI was used in the creation of this manuscript.
Publisher’s note
All claims expressed in this article are solely those of the authors and do not necessarily represent those of their affiliated organizations, or those of the publisher, the editors and the reviewers. Any product that may be evaluated in this article, or claim that may be made by its manufacturer, is not guaranteed or endorsed by the publisher.
Supplementary material
The Supplementary material for this article can be found online at: https://www.frontiersin.org/articles/10.3389/fpubh.2025.1531608/full#supplementary-material
References
1. Kaschowitz, J, and Brandt, M. Health effects of informal caregiving across Europe: a longitudinal approach. Soc Sci Med. (2017) 173:72–80. doi: 10.1016/j.socscimed.2016.11.036
2. Le, DD, and Ibuka, Y. Understanding the effects of informal caregiving on health and well-being: heterogeneity and mechanisms. Soc Sci Med. (2023) 317:115630. doi: 10.1016/j.socscimed.2022.115630
3. Schofield, D, Shrestha, RN, Zeppel, MJB, Cunich, MM, Tanton, R, Veerman, JL, et al. Economic costs of informal care for people with chronic diseases in the community: lost income, extra welfare payments, and reduced taxes in Australia in 2015-2030. Health Soc Care Community. (2019) 27:493–501. doi: 10.1111/hsc.12670
4. BVA, Fondation April. BVA Xsight. (2022). Baromètre des aidants – Avancées et perspectives. Available online at: https://www.bva-xsight.com/sondages/barometre-aidants-bva-fondation-april-avancees-perspectives/
5. de Oliveira, GR, Neto, JF, de Camargo, SM, Lucchetti, ALG, Espinha, DCM, and Lucchetti, G. Caregiving across the lifespan: comparing caregiver burden, mental health, and quality of life. Psychogeriatrics. (2015) 15:123–32. doi: 10.1111/psyg.12087
6. Del-Pino-Casado, R, Rodríguez Cardosa, M, López-Martínez, C, and Orgeta, V. The association between subjective caregiver burden and depressive symptoms in carers of older relatives: a systematic review and meta-analysis. PLoS One. (2019) 14:e0217648. doi: 10.1371/journal.pone.0217648
7. Pozet, A, Lejeune, C, Bonnet, M, Dabakuyo, S, Dion, M, Fagnoni, P, et al. Evaluation of efficacy and efficiency of a pragmatic intervention by a social worker to support informal caregivers of elderly patients (the ICE study): study protocol for a randomized controlled trial. Trials. (2016) 17:531. doi: 10.1186/s13063-016-1622-8
8. Pozet, A, Darnis, S, Bonnet, M, Meurisse, A, Dabakuyo-Yonli, TS, Lejeune, C, et al. Quality of life and needs in caregivers: results from the prospective multicentric open-label randomized study of informal caregivers of elderly patients. Int J Public Health. (2023) 68:1605459. doi: 10.3389/ijph.2023.1605459
9. Cagle, JG, Carr, DC, Hong, S, and Zimmerman, S. Financial burden among US households affected by cancer at the end of life. Psychooncology. (2016) 25:919–26. doi: 10.1002/pon.3933
10. Deb, A, Thornton, JD, Sambamoorthi, U, and Innes, K. Direct and indirect cost of managing Alzheimer’s disease and related dementias in the United States. Expert Rev Pharmacoecon Outcomes Res. (2017) 17:189–202. doi: 10.1080/14737167.2017.1313118
11. Bradley, CJ. Economic burden associated with cancer caregiving. Semin Oncol Nurs. (2019) 35:333–6. doi: 10.1016/j.soncn.2019.06.003
12. Ohno, S, Chen, Y, Sakamaki, H, Matsumaru, N, and Tsukamoto, K. Humanistic and economic burden among caregivers of patients with cancer in Japan. J Med Econ. (2020) 23:17–27. doi: 10.1080/13696998.2019.1675672
13. Wong, W. Economic burden of Alzheimer disease and managed care considerations. Am J Manag Care. (2020) 26:S177–83. doi: 10.37765/ajmc.2020.88482
14. Salsman, JM, Danhauer, SC, Moore, JB, Ip, EH, McLouth, LE, Nightingale, CL, et al. Systematic review of financial burden assessment in cancer: evaluation of measures and utility among adolescents and young adults and caregivers. Cancer. (2021) 127:1739–48. doi: 10.1002/cncr.33559
15. Haute Autorité de Santé. (2025). Choices in methods for economic evaluation. Available online at: https://www.has-sante.fr/jcms/r_1499251/en/choices-in-methods-for-economic-evaluation
16. Lidgren, M, Wilking, N, Jönsson, B, and Rehnberg, C. Health related quality of life in different states of breast cancer. Qual Life Res. (2007) 16:1073–81. doi: 10.1007/s11136-007-9202-8.
17. Herdman, M, Gudex, C, Lloyd, A, Janssen, M, Kind, P, Parkin, D, et al. Development and preliminary testing of the new five-level version of EQ-5D (EQ-5D-5L). Qual Life Res. (2011) 20:1727–36. doi: 10.1007/s11136-011-9903-x
18. Anota, A, Hamidou, Z, Paget-Bailly, S, Chibaudel, B, Bascoul-Mollevi, C, Auquier, P, et al. Time to health-related quality of life score deterioration as a modality of longitudinal analysis for health-related quality of life studies in oncology: do we need RECIST for quality of life to achieve standardization? Qual Life Res. (2015) 24:5–18. doi: 10.1007/s11136-013-0583-6
19. Brooks, R. EuroQol: the current state of play. Health Policy. (1996) 37:53–72. doi: 10.1016/0168-8510(96)00822-6
20. Chevalier, J, and de Pouvourville, G. Valuing EQ-5D using time trade-off in France. Eur J Health Econ. (2013) 14:57–66. doi: 10.1007/s10198-011-0351-x
21. EQ-5D User Guides. (2024). Basic information on how to use the EQ-5D-3L instrument. Available online at: https://euroqol.org/publications/user-guides/
22. Pickard, AS, Neary, MP, and Cella, D. Estimation of minimally important differences in EQ-5D utility and VAS scores in cancer. Health Qual Life Outcomes. (2007) 5:70. doi: 10.1186/1477-7525-5-70
23. Hazzan, AA, Shannon, H, Ploeg, J, Raina, P, and Oremus, M. Association between caregiver quality of life and the care provided to persons with Alzheimer’s disease: systematic review. Adv Alzheimer’s Dis. (2014) 3:44–53. doi: 10.4236/aad.2014.31006
24. Giannouli, V, and Tsolaki, M. What biological factors, social determinants, and psychological and Behavioral symptoms of patients with mild Alzheimer’s disease correlate with caregiver estimations of financial capacity? Bringing biases against older women into focus. J Alzheimer’s Dis Rep. (2022) 6:503–7. doi: 10.3233/ADR-220037
25. CADTH. (2025). Canadian Agency for Drugs and Technologies in Health (CADTH). Available online at: https://www.cadth.ca/
26. NICE. (n.d.) National Institute for health and care excellence (NICE). Available online at: http://publications.nice.org.uk/pmg9 (Accepted 04 April 2013).
Keywords: caregiver, health-state utility value, older patient, social worker support, time to deterioration, economic value
Citation: Pozet A, Falcoz A, Roller C, Jai T, Meurisse A and Nerich V (2025) Health-state utility values and their time to deterioration in informal caregivers of older patients with chronic diseases. Front. Public Health. 13:1531608. doi: 10.3389/fpubh.2025.1531608
Edited by:
Chao Ma, Southeast University, ChinaReviewed by:
Vaitsa Giannouli, Aristotle University of Thessaloniki, GreeceEbrahim Sharifnia, Fresenius Medical Care North America, United States
Copyright © 2025 Pozet, Falcoz, Roller, Jai, Meurisse and Nerich. This is an open-access article distributed under the terms of the Creative Commons Attribution License (CC BY). The use, distribution or reproduction in other forums is permitted, provided the original author(s) and the copyright owner(s) are credited and that the original publication in this journal is cited, in accordance with accepted academic practice. No use, distribution or reproduction is permitted which does not comply with these terms.
*Correspondence: Virginie Nerich, djFuZXJpY2hAY2h1LWJlc2FuY29uLmZy