- 1The Second Clinical Medical College of Zhejiang Chinese Medical University, Hangzhou, China
- 2The First Affiliated Hospital of Wenzhou Medical University, Wenzhou, China
- 3The Second Affiliated Hospital of Zhejiang Chinese Medical University, Hangzhou, China
Background: The prevalence of obesity, a common metabolic disorder, has been increasing annually, particularly in older adults. This trend poses a significant socioeconomic burden. The uric acid to high-density lipoprotein cholesterol ratio (UHR) was defined by dividing UA (mg/dL) by HDL-C (mg/dL) and multiplying by 100%. According to recent clinical research, UHR has emerged as a potential innovative indicator in metabolic status evaluation, supported by contemporary biomarker research. This cross-sectional study investigated the association between the UHR index and obesity prevalence among older Americans.
Objective: This cross-sectional research employed nationally representative survey data to Examine the connection between the UHR index and obesity among older individuals aged 60 and above.
Methods: This study utilized data from the National Health and Nutrition Examination Survey (NHANES) spanning 2011 to 2016. Individuals who were 60 years old or older were included in the study (n = 3,822). The relationship between UHR levels and obesity (as measured by a body mass index of 30 kg/m2 or greater or a waist-to-height ratio (WHtR) ≥0.5) was investigated using weighted multivariable logistic regression analyses, with adjustments made for sociodemographic characteristics, behavioral patterns, and clinical covariates, adjusting for sociodemographic, behavioral, and clinical covariates. Restricted cubic spline, ROC curves, threshold analysis, and subgroup analysis were also used.
Result: After full adjustment for confounders, UHR was positively associated with the risk of obesity as defined by BMI (highest quartile vs. lowest quartile: OR = 6.13, 95% CI = 4.01–9.39; P-trend < 0.001) and UHR was positively associated with the risk of obesity as defined by WHtR (highest quartile vs. lowest quartile: OR = 20.21, 95% CI = 8.33–49.02; p-trend < 0.001). In addition, The restricted cubic spline analysis uncovered a nonlinear dose-response relationship (P < 0.01), and threshold analysis found inflection points of −2.485 in obesity defined by BMI and −2.503 in WHtR. Subgroup analyses showed that the association between UHR and obesity in older Americans was consistent across subgroups, demonstrating high reliability (all P-interaction > 0.05). The AUC for UHR predicting obesity defined by BMI was calculated to be 0.65 (95% CI = 0.63–0.66). The UHR predicted AUC for obesity as defined by men's body mass index (BMI) was 0.67 (95% CI = 0.65–0.70). UHR predicted an AUC of 0.69 (95% CI = 0.67–0.72) for obesity defined by body mass index (BMI) in females. The AUC for UHR predicting obesity defined by WHtR was calculated to be 0.75 (95% CI = 0.72–0.78). UHR predicted an AUC of 0.76 (95% CI = 0.72–0.80) for obesity defined by WHtR in males, and UHR predicted an AUC of 0.83 (95% CI = 0.79–0.87) for obesity defined by WHtR in females.
Conclusion: The findings demonstrate a notable positive correlation between UHR and obesity in older adults, with this association remaining evident following adjustment for multiple confounding variables. These results imply that systematic evaluation of UHR levels could serve as an effective strategy for proactively detecting populations susceptible to obesity-related metabolic disorders.
Introduction
Obesity, a prevalent clinical metabolic disorder, is conventionally defined as a Body Mass Index (BMI) ≥30.0 (1) or waist-to-height ratio (WHtR) ≥ 0.5 (2). Recent epidemiological data indicate that 38% of the global population is classified as overweight or obese, with projections estimating a rise to 51% by 2035 (3). Concurrently, the aging global population has been associated with a rising prevalence of obesity among older adults (4). Obesity in older adults is strongly linked to severe comorbidities, including cardiovascular disease (5), type 2 diabetes mellitus (6), hypertension (7), and dyslipidemia (8), thereby imposing substantial socioeconomic burdens and contributing to escalating global mortality rates (9). Traditional modalities for obesity assessment, such as Magnetic resonance imaging (MRI), are often technically complex and financially prohibitive, limiting their utility in clinical practice and large-scale epidemiological studies (10). Furthermore, the association between BMI and obesity is influenced by demographic variables such as race, gender, and age (11). Critically, BMI fails to adequately capture the pathophysiological impact of excess adiposity, potentially leading to underestimation of obesity-related health risks (12). Epidemiologic studies investigating obesity in older adults have demonstrated that BMI has less ability than waist-to-height ratio (WHtR) to distinguish individuals with high muscle mass from those with excess fat or abdominal obesity (13). UHR can be calculated from routine blood tests, thus avoiding measurement errors common in anthropometric indices (e.g., posture-related waist-to-height ratios). This is particularly advantageous for bedridden or frail older adults for whom accurate anthropometric measurements are difficult. UHR is less expensive than MRI and has a shorter detection time. More importantly, UHR does not require specialized operators. Therefore, to determine the relationship between UHR and obesity in older adults and to identify a simple and convenient health assessment metric, we assessed cross-sectional associations between UHR and obesity in older adults as defined by BMI and obesity in older adults as defined by WHtR using data from the National Health and Nutrition Examination Survey (NHANES) conducted in the United States from 2011 to 2016.
The mechanistic interplay between composite metabolic indices and obesity in older adults has garnered significant research interest In the last few years (14). Uric acid (UA), the terminal product of purine metabolism, exhibits dual roles in energy homeostasis. On the one hand, UA potentiates lipid accumulation via activating adipogenesis-related enzymes (15); conversely, its antioxidative properties may mitigate metabolic dysregulation (16). In contrast, high-density lipoprotein cholesterol (HDL-C) is essential for maintaining cholesterol homeostasis and modulating lipid metabolism through its mediation of reverse cholesterol transport (17). The uric acid to HDL-C ratio (UHR) is particularly important in older adults due to age-related physiological and socio-environmental vulnerabilities. Aging is characterized by a progressive decrease in renal uric acid excretion and HDL cholesterol synthesis (18, 19), thus creating a metabolic environment conducive to an elevated UHR. Mechanistically, elevated UHR exacerbates oxidative stress and adipogenesis, thereby promoting obesity. Hyperuricemia, a key component of UHR, is associated with increased reactive oxygen species (ROS) production (20), which impairs mitochondrial function in adipocytes, accelerating lipid peroxidation and ectopic fat deposition (21). At the same time, low HDL-C levels impair cholesterol reverse transporter and antioxidant defenses, further amplifying oxidative damage and adipose tissue inflammation (22). These processes may synergistically drive adipocyte hypertrophy and visceral fat accumulation, leading to metabolic imbalances. In turn, oxidative stress and chronic inflammation are central to the pathogenesis of aging-related diseases such as cardiovascular and kidney diseases (23, 24). Studies have shown that elevated UHR is inversely correlated with circulating alpha-klotho, suggesting that it has utility in predicting renal aging and frailty (25). Long-term cross-sectional studies also support this hypothesis. For example, it has been shown that severe obesity is strongly associated with elevated serum uric acid and lowered high-density lipoprotein cholesterol (26, 27). While UA levels demonstrate a J-curve association with obesity (28), reduced HDL-C is strongly linked to central adiposity (29). Although obesity-related indicators such as body mass index (BMI) and waist circumference are closely associated with physiological aging, substantial inter-individual variability exists in the predictive performance of these biomarkers in older adults (30). Emerging studies indicate that UHR is pivotal to age-related body composition changes (25, 31). As a composite metric, UHR sensitively reflects dysregulation of the lipid-purine metabolic axis, with elevated values demonstrating robust correlations with visceral fat accumulation and insulin resistance (32). Nevertheless, the clinical utility of UHR in geriatric obesity assessment remains underexplored, particularly given age-specific physiological shifts such as dynamic muscle-to-fat ratio alterations and attenuated metabolic compensatory mechanisms. Therefore, elucidating the relationship between UHR and obesity in aging populations may yield a novel biomarker for the early detection of geriatric obesity.
The well-established association between the urea-to-creatinine ratio (UHR) and inflammatory pathologies, including hypertension (33) and non-alcoholic fatty liver disease (NAFLD) (34), prompts scientific inquiry into its potential role in geriatric obesity. Current evidence remains scarce regarding UHR's specific relationship with obesity in the aging population. Therefore, we aimed to elucidate the relationship between UHR and obesity in older Americans.
Materials and methods
NHANES employs a complex probabilistic sampling methodology across multiple stages to generate nationally representative estimates through its population-based cross-sectional design (35). Given NHANES's complex multistage sampling design, we used survey weights to ensure that the estimates were nationally representative. Ethics clearance was obtained from the National Center for Health Statistics Institutional Review Board prior to study implementation, with documented informed consent acquired from all subjects preceding any research procedures.
Study population
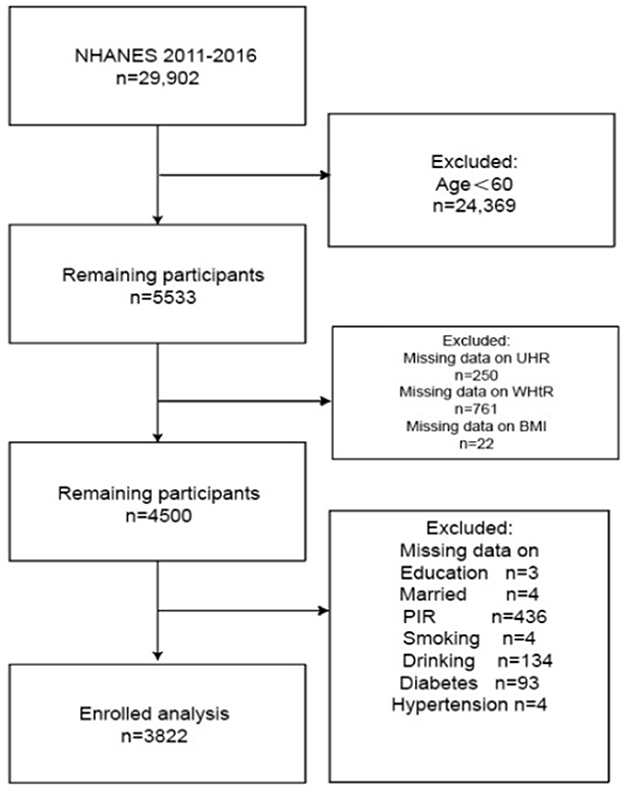
We analyzed pooled data from three NHANES cycles (2011–2016). We handle missing data by deleting column by column. From an initial sample of 29,902 participants, exclusion criteria were systematically applied: (1) participants younger than 60 years of age (n = 24,369); (2) 22 subjects lacked BMI measurements, 250 lacked the UHR index, and 761 lacked the WHtR; subsequent exclusions included those with missing data on educational attainment (n = 3), Poverty Income Ratio (PIR, n = 436), alcohol consumption (n = 134), smoking status (n = 4), marital status (n = 4), diabetes (n = 93), and hypertension (n = 4). The final study population consisted of 3,822 eligible participants (Figure 1).
Definitions of exposure and outcome variables
Following the National Heart, Lung, and Blood Institute (NHLBI) criteria, obesity among older adults was defined, and body mass index (BMI) was calculated by dividing weight in kilograms by height in meters squared (kg/m2). Participants were then classified into obese (BMI ≥ 30) or non-obese (BMI < 30) groups (36). To account for the limitations of the older population, where changes in body composition and sarcopenia may confound BMI, we introduced an alternative way of defining obesity, namely waist-to-height ratio (WHtR) ≥ 0.5 (2).
The uric acid to high-density lipoprotein cholesterol ratio (UHR) served as the exposure variable in this research. The Uric acid-to-HDL ratio (UHR) was defined by dividing UA (mg/dL) by HDL-C (mg/dL) and multiplying by 100%. The data necessary for calculating the UHR were derived from the physical examination records of the National Health and Nutrition Examination Survey (NHANES) spanning the years 2011–2016. The UHR consists of UA and HDL-C, measured by blood in the morning in a fasting state, with the subject fasting for 8–12 h before blood collection. UA is measured: Serum uric acid concentration is measured by the DxC800 Automated Laboratory Analyzer using the timed endpoint method, where the enzyme urease reacts with uric acid to produce hydrogen peroxide. Peroxidase promotes the reaction of aminoantipyrine (4-AAP) and 3,5-dichloro-2-hydroxybenzenesulfonate (DCHBS) with hydrogen peroxide, and the resulting product is measured at 520 nm. HDL-C is measured by adding magnesium sulfate solution to the sample to form a complex with the non-HDL-C, with the aim of not subsequently reacting with the measurement reagent. The next step is converting HDL cholesterol esters to HDL cholesterol by polyethylene glycol esterase. Finally, 4-amino antipyrine and HSDA react with the hydrogen peroxide generated from the reaction to form a blue dye, and finally, HDL-C levels are determined by photometric measurement at 600 nm using a Hitachi 7600 fully automated biochemical analyzer (25). UHR values (expressed in mg/dL for both components) were categorized into quartiles (Q1-Q4) to ensure the accuracy of the data (37).
Covariates
For smoking history, we based the question, “Have you ever smoked at least 100 cigarettes in your life?” We categorized them as having a history of smoking and not having a history of smoking. High-risk alcohol consumption was identified as consuming four or more drinks per day (38). Physical activity levels were divided into low (< 500 MET min/week) and high (≥500 MET min/week) categories, in line with national guidelines (39). Clinical characteristics were determined through standardized measurements and validated criteria. Diagnostic criteria for hypertension included fulfillment of at least one of these parameters: (1) recorded systolic blood pressure ≥140 mmHg; (2) measured diastolic blood pressure ≥ 90 mmHg; (3) physician-confirmed medical history disclosed by participants; or (4) active pharmacological treatment for blood pressure regulation (40). Identification of type 2 diabetes mellitus (T2DM) required meeting any of these established indicators: (1) medically verified patient disclosure; (2) prescribed administration of antidiabetic medications; (3) fasting blood glucose levels ≥126 mg/dL (7.0 mmol/L); or (4) hemoglobin A1c values ≥6.5% (41). Comprehensive operational definitions for all study variables are documented in the standardized National Health and Nutrition Examination Survey (NHANES) methodological guidelines, accessible at: https://www.cdc.gov/nchs/nhanes/.
Statistical analysis
Statistical analyses were performed using R statistical software (version 4.3.1). The significance of all statistical tests was p < 0.05. The National Health and Nutrition Examination Survey (NHANES) employed a multistage, stratified sampling approach to collect nationally representative data, incorporating appropriate sample weights to ensure population representativeness. By NHANES analytical guidelines, sample weights were applied throughout our analyses to account for the complex survey design. Since the heterogeneous distribution of UHR data may affect model stability, we log-transform the data to improve model stability. Weighted multivariate logistic regression analyses were conducted to evaluate the association between the UHR index and obesity risk in older adults. The UHR index was categorized into quartiles (Q1–Q4), with the lowest quartile (Q1) as the reference category. Three distinct models were constructed: Model 1 presented crude estimates without covariate adjustment, while subsequent models progressively adjusted for demographic characteristics (age, sex, race), socioeconomic factors (education level, marital status, poverty-income ratio), lifestyle variables (smoking status, alcohol consumption, physical activity equivalents), and clinical comorbidities (hypertension, diabetes mellitus). Post-adjustment for covariates, Smooth curve fitting was performed to examine the association between UHR and obesity in older adults, threshold effects for nonlinear models were determined, and meaningful inflection points were identified. In addition, subgroup analyses were conducted across demographic characteristics, behavioral patterns, and health status, and interaction terms were added to test for heterogeneity between subgroups. All results are reported as odds ratios (ORs) with corresponding 95% confidence intervals (CIs) and p-values. Finally, the predictive performance of the UHR for obesity in older adults, as well as older men and women, was assessed using the subject's work characteristic curve (ROC). We also determined the critical value of the UHR through ROC analysis.
Results
Baseline characteristics
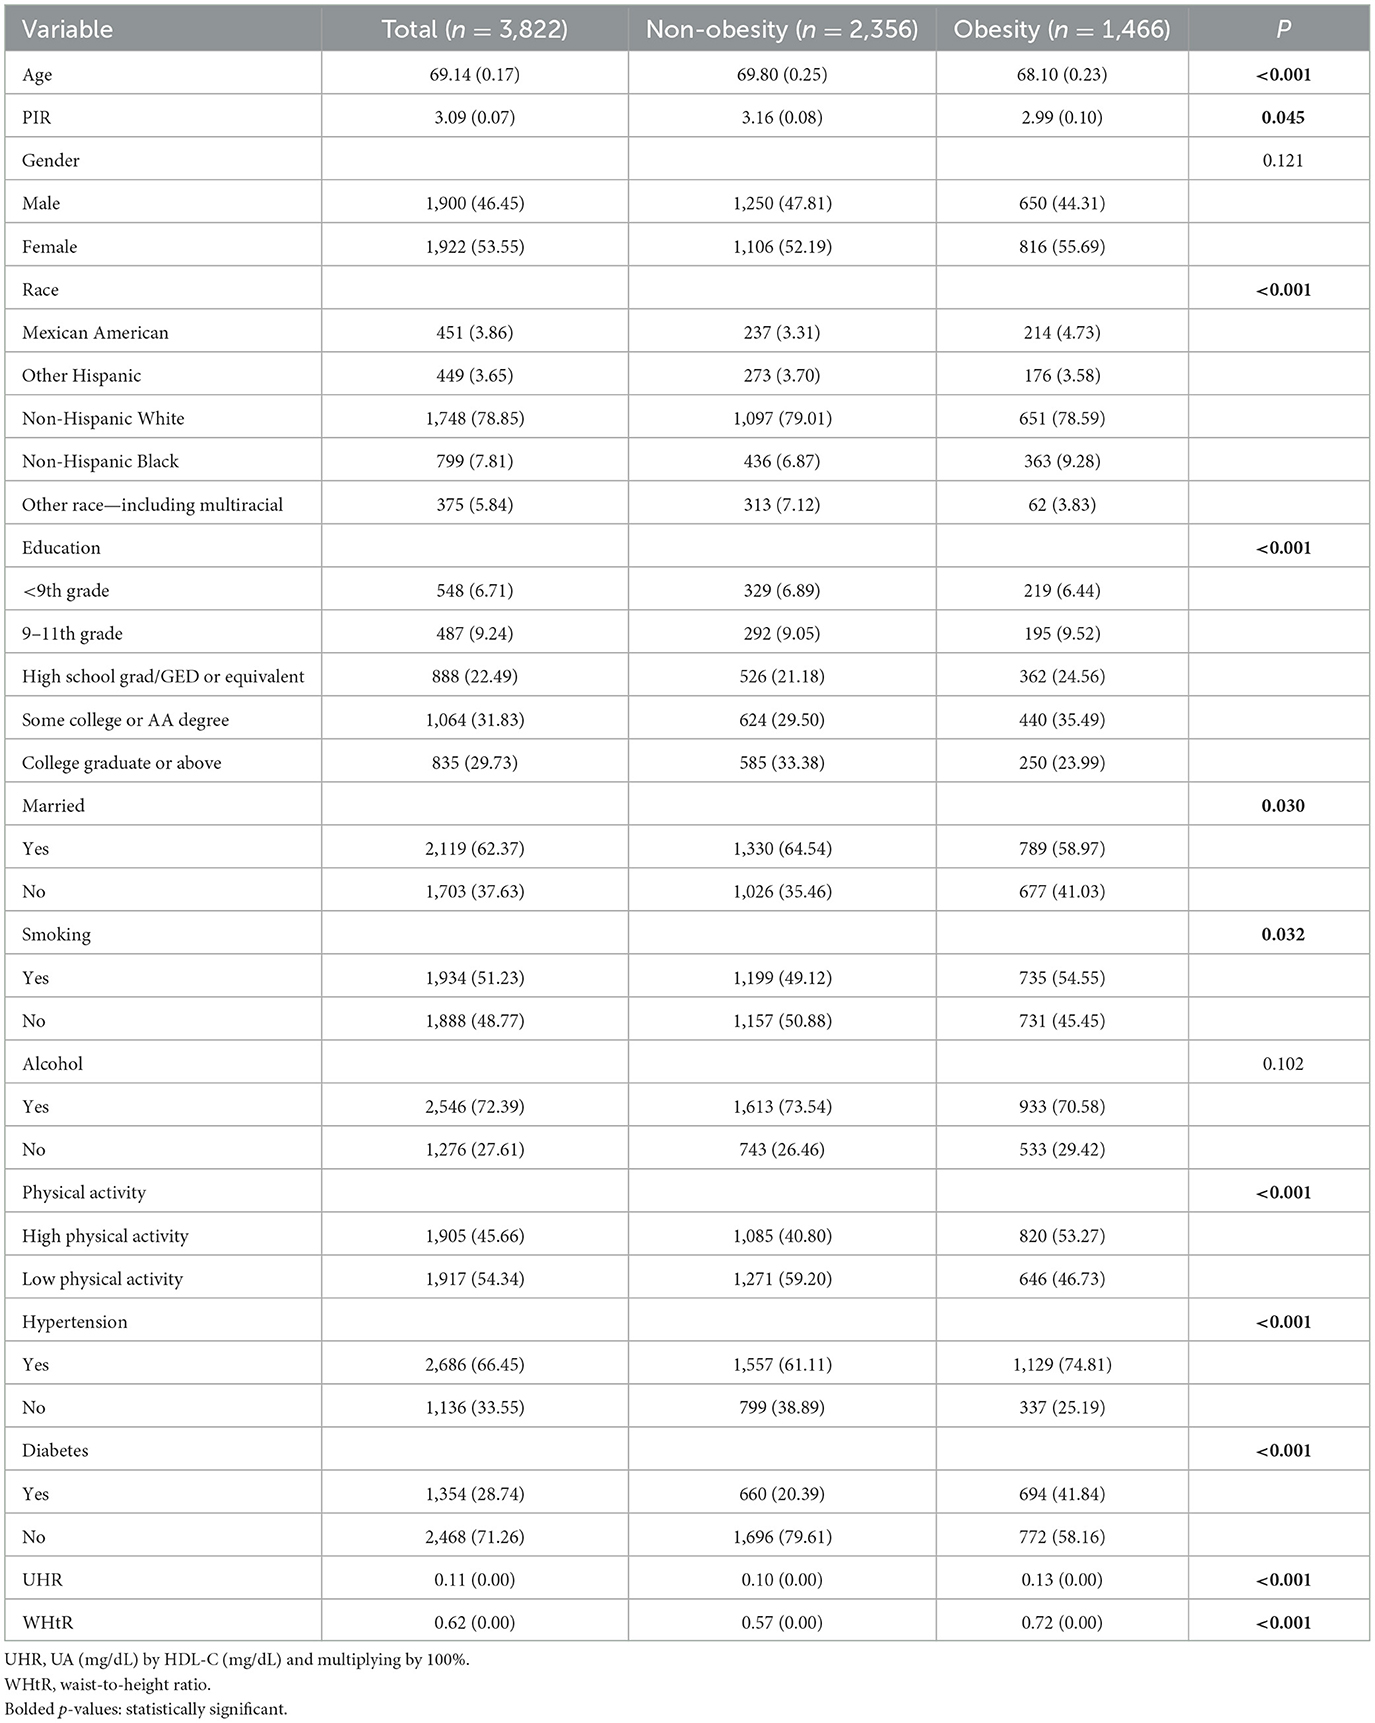
The study involved 3,822 subjects comprising 1,900 males and 1,922 females. Table 1 shows that out of 3,822 subjects, 1,466 (38.36%) were diagnosed as obese. The obese group had a significantly higher UHR and a younger mean age compared to the non-obese group. Slightly lower economic levels in the obese group relative to the non-obese group and there were significant differences in racial distribution: higher proportions of non-Hispanic whites and non-Hispanic blacks and lower proportions of other races (including multiracial). In terms of educational attainment, those with some college or AA degree were more highly represented among the obese. Marital status showed that a higher proportion of the obese group was married. Behavioral characteristics showed that the obese group had a higher proportion of smokers, a higher proportion of alcohol drinkers, and a significantly higher proportion of high-intensity exercisers. In terms of health status, the frequency of hypertension was much higher in the obese group than in the non-obese group (p < 0.001 in all cases), and the frequency of diabetes mellitus in the obese group was similar to the frequency of non-diabetes mellitus. In conclusion, there were significant differences between the obese and non-obese groups in terms of age, UHR, WHtR, PIR, race, literacy, marital status, smoking history, physical activity, and health status (hypertension and diabetes) (p < 0.001).
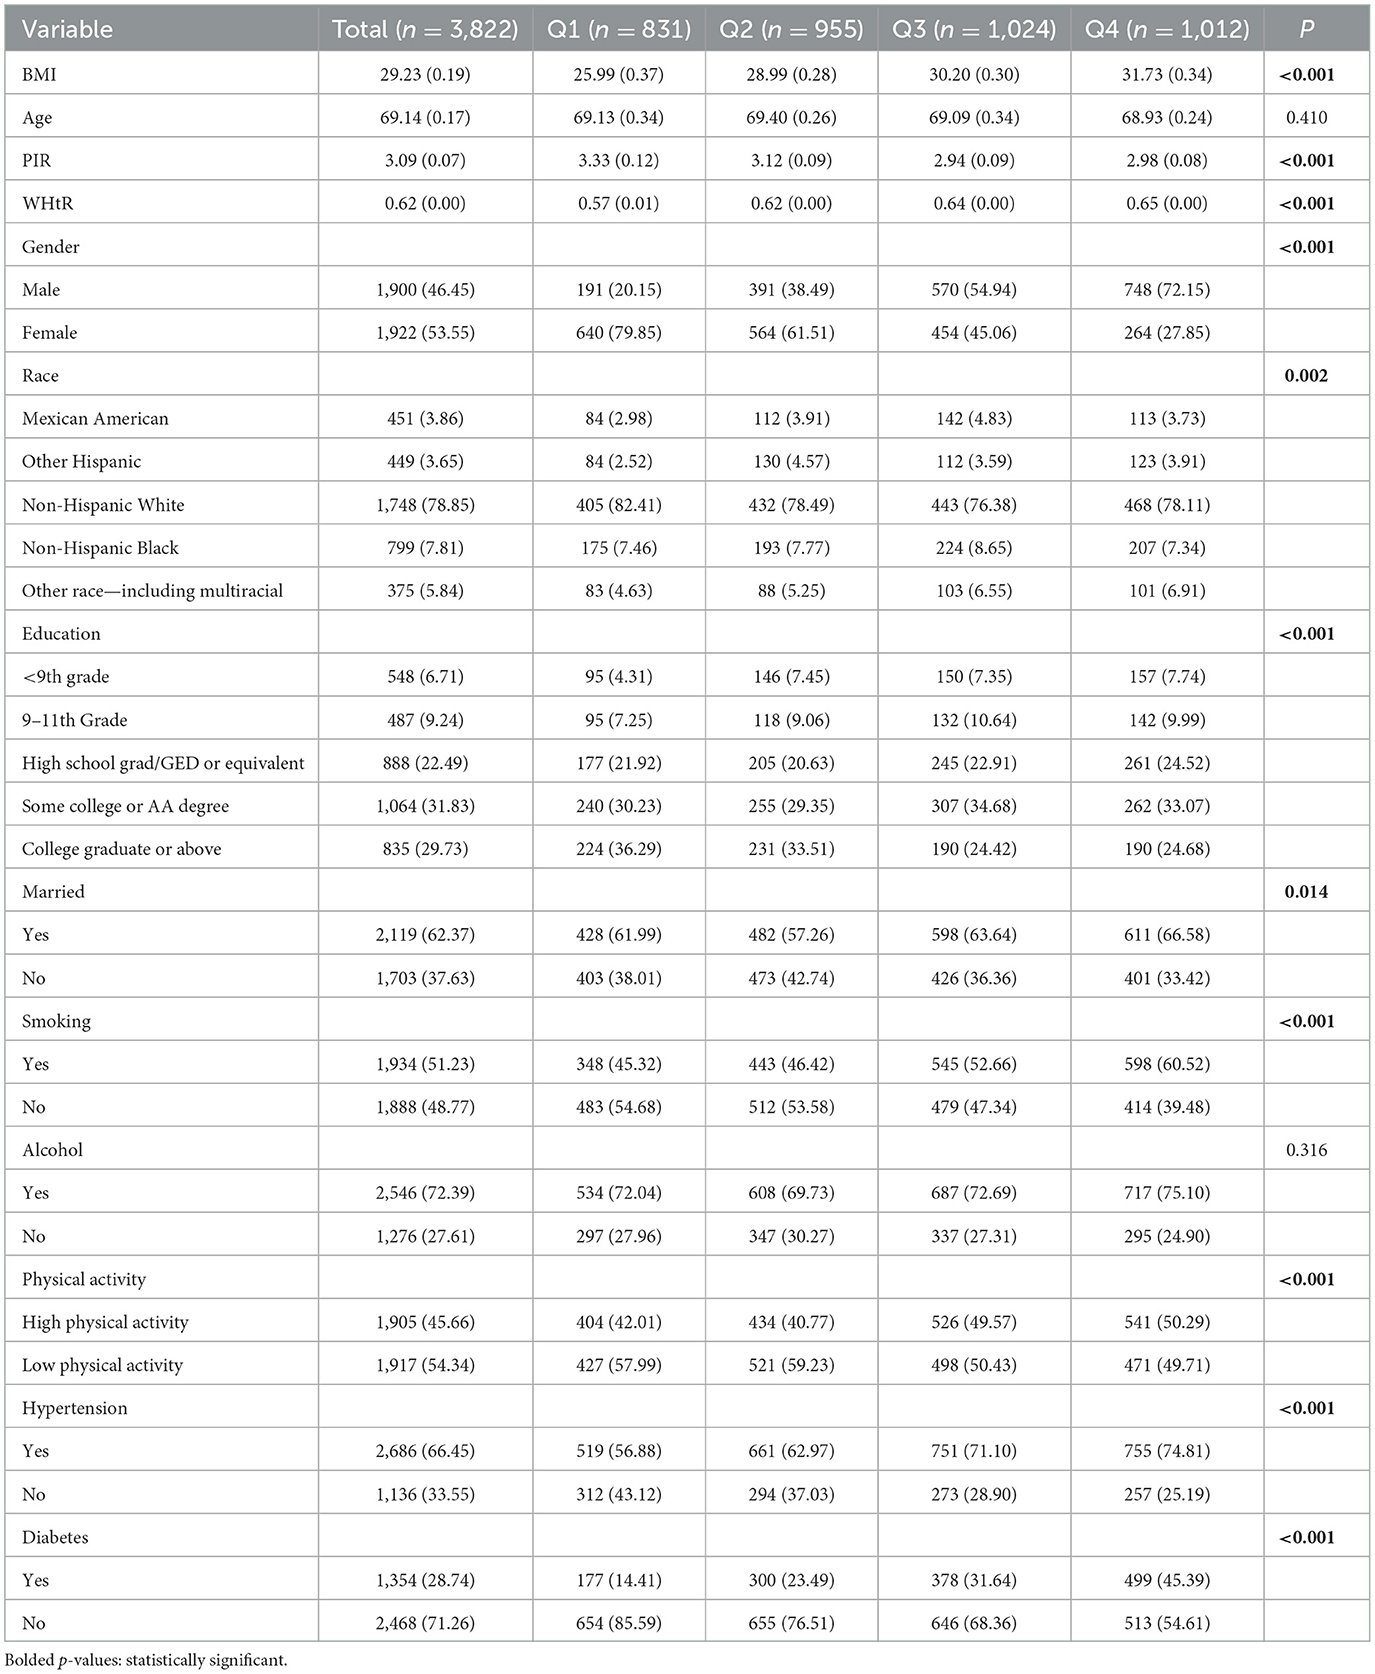
Table 2 summarizes the baseline characteristics of older adults stratified by quartiles of the UHR index to investigate the potential association between UHR levels and the incidence of obesity in older adults (Table 2). The UHR index was categorized into four quartiles, i.e., Q1, Q2, Q3, and Q4. Those in the fourth quartile had a higher body mass index (BMI), a lower level of household income, and a higher prevalence of smoking. The BMI, PIR, WHtR, gender, ethnicity, education, marital status, smoking status, and physical activity prevalence of hypertension, diabetes, and obesity significantly differed between the first, second, third, and fourth quarters (p < 0.05). The prevalence of obesity increased progressively with increasing quartiles of the UHR index (P-trend < 0.001).
Correlation between UHR index and obesity in older adults
To assess the association between UHR and obesity risk in older adults, we used a multivariate logistic regression model. Because the heterogeneous distribution of UHR data may affect model stability, we log-transformed the UHR data, and the unadjusted and adjusted models are shown in Tables 3, 4. For the association between UHR and obesity in older adults defined by BMI, as shown in Model 1, without any adjustment for variables, the odds ratio (OR) was 4.25 (95% CI, 3.39–5.32; P < 0.001). The odds ratio (OR) was 6.56 (95% CI, 4.92–8.75; P < 0.001) after adjusting for gender, age, race, household poverty-to-income ratio, education, and marital status in Model 2. Smoking status, drinking status, exercise equivalents, hypertension, and diabetes were added to Model 3, and the odds ratio (OR) was 5.00 (95% CI, 3.75–6.67; P < 0.001).
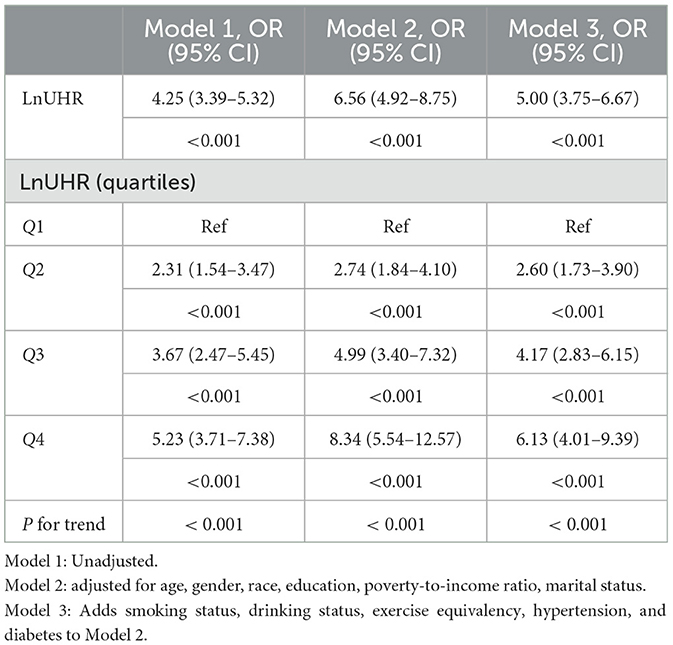
Table 3. Logistic regression results showed an association between the Ln UHR index and BMI-defined obesity in older adults.
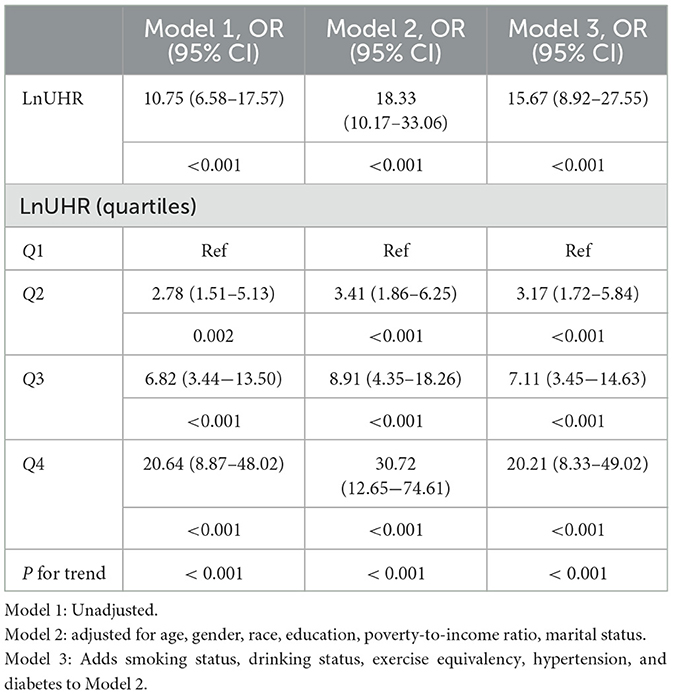
Table 4. Logistic regression results showed an association between the Ln UHR index and obesity defined by WHtR in older adults.
For UHR vs. obesity in older adults defined by WHtR, the odds ratio (OR) was 10.75 (95% CI,6.58–17.57; P < 0.001) without any adjustment for variables, as shown in Model 1. After adjusting for gender, age, race/ethnicity, household poverty-to-income ratio, education, and marital status in Model 2, the odds ratio (OR) was 18.33 (95% CI, 10.17–33.06; P < 0.001). Smoking status, drinking status, exercise equivalents, hypertension, and diabetes were added to Model 3, and the odds ratio (OR) was 15.67 (95% CI, 8.92–27.55; P < 0.001). This trend suggests that UHR is an independent risk factor for obesity in older adults and that its risk effect remains robust even after full correction for potential confounding variables.
Nonlinear associations and threshold effect
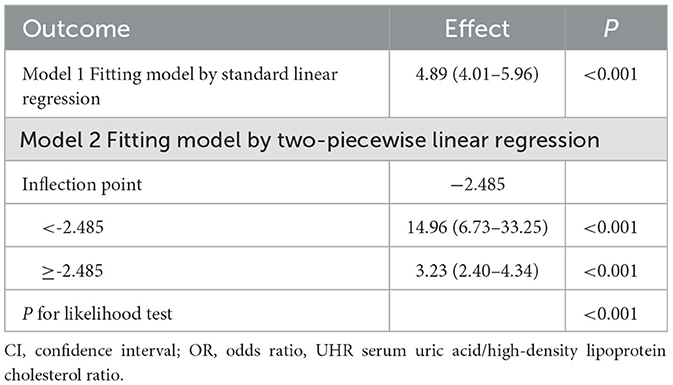
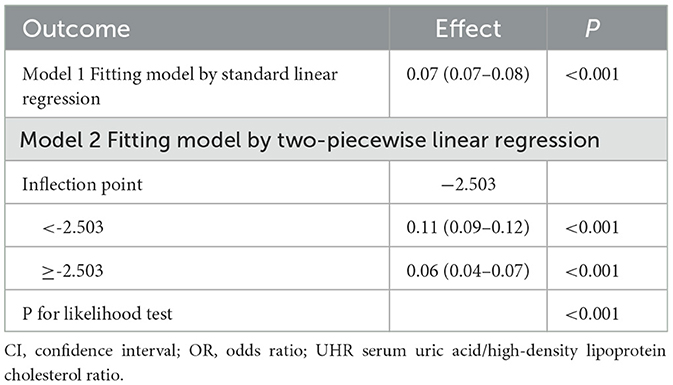
To examine the nonlinear dose-response relationship between the UHR index and obesity prevalence in older adults, restricted cubic spline analyses were implemented across three adjusted models (Figures 2A–F) As illustrated in the figure, nonlinear associations were consistently observed in all models, demonstrating a direct proportional relationship where elevated UHR indices corresponded with progressively higher obesity risks in older adults. The analytical framework employed restricted cubic splines with full covariate adjustment across models. Odds ratios (ORs) for obesity outcomes are presented as solid crimson trajectories and 95% confidence intervals depicted through semi-transparent red shading. Segmented regression models were used to calculate the threshold effect for each interval. In the relationship between UHR and obesity, as defined by BMI, the inflection point of the UHR index was −2.485. A significant positive correlation was observed when the UHR index was lower than −2.485 (OR = 14.96, 95% CI: 6.73, 33.25); a significant positive correlation was observed when the UHR index exceeded −2.485 (OR = 3.23, 95% CI: 2.40, 4.34). In the relationship between UHR and WHtR, the inflection point of the UHR index was −2.503, and when the UHR index was below −2.503, a significant positive correlation was observed (OR = 0.11, 95% CI: 0.09, 0.12); when the UHR index exceeded −2.503, a significant positive correlation was observed (OR = 0.06, 95% CI: 0.04–0.07) (Tables 5, 6).
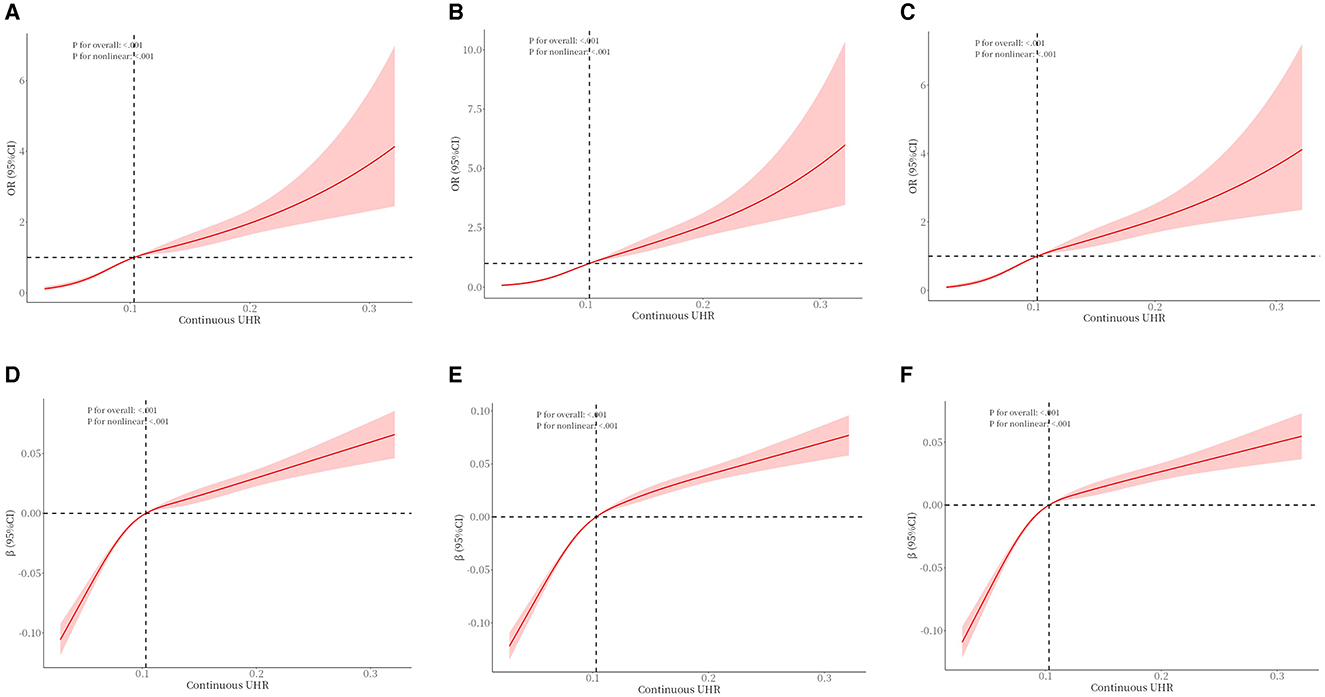
Figure 2. The association between UHR and obesity (defined by BMI) (A–C) in older adults and the association between UHR and WHtR (D–F) in older adults. (A) unadjusted. (B) Adjusted for age, gender, race, education, poverty-to-income ratio, and marital status. (C) Adds smoking status, drinking status, exercise equivalency, hypertension, and diabetes to Model B. (D) unadjusted. (E) Adjusted for age, gender, race, education, poverty-to-income ratio, and marital status. (F) Adds smoking status, drinking status, exercise equivalency, hypertension, and diabetes to Model E.
ROC curve
A receiver operating characteristic curve (ROC) analysis was used to assess the predictive performance of UHR about obesity risk in older adults (Figure 3). The area under the curve (AUC) indicates the predictive value of the index; a larger AUC indicates a better predictive value, while a smaller AUC indicates a lower predictive value. As shown, the ROC curve demonstrates the predictive power of the UHR for obesity risk in older adults. In the receiver operating characteristic analysis, the UHR predicted the AUC for obesity as defined by BMI (95% CI): 0.65 (0.63–0.66). UHR predicted AUC for obesity as defined by body mass index (BMI) in older men (95% CI): 0.67 (0.65–0.70), UHR predicted AUC for obesity as defined by body mass index (BMI) in older women (95% CI): 0.69 (0.67- 0.72). The UHR predicted the AUC for predicting obesity as defined by WHtR (95% CI): 0.75 (0.72–0.78). AUC (95% CI) for obesity in older men as defined by UHR predicted body mass index (WHtR): 0.76 (0.72–0.80), AUC (95% CI) for obesity in older women as defined by UHR predictive body mass index (WHtR): 0.83 (0.79–0.87).
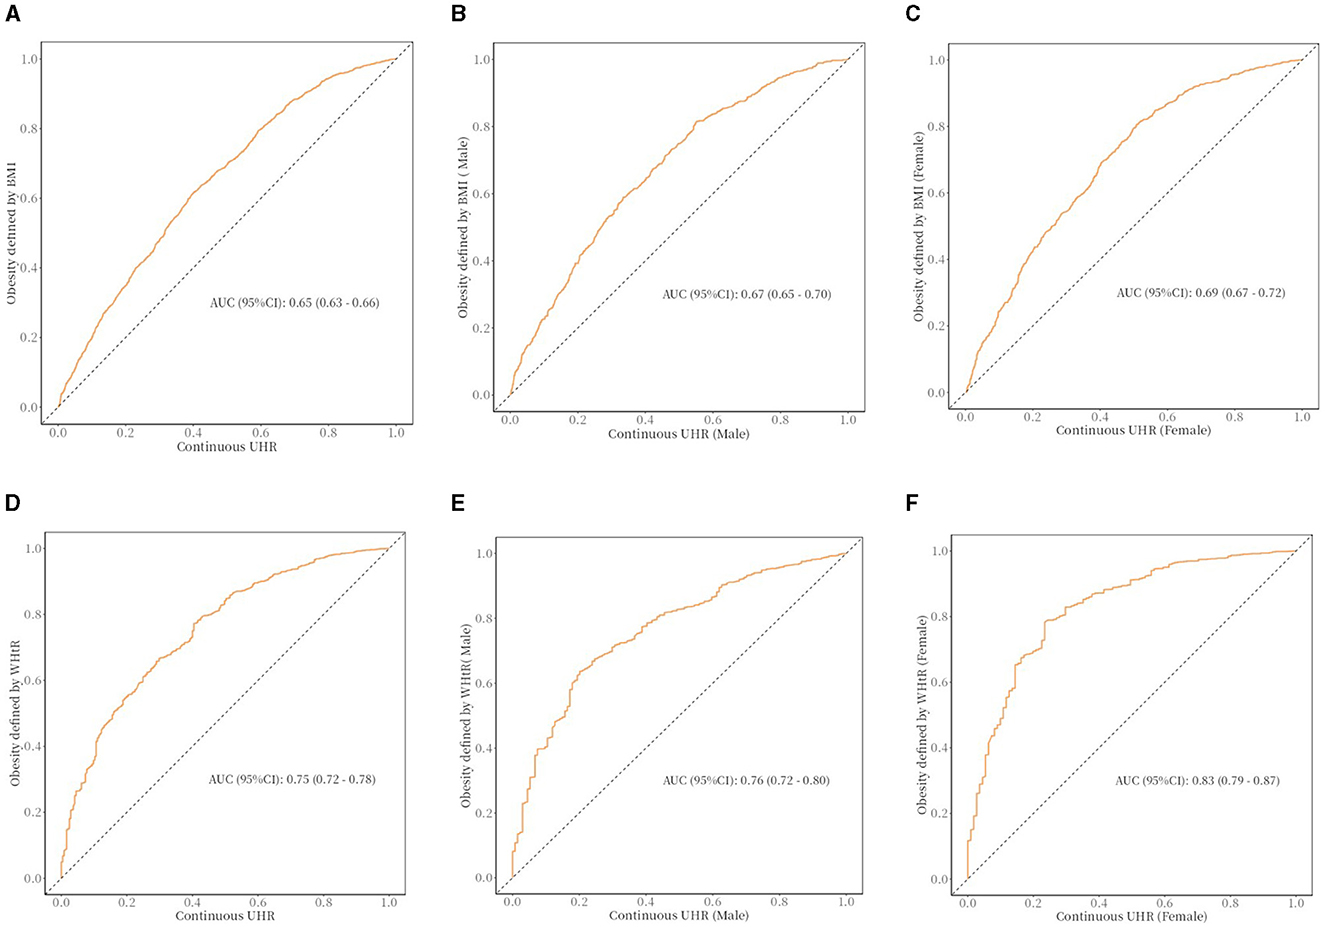
Figure 3. The ROC curve between UHR and obesity in older adults. (A) The ROC curve between UHR and obesity (defined by BMI) in older adults; cut off: 0.108. (B) The ROC curve between UHR and obesity (defined by BMI) in older adults (male); cut off: 0.109. (C) The ROC curve between UHR and obesity (defined by BMI) in older adults (female); cut off: 0.076. (D) The ROC curve between UHR and obesity (defined by WHtR) in older adults; cut off: 0.09. (E) The ROC curve between UHR and obesity (defined by WHtR) in older adults (male); cut off: 0.113. (F) The ROC curve between UHR and obesity (defined by WHtR) in older adults (female); cut off: 0.067.
Subgroup analysis
In this study, subgroup analyses and interaction tests were conducted to assess differences in the association between UHR and obesity defined by body mass index (BMI) or obesity defined by WHtR in older adults across subgroups to investigate the heterogeneity of this association. As shown in Tables 7, 8, none of the interaction P-values for the subgroups reached the critical value of statistical significance (all interaction P-values were more significant than 0.05), indicating that demographic characteristics, behavioral patterns, and health status variables did not have a significant effect on the positive association between UHR and obesity, and that, based on the results of the interaction test, the possibility of multiplicity in the hypothesis test leading to false positives was effectively controlled, and therefore no Bonferroni correction. The above results indicate a high degree of consistency in the positive association between UHR and obesity in older adults in subgroups with different demographic characteristics, behavioral patterns, and health status, which supports the robustness and generalizability of the relationship.
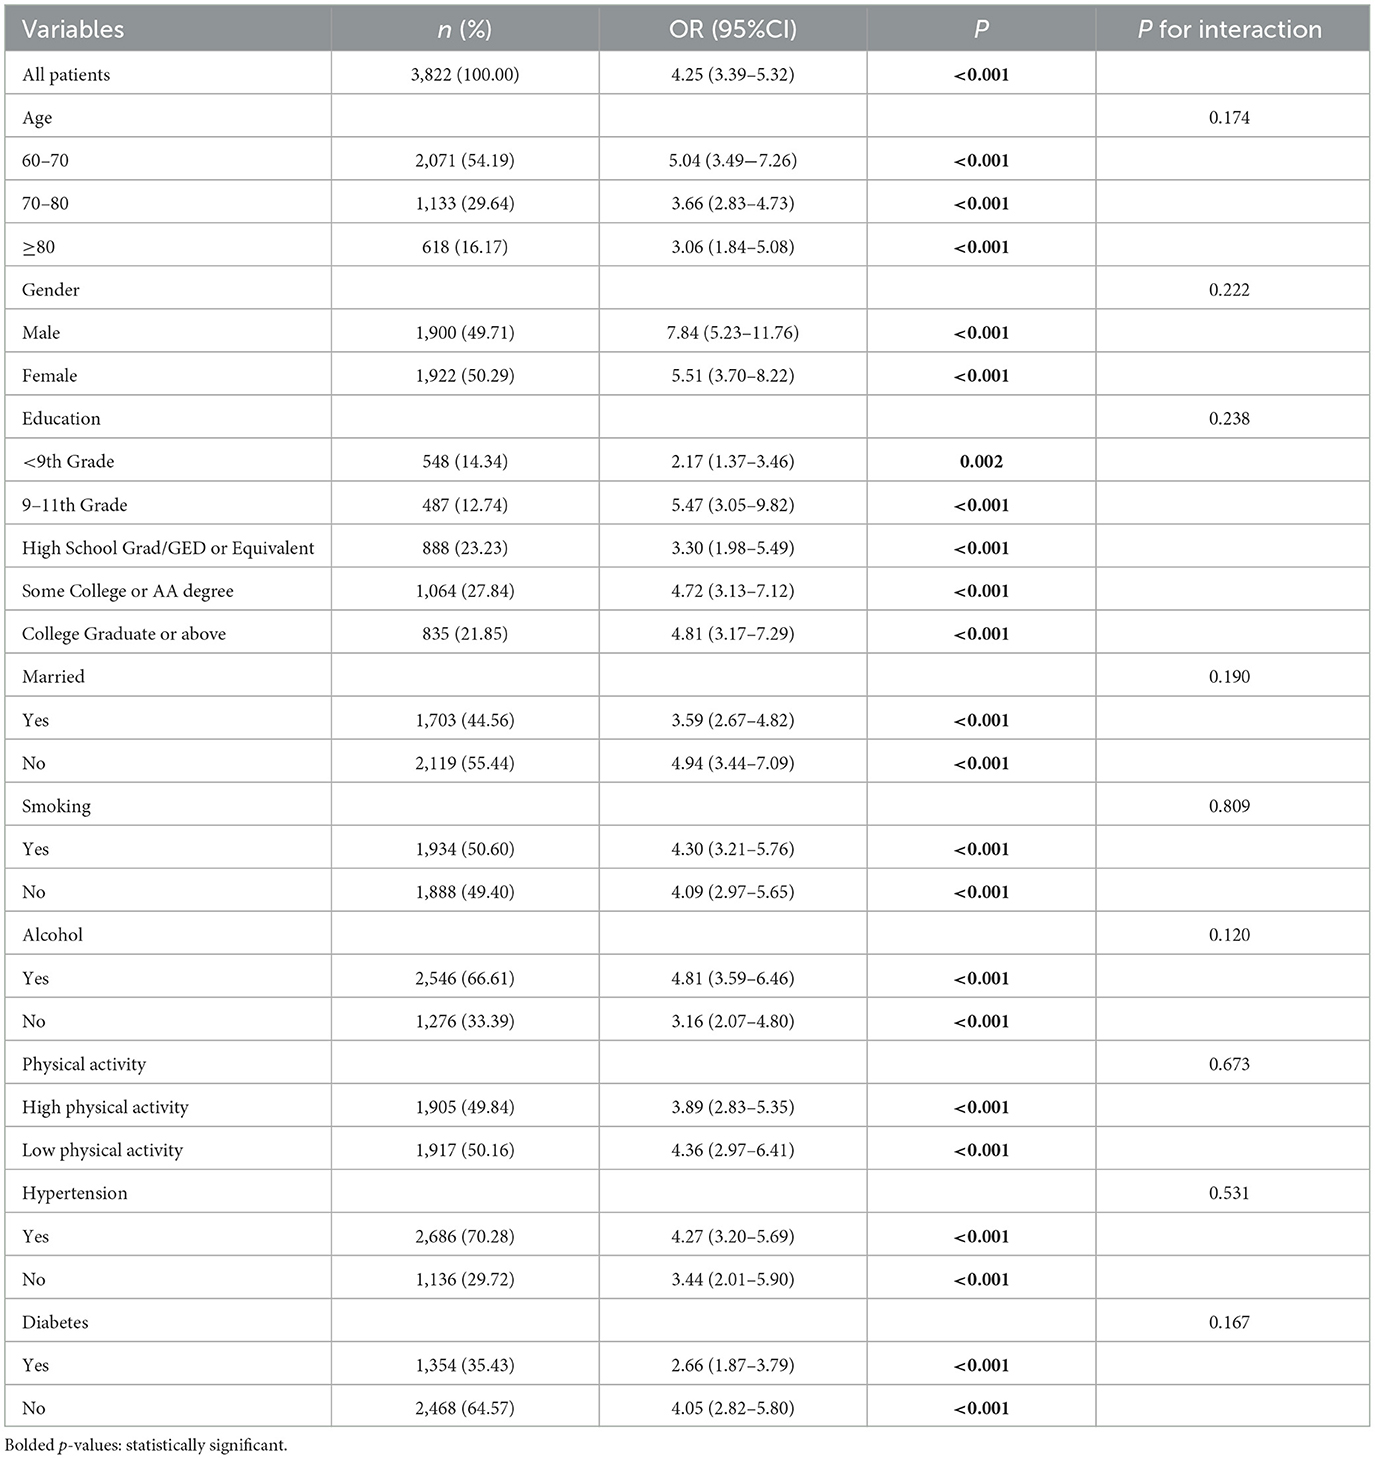
Table 7. Subgroup analysis for the association between UHR and obesity defined by BMI in older adults.
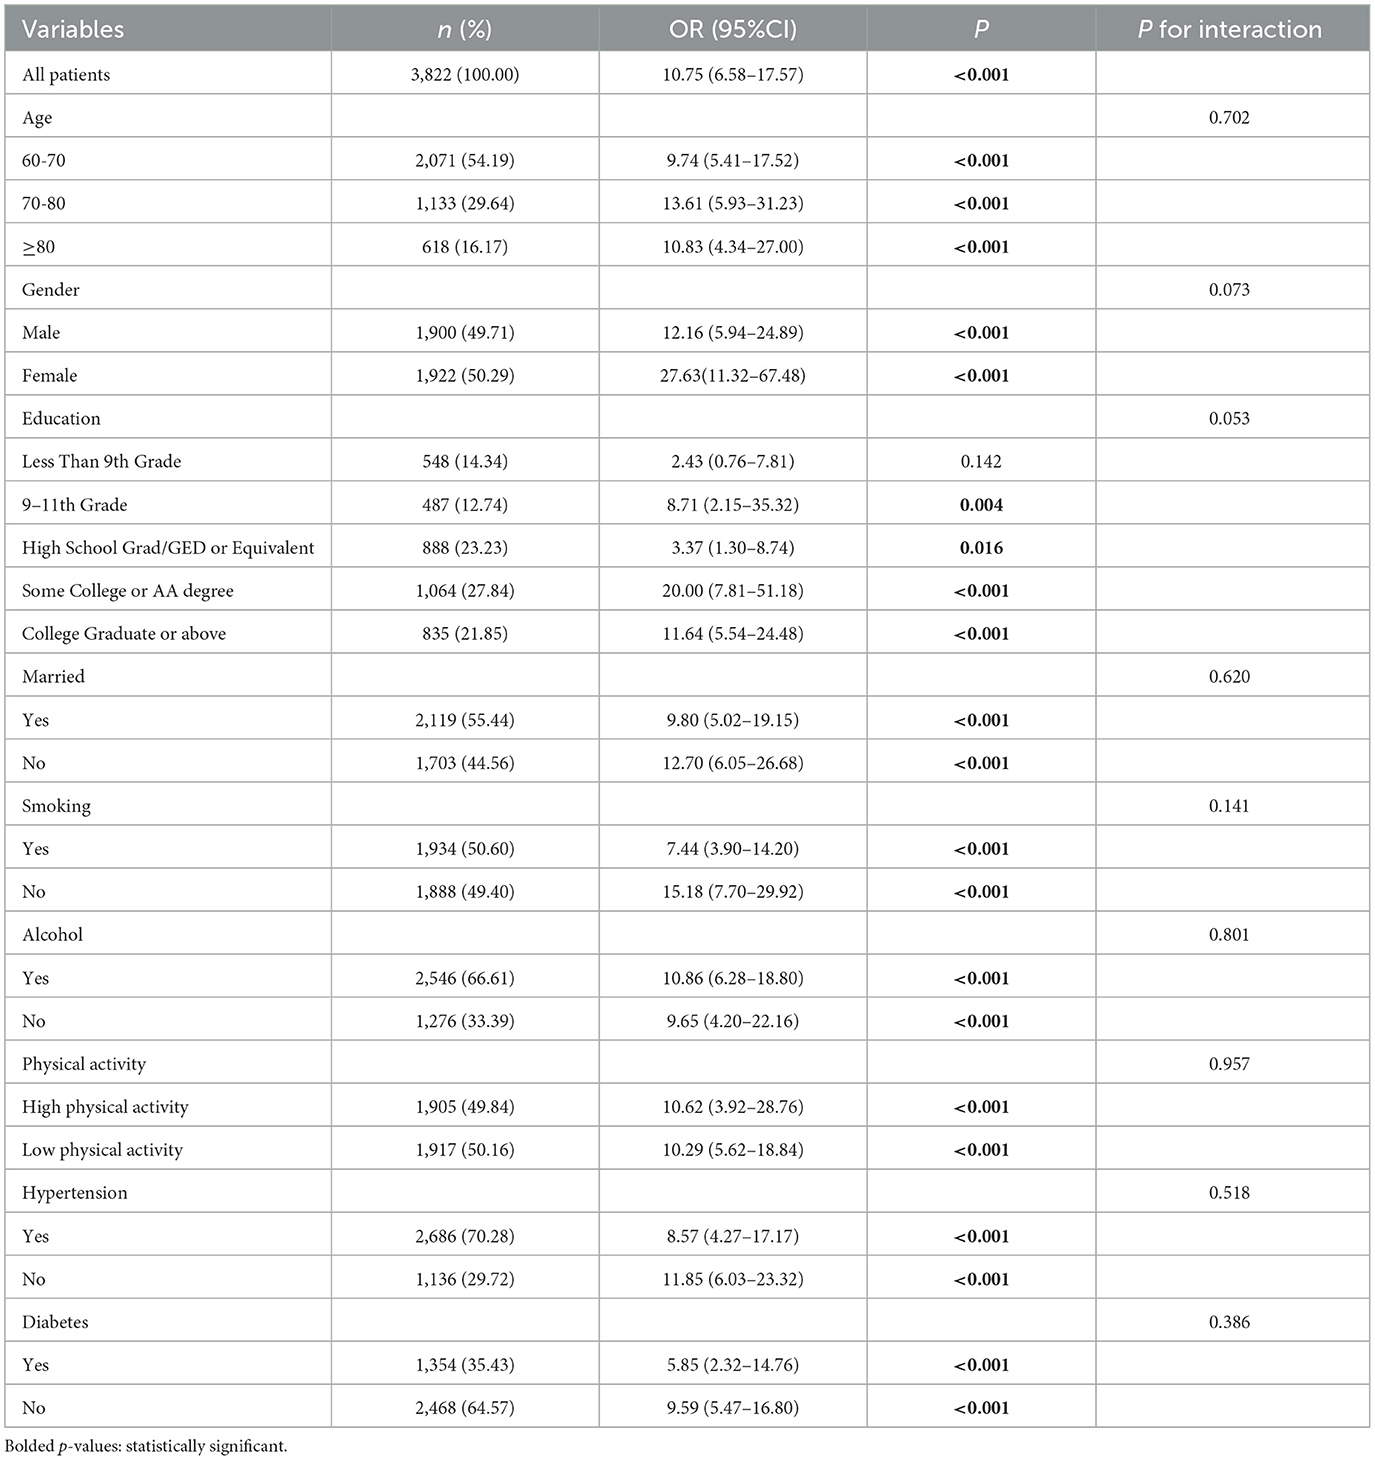
Table 8. Subgroup analysis for the association between UHR and obesity defined by WHtR in older adults.
Discussion
Using NHANES data from 2011 to 2016, this study examined the relationship between UHR and obesity in older adults. After a series of inclusion and exclusion, this study included as many as 3,822 cases. The data analysis revealed a positive relation between UHR and the risk of obesity in older adults, and this correlation was still evident after taking potential confounding factors into account. When the UHR was treated as a categorical variable, the risk of obesity defined by BMI in (Q4) was 6.13 times higher than that in (Q1). The risk of obesity defined by WHtR in (Q4) was 20.21 times higher than that in (Q1). Another noteworthy finding was a significant nonlinear dose-response relation between UHR and obesity in older adults. According to the ROC curve, the UHR can be an important tool for identifying older women at high risk for obesity. The analytical results provided evidence of a statistically significant positive relation between UHR and obesity in the geriatric population.
In older adults, BMI may underestimate obesity-related health risks (inability to differentiate fat distribution), resulting in a weaker predictive power of the UHR index. WHtR may be more appropriate for the older adults, as it is more sensitive to central obesity (independent of age-related muscle loss). The UHR index is more valuable in identifying metabolic risk-associated obesity (i.e., visceral adiposity), suggesting its potential as a complementary clinical tool. The UHR index could serve as a crucial therapeutic intervention target and a significant predictive factor in developing obesity prevention strategies for older adult populations. The consistency of the UHR-obesity association across heterogeneous population strata (varying in demographic composition, lifestyle patterns, and clinical status) was substantiated through rigorous subgroup analyses and interaction evaluations, confirming the epidemiological robustness of this metabolic relationship. This result confirms our initial hypothesis and emphasizes the important relationship between UHR and obesity in older adults. To formulate practical therapeutic approaches for older adults, it is crucial to thoroughly comprehend the relationship between UHR and adiposity-related health conditions in aging individuals. The uric acid and high-density lipoprotein cholesterol levels can be regulated by interventions such as a healthy diet, exercise, smoking, and drinking cessation. A series of measures may help reduce the index of UHR in older adults, reducing the risk of obesity.
Understanding the complex relationship between UA and HDL is essential for assessing health outcomes. Serving as a composite marker, its association with a range of metabolic disorders, such as non-alcoholic fatty liver disease (NAFLD) (34) and hypertension (33), has been established. The UHR indicates the dynamic equilibrium between the lipid-promoting attributes of UA and the fat-breaking function of HDL-C (42). The interaction between inflammatory and oxidative mechanisms in disease progression is revealed. Adipose tissue hypertrophy and hyperplasia in obesity are associated with hypoxic microenvironments that induce adipocyte apoptosis and necrosis, subsequently generating excessive reactive oxygen species (ROS) and activating oxidative stress pathways (43). In addition, the adipose tissue of obese people secrets a large number of pro-inflammatory factors, such as tumor necrosis factor-α (TNF-α) and interleukin-6 (IL-6), which not only cause inflammation in adipose tissue but also spread to the whole body through the systemic circulation (44). At the same time, macrophages in adipose tissue are also activated, further aggravating inflammation (45). Our study found a nonlinear relationship between uric acid to high-density lipoprotein cholesterol ratio (UHR) and obesity risk in older adults, whereas previous studies reported an inverted U-shaped relationship between uric acid and obesity. The ambivalent biological role of uric acid (UA) manifests as a concentration-dependent biphasic impact on adipogenesis regulation, demonstrating both protective and pathogenic potentials within obesity-related metabolic pathways. At physiological concentrations, UA reduces the generation of reactive oxygen species (ROS) by inhibiting NADPH oxidase activity and protecting mitochondrial function in adipocytes. However, chronic hyperuricemia can activate NLRP3 inflammasome, promote macrophage infiltration and IL-1β release in adipose tissue, and induce adipocyte hypertrophy and fibrosis (46). HDL-C and its major apolipoprotein component, ApoA-I, exert significant anti-inflammatory and organ-protective effects by scavenging lipopolysaccharides (LPS), suppressing pro-inflammatory cytokine production, and improving endothelial function (47). Thus HDL-C reduces the gene transcription of pro-inflammatory factors such as TNF-α, IL-6, and IL-8 (48). The role of uric acid and high-density lipoprotein (HDL) cholesterol in the pathogenesis of obesity and obesity-associated diseases is well supported by the available evidence (49, 50). Elevated UA levels, commonly seen in obese individuals, may exacerbate adipose tissue inflammation through xanthine oxidase-driven oxidative stress and impaired insulin signal (51).
High-density lipoprotein cholesterol (HDL-C) plays a protective role against obesity by improving adipose tissue function, modulating the secretion of adipokines such as adiponectin and leptin, and exerting anti-inflammatory and antioxidant effects (52). The superior predictive ability of the uric acid to HDL-C ratio (UHR) for obesity may be partly attributed to its reflection of uric acid-driven lipogenesis. Uric acid has been shown to induce mitochondrial oxidative stress in hepatocytes, inhibit aconitase activity in the tricarboxylic acid cycle, promote cytoplasmic citrate accumulation, and activate key lipogenic enzymes such as ATP-citrate lyase and fatty acid synthase, thereby enhancing de novo lipid synthesis (53). HDL-C-mediated lipid clearance: HDL-C enhances reverse cholesterol transport through the ABCA1/G1 pathway and inhibits ectopic lipid deposition by up-regulating adipose triglyceride lipase (ATGL) (54, 55).
This research contributes novel insights by (1) establishing UHR as a feasible biomarker for geriatric obesity risk assessment, (2) elucidating demographic-specific patterns of UHR-obesity associations, and (3) providing accurate evidence for clinical interpretation. These findings advance our pathophysiological understanding of metabolic dysregulation in aging populations while proposing practical tools for targeted screening and preventive intervention development. The utilization of the UHR index as a multidimensional biomarker has been demonstrated to establish innovative frameworks for enhancing diagnostic paradigms in geriatric adiposity assessment, and the interaction between oxidative and inflammatory mechanisms sheds light on the biological basis of this disease. So, the UHR holds promise in the clinical diagnosis, therapeutic surveillance, and prognostic assessment of obesity in older adults. This study demonstrates notable strengths, including the novel integration of UA and HDL-C as a composite biomarker. Previous studies have examined these biomarkers individually and may have overlooked their dynamic interactions in metabolic homeostasis. Our findings extend current knowledge by demonstrating that the UHR index (integrating UA and HDL-C) is associated with obesity metrics (e.g., waist circumference, visceral fat area) more than either component system alone. Compared to single metrics, UHR can identify older subclinical obese populations with a propensity for abnormal visceral fat accumulation 3–5 years earlier. This furnishes a valuable tool for examining its association with obesity in the aged. UHR has more obvious advantages than other metabolic markers: UHR can reflect the advantages of uric acid metabolism and lipid metabolism disorders at the same time, especially in obesity-related metabolic syndrome, which has a high value of application. However, metabolic heterogeneity exists in older adults obese population, and some patients may show “metabolically healthy obesity” (no apparent metabolic abnormality), while UHR mainly relies on uric acid and HDL-C and is unable to comprehensively assess other metabolic disorders, such as insulin resistance and inflammatory status. In terms of the study population, Analytical procedures were conducted using de-identified demographic and health metrics from the 2011–2016 cycle of NHANES to ensure the accuracy of the study as well as the breadth of the population. Based on this, the study weighted the data. It used multi-model logistic regression, restricted cubic spline curves, threshold effect, and subgroup analyses to control for various types of confounding factors, thus making the results more accurate. This study demonstrates that elevated UHR index levels correlate with increased obesity prevalence among older adults, carrying significant population health ramifications for combating and detecting obesity in this demographic.
Nevertheless, our research has certain constraints. The fact that this investigation is cross-sectional comes first in our analysis. This was able to determine associations between exposure factors and outcomes, but it could not determine their causal relationship. Therefore, it is necessary to perform Mendelian randomization, for example, to confirm causality and to explore tissue-specific effects through animal models. As a second point, the self-reported confounders can be easily influenced by biased recall. In addition, we might have failed to identify some potentially confounding variables; the possibility of bias remains. Secondly, the research concentrated on individuals aged 60 and above; as a result, Caution is warranted when extrapolating these findings to individuals under 60. Furthermore, the issues of whether UHR can be combined with other indicators for predicting obesity in older adults and the timing of UHR measurements need to be addressed. Subsequent experiments will aid in comprehending the potential mechanisms underlying the association between UHR and obesity.
Conclusion
UHR is independently associated with obesity in older adults. UHR can be used as a supportive indicator for obesity risk stratification, but further validation in prospective cohorts is needed. Interventions targeting UHR modulation may contribute to developing targeted obesity prevention strategies in aging populations.
Data availability statement
The original contributions presented in the study are included in the article/supplementary material, further inquiries can be directed to the corresponding author.
Ethics statement
Ethical review and approval was not required for the study on human participants in accordance with the local legislation and institutional requirements. Written informed consent from the [patients/ participants OR patients/participants legal guardian/next of kin] was not required to participate in this study in accordance with the national legislation and the institutional requirements.
Author contributions
FW: Data curation, Formal analysis, Investigation, Project administration, Resources, Writing – original draft. HQ: Conceptualization, Formal analysis, Writing – review & editing. YiZ: Data curation, Formal analysis, Writing – original draft. YaZ: Data curation, Formal analysis, Writing – review & editing. YN: Formal analysis, Funding acquisition, Investigation, Resources, Writing – review & editing. XH: Funding acquisition, Project administration, Supervision, Writing – original draft, Writing – review & editing.
Funding
The author(s) declare that financial support was received for the research and/or publication of this article. This work was supported by National Science and Technology Major Project (2023ZD0509805) and Zhejiang Province Chinese Medicine Science and Technology Program Key Project (2022ZZ019).
Acknowledgments
We sincerely appreciate the NHANES databases offering their platform and supplying valuable datasets.
Conflict of interest
The authors declare that the research was conducted without commercial or financial relationships that could create a conflict of interest.
Generative AI statement
The author(s) declare that no Gen AI was used in the creation of this manuscript.
Publisher's note
All claims expressed in this article are solely those of the authors and do not necessarily represent those of their affiliated organizations, or those of the publisher, the editors and the reviewers. Any product that may be evaluated in this article, or claim that may be made by its manufacturer, is not guaranteed or endorsed by the publisher.
References
1. Engin A. The definition and prevalence of obesity and metabolic syndrome. Adv Exp Med Biol. (2017) 960:1–17. doi: 10.1007/978-3-319-48382-5_1
2. Yoo EG. Waist-to-height ratio as a screening tool for obesity and cardiometabolic risk. Korean J Pediatr. (2016) 59:425–31. doi: 10.3345/kjp.2016.59.11.425
3. Koliaki C, Dalamaga M, Liatis S. Update on the obesity epidemic: after the sudden rise, is the upward trajectory beginning to flatten? Curr Obes Rep. (2023) 12:514–27. doi: 10.1007/s13679-023-00527-y
4. Genario R, Gil S, Oliveira-Júnior G, Leitão AE, Franco T, dos Santos Sales RC, et al. Sleep quality is a predictor of muscle mass, strength, quality of life, anxiety, and depression in older adults with obesity. Sci Rep. (2023) 13:11256. doi: 10.1038/s41598-023-37921-4
5. Powell-Wiley TM, Poirier P, Burke LE, Després J-P, Gordon-Larsen P, Lavie CJ, et al. Obesity and cardiovascular disease: a scientific statement from the american heart association. Circulation. (2021) 143:e984–e1010. doi: 10.1161/CIR.0000000000000973
6. Bae JP, Nelson DR, Boye KS, Mather KJ. Prevalence of complications and comorbidities associated with obesity: a health insurance claims analysis. BMC Public Health. (2025) 25:273. doi: 10.1186/s12889-024-21061-z
7. Clayton TL, Fitch A, Bays HE. Obesity and hypertension: obesity medicine association (OMA) clinical practice statement (CPS) 2023. Obesity Pillars. (2023) 8:100083. doi: 10.1016/j.obpill.2023.100083
8. Zheng C, Liu Y, Xu C, Zeng S, Wang Q, Guo Y, et al. Association between obesity and the prevalence of dyslipidemia in middle-aged and older people: an observational study. Sci Rep. (2024) 14:11974. doi: 10.1038/s41598-024-62892-5
9. Zhou X-D, Chen Q-F, Yang W, Zuluaga M, Targher G, Byrne CD, et al. Erratum: Burden of disease attributable to high body mass index: an analysis of data from the Global Burden of Disease Study 2021. eClinicalMedicine. (2024) 76:102848. doi: 10.1016/j.eclinm.2024.102958
10. Dias KA, Ramos JS, Wallen MP, Davies PSW, Cain PA, Leong GM, et al. Accuracy of longitudinal assessment of visceral adipose tissue by dual-energy X-ray absorptiometry in children with obesity. J Obes. (2019) 2019:2193723. doi: 10.1155/2019/2193723
11. Chen Y, Yu W, Lv J, Sun D, Pei P, Du H, et al. Early adulthood BMI and cardiovascular disease: a prospective cohort study from the China Kadoorie Biobank. Lancet Public Health. (2024) 9:e1005–13. doi: 10.1016/S2468-2667(24)00043-4
12. Prillaman M. Why BMI is flawed and how to redefine obesity. Nature. (2023) 622:232–3. doi: 10.1038/d41586-023-03143-x
13. Schneider HJ, Glaesmer H, Klotsche J, Böhler S, Lehnert H, Zeiher AM, et al. Accuracy of anthropometric indicators of obesity to predict cardiovascular risk. J Clin Endocrinol Metab. (2007) 92:589–94. doi: 10.1210/jc.2006-0254
14. Gui J, Li Y, Liu H, Guo LL Li J, Lei Y, et al. Obesity- and lipid-related indices as a predictor of obesity metabolic syndrome in a national cohort study. Front Public Health. (2023) 11:1073824. doi: 10.3389/fpubh.2023.1073824
15. Andres-Hernando A, Cicerchi C, Kuwabara M, Orlicky DJ, Sanchez-Lozada LG, Nakagawa T, et al. Umami-induced obesity and metabolic syndrome is mediated by nucleotide degradation and uric acid generation. Nat Metab. (2021) 3:1189–201. doi: 10.1038/s42255-021-00454-z
16. Patterson RA, Horsley ET, Leake DS. Prooxidant and antioxidant properties of human serum ultrafiltrates toward LDL: important role of uric acid. J Lipid Res. (2003) 44:512–21. doi: 10.1194/jlr.M200407-JLR200
17. Paterson HAB, Yu S, Artigas N, Prado MA, Haberman N, Wang YF, et al. Liver RBFOX2 regulates cholesterol homeostasis via Scarb1 alternative splicing in mice. Nat Metab. (2022) 4:1812–29. doi: 10.1038/s42255-022-00681-y
18. Wang Y, Zhang W, Qian T, Sun H, Xu Q, Hou X, et al. Reduced renal function may explain the higher prevalence of hyperuricemia in older people. Sci Rep. (2021) 11:1302. doi: 10.1038/s41598-020-80250-z
19. Holzer M, Trieb M, Konya V, Wadsack C, Heinemann A, Marsche G. Aging affects high-density lipoprotein composition and function. Biochim Biophys Acta. (2013) 1831:1442–8. doi: 10.1016/j.bbalip.2013.06.004
20. Gherghina ME, Peride I, Tiglis M, Neagu TP, Niculae A, Checherita IA. Uric acid and oxidative stress-relationship with cardiovascular, metabolic, and renal impairment. Int J Mol Sci. (2022) 23:3188. doi: 10.3390/ijms23063188
21. Zhou Y, Li H, Xia N. The interplay between adipose tissue and vasculature: role of oxidative stress in obesity. Front Cardiovasc Med. (2021) 8:650214. doi: 10.3389/fcvm.2021.650214
22. Yadav R, France M, Aghamohammadzadeh R, Liu Y, Hama S, Kwok S, et al. Impairment of high-density lipoprotein resistance to lipid peroxidation and adipose tissue inflammation in obesity complicated by obstructive sleep apnea. J Clin Endocrinol Metab. (2014) 99:3390–8. doi: 10.1210/jc.2013-3939
23. Grebe A, Hoss F, Latz E. NLRP3 inflammasome and the IL-1 pathway in atherosclerosis. Circ Res. (2018) 122:1722–40. doi: 10.1161/CIRCRESAHA.118.311362
24. Hao Y, Miao J, Liu W, Peng L, Chen Y, Zhong Q. Formononetin protects against cisplatin-induced acute kidney injury through activation of the PPARα/Nrf2/HO-1/NQO1 pathway. Int J Mol Med. (2021) 47:511–22. doi: 10.3892/ijmm.2020.4805
25. Huang X, Hu L, Tao S, Xue T, Hou C, Li J. Relationship between uric acid to high-density cholesterol ratio (UHR) and circulating α-klotho: evidence from NHANES 2007-2016. Lipids Health Dis. (2024) 23:244. doi: 10.1186/s12944-024-02234-6
26. Seo YJ, Shim YS, Lee HS, Hwang JS. Association of serum uric acid levels with metabolic syndromes in Korean adolescents. Front Endocrinol. (2023) 14:1159248. doi: 10.3389/fendo.2023.1159248
27. Deng X, Ma L, Li P, He M, Jin R, Tao Y, et al. Identifying and optimizing relevant factors for chronic kidney disease in abdominal obesity patients by machine learning methods: insights from NHANES 2005-2018. Lipids Health Dis. (2024) 23:390. doi: 10.1186/s12944-024-02384-7
28. Cai X, Zhao N, Yang X, Ma J, Liang Y, Liao Y, et al. The association between body roundness index and new-onset hyperuricemia in Chinese population: the Kailuan cohort study. BMC Public Health. (2025) 25:205. doi: 10.1186/s12889-025-21440-0
29. Bora K, Pathak MS, Borah P, Das D. Association of decreased high-density lipoprotein cholesterol (HDL-C) with obesity and risk estimates for decreased HDL-C attributable to obesity: preliminary findings from a hospital-based study in a city from Northeast India. J Prim Care Community Health. (2017) 8:26–30. doi: 10.1177/2150131916664706
30. Zhu Z, Liu J, Hao X, Guo H, Zhang X, He M, et al. Estimation of physiological aging based on routine clinical biomarkers: a prospective cohort study in elderly Chinese and the UK Biobank. BMC Med. (2024) 22:552. doi: 10.1186/s12916-024-03769-2
31. Huang X, Hu L, Li J, Wang X. U-shaped association of uric acid to HDL cholesterol ratio (UHR) with ALL-cause and cardiovascular mortality in diabetic patients: NHANES 1999-2018. BMC Cardiovasc Disord. (2024) 24:744. doi: 10.1186/s12872-024-04436-3
32. Li Z, Liu Q, Yao Z. The serum uric acid-to-high-density lipoprotein cholesterol ratio is a predictor for all-cause and cardiovascular disease mortality: a cross-sectional study. Front Endocrinol. (2024) 15:1417485. doi: 10.3389/fendo.2024.1417485
33. Han X, Tan X, Liu M, Wei Y, He A, Pan Y, et al. Association between serum uric acid/high-density lipoprotein cholesterol ratio and hypertension among reproductive-aged women. J Health Popul Nutr. (2023) 42:123. doi: 10.1186/s41043-023-00458-3
34. Xie Y, Huang K, Zhang X, Wu Z, Wu Y, Chu J, et al. Association of serum uric acid-to-high-density lipoprotein cholesterol ratio with non-alcoholic fatty liver disease in American adults: a population-based analysis. Front Med. (2023) 10:1164096. doi: 10.3389/fmed.2023.1164096
35. Zipf G, Chiappa M, Porter KS, Ostchega Y, Lewis BG, Dostal J. National health and nutrition examination survey: plan and operations, 1999-2010. Vital Health Stat. (2013) 1:1−37
36. Samper-Ternent R, Al Snih S. Obesity in older adults: epidemiology and implications for disability and disease. Rev Clin Gerontol. (2012) 22:10–34. doi: 10.1017/S0959259811000190
37. Liu J, Zhang X, Meng T, Wang X, Wang L. Exploring the relationship between the uric acid to high-density lipoprotein cholesterol ratio and depression: a cross-sectional study from NHANES. Sci Rep. (2024) 14:32018. doi: 10.1038/s41598-024-83655-2
38. Xiao Q, Cai B, Yin A, Huo H, Lan K, Zhou G, et al. L-shaped association of serum 25-hydroxyvitamin D concentrations with cardiovascular and all-cause mortality in individuals with osteoarthritis: results from the NHANES database prospective cohort study. BMC Med. (2022) 20:308. doi: 10.1186/s12916-022-02510-1
39. MacGregor KA, Gallagher IJ, Moran CN. Relationship between insulin sensitivity and menstrual cycle is modified by BMI, fitness, and physical activity in NHANES. J Clin Endocrinol Metab. (2021) 106:2979–90. doi: 10.1210/clinem/dgab415
40. Li C, Shang S. Relationship between sleep and hypertension: findings from the NHANES (2007–2014). Int J Environ Res Public Health. (2021) 18:7867. doi: 10.3390/ijerph18157867
41. Zhang H, Wang L, Zhang Q, Song Y, Cai M, Bao J, et al. Non-linear association of triglyceride-glucose index with cardiovascular and all-cause mortality in T2DM patients with diabetic kidney disease: NHANES 2001-2018 retrospective cohort study. Lipids Health Dis. (2024) 23:253. doi: 10.1186/s12944-024-02249-z
42. Chen Z, Cheang I, Qu Q, Zhu X, Fu Y, Gao R, et al. Associations of serum uric acid-to-high density lipoprotein cholesterol ratio with age-related diseases and mortality among older population in the United States. Arch Gerontol Geriatr. (2025) 130:105707. doi: 10.1016/j.archger.2024.105707
43. Engin A. Adipose Tissue Hypoxia in Obesity: Clinical Reappraisal of Hypoxia Hypothesis. Adv Exp Med Biol. (2024) 1460:329–56. doi: 10.1007/978-3-031-63657-8_11
44. Lago-Baameiro N, Camino T, Vazquez-Durán A, Sueiro A, Couto I, Santos F, et al. Intra and inter-organ communication through extracellular vesicles in obesity: functional role of obesesomes and steatosomes. J Transl Med. (2025) 23:207. doi: 10.1186/s12967-024-06024-7
45. Wu X, Chen H, Tian Y, Wang H, Hou H, Hu Q, et al. Amelioration of obesity-associated disorders using solanesol with the mitigation of NLRP3 inflammasome activation and macrophage inflammation in adipose tissue. Food Funct. (2025) 16:1903–18. doi: 10.1039/d4fo05586a
46. Du L, Zong Y, Li H, Wang Q, Xie L, Yang B, et al. Hyperuricemia and its related diseases: mechanisms and advances in therapy. Signal Transduct Target Ther. (2024) 9:212. doi: 10.1038/s41392-024-01916-y
47. Rosenson RS, Brewer HB, Barter PJ, Björkegren JLM, Chapman MJ, Gaudet D, et al. HDL and atherosclerotic cardiovascular disease: genetic insights into complex biology. Nat Rev Cardiol. (2018) 15:9–19. doi: 10.1038/nrcardio.2017.115
48. Stasi A, Fiorentino M, Franzin R, Staffieri F, Carparelli S, Losapio R, et al. Beneficial effects of recombinant CER-001 high-density lipoprotein infusion in sepsis: results from a bench to bedside translational research project. BMC Med. (2023) 21:392. doi: 10.1186/s12916-023-03057-5
49. Johnson RJ, Lanaspa MA, Gaucher EA. Uric acid: a danger signal from the RNA world that may have a role in the epidemic of obesity, metabolic syndrome, and cardiorenal disease: evolutionary considerations. Semin Nephrol. (2011) 31:394–9. doi: 10.1016/j.semnephrol.2011.08.002
50. Sirtori CR, Corsini A, Ruscica M. The role of high-density lipoprotein cholesterol in 2022. Curr Atheroscler Rep. (2022) 24:365–77. doi: 10.1007/s11883-022-01012-y
51. Battelli MG, Bortolotti M, Polito L, Bolognesi A. The role of xanthine oxidoreductase and uric acid in metabolic syndrome. Biochim Biophys Acta Mol Basis Dis. (2018) 1864:2557–65. doi: 10.1016/j.bbadis.2018.05.003
52. Bacchetti T, Morresi C, Simonetti O, Ferretti G. Effect of diet on HDL in obesity. Molecules. (2024) 29:5955. doi: 10.3390/molecules29245955
53. Lanaspa MA, Sanchez-Lozada LG, Choi YJ, Cicerchi C, Kanbay M, Roncal-Jimenez CA, et al. Uric acid induces hepatic steatosis by generation of mitochondrial oxidative stress: potential role in fructose-dependent and -independent fatty liver. J Biol Chem. (2012) 287:40732–44. doi: 10.1074/jbc.M112.399899
54. Ye D, Lammers B, Zhao Y, Meurs I, Van Berkel TJ, Van Eck M. ATP-binding cassette transporters A1 and G1, HDL metabolism, cholesterol efflux, and inflammation: important targets for the treatment of atherosclerosis. Curr Drug Targets. (2011) 12:647–60. doi: 10.2174/138945011795378522
Keywords: uric acid to high-density lipoprotein cholesterol ratio (UHR), HDL cholesterol, uric acid, geriatric obesity, NHANES, metabolic syndrome
Citation: Wang F, Qiao H, Zheng Y, Zheng Y, Ni Y and He X (2025) Exploring the nonlinear relationship between serum uric acid to high-density lipoprotein cholesterol ratio and obesity in older adults: a cross-sectional study. Front. Public Health 13:1587194. doi: 10.3389/fpubh.2025.1587194
Received: 04 March 2025; Accepted: 10 April 2025;
Published: 01 May 2025.
Edited by:
Minghui Li, University of Tennessee Health Science Center (UTHSC), United StatesReviewed by:
Chonin Cheang, Macau Society for Health Economics, Macao SAR, ChinaLívia Agostini, Universidade Federal de Ouro Preto, Brazil
Hamida Kwas, University of Sfax, Tunisia
Copyright © 2025 Wang, Qiao, Zheng, Zheng, Ni and He. This is an open-access article distributed under the terms of the Creative Commons Attribution License (CC BY). The use, distribution or reproduction in other forums is permitted, provided the original author(s) and the copyright owner(s) are credited and that the original publication in this journal is cited, in accordance with accepted academic practice. No use, distribution or reproduction is permitted which does not comply with these terms.
*Correspondence: Xiaoming He, MTM1ODg0NDg1NDhAMTI2LmNvbQ==
 Fanchang Wang
 Hongyang Qiao2