 Trang Dao-Siebel1,2
 Jakob Holstiege3
 Kathrin Graw4
 Christoph Müller5
 Andreas Matzarakis6,7Roxana Halbleib1Evelyn Lamy2*
- 1Faculty of Economics and Behavioral Sciences, University of Freiburg, Freiburg, Germany
- 2Research of Environment-Related Mechanisms of Action on Health, Medical Faculty, University of Augsburg, Augsburg, Germany
- 3Central Research Institute of Ambulatory Health Care in Germany, Berlin, Germany
- 4German Meteorological Service, Research Centre Human Biometeorology, Freiburg, Germany
- 5Center for Pediatrics and Adolescent Medicine, Faculty of Medicine, University of Freiburg, Freiburg, Germany
- 6Environmental Meteorology, Department of Earth and Environmental Sciences, Faculty of Environment and Natural Resources, University of Freiburg, Freiburg, Germany
- 7Department of Epidemiology and Healthcare Atlas, Democritus University of Thrace, Komotini, Greece
Background: Allergic conditions including hay fever are a sentinel measure of environmental impact on human health in early life. In this study we investigated the association between climate indicators and allergic rhinitis (hay fever) incidence in children and adolescents in Freiburg im Breisgau (Germany), as a representative study site for an urban German environment.
Methods: Data on climate indicators and hay fever incidence in children and adolescents in the period 2013 to 2021 were implemented within the free software environment for statistical computing R using generalized additive Gamma family models.
Results: Our results from all “seasonal”, “non-seasonal”, and “single-factor” models could not support the associations between the hay fever incidence and the precipitation as well as the concentrations of PM10, NO2, and O3 in Freiburg. However, they indicated statistically significant associations with temperature, and wind speed at the 5% level. The hay fever incidence was highest, as the temperature was between 4–6°C, and 10–17°C, and the wind speed was between 2.0 and 2.1m/s.
Conclusions: This knowledge could be of relevance for the choice of patient treatment procedure in Freiburg, as the symptoms of a cold or flu can easily be mistaken for an allergy, especially in the cold season.
1 Introduction
Climate change is one of the most difficult and complex challenges facing the world, causing numerous environmental changes such as rising temperatures, changes in precipitation, more intense and frequent extreme events such as heat waves, droughts, storms (1), and worsening air quality (2). All these climate change indicators have increasingly negative impacts on humans and natural systems (3, 4).
Allergic conditions are a sentinel measure of environmental impact on human health in early life. In Germany, approximately 34% of the population is affected by at least one allergic disease in their lives, and half of the population has shown allergic sensibilization (5). Respiratory allergies are among the most common respiratory diseases and represent a major contributor to both direct and indirect healthcare costs. Allergic rhinitis or hay fever is the predominant prevalent type of respiratory allergy and known for affecting the quality of life. Studies disclosed that in Germany 15% of adults (6), and 9.9% of children and adolescents (7, 8) suffered from hay fever. Consequently, treatment costs for only pollen allergy sufferers amount to around 240 million Euros on average every year (9).
There is a notable amount of literature on the association between hay fever and climate indicators, but the outcomes are often mixed and sometimes contradictory. Regarding temperature and extreme events, several studies demonstrated, that both, heat and cold, can significantly increase the risk of hay fever (10–15). In contrast, Hsieh et al. reported a negative relationship between temperature and rhinitis cases (16), while Wang et al. found a positive association (17). Interestingly, until now, very few studies report on the effect of wind speed and precipitation on hay fever. The existing studies on this topic have produced conflicting results, for instance Wang et al. found that wind speed is negatively associated with hay fever (17), whereas Lou et al. found a positive association (18). Similarly, the relationship between precipitation and allergic rhinitis has also yielded conflicting findings. A study by Wang et al. reported a positive association between precipitation and hay fever (17), whereas a study by Peternel et al. found that the more it rains the less allergen exposure occurs (19). Therefore, a negative association between precipitation and hay fever incidence could be expected.
Additionally, an increasing concentration of ground-level ozone (O3) has also been considered as a climate change indicator. O3 is a respiratory irritant and can worsen hay fever symptoms as demonstrated in some studies (20–24). However, also no significant association was found between the allergic rhinitis and O3 (25–27). The formation (and degradation) of O3 correlates well with nitrogen oxide (NO2) levels (28, 29). Hence, it is important to pay attention to the relationship between NO2 and hay fever, as well. Higher NO2 concentration may be associated with lower pollen quantity due to the negative effects of NO2 on either the development of plants or on their blossoming and pollen production (30–32). In vitro, NO2 can cause a general drop in the germination and allergenic protein content of exposed pollen grains (33, 34). Thus, a negative relationship between pollen season and NO2 could be assumed. While Burte et al. and Gehring et al. could not find evidence of association between NO2 and rhinitis (35, 36), others reported that the exposure to NO2 negatively impacted the respiratory system and exacerbated the severity of the allergic airway inflammation (37, 38). Similar to the gaseous air pollutants, contrasting results about association between hay fever and PM10 levels were also found. While Kang et al. indicated that no significant correlations were observed between changes in the PM10 concentration and allergic symptom scores (39), Pénard-Morand et al. and Puklová et al. found that PM10 positively associated with both lifetime and current allergic rhinitis (40, 41).
All these contradictory results call for further research to better understand these relationships and develop effective prevention and intervention strategies, especially in the context of climate change. Furthermore, the effects of climate change indicators are multifaceted, with each geographic region having its own characteristics. Specifically, we clarified that children with hay fever have an elevated risk of developing asthma (42), which has been associated with long-term reductions in adult lung function (43). Furthermore, children are potentially more susceptible to environmental allergens and pollutants due to their higher oxygen consumption per unit of body weight and the immaturity of their respiratory and immune systems (44). Additionally, as children spend more time in outdoor environments, their exposure to outdoor environmental factors is likely to be greater (44).
Against this background, the present study investigated the association between different climate change indicators and hay fever in children and adolescents in the middle European city Freiburg im Breisgau (Germany) using quarterly incidence data from 2013 to 2021 in the age group 0–17 years. To the best of our knowledge, there are no comparable studies for Germany covering the last decade.
2 Materials and methods
2.1 Study area
Freiburg im Breisgau (Germany) was chosen as a representative study site for an urban setting, because of its unique characteristics. The city has attracted global attention for its sustainable urban development, successes in green, low-carbon economy, mobility, energy, and land use planning (45). Freiburg is located on the western edge of the Black Forest in the Upper Rhine Valley in southwestern Germany, and it is well known as one of the warmest areas in the country. It has a size of 15,307 ha (46), a population of 234,442 people (47), and a high population density of 1,511/km2. An overview map of the study area can be seen from Figure 1 (for detailed material and methods consult the Supplementary material S1).
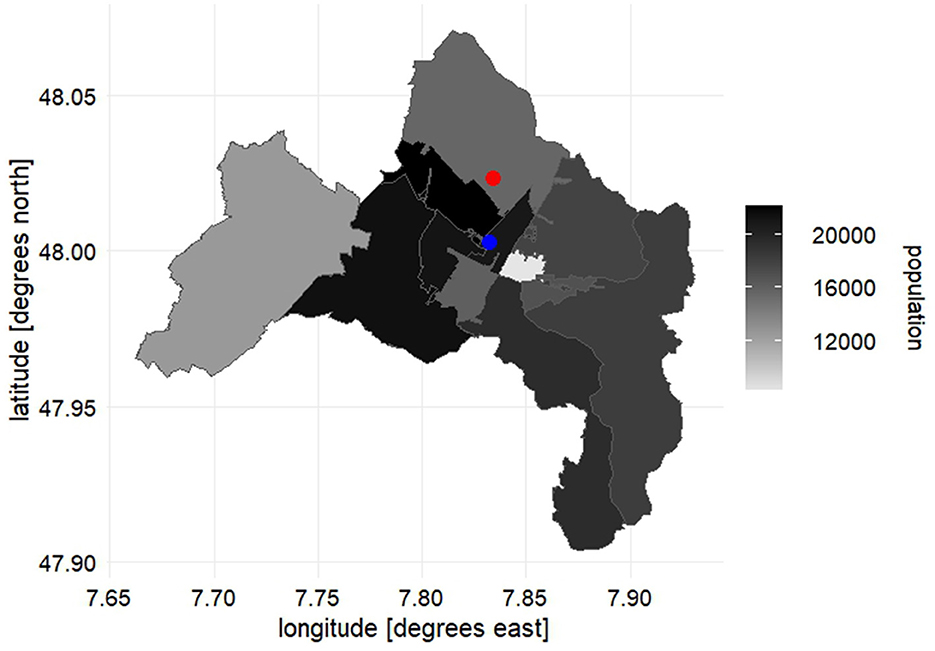
Figure 1. An overview map of Freiburg im Breisgau. The population decreases gradually across regions from black to gray. The red and blue points are the observation stations of the meteorological parameters and the air pollutants, respectively.
2.2 Data of climate indicators
For this study, several climate indicators, such as daily mean temperature at 2 m above ground level (°C), daily total precipitation (mm), and daily mean wind speed (m/s) of station no. 1443 Freiburg, sampled from 2007 to 2021, have been provided by the German Meteorological Service (Deutscher Wetterdienst DWD, 2022). Hourly data for ozone O3 (μg/m3) and nitrogen dioxide NO2 (μg/m3) from 2007 to 2021, as well as particulate matter of aerodynamic diameter less than 10 μm PM10 (μg/m3) from 2013 to 2021 for the Freiburg DEBW084 station, provided by Federal Environment Agency, have also been selected. These stations are typical for urban residential areas away from the major roads (Figure 1). For the studied period, the measurement of particulate matter of aerodynamic diameter <2.5 μm PM2.5 in the study area could not be fully accounted for, as the station measuring PM2.5 was not established until 01.01.2019.
2.3 Respiratory allergy data
Quarterly incidence of hay fever per 1,000 children and adolescents at risk aged 0–17 years in Freiburg, from 2013 until 2021, were provided by the Central Research Institute of Ambulatory Health Care (Germany). Calculations were done using outpatient claims data of the German Statutory Health Insurance according to § 295 of the German Code of Social Law (Fünftes Sozialgesetzbuch, SGB V). The methodology applied to estimate hay fever incidence (HFI) based on insurance claims has been described elsewhere (7). In brief, the occurrence of newly diagnosed hay fever was assessed in annual cohorts of patients in the age group 0–17 years, who were observable in the year of reporting, and in the three previous years, or who were born in this four-year period. The children and adolescents, who did not receive a diagnosis of hay fever during the pre-observation period were eligible for inclusion into the population at risk. Incident cases were identified using diagnoses coded according to the International Statistical Classification of Diseases and Related Health Problems, 10th revision, German modification (ICD-10-GM-codes: 30.1 for hay fever due to pollen, J30.2 for other seasonal hay fever). New hay fever cases were defined as the first occurrence of disease-specific diagnostic codes in the respective populations at risk, together with the disease modifier “assured” after a diagnosis-free period of 3 years and repeated coding at least once in the following four quarters after the index quarter. Quarterly cumulative incidence was calculated per 1,000 children and adolescents under risk. Demographic details for the population at risk of hay fever are provided in the Supplementary material S2.
Quarter one (Q1) refers to the months of January, February, and March; quarter two (Q2) to the months of April, May and June. Quarter three (Q3) refers to the months of July, August and September, and quarter four (Q4) to the months of October, November and December.
2.4 Data analysis and method description
First, we analyzed the time evolution of the variables. Since the variables had been collected at different frequencies, we had to work with the lowest frequency available, i.e., the quarterly data. For this purpose, we aggregated the data at the higher frequency to the quarterly level by averaging or summing up by using functions in Microsoft Excel © Version 2301. In the next steps, methods and packages within the free software environment for statistical computing R (Version 4.2.2, Germany) were used. We computed correlations among the climate indicators in order to understand their dependencies and potentially multicollinearity that may lead to confounding effects and, thus, poor estimates of their association with the HFI. We presented in this paper results on the Spearman rank correlations, as they are less sensitive to outliers and the normality assumption. However, for robustness check, we also implemented the classical Pearson correlation. The results were consistent with those obtained from the Spearman correlation analysis, both in terms of direction and magnitude. Therefore, we did not include them in the manuscript; however, they are available from the authors upon request. Next, we implemented generalized additive models (GAMs) with the Gamma distribution family [the function “gam()” from the package mgcv] to analyse the associations between the climate indicators and the hay fever. This is a very general methodological framework that can capture linear, monotonic or more complex nonlinear relationships, depending on the way each variable responds to changes in the dependent variables (48, 49).
Here we first computed models named “seasonal”, which focused on studying the multivariables' effects on the HFI with time seasonality controlled for. As described below, we work with semi-annual seasonality. Here, the seasonality was added in the model as a categorical variable including two categories Q1Q4 and Q2Q3, since Q1 and Q4 shared closely similarities, as are the other two quarters. We applied cubic regression splines smooth function for the temperature, NO2 and O3, since they are useful for fitting models with seasonal patterns (50, 51). For the other variables, we kept the thin plate regression splines, which are the default smooth (52). Based on environmental theory and previous studies, there may be interactions between PM10, NO2, O3 and precipitation (53–56), as well as wind speed (57, 58), between NO2 and O3 (59), and between temperature and wind speed (60). Therefore, we also considered these interactions in our models by using tensor product smooths function (50, 52). Since categorical data, here for the seasonality, in GAMs are treated as a linear term without smoothing (48), we applied the seasonality in linear manner.
For the robustness check, we assessed additional models assigned here as “single-factor” and “non-seasonal”. Due to the limited data, we needed to balance the effects of adding further variables in the regression: more relevant variables added, less bias in the estimates, but lower standard errors; less variables added, more bias, but higher standard error. Therefore, for the “single-factor” models we retained the seasonality and one climate indicator as the only two predictors at a time. For the non-seasonal models, we fitted the joint effect of the predictors, and excluded the seasonality, which allow us to examine contribution of seasonality by comparing the results.
In all models, we computed functions “gam.check()”, and “AIC()” to achieve optional fitness. The statistically significant level has been chosen at upmost 5%. We estimated the quarterly HFI using the “predict” function for all chosen predictors, with setting the other predictors to their medians (61). Finally, we applied the package “ggplot2” to visualize the significant associations.
3 Results
3.1 Variation in hay fever incidence
Figure 2 displays the HFI's levels across years and quarters. No significant changes in the quarterly and yearly HFI between 2013 and 2021 were observed, which might be due to the relatively short window. HFI was significantly higher in Q2 than in the other three quarters over all 9 years investigated (p = 4.07e-12).
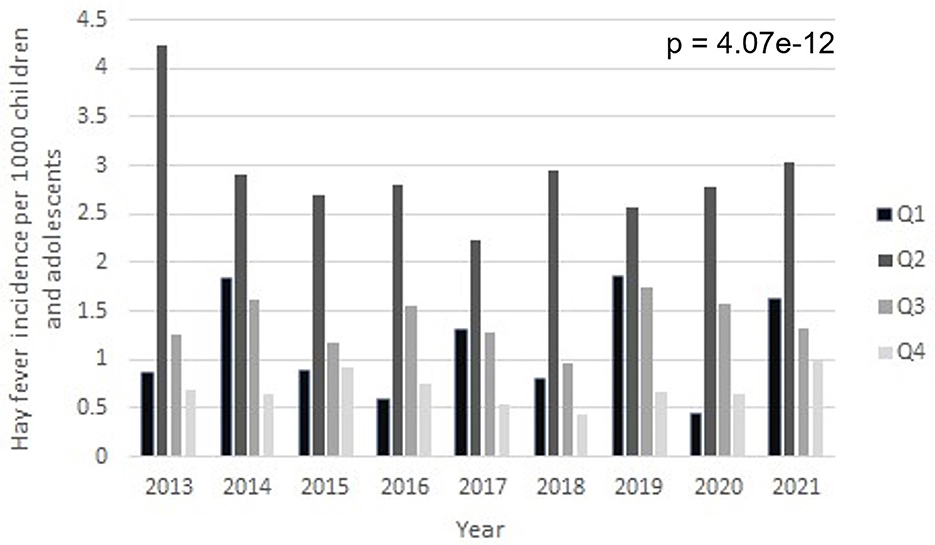
Figure 2. Quarterly HFIs for Freiburg in the period between 2013 and 2021. Bars are HFI data corresponding to Q1-4.
3.2 Variation in climate indicators
Figures 3A, B provide the time series of quarterly observations of the climate indicators as explanatory variables and the HFI as the dependent variable. Quarterly variations in hay fever frequency corresponded to changes in the quarterly temperature (Figure 3A), the quarterly wind speed (Figure 3A), and the quarterly O3 (Figure 3B), whereas they varied inversely with the quarterly NO2 (Figure 3B). No correspondences between other indicators were observed.
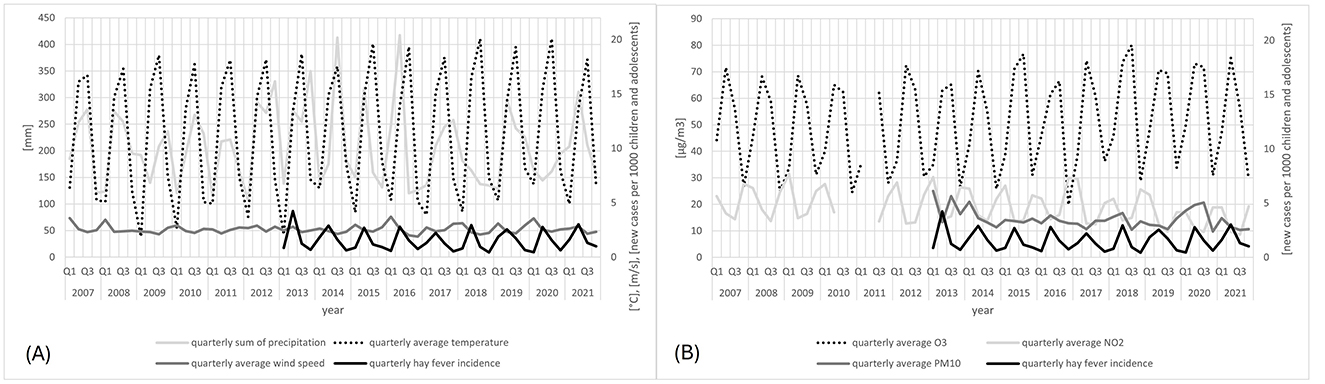
Figure 3. Time series of the quarterly HFI from 2013 to 2021 and climate indicators (A) meteorological parameters, i.e. temperature, precipitation, and wind speed; (B) PM10 from 2013 to 2021 and gaseous air pollutants (O3, NO2) from 2007 to 2021. The gaps in the graphs are due to missing data.
To discover possible changes in climate indicators in the individual quarters of the study period associated with hay fever, we first visualized the meteorological parameters in Figure 4. In contrast to a stable average temperature throughout the years in Freiburg, a significant increase in temperature could be detected for Q3 and Q4, during the period 2007–2021 (p = 0.001 and 0.039, respectively). No significant changes in wind speed and precipitation were found.
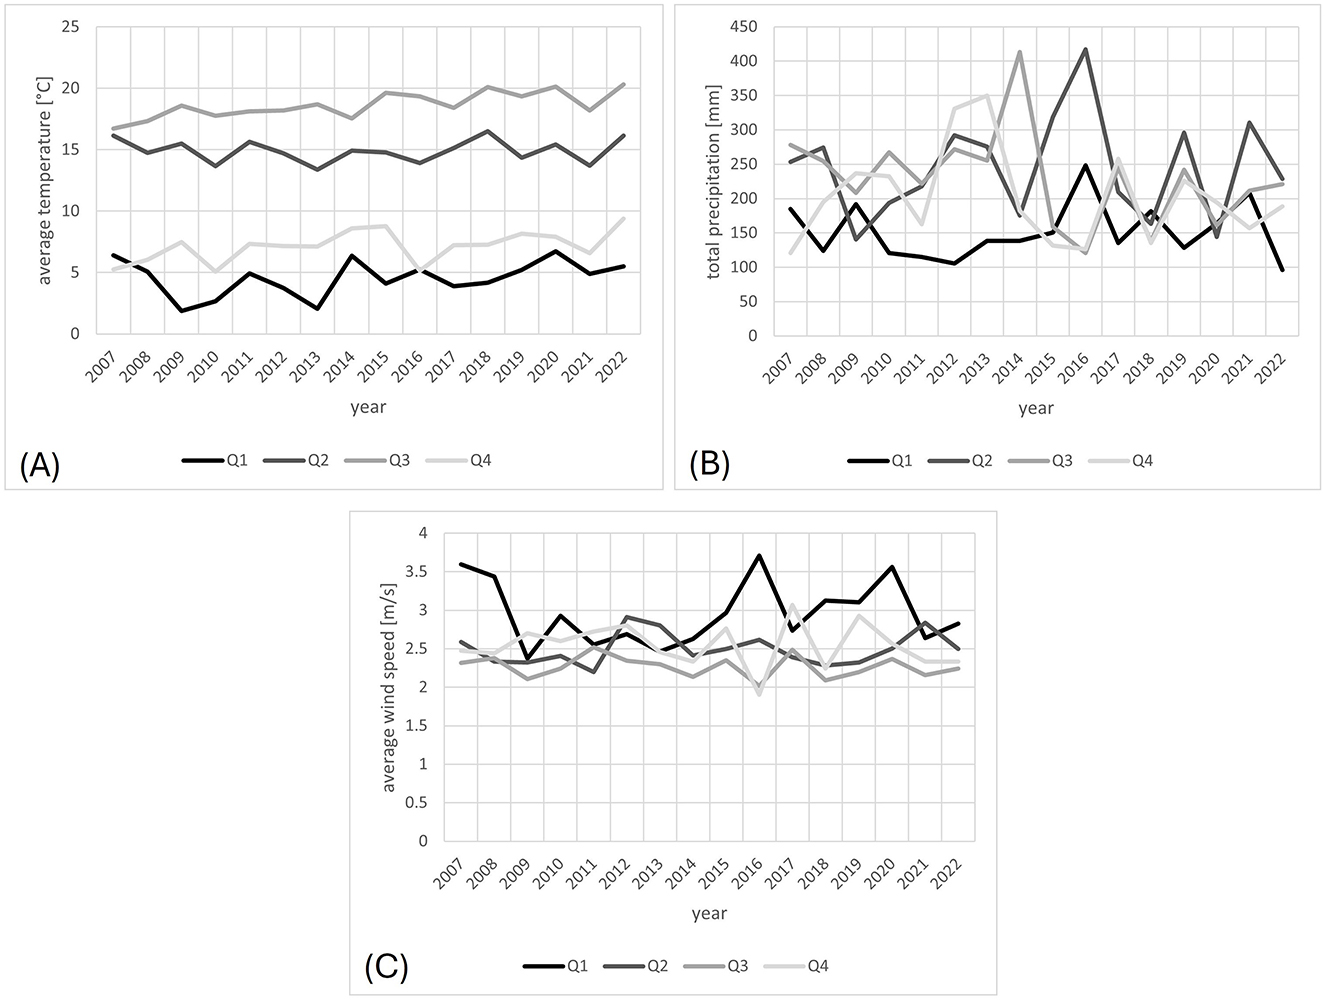
Figure 4. (A) Average temperature, (B) total precipitation, and (C) average wind speed based on the data in Freiburg from 2007 and 2021, given per quarter. The lines are quarterly average temperature, total precipitation, and wind speed in (A–C). The color intensity fades gradually in the order of the quarters, from 1 to 4.
Next, we considered the temporal course of the most abundant air pollutants NO2, ground-level O3, and PM10. The NO2 and the PM10 showed significantly decreases over the observed years (p = 0.021 and 0.001, respectively), whereas the O3 concentration remained unchanged (Figure 5).
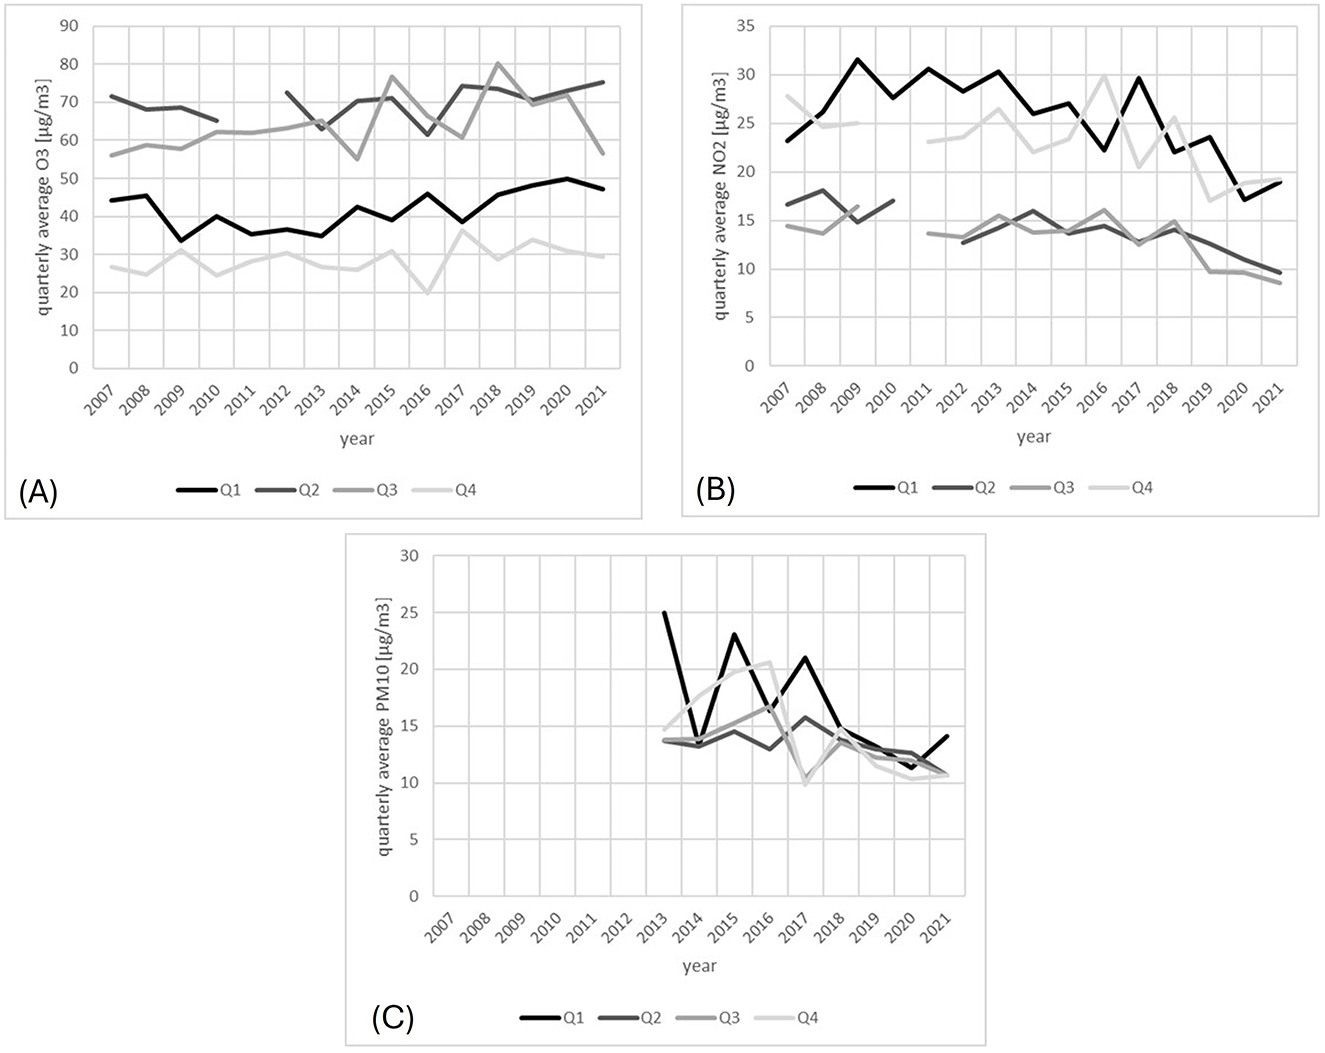
Figure 5. Average concentration of (A) O3, (B) NO2, and (C) PM10, based on quarterly data for Freiburg from 2007 and 2021. The gaps in the graphs are due to missing data, which however does not cover the period considered in our analysis. The color intensity fades gradually in the order of the quarters, from 1 to 4.
As one may observe from Figures 2–5, the variables at hand display quarterly seasonality effects. However, given that we have only a few numbers of observations per series (36), we needed to balance the effects of adding further variables in the regression, i.e. balance between reducing the bias in the estimates and increasing their standard errors. This trade-off is particularly important when dealing with such a small sample size. Therefore, we worked here with semi-annual seasonal variables, instead of quarterly.
3.3 Correlations between climate indicators
In Figure 6, we present results from computing the Spearman rank correlation among the climate indicators.
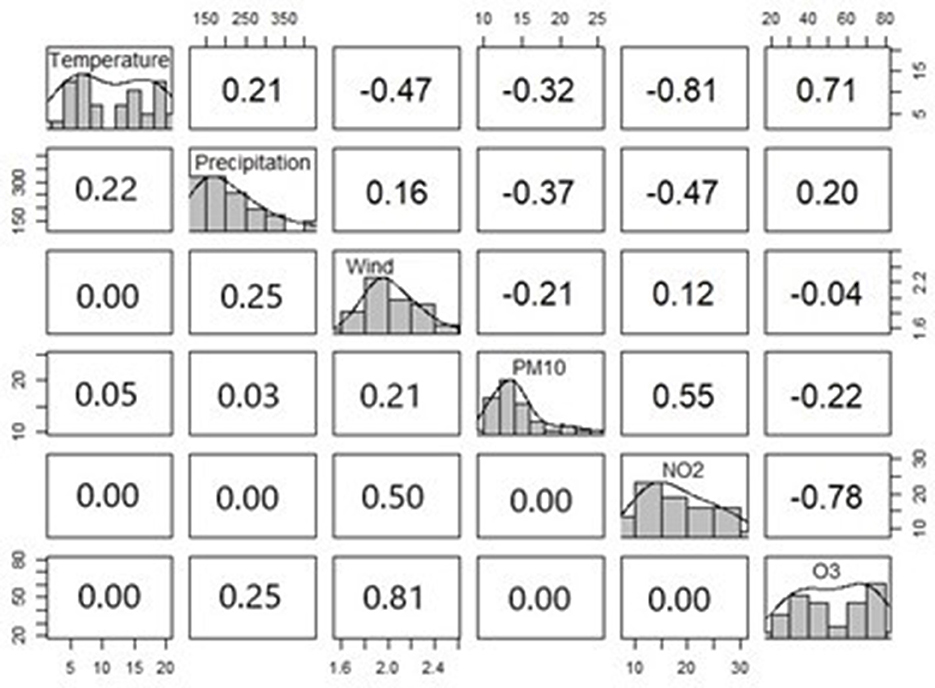
Figure 6. Spearman rank correlation among climate indicators based on quarterly data for Freiburg from 2013 and 2021. On the diagonal we provide, histograms and probability density shapes of the variables at hand. The upper triangular provides the correlations. The lower triangular provides the respective p-values of the correlations from the upper triangular.
The results given in Figure 6 align with the basic environmental principles: temperature clustered around two means due to seasoning effects, precipitation, PM10 and NO2 were right skewed, indicating a higher probability mass to lower values, while the O3 level seemed to be rather uniformly distributed, wind speed distributed normally. We also observed high correlations between the temperature and the O3 (positive 71%), as well as the NO2 (negative 81%). Correlations between the NO2 and the PM10 (positive 55%), as well as the O3 (negative 78%) have been also detected. The correlations among the other factors were smaller, and sometimes not statistically significant at 5% level. Accordingly, for our regression analysis, we considered temperature, precipitation, wind speed, and PM10 as predictors in a first step. Then, the effects of O3, and NO2 were considered, by successively replacing the temperature and PM10. Due to the limited data, we individually applied the interactions between each two indicators, which have been mentioned at the method description.
3.4 Outcome model
Results from our “seasonal”, “single factor”, and “non-seasonal” models provide the estimated associations between the HFI and the temperature (Figure 7), as well as the wind speed (Figure 8). The two associations were statistically significant at 5% significance level. The association between the temperature and the HFI varied in a larger scale than the one of the wind speed. In our “seasonal” and “non-seasonal” models, we also identified a significant relationship between the HFI and the O3. This may be caused by a confounding variable, i.e. the wind speed. When we excluded this variable in the models, O3 was no longer significant. Hence, we did not visualize this association here. For precipitation, PM10, NO2 as well as the interactions, we could not find any statistically significant association with the HFI at the 5% level. However, it is important to emphasize that the associations between the HFI and the interactions among temperature and wind speed, as well as the one among wind speed and O3 were significant at 9% and 6% level, respectively. These associations may be significant at 5% level in a larger dataset. Models' summaries can be found in Table 1.
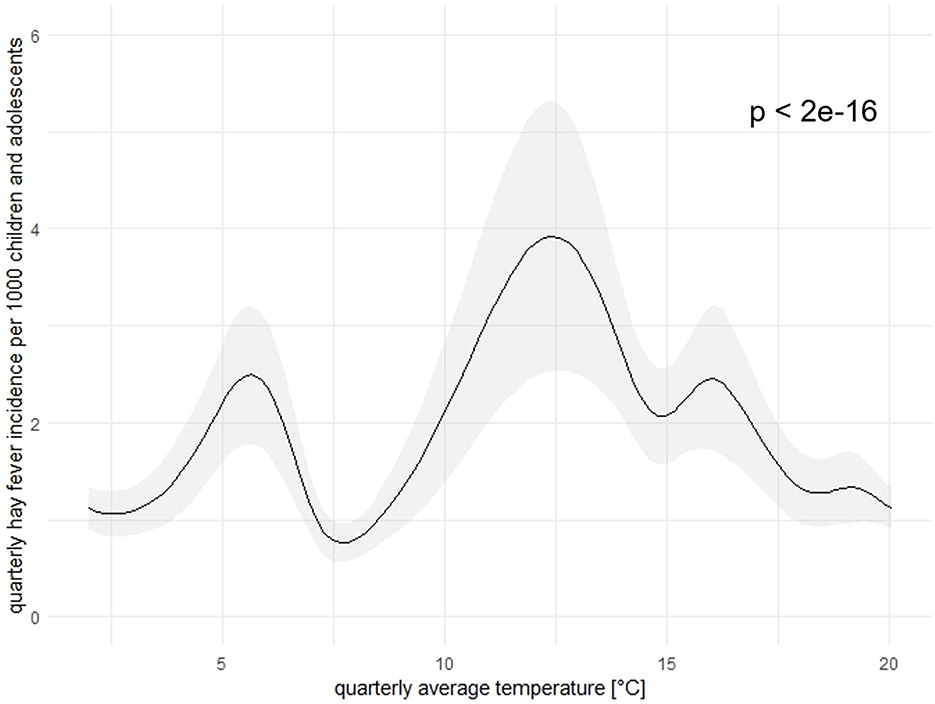
Figure 7. Association between the quarterly HFI and the quarterly average temperature [°C] in Freiburg in calendar quarter from 2013 to 2021. The black line represents the association, the gray shaded area represents 95%CI. To note, here we revealed the curve in the “seasonal” model, curves in the “single-factor” and the “non-seasonal” models are similar.
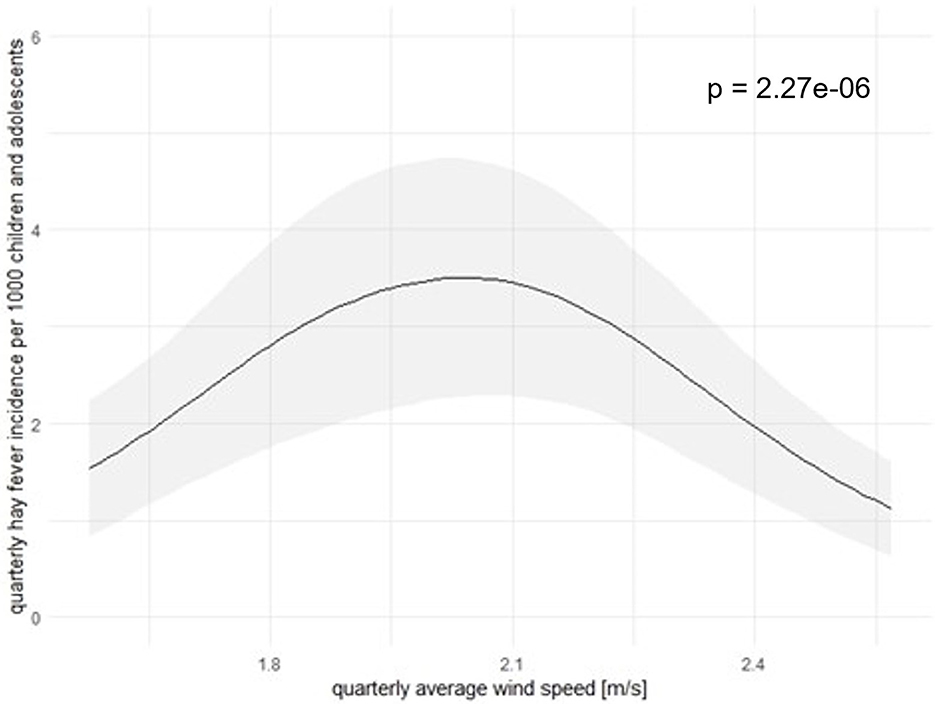
Figure 8. Association between HFI and average wind speed [m/s] in Freiburg in calendar quarter from 2023 to 2021. The black lines represent the associations between HFI and the average wind speed, the gray shaded area represents 95%CI. Here we also revealed the curve in the “seasonal” model, curves in the “single-factor” and the “non-seasonal” models are similar.
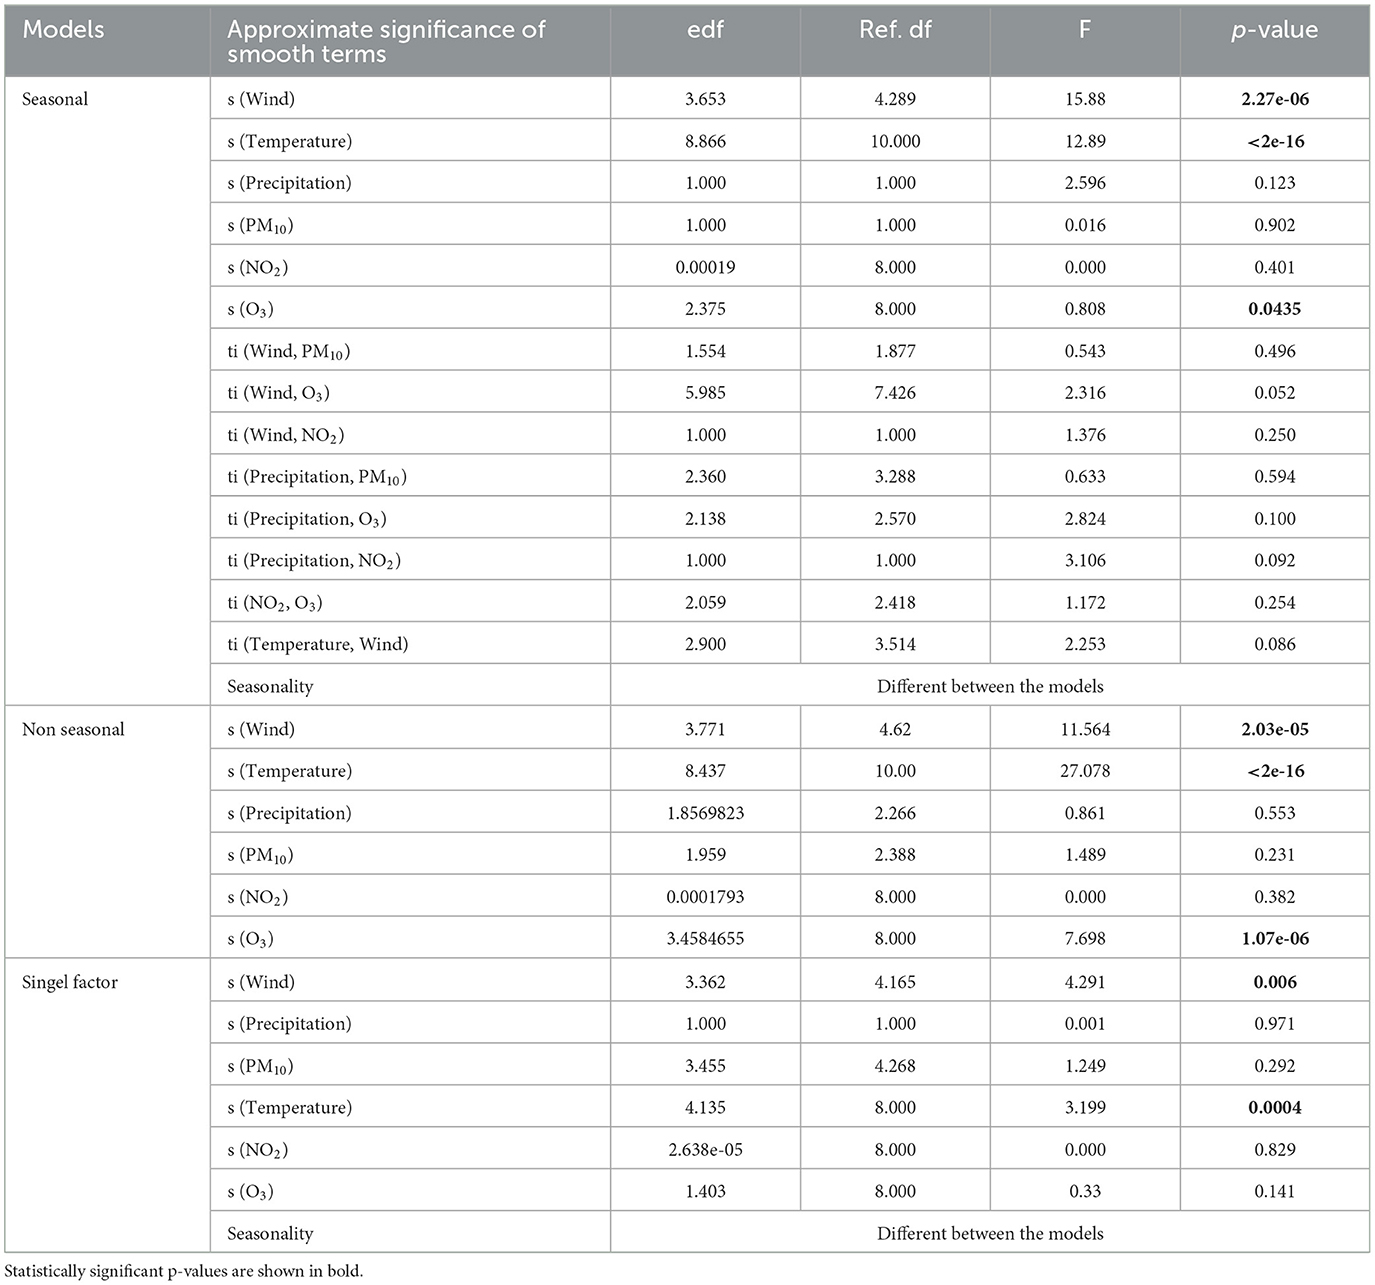
Table 1. GAMs summaries for hay fever incidence.
The smoothed curve in Figure 7 indicated that the direction of the relationship between the HFI and the temperature changed midway through the range of the temperature. Overall, the curve shows optimal ranges of the temperature were between 4–6°C and 10–17°C. The curve started high, then increased rapidly to 2.5 new cases as the temperature is at 6°C. After that, the curve sloped downward, indicating a negative relationship. In other words, the more the temperature rose (up to 8°C), the more the HFI reduced. As the temperature rose from 8°C to 13°C, the curve was upward-sloping, showing a positive relationship. Here, the HFI reached its highest peak with an incidence of almost 4 new cases. After this point, the hay fever slowly decreased with the temperature.
The second factor associating the HFI in a statistically significant manner was the wind speed (Figure 8). The wind speed had a bell-shaped association with HFI, where the curve direction changed at the middle. The HFI increased and reached its highest point at 3.2 new cases as the wind speed was in the range from 2.0 to 2.1 m/s. Beyond this point, the HFI decreased.
4 Discussion
A causal association between pollen and hay fever is well known. In general, pollen season is going to get longer and more intense with climate change (62–65), including alder, hazel, ash (66), birch, oak and pine (67), or herbaceous plants like grasses (68, 69) and ragweed (70). However, some other published literature showed no trends (71), or even decreasing trends (66, 72). The magnitude of flowering-intensity trends varies depending on the species, the geographical area, the flowering season, and climatic trends (73). In Germany, most hay fever cases are caused by eight different plant species. Hazel, alder, and birch from the Betulaceae (74, 75), ash (74, 76), grasses, rye, mugwort and ragweed (77). Air pollen concentrations of these plants are currently reported highest during Q2 and Q3.
Temperature is well known to affect pollen seasons (77–81), and in our study, this climate indicator was significantly associated with the HFI. Within the typical temperature range in Q1, the HFI rapidly increased and reached its first peak, which could be due to the effect of early bloomers' pollen, i.e. hazel and alder. This finding is important for the community in Freiburg for choosing the right therapeutic approach in patient treatment, since the symptoms for the common cold or flu can easily be mistaken with hay fever during this quarter. The second, more pronounced peak in HFI observed at ambient temperatures between 8°C and 13°C is likely attributable to increased exposure to mid-spring pollens, particularly from species such as ash and birch, as this temperature range coincides with their peak pollination period, typically occurring during the transition from the first to the second quarter of the year. The third peak could reflect the effect of the late flowers, i.e. grasses, rye, mugwort, and ragweed on the HFI. As we observed a significant increase in average temperature in Freiburg in Q3 and Q4 and its warmer-in-the-future tendency, the pollen season could be expected to start earlier in the future for trees that flower in late winter or early spring, such as hazel, alder, birch, and ash. For grasses, rye, mugwort, and ragweed, an extension of the vegetation period is to be expected in Freiburg, thus continuous pollen production later in the year may occur in the future. This assumption aligns with the results by Bergmann et al., that species advanced their pollen season more in early spring (e.g., hazel and alder by up to 2 days per year), than in mid spring (birch, ash) (82). A study from Poland demonstrated that grasses' pollen seasons lengthened by 2 to nearly 4 days between 1996 and 2011, which is related to warmer summer temperatures and later pollen season end dates (83). Zhang and Steiner predicted, that in the future warmer end-of-century temperatures will advance the onset of spring emissions by 10–40 days, and delay the onset of summer/fall emissions from weeds and grasses by 5–15 days, also extend the season length (84). Furthermore, Ziska et al. illustrated, that ragweed plants in America grew faster, flowered earlier, produced more pollen in cities than in rural sites, and persisted longer until the plants die in the first frost (85). The pollen season's prolongation could in turn lead to an increase in the pollen's total amount in the air, increasing the risk for hay fever sufferers.
Higher fall temperatures could lead to more unpredictable and extreme weather, e.g. storms, which could also have serious consequences for hay fever sufferers. Pollen grains can be carried along by thunderstorms on the ground, and the less resistant inner part of the pollen could be released into atmosphere and trigger additional allergic reactions (86).
Based on observed temperature trends over the past 15 years, it is plausible that the timing of new hay fever cases in Freiburg may shift from Q2 toward Q1 and Q4, potentially due to changes in pollen dynamics. Consequently, the hay fever season could extend into the winter months, increase in summer, and potentially become more evenly distributed throughout the year. However, this remains a hypothesis that requires further investigation. Our current data do not allow for definitive conclusions regarding future temporal shifts in HFI. Longitudinal monitoring of both climate indicators and aeroallergen concentrations, coupled with predictive modeling, will be essential to confirm these potential trends. Future studies incorporating fine-scale phenological data and patient-level exposure assessments could provide a clearer understanding of how climate change may alter the seasonal distribution of hay fever cases.
The second factor showing a significant relationship with the hay fever was the wind speed. A study by Damialis et al. indicated that pollen atmospheric movement is a very complex phenomenon influenced by numerous environmental parameters with wind playing a major role (87). The positive association in our study's result was indirectly in line with previous studies, indicating that higher wind speeds reduce pollen grain mass via dehydration, enhancing atmospheric dispersal (88). In addition, pollen that has already been settled can be pushed upwards in the atmosphere by the action of the wind (89). Interestingly, as the wind speed exceeded 2.0 m/s, the HFI started decreasing, indicating a negative association between the HFI and high wind speed in this study. This aligns with findings by Wang et al. (17). One possible explanation for such an event is provided by Niklas (90) and Oh (91) that the wind decreases the amount of local pollen by carrying local pollen to other places. No significant variation of the wind speed was observed over the last 15 years in Freiburg. Thus, the same association between the HFI and the wind speed is anticipated in the future.
Until now, very few studies have investigated the association between hay fever and precipitation, and only limited number supported the association (17). Whereas several published literatures suggested a relationship between precipitation and pollen in relation to the slowdown in photosynthesis (92–94), the wash-out effect (95), the thunderstorm's effects (96), the enhanced growth of trees/plants after getting nitrates in rainwater and the leaf wetting effect (93). Additionally, precipitation is also related to the increase of fungal spore (97). Nevertheless, these are just short-lived effects, which is difficult to capture by our quarterly data.
Our insignificant relations between the HFI and the concentrations of PM10, NO2, O3 in Freiburg align with several studies (27, 39, 98–100), but do not support some others. Regarding PM10, associations have been identified between PM10 and hay fever severity (35), hay fever prevalence (101). Specially, PM10 may act as carrier of adsorbed allergens and cause allergic reactions (102). Regarding NO2, a significant association with hay fever prevalence was found by Teng et al. (101). In animal tests, negative effects of NO2 on respiratory system and severity of allergic airway inflammation have been also demonstrated (37, 38). Additionally, effects of NO2 on various pollen allergens have been assumed (33, 34, 90, 93, 103, 104), which may then affect hay fever sufferers. Interestingly, only few studies indicated that ground-level O3 increases hay fever risk (23, 105–107). Furthermore, individual O3 molecules can cling to pollen surfaces and enter the airway (108). O3 is also an important stress factor for plants, which can damage plant cells, trigger them to discharge more pollen (109), and alter allergenicity of pollen in both negative and positive manners (110–113). However, all these results were derived for high concentrations of the environmental stressors, whereas the quarterly concentrations of PM10, NO2 and O3 in Freiburg across the study years exhibited comparably low levels. This could account for the insignificant findings reported in our study.
Several limitations of our study have to be reported: the hay fever data was sampled quarterly, which may not capture short-term fluctuations in hay fever that occur due to changes in environmental factors. When data are aggregated over a long period, important information about short-term changes get lost. Another shortcoming of our dataset is that hay fever data have been reported as incidences, which only reflect the number of new cases developed within the investigated time, but does not provide information about the severity or duration of symptoms experienced by new diagnosed and already affected patients. Moreover, a longer time series of data may lead to better statistical results in what regards the accuracy and precision of the effects measured. The coronavirus pandemic in 2020 to 2022 had given rise to social distancing and self-isolation. This might have led to a decline in the number of doctor visits and fewer diagnosed cases in consequence. It may also have resulted in fewer opportunities for children and adolescents to be infected with respiratory and other communicable diseases. This, in turn, may also have affected the numbers of HFI during this time period. The German Statutory Health Insurance is a group of public health insurance, which covers most of the working classes. Data from privately insured people, who potentially have higher living standards, were not covered. This group also needs to be investigated in the future. The stationary data may not fully capture the variations of the climate indicators due to personal microclimate and mobility, which is difficult to measure so far. Future studies should aim at more individualized information regarding the microclimate and mobility. Finally, the absence of pollen concentration data is a significant limitation in our study, as pollen is typically the primary trigger for hay fever, with climate factors as proxies. Future research investigating associations with hay fever should also include the pollen's contribution in the analysis.
5 Conclusion
Our findings could not support the associations between the HFI and the precipitation as well as the concentrations of PM10, NO2, and O3 in Freiburg. However, the results for the temperature and the wind speed in relation to the HFI were highlighted. Here, the HFI was highest when the temperature was between 4–6°C and 10–17°C, and the wind speed was between 2.0 and 2.1 m/s. Thus, awareness of local environmental conditions may assist healthcare providers in recognizing patterns of allergen exposure that coincide with peaks in hay fever symptoms. While direct monitoring of meteorological data is not expected in routine clinical practice, integrating local environmental health advisories and pollen forecasts into clinical awareness could improve diagnostic accuracy. Such an approach may facilitate earlier initiation of targeted therapies for allergic rhinitis, potentially improving patient outcomes.
Data availability statement
The data analyzed in this study is subject to the following licenses/restrictions: the dataset is available on request from the corresponding author. Requests to access these datasets should be directed to ZXZlbHluLmxhbXlAbWVkLnVuaS1hdWdzYnVyZy5kZQ==.
Ethics statement
Ethical approval was not required for the study involving humans in accordance with the local legislation and institutional requirements. Written informed consent to participate in this study was not required from the participants or the participants' legal guardians/next of kin in accordance with the national legislation and the institutional requirements.
Author contributions
TD-S: Conceptualization, Data curation, Formal analysis, Methodology, Software, Writing – original draft, Writing – review & editing. JH: Resources, Writing – review & editing. KG: Resources, Writing – review & editing. CM: Conceptualization, Writing – review & editing. AM: Resources, Writing – review & editing. RH: Conceptualization, Formal analysis, Methodology, Software, Writing – original draft, Writing – review & editing. EL: Conceptualization, Data curation, Methodology, Supervision, Writing – review & editing.
Funding
The author(s) declare that no financial support was received for the research and/or publication of this article.
Acknowledgments
We would like to thank the Federal Environment Agency (http://www.umweltbundesamt.de) and the German Meteorological Service (http://www.dwd.de) in this study for providing the climate indicators data. We also acknowledge support by the Open Access Publication Fund of the University of Freiburg.
Conflict of interest
The authors declare that the research was conducted in the absence of any commercial or financial relationships that could be construed as a potential conflict of interest.
Generative AI statement
The author(s) declare that no Gen AI was used in the creation of this manuscript.
Publisher's note
All claims expressed in this article are solely those of the authors and do not necessarily represent those of their affiliated organizations, or those of the publisher, the editors and the reviewers. Any product that may be evaluated in this article, or claim that may be made by its manufacturer, is not guaranteed or endorsed by the publisher.
Supplementary material
The Supplementary Material for this article can be found online at: https://www.frontiersin.org/articles/10.3389/fpubh.2025.1587767/full#supplementary-material
References
1. IPCC. Climate Change 2001: The Scientific Basis. Contribution of Working Group I to the Third Assessment Report of theIntergovernmental Panel on Climate Change. (2001). Available online at: https://www.ipcc.ch/site/assets/uploads/2018/03/WGI_TAR_full_report.pdf (accessed May 03, 2023).
2. IPCC. Summary for Policymakers. In: Climate Change 2021: The Physical Science Basis. Contribution of Working Group I to the Sixth Assessment Report of the Intergovernmental Panel on Climate Change. (2021). Available online at: https://www.ipcc.ch/report/ar6/wg1/downloads/report/IPCC_AR6_WGI_SPM_final.pdf (accessed May 03, 2023).
4. Hertig E, Hunger I, Kaspar-Ott I, Matzarakis A, Niemann H, Schulte-Droesch L, et al. Climate change and public health in Germany - An introduction to the German status report on climate change and health 2023. J Health Monit. (2023) 8:6–32. doi: 10.25646/11400
5. Bergmann KC, Heinrich J, Niemann H. Current status of allergy prevalence in Germany: Position paper of the Environmental Medicine Commission of the Robert Koch Institute. Allergo J Int. (2016) 25:6–10. doi: 10.1007/s40629-016-0092-6
6. Langen U, Schmitz R, Steppuhn H. Häufigkeit allergischer Erkrankungen in Deutschland. Bundesgesundheitsbl. (2013) 56:698–706. doi: 10.1007/s00103-012-1652-7
7. Kohring C, Akmatov MK, Dammertz L, Heuer J, Batzing J, Holstiege J. Trends in incidence of atopic disorders in children and adolescents - analysis of German claims data. World Allergy Organ J. (2023) 16:100797. doi: 10.1016/j.waojou.2023.100797
8. Thamm R, Poethko-Müller C, Hüther A, Thamm M. Heuschnupfen und Asthma bei Kindern und Jugendlichen in Deutschland – Querschnittergebnisse aus KiGGS Welle 2 und Trends. J Health Monitor. (2018) 3:55–9.
9. Renz H, Kaminski A, Pfefferle PI. Allergieforschung in Deutschland: Ein Atlas mit Bestandsaufnahme, Defiziz- und Bedarfsanalyse. (2008). Available online at: https://dgaki.de/wp-content/uploads/2010/05/Allergieforschung_in_Deutschland_Aktualisierte-Version1.2.pdf (accessed April 30, 2024).
10. Deng SZ, Jalaludin BB, Anto JM, Hess JJ, Huang CR. Climate change, air pollution, and allergic respiratory diseases: a call to action for health professionals. Chin Med J (Engl). (2020) 133:1552–60. doi: 10.1097/CM9.0000000000000861
11. Gao J, Lu M, Sun Y, Wang J, An Z, Liu Y, et al. Changes in ambient temperature increase hospital outpatient visits for allergic rhinitis in Xinxiang, China. BMC Public Health. (2021) 21:600. doi: 10.1186/s12889-021-10671-6
12. Hyrkas-Palmu H, Ikaheimo TM, Laatikainen T, Jousilahti P, Jaakkola MS, Jaakkola JJK. Cold weather increases respiratory symptoms and functional disability especially among patients with asthma and allergic rhinitis. Sci Rep. (2018) 8:10131. doi: 10.1038/s41598-018-28466-y
13. Silverberg JI, Braunstein M, Lee-Wong M. Association between climate factors, pollen counts, and childhood hay fever prevalence in the United States. J Allergy Clin Immunol. (2015) 135:463–9. doi: 10.1016/j.jaci.2014.08.003
14. Zafirah Y, Lin YK, Andhikaputra G, Deng LW, Sung FC, Wang YC. Mortality and morbidity of asthma and chronic obstructive pulmonary disease associated with ambient environment in metropolitans in Taiwan. PLoS ONE. (2021) 16:e0253814. doi: 10.1371/journal.pone.0253814
15. Zhang Y, Peng L, Kan H, Xu J, Chen R, Liu Y, et al. Effects of meteorological factors on daily hospital admissions for asthma in adults: a time-series analysis. PLoS ONE. (2014) 9:e102475. doi: 10.1371/journal.pone.0102475
16. Hsieh C.-J, Tseng, C.-C, Yiin, L.-M. Allergic rhinitis: association with air pollution and weather changes, and comparison with that of allergic conjunctivitis in Taiwan. Atmosphere. (2020) 11:1152. doi: 10.3390/atmos11111152
17. Wang XY, Ma TT, Wang XY, Zhuang Y, Wang XD, Ning HY, et al. Prevalence of pollen-induced allergic rhinitis with high pollen exposure in grasslands of northern China. Allergy. (2018) 73:1232–43. doi: 10.1111/all.13388
18. Luo X, Hong H, Lu Y, Deng S, Wu N, Zhou Q, et al. Impact of air pollution and meteorological factors on incidence of allergic rhinitis: a low-latitude multi-city study in China. Allergy. (2023) 78:1656–9. doi: 10.1111/all.15469
19. Peternel R, Srnec L, Culig J, Zaninovic K, Mitic B, Vukusic I. Atmospheric pollen season in Zagreb (Croatia) and its relationship with temperature and precipitation. Int J Biometeorol. (2004) 48:186–91. doi: 10.1007/s00484-004-0202-x
20. Hajat S, Haines A, Atkinson RW, Bremner SA, Anderson HR, Emberlin J. Association between air pollution and daily consultations with general practitioners for allergic rhinitis in London, United Kingdom. Am J Epidemiol. (2001) 153:704–14. doi: 10.1093/aje/153.7.704
21. Nordeide Kuiper I, Svanes C, Markevych I, Accordini S, Bertelsen RJ, Bråbäck L, et al. Lifelong exposure to air pollution and greenness in relation to asthma, rhinitis and lung function in adulthood. Environ Int. (2021) 146:106219. doi: 10.1016/j.envint.2020.106219
22. Hoffman CD, Henneberger PK, Olin AC, Mehta A, Toren K. Exposure to ozone gases in pulp mills and the onset of rhinitis. Scand J Work Environ Health. (2004) 30:445–9. doi: 10.5271/sjweh.833
23. Zhou PE, Qian ZM, McMillin SE, Vaughn MG, Xie ZY, Xu YJ, et al. Relationships between long-term ozone exposure and allergic rhinitis and bronchitic symptoms in Chinese children. Toxics. (2021) 9:221. doi: 10.3390/toxics9090221
24. Parker JD, Akinbami LJ, Woodruff TJ. Air pollution and childhood respiratory allergies in the United States. Environ Health Perspect. (2009) 117:140–7. doi: 10.1289/ehp.11497
25. Fuertes E, Standl M, Cyrys J, Berdel D, von Berg A, Bauer CP, et al. A longitudinal analysis of associations between traffic-related air pollution with asthma, allergies and sensitization in the GINIplus and LISAplus birth cohorts. PeerJ. (2013) 1:e193. doi: 10.7717/peerj.193
26. Hirsch T, Hering M, Bürkner K, Hirsch D, Leupold W, Kerkmann ML, et al. House-dust-mite allergen concentrations (Der f 1) and mold spores in apartment bedrooms before and after installation of insulated windows and central heating systems. Allergy. (2000) 55:79–83. doi: 10.1034/j.1398-9995.2000.00250.x
27. Hwang BF, Jaakkola JJ, Lee YL, Lin YC, Guo YL. Relation between air pollution and allergic rhinitis in Taiwanese schoolchildren. Respir Res. (2006) 7:23. doi: 10.1186/1465-9921-7-23
28. Mazzeo NA, VL, Choren H. Analysis of NO, NO2, O3 and NOx concentrations measured at a green area of Buenos Aires City during wintertime. Atmos Environ. (2005) 39:3055–68. doi: 10.1016/j.atmosenv.2005.01.029
29. He Z, HY, Fan G, Li Z, Liang Z, Fang H, Zeng ZC. Ozone pollution and its response to nitrogen dioxide change from a dense ground-based network in the Yangtze River delta: implications for ozone abatement in urban agglomeration. Atmosphere. (2022) 13:id.1450. doi: 10.3390/atmos13091450
30. Jochner S, Höfler J, Beck I, Göttlein A, Ankerst DP, Traidl-Hoffmann C, et al. Nutrient status: a missing factor in phenological and pollen research? J Exp Bot. (2013) 64:2081–92. doi: 10.1093/jxb/ert061
31. Rahman R, Luo C, Khan MHR. Jinzhao KE, Thilakanayaka V, Kumar S. Influence of atmospheric PM2.5, PM10, O3, CO, NO2, SO2, and meteorological factors on the concentration of airborne pollen in Guangzhou, China. Atmosph Environm. (2019) 212:290–304. doi: 10.1016/j.atmosenv.2019.05.049
32. Scevkova J, Vaskova Z, Sepsiova R, Kovac J. Seasonal variation in the allergenic potency of airborne grass pollen in Bratislava (Slovakia) urban environment. Environ Sci Pollut Res Int. (2021) 28:62583–92. doi: 10.1007/s11356-021-15179-5
33. Sousa R, Duque L, Duarte AJ, Gomes CR, Ribeiro H, Cruz A, et al. In vitro exposure of Acer negundo pollen to atmospheric levels of SO(2) and NO(2): effects on allergenicity and germination. Environ Sci Technol. (2012) 46:2406–12. doi: 10.1021/es2034685
34. Cuinica LG, Abreu I, Esteves da Silva J. Effect of air pollutant NO2 on Betula pendula, Ostrya carpinifolia and Carpinus betulus pollen fertility and human allergenicity. Environm Pollut. (2013) 186:50–5. doi: 10.1016/j.envpol.2013.12.001
35. Burte E, Leynaert B, Bono R, Brunekreef B, Bousquet J, Carsin AE, et al. Association between air pollution and rhinitis incidence in two European cohorts. Environ Int. (2018) 115:257–66. doi: 10.1016/j.envint.2018.03.021
36. Gehring U, Wijga AH, Hoek G, Bellander T, Berdel D, Brüske I, et al. Exposure to air pollution and development of asthma and rhinoconjunctivitis throughout childhood and adolescence: a population-based birth cohort study. Lancet Respir Med. (2015) 3:933–42. doi: 10.1016/S2213-2600(15)00426-9
37. Ji X, Han M, Yun Y, Li G, Sang N. Acute nitrogen dioxide (NO2) exposure enhances airway inflammation via modulating Th1/Th2 differentiation and activating JAK-STAT pathway. Chemosphere. (2015) 120:722–8. doi: 10.1016/j.chemosphere.2014.10.039
38. Poynter ME, Persinger RL, Irvin CG, Butnor KJ, van Hirtum H, Blay W, et al. Nitrogen dioxide enhances allergic airway inflammation and hyperresponsiveness in the mouse. Am J Physiol Lung Cell Mol Physiol. (2006) 290:L144–152. doi: 10.1152/ajplung.00131.2005
39. Kang IG, Ju YH, Jung JH, Ko KP, Oh DK, Kim JH, et al. The effect of PM10 on allergy symptoms in allergic rhinitis patients during spring season. Int J Environ Res Public Health. (2015) 12:735–45. doi: 10.3390/ijerph120100735
40. Pénard-Morand C, Raherison C, Charpin D, Kopferschmitt C, Lavaud F, Caillaud D, et al. Long-term exposure to close-proximity air pollution and asthma and allergies in urban children. Eur Respir J. (2010) 36:33–40. doi: 10.1183/09031936.00116109
41. Puklová V, Zejglicova K, Kratenova J, Brabec M, Maly M. Childhood respiratory allergies and symptoms in highly polluted area of Central Europe. Int J Environ Health Res. (2019) 29:82–93. doi: 10.1080/09603123.2018.1514458
42. Pate CA, Zahran HS, Malilay J, Hsu J. The shifting prevalence of asthma and allergic disease in US children. Ann Allergy Asthma Immunol. (2022) 129:481–9. doi: 10.1016/j.anai.2022.06.030
43. Bui DS, Lodge CJ, Perret JL, Lowe A, Hamilton GS, Thompson B, et al. Trajectories of asthma and allergies from 7 years to 53 years and associations with lung function and extrapulmonary comorbidity profiles: a prospective cohort study. Lancet Respir Med. (2021) 9:387–96. doi: 10.1016/S2213-2600(20)30413-6
44. Mössner S. Urban development in Freiburg, Germany. Substainable and neoliberal? J Geograph Soc Berlin. (2015) 146:2–3. doi: 10.12854/erde-146-16
45. Wu AC, Dahlin A, Wang AL. The role of environmental risk factors on the development of childhood allergic rhinitis. Children. (2021) 8:708. doi: 10.3390/children8080708
46. Freiburg AfBuI. Fläche in Hektar nach Stadtbezirk, Flächentyp. (2022). Available online at: https://fritz.freiburg.de/asw/asw.dll?aw=Flaechennutzung%2FFlaeche_KGL3_tab (accessed May 03, 2023).
47. Informationsmanagement AfBu, 2 SS. Bevölkerung. (2022). Available online at: https://www.freiburg.de/pb/207904.html (accessed May 03, 2023).
48. Barton NA, Farewell T, Hallett SH. Using generalized additive models to investigate the environmental effects on pipe failure in clean water networks. NPJ Clean Water. (2020) 3:31. doi: 10.1038/s41545-020-0077-3
49. Guisan A, Edwards Jr TC, Hastie T. Generalized linear and generalized additive models in studies of species distributions: setting the scene. Ecol Modell. (2002) 157:89–100. doi: 10.1016/S0304-3800(02)00204-1
50. Pedersen EJ, Miller DL, Simpson GL, Ross N. Hierarchical generalized additive models in ecology: an introduction with MGCV. PeerJ. (2019) 7:e6876. doi: 10.7717/peerj.6876
52. Wood S. Package ‘MGCV'. (2023). Available online at: https://cran.r-project.org/web/packages/mgcv/mgcv.pdf (accessed May 10, 2024).
53. Maboa R, Yessoufou K, Tesfamichael S, Shiferaw YA. Sizes of atmospheric particulate matters determine the outcomes of their interactions with rainfall processes. Sci Rep. (2022) 12:17467. doi: 10.1038/s41598-022-22558-6
54. Guo LC, Zhang Y, Lin H, Zeng W, Liu T, Xiao J, et al. The washout effects of rainfall on atmospheric particulate pollution in two Chinese cities. Environ Pollut. (2016) 215:195–202. doi: 10.1016/j.envpol.2016.05.003
55. Liu Y, Zhou Y, Lu J. Exploring the relationship between air pollution and meteorological conditions in China under environmental governance. Sci Rep. (2020) 10:14518. doi: 10.1038/s41598-020-71338-7
56. Kwak H-Y, Ko J, Lee S, Joh C-H. Identifying the correlation between rainfall, traffic flow performance and air pollution concentration in Seoul using a path analysis. Transport Res Procedia. (2017) 25:3552–63. doi: 10.1016/j.trpro.2017.05.288
57. Zhang W, Liu D, Tian H, Pan N, Yang R, Tang W, et al. Parsimonious estimation of hourly surface ozone concentration across China during 2015-2020. Sci Data. (2024) 11:492. doi: 10.1038/s41597-024-03302-3
58. Cichowicz R, WG, Fetter W. Effect of wind speed on the level of particulate matter PM10 concentration in atmospheric air during winter season in vicinity of large combustion plant. J Atmos Chem. (2020) 77:35–48. doi: 10.1007/s10874-020-09401-w
59. Han S, Bian H, Feng Y, Liu A, Li X, Zeng F, et al. Analysis of the relationship between O3, NO and NO2 in Tianjin, China. Aerosol Air Qual. Res. (2011) 11:128–39. doi: 10.4209/aaqr.2010.07.0055
60. Wooten R. Statistical analysis of the relationship between wind speed, pressure and temperature. J Appl Sci. (2011) 11:2722. doi: 10.3923/jas.2011.2712.2722
61. Rittweger J, Gilardi L, Baltruweit M, Dally S, Erbertseder T, Mittag U, et al. Temperature and particulate matter as environmental factors associated with seasonality of influenza incidence - an approach using Earth observation-based modeling in a health insurance cohort study from Baden-Wurttemberg (Germany). Environ Health. (2022) 21:131. doi: 10.1186/s12940-022-00927-y
62. Ziska LH, Caulfield FA. Rising CO2 and pollen production of common ragweed (Ambrosia artemisiifolia), a known allergy-inducing species: implications for public health. Aust J Plant Physiol. (2000) 27:893–8. doi: 10.1071/PP00032
63. Newnham RM, Sparks TH, Skjoth CA, Head K, Adams-Groom B, Smith M. Pollen season and climate: is the timing of birch pollen release in the UK approaching its limit? Int J Biometeorol. (2013) 57:391–400. doi: 10.1007/s00484-012-0563-5
64. Ahlholm JU, Helander ML, Savolainen J. Genetic and environmental factors affecting the allergenicity of birch (Betula pubescens ssp. czerepanovii [Orl] Hamet-ahti) pollen. Clin Exp Allergy. (1998) 28:1384–8. doi: 10.1046/j.1365-2222.1998.00404.x
65. Zhang R, Duhl T, Salam MT, House JM, Flagan RC, Avol EL, et al. Development of a regional-scale pollen emission and transport modeling framework for investigating the impact of climate change on allergic airway disease. Biogeosciences. (2013) 10:3977–4023. doi: 10.5194/bgd-10-3977-2013
66. Hoebeke L, Bruffaerts N, Verstraeten C, Delcloo A, De Smedt T, Packeu A, et al. Thirty-four years of pollen monitoring: an evaluation of the temporal variation of pollen seasons in Belgium. Aerobiologia. (2018) 34:139–55. doi: 10.1007/s10453-017-9503-5
67. Lind T, Ekebom A, Alm Kübler K, Östensson P, Bellander T, Lõhmus M. Pollen season trends (1973-2013) in Stockholm Area, Sweden. PLoS ONE. (2016) 11:e0166887. doi: 10.1371/journal.pone.0166887
68. Bruffaerts N, De Smedt T, Delcloo A, Simons K, Hoebeke L, Verstraeten C, et al. Comparative long-term trend analysis of daily weather conditions with daily pollen concentrations in Brussels, Belgium. Int J Biometeorol. (2018) 62:483–91. doi: 10.1007/s00484-017-1457-3
69. de Weger LA, Bruffaerts N, Koenders MMJF, Verstraeten WW, Delcloo AW, Hentges P, et al. Long-term pollen monitoring in the benelux: evaluation of allergenic pollen levels and temporal variations of pollen seasons. Front Allergy. (2021) 2:676176. doi: 10.3389/falgy.2021.676176
70. Ščevková J, Štefániková N, Dušička J, Lafférsová J, Zahradníková E. Long-term pollen season trends of Fraxinus (ash), Quercus (oak) and Ambrosia artemisiifolia (ragweed) as indicators of anthropogenic climate change impact. Environ Sci Pollut Res. (2024) 31:43238–48. doi: 10.1007/s11356-024-34027-w
71. Glick S, Gehrig R, Eeftens M. Multi-decade changes in pollen season onset, duration, and intensity: a concern for public health? Sci Total Environ. (2021) 781:146382. doi: 10.1016/j.scitotenv.2021.146382
72. Schinko, H.A.E., Lamprecht, B. & Schmidt, R. How will climate change alter the dynamics of airborne pollen and pollen load of allergenic plants?. Allergo J Int. (2021) 30:96–108. doi: 10.1007/s40629-020-00152-4
73. Galán C, Alcázar P, Oteros J, García-Mozo H, Aira MJ, Belmonte J, et al. Airborne pollen trends in the Iberian Peninsula. Sci Total Environ. (2016) 550:53–9. doi: 10.1016/j.scitotenv.2016.01.069
74. Damialis A, Traidl-Hoffmann C, Treudler R. Climate Change and Pollen Allergies. Cham: Springer. (2019).
75. Biedermann T, Winther L, Till SJ, Panzner P, Knulst A, Valovirta E. Birch pollen allergy in Europe. Allergy. (2019) 74:1237–48. doi: 10.1111/all.13758
76. Imhof K, Probst E, Seifert B, Regenass S, Schmid-Grendelmeier P. Ash pollen allergy: reliable detection of sensitization on the basis of IgE to Ole e 1. Allergo J Int. (2014) 23:78–83. doi: 10.1007/s40629-014-0010-8
77. Umweltbundesamt. Monitoringbericht 2019 zur Deutschen Anpassungsstrategie an den Klimawandel. Bericht der Interministeriellen Arbeitsgruppe Anpassungsstrategie der Bundesregierung. (2019). Available online at: https://www.umweltbundesamt.de/sites/default/files/medien/1410/publikationen/das_monitoringbericht_2019_barrierefrei.pdf (accessed May 01, 2024).
78. Dabrowska-Zapart K, Niedzwiedz T. The impact of weather conditions on hazel pollen concentration in Sosnowiec (Poland) in 1997-2019. Aerobiologia. (2020) 36:697–713. doi: 10.1007/s10453-020-09661-9
79. Frei T, Gassner E. Climate change and its impact on birch pollen quantities and the start of the pollen season an example from Switzerland for the period 1969-2006. Int J Biometeorol. (2008) 52:667–74. doi: 10.1007/s00484-008-0159-2
80. Ziska L, Knowlton K, Rogers C, Dalan D, Tierney N, Elder MA, et al. Recent warming by latitude associated with increased length of ragweed pollen season in central North America. Proc Natl Acad Sci U S A. (2011) 108:4248–51. doi: 10.1073/pnas.1014107108
81. Ziska LH, Makra L, Harry SK, Bruffaerts N, Hendrickx M, Coates F, et al. Temperature-related changes in airborne allergenic pollen abundance and seasonality across the northern hemisphere: a retrospective data analysis. Lancet Planet Health. (2019) 3:e124–31. doi: 10.1016/S2542-5196(19)30015-4
82. Bergmann KC, Buters J, Karatzas K, Tasioulis T, Werchan B, Werchan M, et al. The development of birch pollen seasons over 30 years in Munich, Germany-An EAACI Task Force report. Allergy. (2020) 75:3024–6. doi: 10.1111/all.14470
83. Bogawski P, Grewling L, Nowak M, Smith M, Jackowiak B. Trends in atmospheric concentrations of weed pollen in the context of recent climate warming in Poznan (Western Poland). Int J Biometeorol. (2014) 58:1759–68. doi: 10.1007/s00484-013-0781-5
84. Zhang Y, Steiner AL. Projected climate-driven changes in pollen emission season length and magnitude over the continental United States. Nat Commun. (2022) 13:1234. doi: 10.1038/s41467-022-28764-0
85. Ziska LH, Gebhard DE, Frenz DA, Faulkner S, Singer BD, Straka JG. Cities as harbingers of climate change: common ragweed, urbanization, and public health. J Allergy Clin Immunol. (2003) 111:290–5. doi: 10.1067/mai.2003.53
86. D'Amato G, Liccardi G, Frenguelli G. Thunderstorm-asthma and pollen allergy. Allergy. (2007) 62:11–6. doi: 10.1111/j.1398-9995.2006.01271.x
87. Damialis A, Gioulekas D, Lazopoulou C, Balafoutis C, Vokou D. Transport of airborne pollen into the city of Thessaloniki: the effects of wind direction, speed and persistence. Int J Biometeorol. (2005) 49:139–45. doi: 10.1007/s00484-004-0229-z
88. Crimi P, Macrina G, Folli C, Bertoluzzo L, Brichetto L, Caviglia I, et al. Correlation between meteorological conditions and Parietaria pollen concentration in Alassio, north-west Italy. Int J Biometeorol. (2004) 49:13–7. doi: 10.1007/s00484-004-0212-8
89. Chico-Fernández J, Ayuga-Téllez E. Relationship of meteorological variables with the concentration of various tree pollen types in Madrid (Spain). Appl Sci. (2025) 15:692. doi: 10.3390/app15020692
90. Niklas K. The aerodynamics of wind pollination. Botani Rev. (1985) 51:328–86. doi: 10.1007/BF02861079
91. Oh JW. Pollen allergy in a changing planetary environment. Allergy Asthma Immunol Res. (2022) 14:168–81. doi: 10.4168/aair.2022.14.2.168
92. Cong R, Liu T, Lu P, Ren T, Li X, Lu J. Nitrogen fertilization compensation the weak photosynthesis of Oilseed rape (Brassca napus L.) under haze weather. Sci Rep. (2020) 10:4047. doi: 10.1038/s41598-020-60695-y
93. Dawson TE, Goldsmith GR. The value of wet leaves. New Phytol. (2018) 219:1156–69. doi: 10.1111/nph.15307
94. Ishibashi M, Terashima I. Effects of continuous leaf wetness on photosynthesis: adverse aspects of rainfall. Plant, Cell Environm. (1995) 18:431–8. doi: 10.1111/j.1365-3040.1995.tb00377.x
95. Hughes DD, Mampage CBA, Jones LM, Liu Z, Stone EA. Characterization of atmospheric pollen fragments during springtime thunderstorms. Environm Sci Technol Letters. (2020) 7:409–14. doi: 10.1021/acs.estlett.0c00213
96. D'Amato G, Chong-Neto HJ, Monge Ortega OP, Vitale C, Ansotegui I, Rosario N, et al. The effects of climate change on respiratory allergy and asthma induced by pollen and mold allergens. Allergy. (2020) 75:2219–28. doi: 10.1111/all.14476
97. Dales RE, Cakmak S, Judek S, Dann T, Coates F, Brook JR, et al. The role of fungal spores in thunderstorm asthma. Chest. (2003) 123:745–50. doi: 10.1378/chest.123.3.745
98. Heinrich J. Air pollutants and primary allergy prevention. Allergo J Int. (2019) 28:5–15. doi: 10.1007/s40629-018-0078-7
99. Baek M, Jung J, Jang T, Kim S, Ko K, Kim Y. The effect of PM10 on the symptoms of allergic rhinitis during spring. Otolaryngol–Head Neck Surg. (2013) 149:2. doi: 10.1177/0194599813496044a349
100. Jung JH. The effect of PM10 on allergy symptoms in allergic rhinitis patients during spring season. World Allergy Organ J. (2015) 8:A35. doi: 10.1186/1939-4551-8-S1-A35
101. Teng B, Zhang X, Yi C, Zhang Y, Ye S, Wang Y, et al. The association between ambient air pollution and allergic rhinitis: further epidemiological evidence from Changchun, Northeastern China. Int J Environ Res Public Health. (2017) 14:226. doi: 10.3390/ijerph14030226
102. Suring K, Bach S, Hoflich C, Straff W. Flow cytometric analysis of particle-bound bet v 1 allergen in PM10. J Vis Exp. (2016) 19:54721. doi: 10.3791/54721-v
103. Ghiani A, Aina R, Asero R, Bellotto E, Citterio S. Ragweed pollen collected along high-traffic roads shows a higher allergenicity than pollen sampled in vegetated areas. Allergy. (2012) 67:887–94. doi: 10.1111/j.1398-9995.2012.02846.x
104. Zhao F, Elkelish A, Durner J, Lindermayr C, Winkler JB, Ruëff F, et al. Common ragweed (Ambrosia artemisiifolia L.): allergenicity and molecular characterization of pollen after plant exposure to elevated NO2. Plant Cell Environ. (2016) 39:147–64. doi: 10.1111/pce.12601
105. Bascom R, Naclerio RM, Fitzgerald TK, Kagey-Sobotka A, Proud D. Effect of ozone inhalation on the response to nasal challenge with antigen of allergic subjects. Am Rev Respir Dis. (1990) 142:594–601. doi: 10.1164/ajrccm/142.3.594
106. Carlsen HK, Haga SL, Olsson D, Behndig AF, Modig L, Meister K, et al. Birch pollen, air pollution and their interactive effects on airway symptoms and peak expiratory flow in allergic asthma during pollen season - a panel study in Northern and Southern Sweden. Environ Health. (2022) 21:63. doi: 10.1186/s12940-022-00871-x
107. Kim BJ, Kwon JW, Seo JH, Kim HB, Lee SY, Park KS, et al. Association of ozone exposure with asthma, allergic rhinitis, and allergic sensitization. Ann Allergy Asthma Immunol. (2011) 107:214–9. doi: 10.1016/j.anai.2011.05.025
108. Zhu C, Farah J, Choel M, Gosselin S, Baroudi M, Petitprez D, et al. Uptake of ozone and modification of lipids in Betula Pendula pollen. Environ Pollut. (2018) 242:880–6. doi: 10.1016/j.envpol.2018.07.025
109. Kanter U, Heller W, Durner J, Winkler JB, Engel M, Behrendt H, et al. Molecular and immunological characterization of ragweed (Ambrosia artemisiifolia L.) pollen after exposure of the plants to elevated ozone over a whole growing season. PLoS ONE. (2013) 8:e61518. doi: 10.1371/journal.pone.0061518
110. Rogerieux F, Godfrin D, Sénéchal H, Motta AC, Marlière M, Peltre G, et al. Modifications of Phleum pratense grass pollen allergens following artificial exposure to gaseous air pollutants (O(3), NO(2), SO(2)). Int Arch Allergy Immunol. (2007) 143:127–34. doi: 10.1159/000099079
111. Eckl-Dorna J, Klein B, Reichenauer TG, Niederberger V, Valenta R. Exposure of rye (Secale cereale) cultivars to elevated ozone levels increases the allergen content in pollen. J Allergy Clin Immunol. (2010) 126:1315–7. doi: 10.1016/j.jaci.2010.06.012
112. Beck I, Jochner S, Gilles S, McIntyre M, Buters JT, Schmidt-Weber C, et al. High environmental ozone levels lead to enhanced allergenicity of birch pollen. PLoS ONE. (2013) 8:e80147. doi: 10.1371/journal.pone.0080147
Keywords: allergic rhinitis, children and adolescents, climate change, generalized additive models, hay fever, incidence
Citation: Dao-Siebel T, Holstiege J, Graw K, Müller C, Matzarakis A, Halbleib R and Lamy E (2025) Association between climate indicators and hay fever incidence in children and adolescents in Freiburg, Germany. Front. Public Health 13:1587767. doi: 10.3389/fpubh.2025.1587767
Received: 04 March 2025; Accepted: 15 May 2025;
Published: 04 June 2025.
Edited by:
Eric X. Wei, Stanford University, United StatesReviewed by:
Michael Chang, Stanford University, United StatesPatrick Kiessling, Stanford Healthcare, United States
Copyright © 2025 Dao-Siebel, Holstiege, Graw, Müller, Matzarakis, Halbleib and Lamy. This is an open-access article distributed under the terms of the Creative Commons Attribution License (CC BY). The use, distribution or reproduction in other forums is permitted, provided the original author(s) and the copyright owner(s) are credited and that the original publication in this journal is cited, in accordance with accepted academic practice. No use, distribution or reproduction is permitted which does not comply with these terms.
*Correspondence: Evelyn Lamy, ZXZlbHluLmxhbXlAbWVkLnVuaS1hdWdzYnVyZy5kZQ==