 Nina Wang
 Qinglei Wang
 Mengyan Wang
 Mohd Nazri Bin Abdul Rahman
- 1Faculty of Liberal Arts and Law, Guangdong University of Petrochemical Technology, Maoming, Guangdong, China
- 2School of Physical Education, Guangdong University of Petrochemical Technology, Maoming, Guangdong, China
- 3Department of Educational Psychology and Counselling, Faculty of Education, Universiti Malaya, Kuala Lumpur, Malaysia
Background: Early childhood is an essential phase characterized by physical, social, and cognitive development. This developmental stage lays the foundation for establishing lifelong health behavior patterns that can resonate into adolescence and adulthood. Despite the growing recognition of the significance of physical activity during crucial developmental periods, the advent of technology-driven modern society has induced a notable preference among children for a sedentary lifestyle. In addition, compared to research involving older children and adolescents, the existing evidence for preschool and school-based remains relatively limited in scope and depth.
Objective: To assess the influence of exercise interventions on anthropometric factors, encompassing Body Mass Index (BMI), skinfold thickness (ST), BMI z-score, and Waist Circumference (WC), as well as physiological parameters, including Diastolic Blood Pressure (DBP) and Systolic Blood Pressure (SBP), in both preschool and school-based children, and the comparison between these two age groups.
Methods: Four databases were searched (such as Web of Science, The Cochrane library, Scopus, and Embase) and included only randomized controlled trials (RCTs) assessing exercise interventions’ impact on anthropometric measurements and blood pressure in children aged 1–12 years, including both preschoolers and school-aged children. The analysis used the standardized mean difference as the outcome measure and employed a random-effects model for data analysis.
Results: From the results, including 29 RCTs, exercise interventions were linked to favorable reductions: BMI (μ = −0.317; 95% CI: −0.570 to −0.064), WC (μ = −0.010; 95% CI: −0.104–0.085), and ST (μ = −0.066; 95% CI: −0.293–0.161). Also, improvements occurred in DBP (μ = −0.068; 95% CI: −0.139–0.002) and SBP (μ = −0.186; 95% CI: −0.373–0.001). Subgroup analysis found no significant age group differences.
Conclusion: This meta-analytical method provides substantial evidence affirming the effectiveness of physical exercise programs, regardless of age group, with a focus on gross motor skills, whether implemented alone or in conjunction with supplementary interventions, in reducing anthropometric parameters.
Systematic Review Registration: PROSPERO 2023 (CRD42023470312).
1 Introduction
Early childhood is a critical phase marked by physical, social, and cognitive development (1). This developmental period establishes the foundation for lifelong health behavior patterns that can extend into adolescence and adulthood (2, 3). In recent years, research has increasingly highlighted the importance of regular physical activity among preschool and school-aged children as a cornerstone of healthy growth and development. Participation in physical activity during these formative years not only offers immediate benefits but also holds potential for long-term improvements in both physical and psychological wellbeing (4, 5). Despite increasing recognition of the importance of physical activity during key developmental stages, the rise of technology-driven lifestyles has fostered a preference for sedentary behaviors among children (6). Moreover, compared to research on older children and adolescents, the body of evidence focusing on preschool and early school-aged populations remains relatively limited in both scope and depth.
Childhood obesity has become a worrying global public health problem. The overall prevalence of obesity in children and adolescents was 8.5% (95% CI 8.2–8.8). The prevalence varied across countries, ranging from 0.4% (Vanuatu) to 28.4% (Puerto Rico). Higher prevalence of obesity among children and adolescents was reported in countries with Human Development Index scores of 0.8 or greater and high-income countries or regions. Compared to 2000–2011, a 1.5-fold increase in the prevalence of obesity was observed in 2012–2023. The pooled estimates of overweight and excess weight in children and adolescents were 14.8% (95% CI 14.5–15.1) and 22.2% (95% CI 21.6–22.8), respectively (7).
According to the WHO (2021), approximately 39 million children under the age of five are overweight or obese, and more than 340 million children and adolescents aged 5–12 fall into this category. This condition not only increases the risk of metabolic disease in adulthood but also impacts children’s quality of life from an early age. Regular physical activity is a key strategy for obesity prevention. The WHO (2019) recommends that children aged 5–12 engage in at least 60 min of moderate to vigorous physical activity daily. Several studies have shown that physical exercise can improve body composition, increase cardiorespiratory fitness, and reduce cardiometabolic risk factors (8, 9). Underlying mechanisms include increased energy expenditure, fat oxidation, and decreased systemic inflammation.
Several previous systematic reviews have assessed the effectiveness of physical activity interventions in children, but most have focused on specific age groups, such as preschool or school-aged children. There has been no comprehensive meta-analysis directly comparing the effects of interventions in these two age groups, particularly regarding anthropometric indicators (BMI, waist circumference, skinfold thickness) and physiological parameters (systolic and diastolic blood pressure) (8–11). However, differences in physical and cognitive developmental stages between preschool and school-age children may influence response to interventions.
Therefore, this study aimed to systematically and quantitatively evaluate the effects of physical activity interventions on anthropometric and physiological parameters in preschool children (1–5.99 years) and school-age children (6–12 years), and to compare the effectiveness of interventions in these two age groups.
2 Methods
2.1 Registration and protocol guidelines
This study adhered to the Preferred Reporting Items for Systematic Reviews and Meta-Analyses (PRISMA) guidelines (12).
2.2 Source of data
A comprehensive search was conducted using relevant keywords across multiple databases, including Web of Science, The Cochrane Library, Scopus, and Embase, to identify pertinent studies. The search syntax is detailed in the supplementary file.
2.3 Inclusion criteria and study selection
Eligible studies focused on children aged 1–5.99 (preschool) and 6–12 years (school-aged), of both genders. Participants were required to be overweight or obese but without any diagnosed medical conditions. Only randomized controlled trials (RCTs) that assessed at least one anthropometric or physiological parameter (i.e., DBP, SBP, BMI, ST, WC, BMI z-score) were included.
Exclusion criteria encompassed studies involving children with clinical conditions such as diabetes or hypertension; studies that reported only lifestyle changes without structured physical activity; studies including participants over age 12; and studies lacking a control group. Two authors independently screened titles, abstracts, and full texts. Disagreements were resolved through consultation with a third reviewer. Only studies published in English were considered.
2.4 Extraction of data
Two reviewers assessed titles and abstracts of the identified records. Full texts of potentially eligible studies were then examined in detail. Data were extracted using a standardized template covering study design, sample size, participant demographics (age, gender), intervention details (type, duration), and outcome measures.
2.5 Quality appraisal of included studies
The Physiotherapy Evidence Database (PEDro) tool was used to evaluate trial quality, considering factors such as study design, sample size, blinding procedures, and allocation concealment (13).
2.6 Synthesis of data
Pooled effect sizes were calculated to assess the relationship between exercise interventions and health outcomes. Subgroup analyses explored potential sources of heterogeneity, such as participant characteristics and specific intervention features.
2.7 Statistical analysis
A random-effects model using standardized mean differences was applied. Heterogeneity was estimated via τ2 using a restricted maximum-likelihood estimator (14), and further assessed using the Q-test for heterogeneity (15) and the I2 statistic (16). In the presence of heterogeneity (τ2 > 0), prediction intervals were calculated (17). Studentized residuals and Cook’s distances identified outliers and influential studies (18). Outliers were defined as studies with studentized residuals exceeding the 100 × [1–0.05/(2 × k)]th percentile, accounting for a Bonferroni correction. Influential studies had Cook’s distances exceeding the median plus six times the interquartile range. To detect funnel plot asymmetry, both the rank correlation test (19) and regression test (20), were employed, using the standard error of observed outcomes as a predictor. Analyses were performed in R (version 4.3.1) (R Core Team, 2020) using the meta package (version 4.2.0) (21).
2.8 Publication bias
To assess funnel plot asymmetry, the researcher utilized the rank correlation test proposed by Begg and Mazumdar (19) and the regression test developed by Sterne and Egger (19, 20).
2.9 Strength of evidence
The robustness of evidence was evaluated using the GRADE framework, which considers study design, risk of bias, consistency, precision, and directness of evidence.
3 Results
3.1 Process of study selection
The electronic search yielded 2,594 records. After removing duplicates and screening titles and abstracts, 2035 articles were excluded. From the remaining 556, full-text screening was conducted for 83 studies. Reference lists of included studies and relevant reviews were also examined for additional sources. Full-text exclusions were due to improper study design (11 studies), ineligible populations (7 studies), or inappropriate outcome measures (34 studies). Ultimately, 31 studies were included in the systematic review, and 29 met the criteria for meta-analysis (22–52). The PRISMA flowchart is shown in Figure 1 (53).
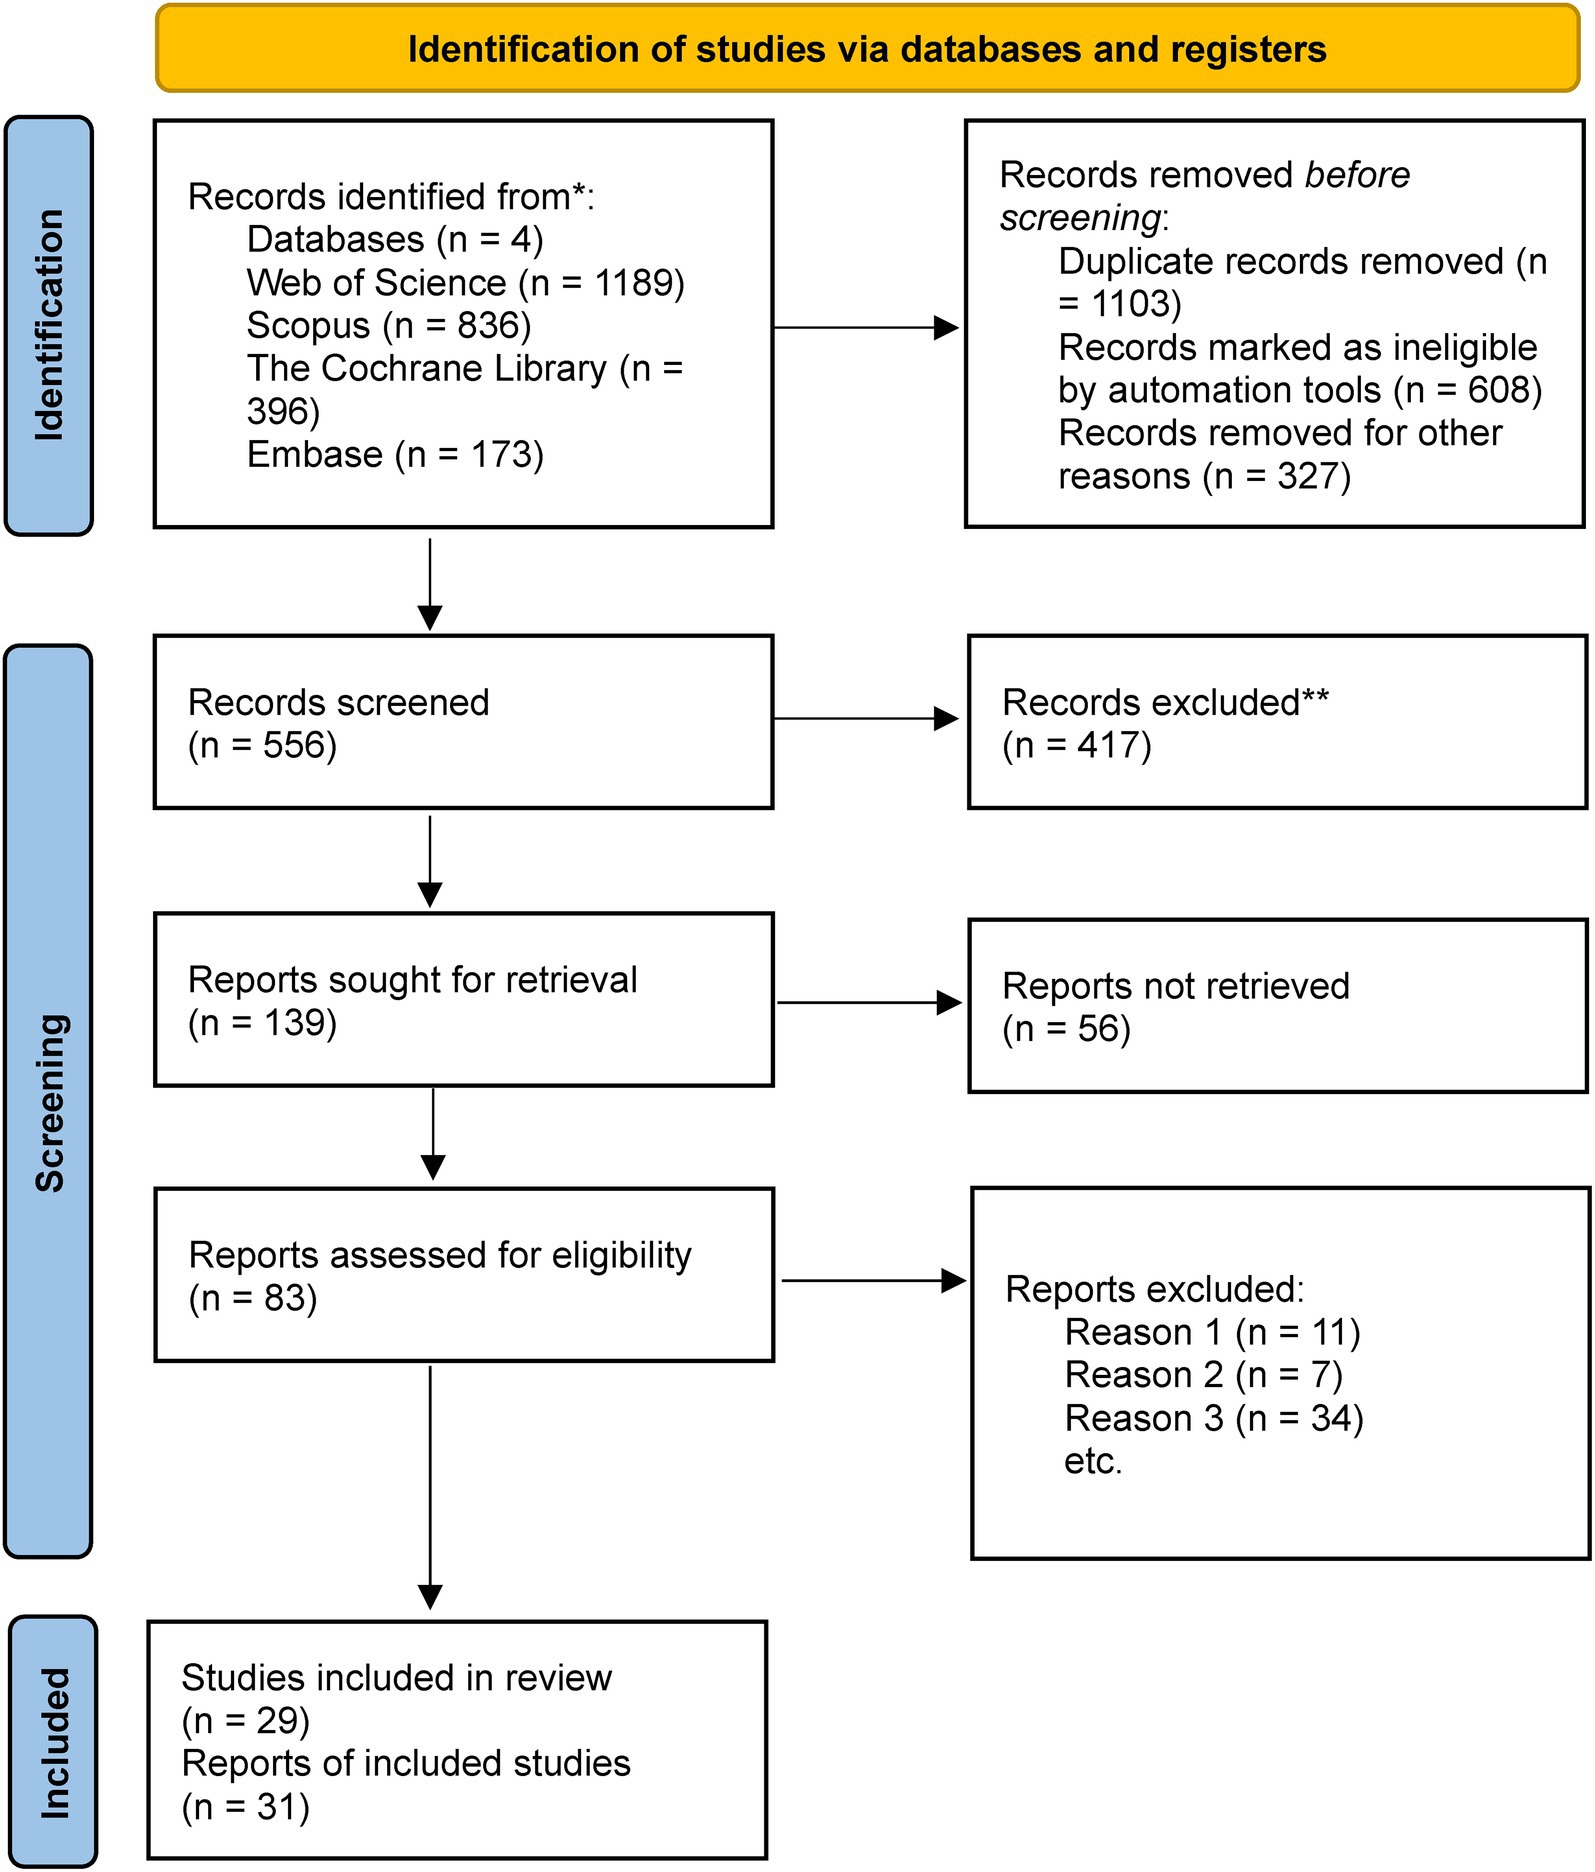
Figure 1. PRISMA flow diagram.
3.2 Study characteristics
Table 1 summarizes the characteristics of the included studies. The final analysis encompassed 5,260 preschoolers and 3,929 school-aged children. Participants came from various countries, including Spain (n = 6), USA (n = 4), Germany (n = 4), Australia (n = 3), Italy (n = 2), China (n = 2), Norway (n = 1), Berlin (n = 1), Portugal (n = 1), Netherlands (n = 1), Saudi Arabia (n = 1), Greece (n = 1), Israel (n = 1), Switzerland (n = 1), and the United Kingdom (n = 1). All studies included both boys and girls. Sample sizes varied, from 27 participants (36) to 1,154 (23). Intervention durations ranged from 5 weeks (36) to 96 weeks (33).
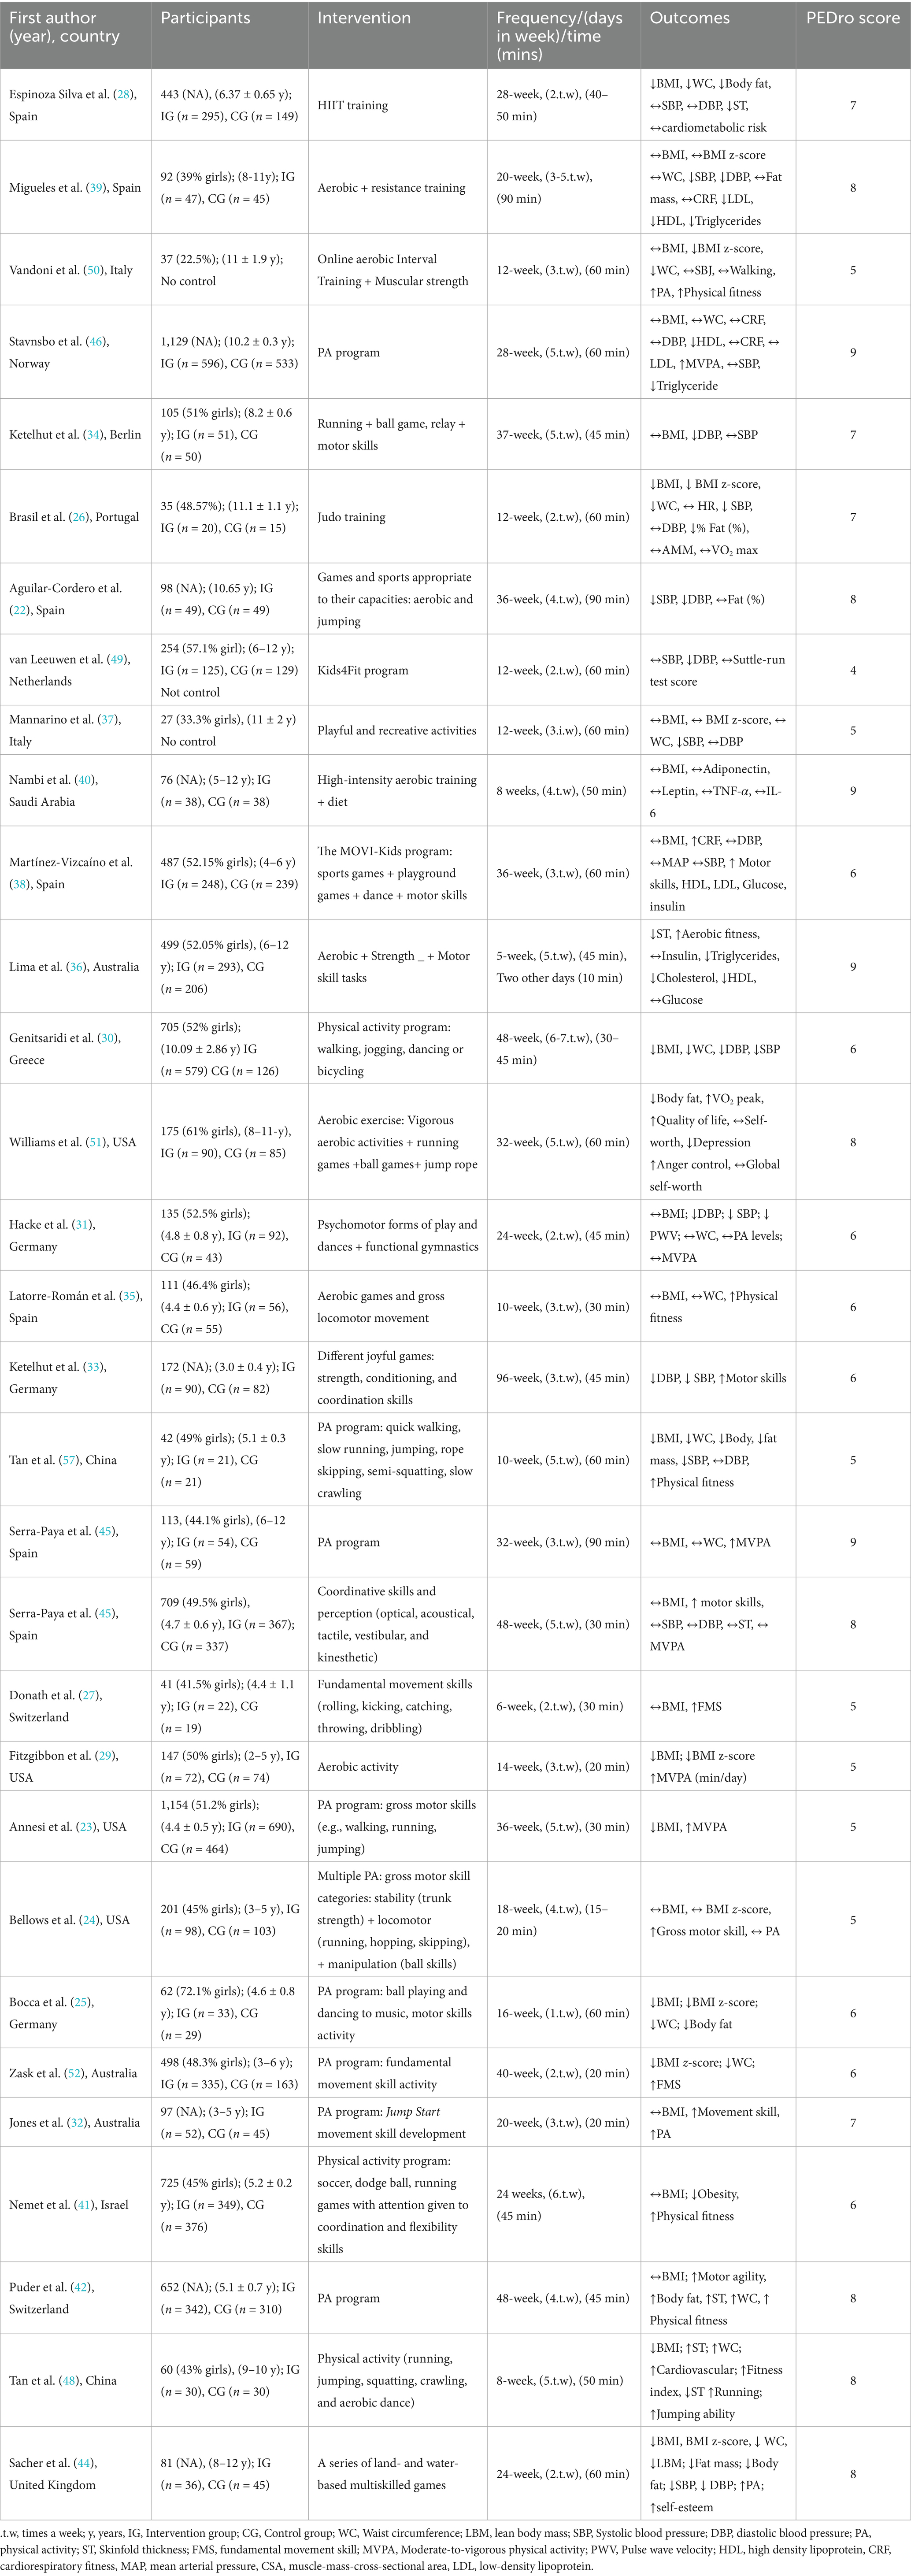
Table 1. Characteristics and findings of the studies.
Outcome measures included a broad array of indicators: anthropometric (e.g., BMI, WC, ST, BMI z-score, fat mass, body fat percentage), physiological (e.g., cardiorespiratory fitness, blood pressure), physical (e.g., MVPA, gross motor skills), and blood biomarkers (e.g., adiponectin, leptin, insulin, triglycerides, IL-6, TNF-α, HDL, LDL). Full details for each RCT are provided in Table 1.
3.3 Meta-analysis of BMI outcome
The analysis incorporated 18 studies. The observed standardized mean differences ranged from −1.748 to 0.126, with most estimates being negative (72%). The estimated average standardized mean difference, based on the random-effects model, was μ = −0.317 (95% CI: −0.570 to −0.064). This average outcome significantly differed from zero (z = −2.452, p = 0.014). Heterogeneity, as indicated by the Q-test, was substantial [Q(17) = 380.228, p < 0.001, τ2 = 0.262, I2 = 96.925%]. The 95% prediction interval for true outcomes was −1.351 to −0.717, suggesting the possibility of positive outcomes in some studies. Subgroup analysis between the pre- and school-age groups was not significant (p = 0.57) (Figure 2).

Figure 2. Forest plot showing the observed outcomes and the estimate of the random-effects model.
One study, Nemet et al. (41), exhibited a studentized residual larger than ±2.991, identifying it as a potential outlier. According to Cook’s distance, two studies (29, 41) were considered overly influential.
Funnel plot analysis (Figure 3) did not indicate significant asymmetry, as confirmed by the rank correlation and regression tests (p = 0.068 and p = 0.840, respectively).
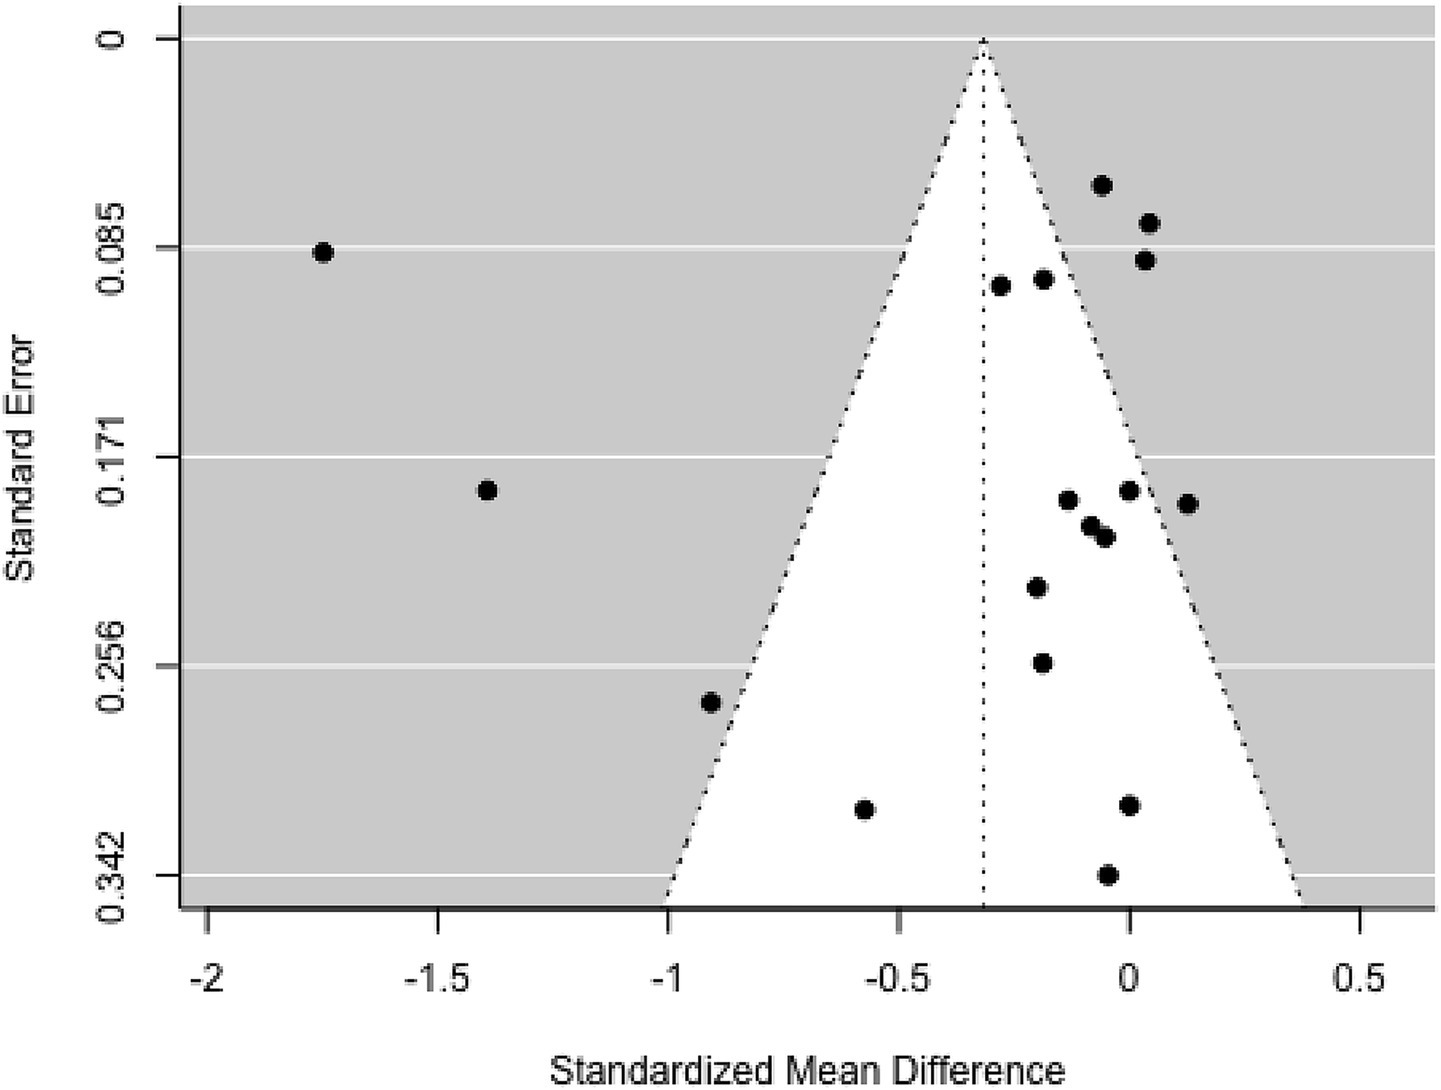
Figure 3. Funnel plot.
After excluding potential outlier studies, the estimated average standardized mean difference was μ = −0.101 (95% CI: −0.188 to −0.014). This result significantly differed from zero (z = −2.273, p = 0.023). Although heterogeneity remained, it was no longer significant [Q(15) = 23.199, p = 0.080, τ2 = 0.008, I2 = 31.765%]. The 95% prediction interval for true outcomes was −0.300–0.098, indicating the potential for positive outcomes in some studies.
3.4 Meta-analysis of BMI Z-score outcome
The analysis included five studies (k = 5). Standardized mean differences ranged from −0.494 to 2.984, with the majority being negative (60%). The estimated average standardized mean difference, based on the random-effects model, was μ = 0.403 (95% CI: −0.882–1.688). This result did not significantly differ from zero (z = 0.615, p = 0.539). Substantial heterogeneity was observed [Q(4) = 148.967, p < 0.001, τ2 = 2.088, I2 = 97.981%]. The 95% prediction interval for true outcomes ranged from −2.707 to 3.513, indicating the possibility of negative outcomes in some studies. Subgroup analysis between the pre- and school-age groups was not significant (p = 0.26) (Figure 4).
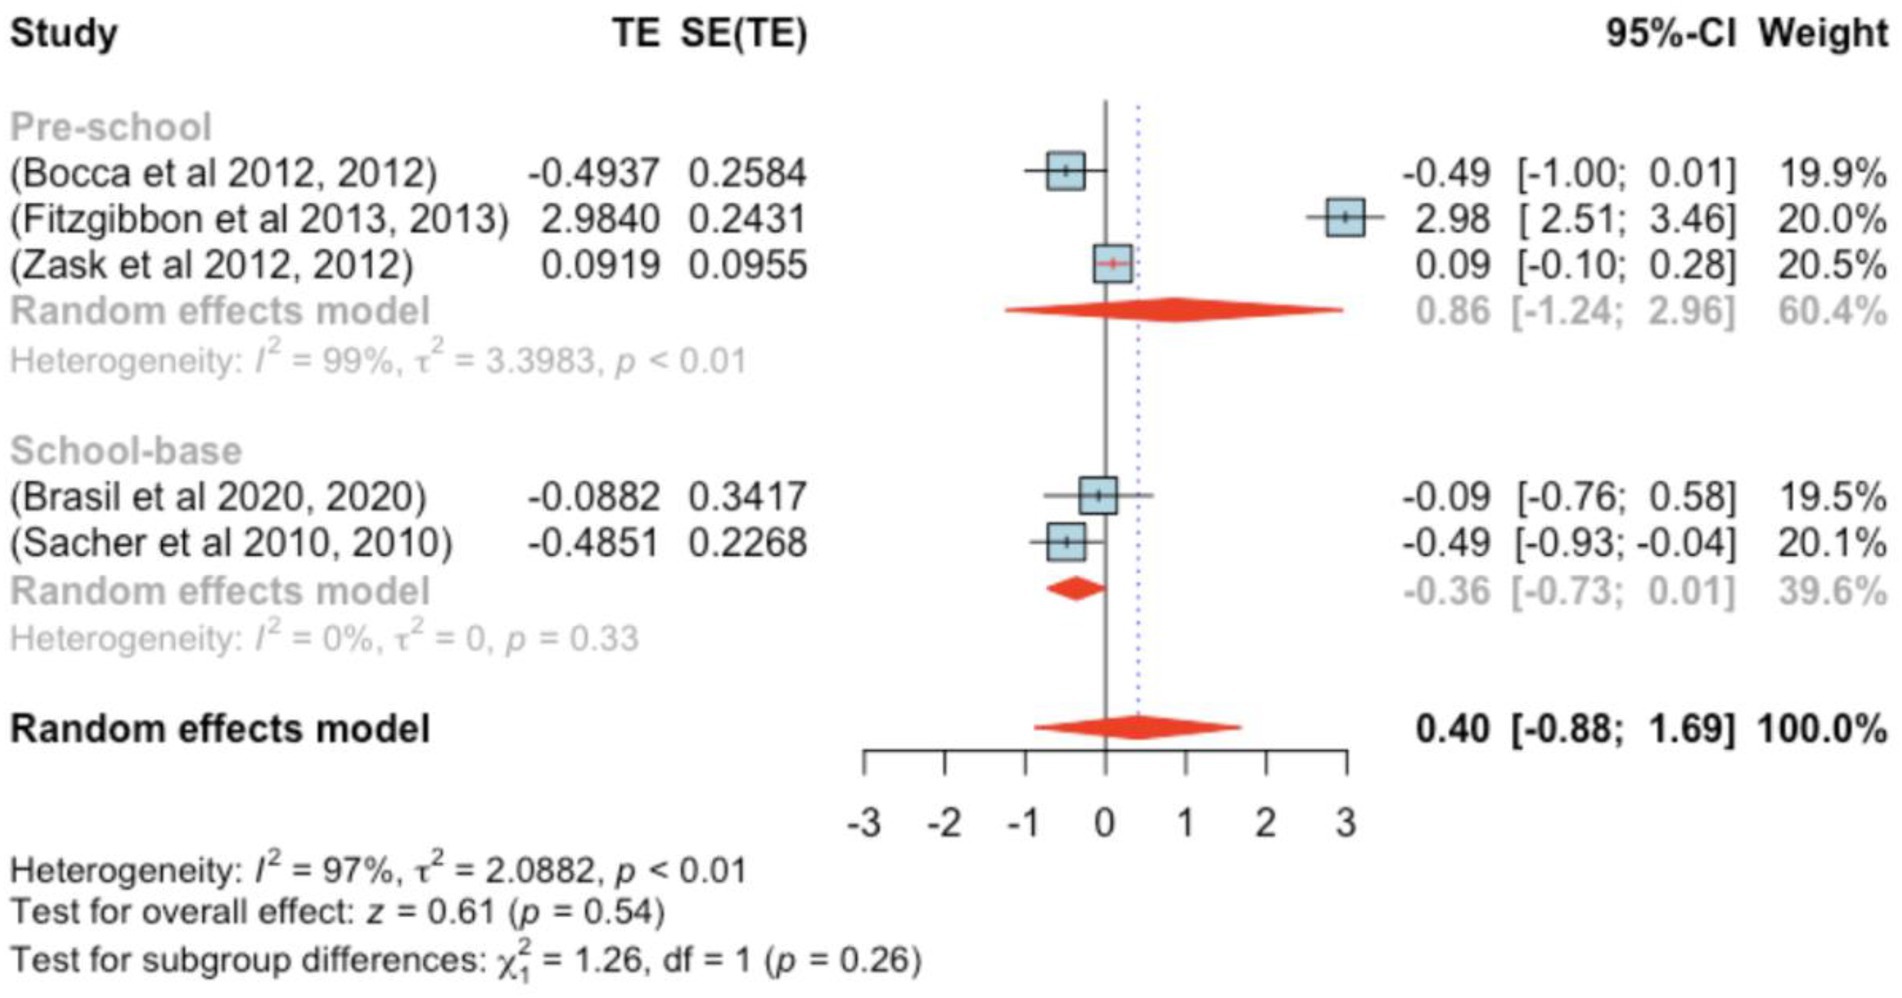
Figure 4. Forest plot showing the observed outcomes and the estimate of the random-effects model.
One study (29) showed a studentized residual larger than ±2.576, suggesting potential outlier status. Based on Cook’s distances, the same study was deemed overly influential.
Funnel plot assessment (Figure 5) did not reveal significant asymmetry; both the rank correlation and regression tests indicated no evidence of bias (p = 0.817 and p = 1.000, respectively).
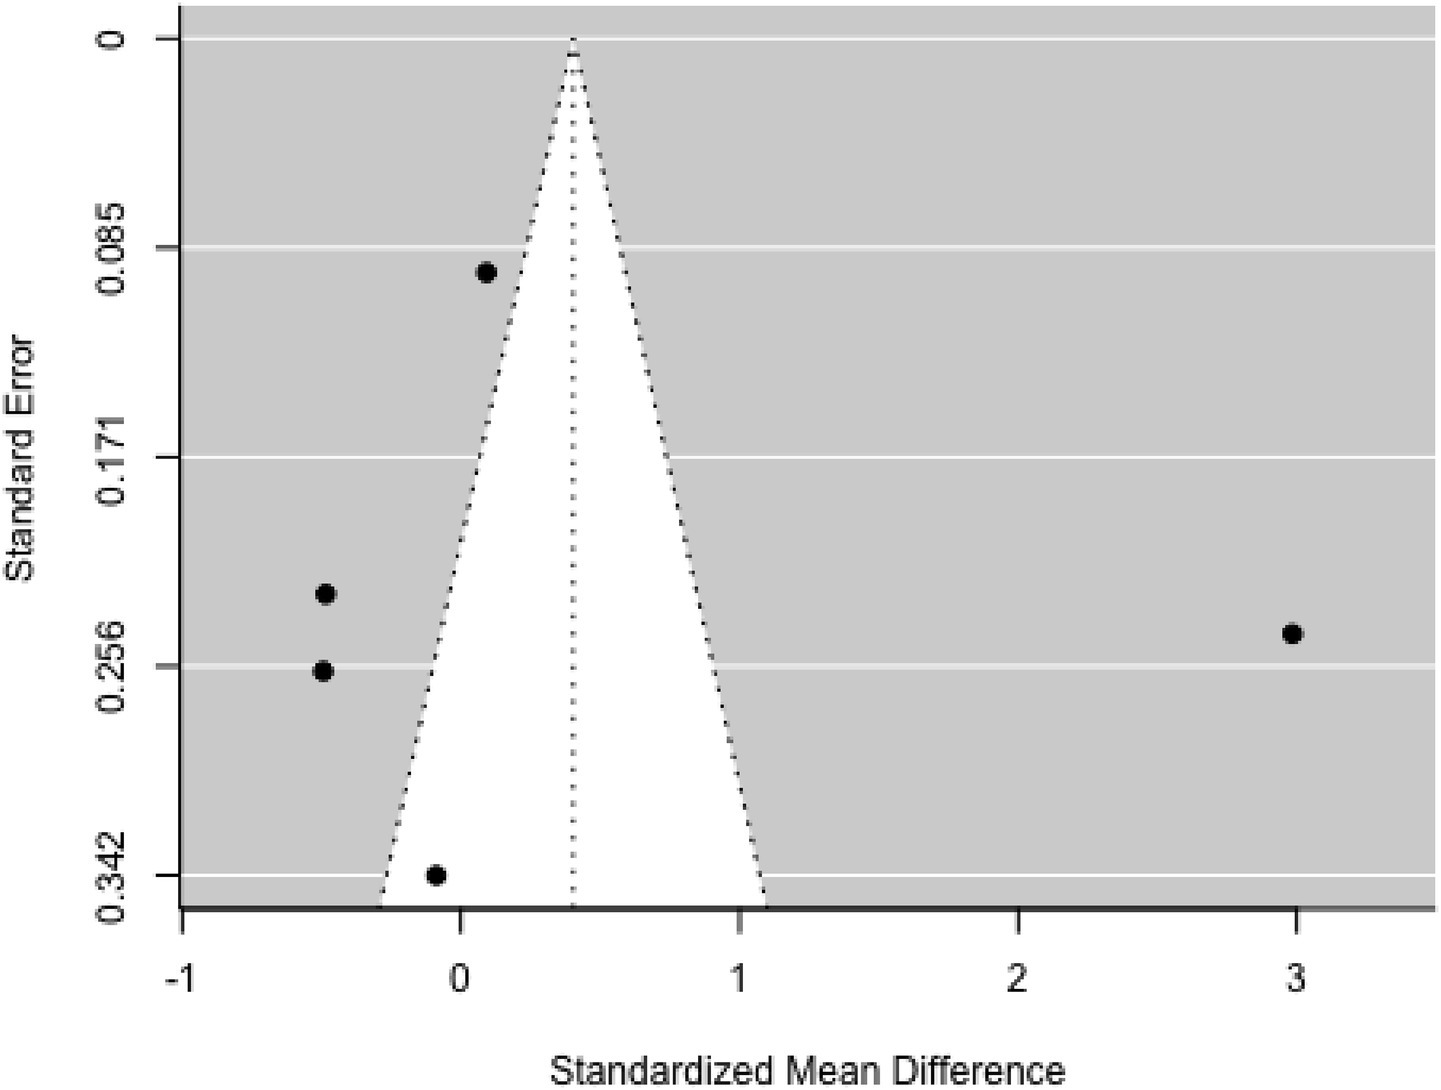
Figure 5. Funnel plot.
After excluding the outlier study, the estimated average standardized mean difference was μ = −0.206 (95% CI: −0.545–0.132), which did not differ significantly from zero (z = −1.194, p = 0.232).
3.5 Meta-analysis of waist circumference outcome
Eleven studies were included in this segment. Standardized mean differences ranged from −0.540 to 0.134, with most being negative (55%). The estimated average standardized mean difference, based on the random-effects model, was μ = −0.010 (95% CI: −0.104–0.085), with no significant difference from zero (z = −0.198, p = 0.843). Heterogeneity was not significant [Q(10) = 8.762, p = 0.555, τ2 = 0.000, I2 = 0.000%] (Figure 6).

Figure 6. Forest plot showing the observed outcomes and the estimate of the random-effects model.
None of the studies showed studentized residuals exceeding ±2.838, suggesting no outliers. Cook’s distances indicated that none of the studies were overly influential. Funnel plot analysis (Figure 7) showed no significant asymmetry, as confirmed by the rank correlation and regression tests (p = 0.121 and p = 0.095, respectively).

Figure 7. Funnel plot.
3.6 Meta-analysis of skin thickness outcome
The analysis included four studies (k = 4). Standardized mean differences ranged from −0.351 to 0.192, with the majority being negative (75%). The estimated average standardized mean difference, based on the random-effects model, was μ = −0.066 (95% CI: −0.293–0.161). This result did not significantly differ from zero (z = −0.571, p = 0.568). Heterogeneity was present [Q(3) = 12.386, p = 0.006, τ2 = 0.038, I2 = 76.673%]. The 95% prediction interval for true outcomes was −0.511–0.379, suggesting possible positive outcomes in some studies. Subgroup analysis between the pre- and school-age groups was not significant (p = 0.81) (Figure 8).
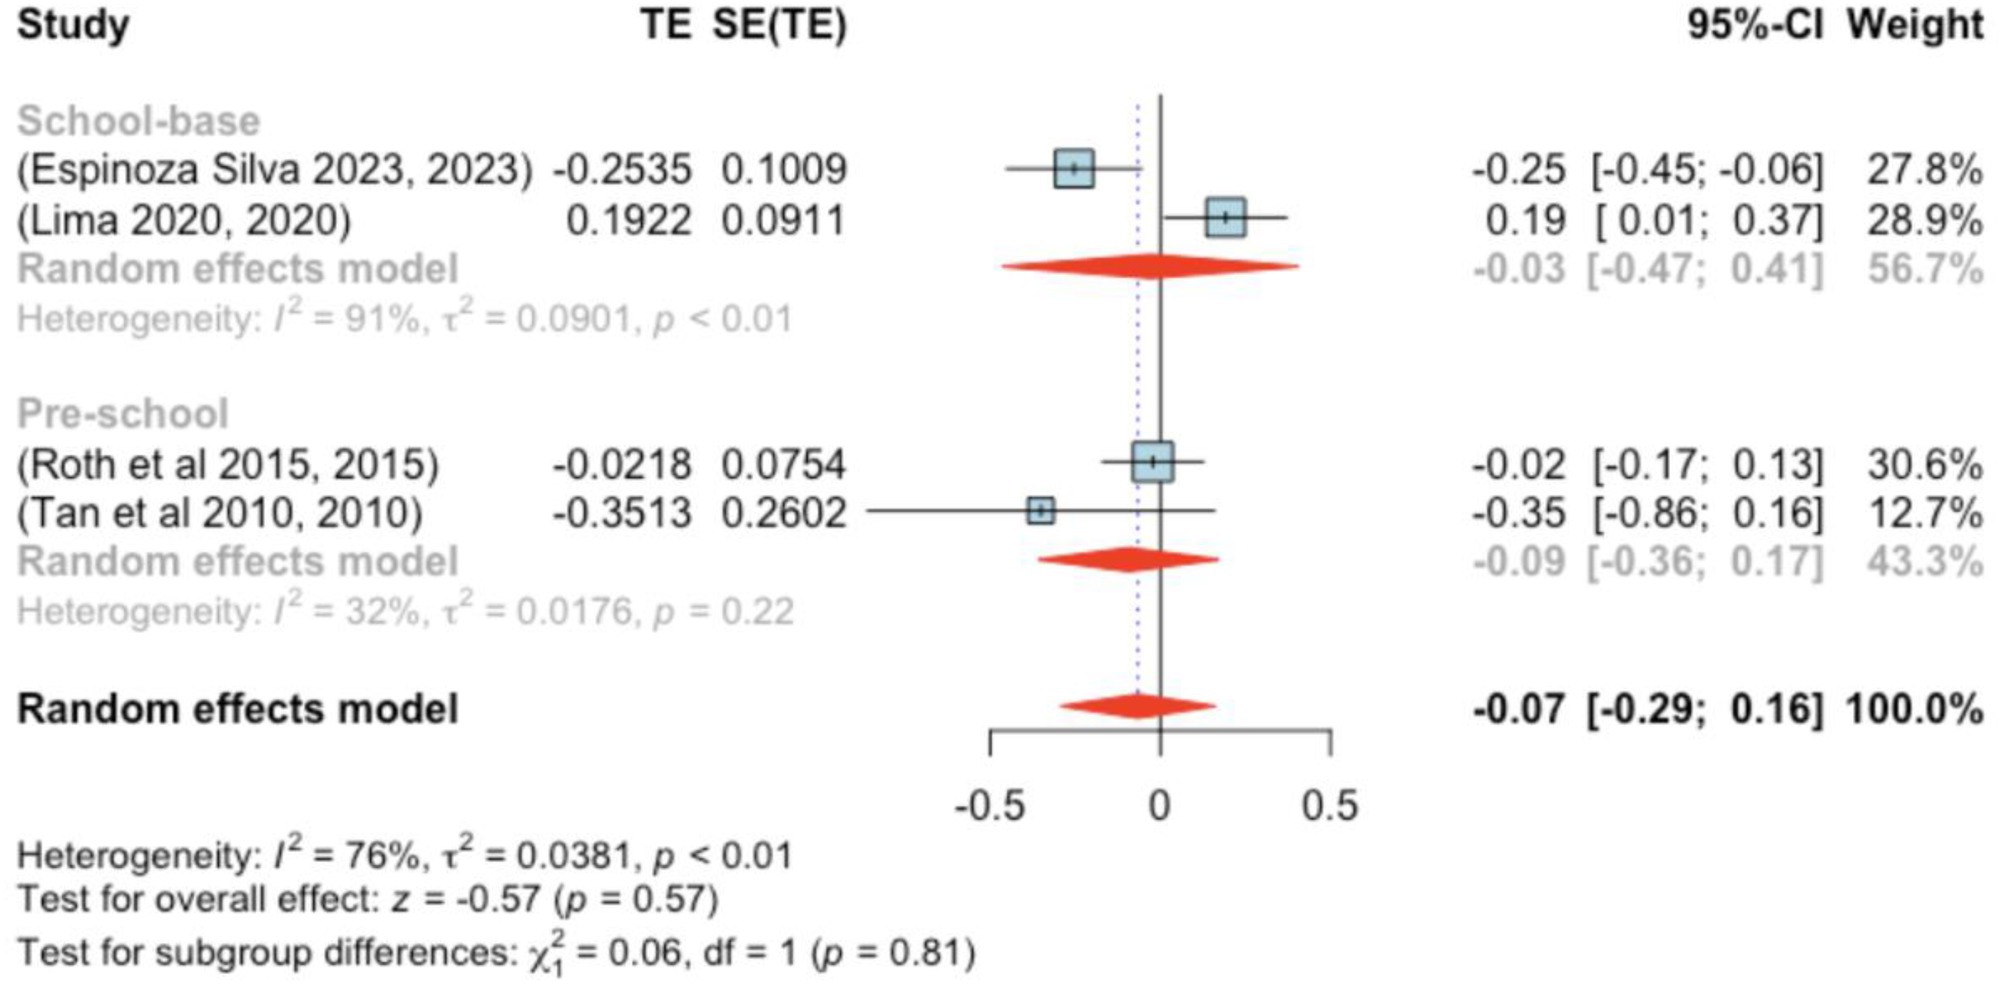
Figure 8. Forest plot showing the observed outcomes and the estimate of the random-effects model.
None of the studies exhibited studentized residuals beyond ±2.498, and Cook’s distances indicated no overly influential studies. Funnel plot analysis (Figure 9) showed no significant asymmetry, with rank correlation and regression tests also indicating no bias (p = 0.750 and p = 0.301, respectively).

Figure 9. Funnel plot.
3.7 Meta-analysis of DBP outcome
The analysis encompassed 12 studies (k = 12). Standardized mean differences ranged from −0.379–0.406, with 75% being negative. The estimated average standardized mean difference was μ = −0.068 (95% CI: −0.139–0.002), which did not significantly differ from zero (z = −1.909, p = 0.056). Heterogeneity was not significant [Q(11) = 15.062, p = 0.180, τ2 = 0.000, I2 = 27.021%]. The 95% prediction interval was −0.139–0.002, again suggesting possible positive outcomes. Subgroup analysis between the pre- and school-age groups was not significant (p = 0.90) (Figure 10).
![Forest plot displaying the meta-analysis of studies on school-based and preschool interventions. Squares represent individual studies with horizontal lines indicating confidence intervals. Diamonds represent pooled effects. School-based interventions show a pooled effect size of -0.08 with a 95% confidence interval of [-0.25, 0.08]. Preschool interventions show a pooled effect size of -0.07 with a 95% confidence interval of [-0.17, 0.02]. Overall effect size is -0.07 with a 95% confidence interval of [-0.14, 0.00]. Heterogeneity statistics are provided for each subgroup and the overall model.](https://www.frontiersin.org/files/Articles/1592098/fpubh-13-1592098-HTML/image_m/fpubh-13-1592098-g010.jpg)
Figure 10. Forest plot showing the observed outcomes and the estimate of the random-effects model.
No studies had studentized residuals beyond ±2.865, and Cook’s distances did not indicate any overly influential studies. Funnel plot analysis (Figure 11) revealed no significant asymmetry, confirmed by the rank correlation and regression tests (p = 0.197 and p = 0.175, respectively).
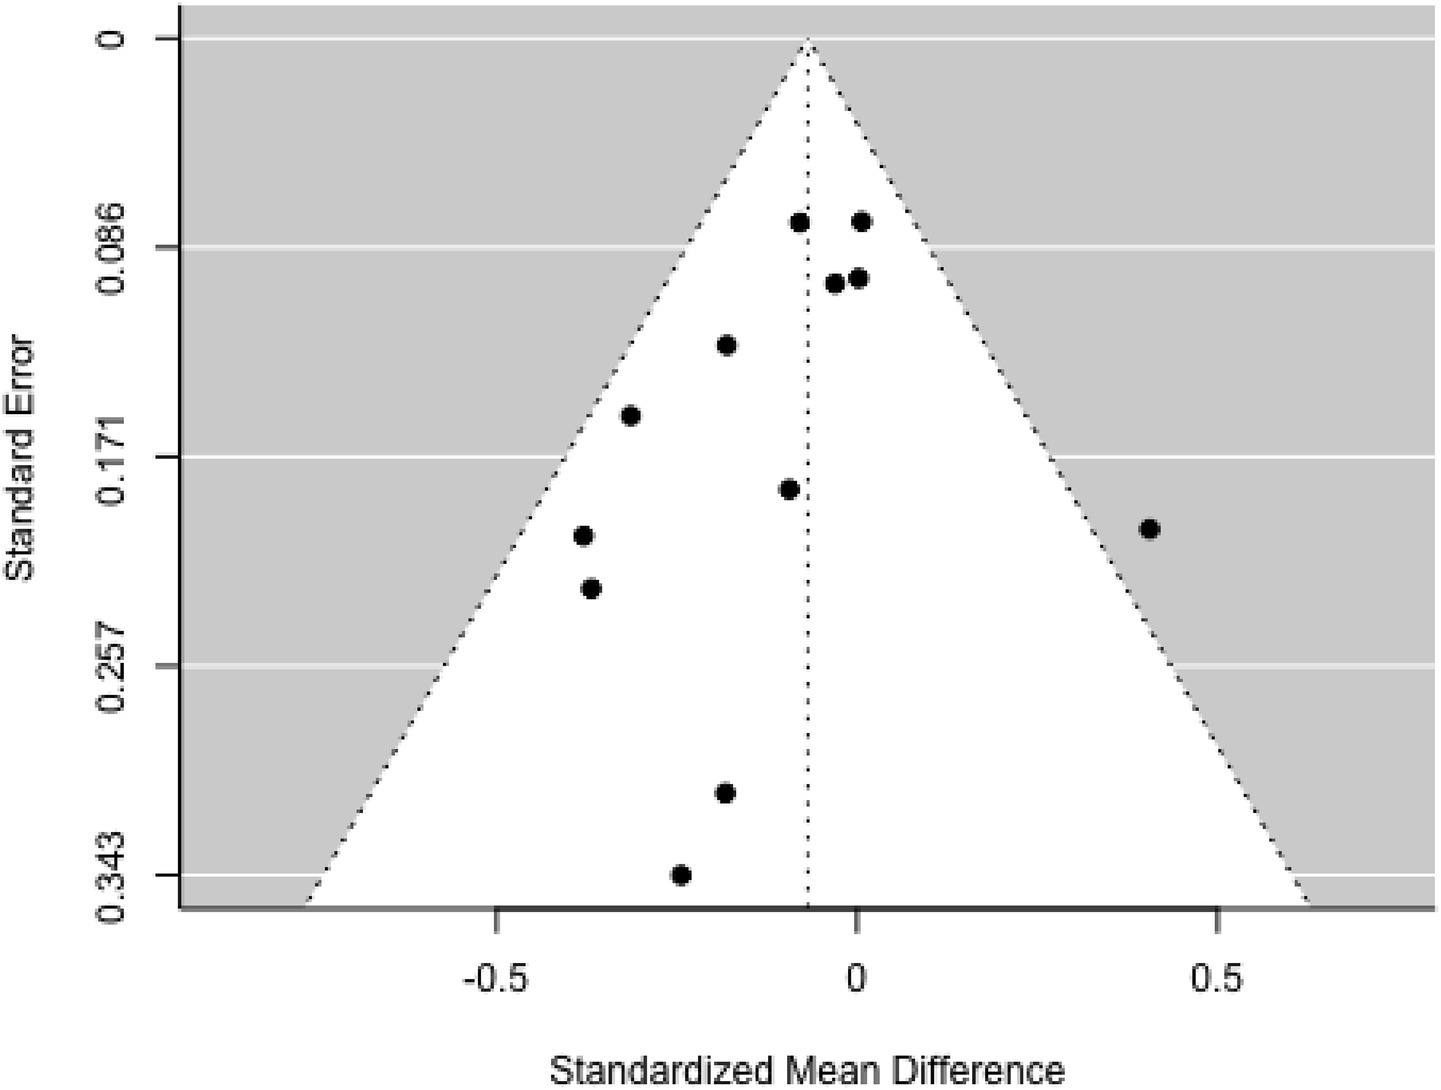
Figure 11. Funnel plot.
3.8 Meta-analysis of SBP outcome
Eleven studies were included in this analysis. Standardized mean differences ranged from −0.982 to 0.288, with 82% being negative. The estimated average standardized mean difference was μ = −0.186 (95% CI: −0.373–0.001). This result did not significantly differ from zero (z = −1.951, p = 0.051). Heterogeneity was present [Q(10) = 37.979, p < 0.001, τ2 = 0.069, I2 = 74.109%]. The 95% prediction interval ranged from −0.734 to 0.361, suggesting the possibility of positive outcomes in some studies. Subgroup analysis between the pre- and school-age groups was not significant (p = 0.83) (Figure 12).
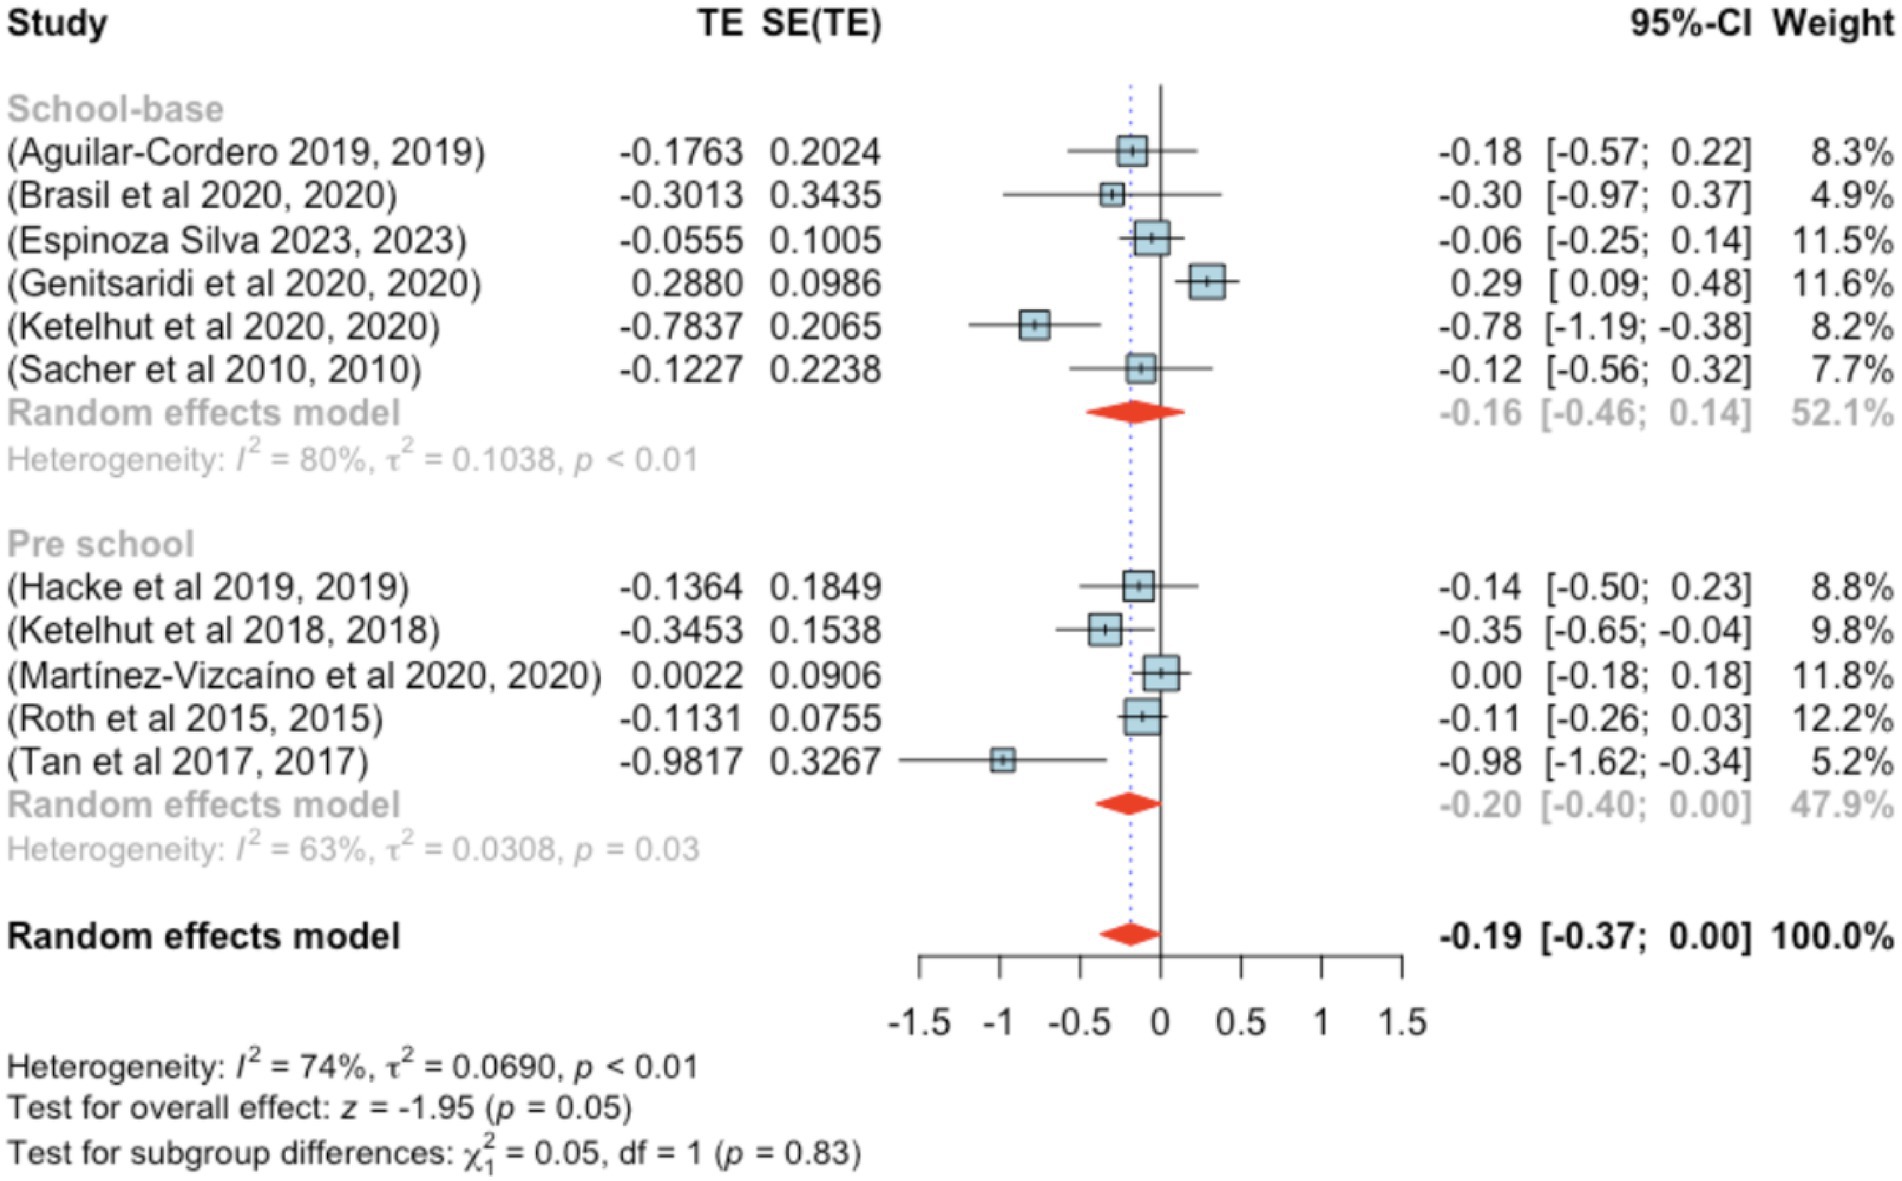
Figure 12. Forest plot showing the observed outcomes and the estimate of the random-effects model.
None of the studies had studentized residuals exceeding ±2.838, and Cook’s distances indicated no overly influential studies. Funnel plot analysis (Figure 13) indicated significant asymmetry based on the regression test (p = 0.007), although the rank correlation test did not indicate bias (p = 0.121).
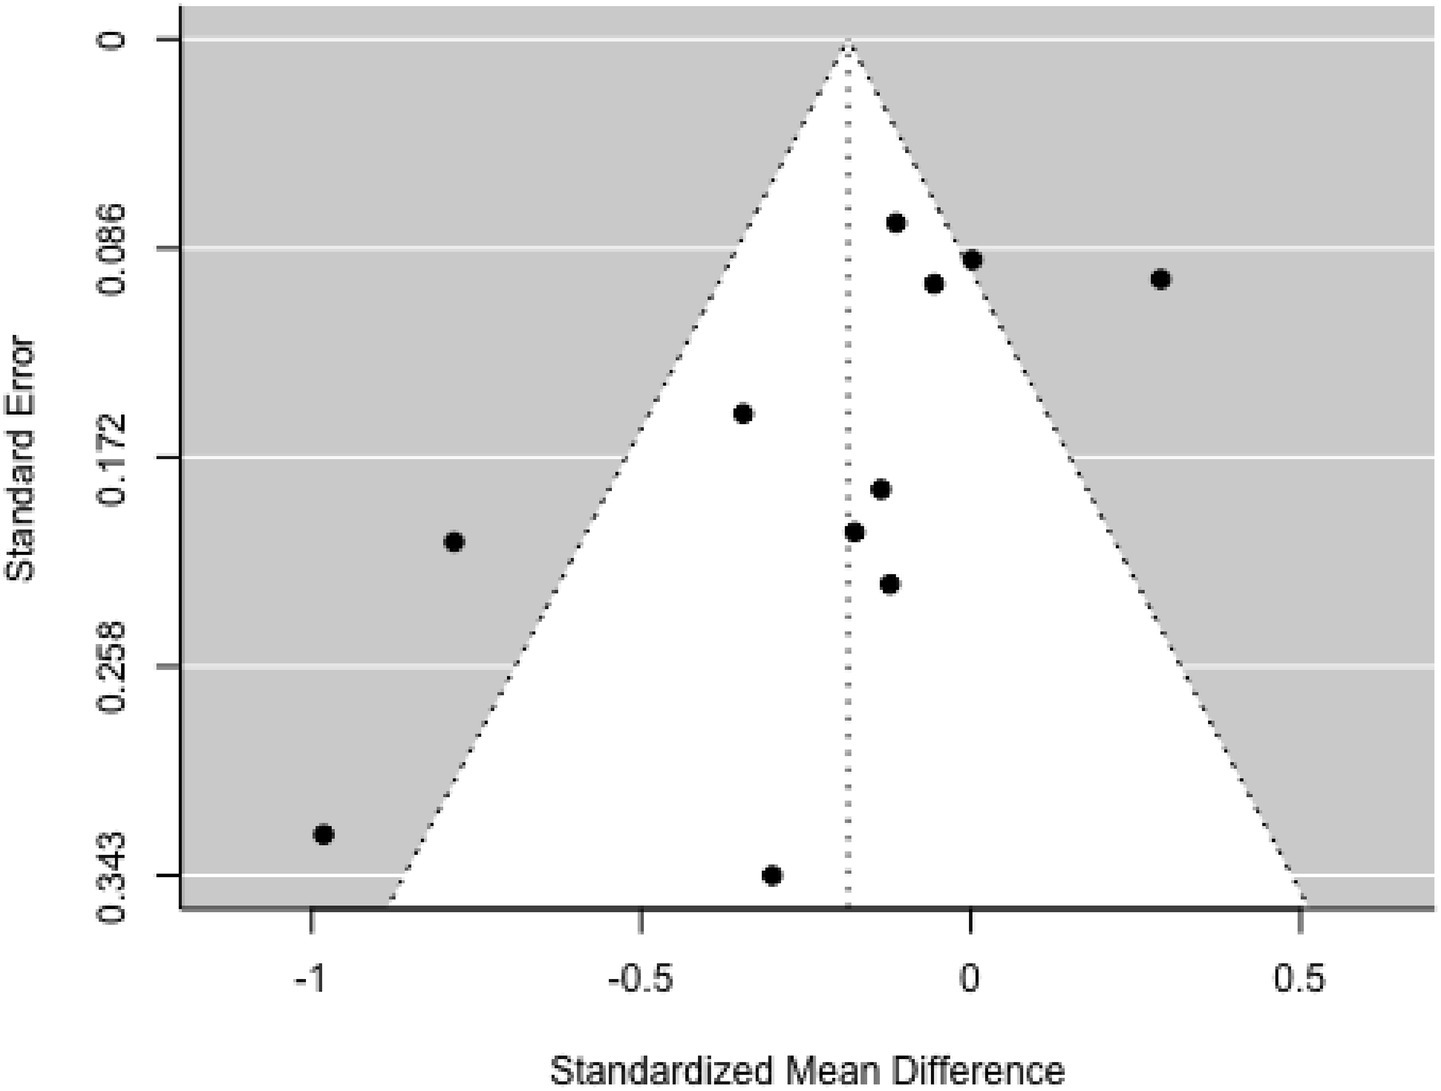
Figure 13. Funnel plot.
4 Discussion
The results of this meta-analysis indicate that physical activity interventions significantly reduce BMI in preschool and school-age children, with similar effect sizes in both age groups. However, effects on other anthropometric indicators (WC, ST, BMI z-score) and physiological parameters (DBP, SBP) tended to be small and mostly not statistically significant. This finding is consistent with previous research (9), which reported a reduction in BMI but found no significant changes in children’s blood pressure.
The reduction in BMI can be explained by biological mechanisms involved in physical activity, such as increased energy expenditure, fat oxidation, and decreased lipogenesis through activation of the AMP-activated protein kinase (AMPK) pathway (54). The largest reductions were observed in three preschool studies (29, 41, 47) and one school-based study (48), all involving obese children. Furthermore, physical activity plays a role in reducing visceral fat and modulating the anti- inflammatory environment by increasing anti-inflammatory interleukins (IL-1ra, IL-6, IL-10), which contribute to improved metabolic profiles.
The benefits of physical activity interventions observed in this study are consistent with those reported in previous research on children and adolescents (55, 56). While the overall impact of these interventions may appear modest, especially given the continued global rise in BMI over the past three decades (“WHO. Childhood overweight and obesity,” 2017), subgroup analysis revealed more noticeable differences in BMI reduction among school-aged children (6–12 years) compared to preschoolers (1–5.99 years). However, this difference was not statistically significant. Moderate changes were also observed in BMI z-score, WC, and ST, though these changes did not reach statistical significance.
Contrasting results have been reported in other studies. Fitzgibbon et al. (29) found significant changes in BMI z-score, while Bocca et al. (25) and Tan et al. (57) observed substantial reductions in WC in preschool-aged children. Similarly, Sacher et al. (44) reported marked improvements in WC, and Tan et al. (48) identified significant changes in ST among school-aged children. These findings align with results from a recent systematic review (9). Furthermore, a longitudinal study found that vigorous physical activity in early childhood is associated with lasting benefits for body composition and physical fitness (58).
The minimal effects on WC, ST, and blood pressure are likely influenced by several factors. First, the majority of participants had normal blood pressure at baseline, limiting the scope for improvement. Second, many interventions were short-term (<12 weeks), even though cardiovascular adaptations require longer time. Third, most studies did not control for other lifestyle factors such as diet and sleep duration, potentially confounding the true effects of physical exercise.
These findings also indicate that program duration and intensity play a significant role. Studies with durations of ≥24 weeks tended to show greater improvements in cardiovascular parameters than shorter programs. For example, Ketelhut et al. (33) reported a significant reduction in DBP after a 96-week program, while a 5-week program (36) showed limited changes.
From a policy perspective, these results underscore the importance of integrating structured physical activity into school curricula and preschool programs. Physical activities that combine aerobic exercise, gross motor skills, and play elements can increase children’s participation while providing long-term health benefits.
However, several limitations of this study should be noted. The high heterogeneity in some analyses (e.g., BMI z-scores with I2 > 90%) indicates significant variation between studies, both in program design and participant characteristics. Furthermore, most studies were from high- income countries, so generalization to developing country populations should be approached with caution. Underreporting of exercise intensity and the absence of dietary control also limit the interpretation of the results.
5 Conclusion
This meta-analysis provides strong evidence that physical activity interventions are effective in reducing BMI in preschool and school-age children, with no significant differences between the two age groups. However, the effects on waist circumference, skinfold thickness, BMI z-score, and blood pressure were relatively small and non-significant.
To maximize health benefits, physical activity programs should be structured, long-term, and moderate to high-intensity, and combined with other lifestyle interventions such as nutrition education. Future research should expand coverage to low- and middle-income countries, report exercise intensity in detail, and control for lifestyle factors that may influence outcomes.
Implementing policies mandating daily physical activity in schools and preschools could be a strategic step in preventing obesity and improving children’s overall health.
Data availability statement
The data analyzed in this study is subject to the following licenses/restrictions: If the journal ask the dataset, we will give it. Requests to access these datasets should be directed to Nina Wang, d3Fsd25uQGdtYWlsLmNvbQ==.
Author contributions
NW: Conceptualization, Project administration, Supervision, Writing – original draft. QW: Conceptualization, Methodology, Project administration, Supervision, Writing – review & editing. MW: Data curation, Formal analysis, Methodology, Software, Writing – review & editing. MA: Conceptualization, Supervision, Writing – review & editing.
Funding
The author(s) declare that no financial support was received for the research and/or publication of this article.
Conflict of interest
The authors declare that the research was conducted in the absence of any commercial or financial relationships that could be construed as a potential conflict of interest.
Generative AI statement
The authors declare that no Gen AI was used in the creation of this manuscript.
Any alternative text (alt text) provided alongside figures in this article has been generated by Frontiers with the support of artificial intelligence and reasonable efforts have been made to ensure accuracy, including review by the authors wherever possible. If you identify any issues, please contact us.
Publisher’s note
All claims expressed in this article are solely those of the authors and do not necessarily represent those of their affiliated organizations, or those of the publisher, the editors and the reviewers. Any product that may be evaluated in this article, or claim that may be made by its manufacturer, is not guaranteed or endorsed by the publisher.
References
2. Burdette, AM , Needham, BL , Taylor, MG , and Hill, TD . Health lifestyles in adolescence and self-rated health into adulthood. J Health Soc Behav. (2017) 58:520–36. doi: 10.1177/0022146517735313
3. Telama, R , Yang, X , Leskinen, E , Kankaanpää, A , Hirvensalo, M , Tammelin, T, et al. Tracking of physical activity from early childhood through youth into adulthood. Med Sci Sports Exerc. (2014) 46:955–62. doi: 10.1249/MSS.0000000000000181
4. Gråstén, A , and Yli-Piipari, S . The patterns of moderate to vigorous physical activity and physical education enjoyment through a 2-year school-based program. J Sch Health. (2019) 89:88–98. doi: 10.1111/josh.12717
5. Hinkley, T , Crawford, D , Salmon, J , Okely, AD , and Hesketh, K . Preschool children and physical activity: a review of correlates. Am J Prev Med. (2008) 34:e437:435–41. doi: 10.1016/j.amepre.2008.02.001
6. Andrade Neto, F , Eto, FN , Pereira, TSS , Carletti, L , and Molina, M d CB . Active and sedentary behaviours in children aged 7 to 10 years old: the urban and rural contexts, Brazil. BMC Public Health. (2014) 14:1–10. doi: 10.1186/1471-2458-14-1174
7. Zhang, X , Liu, J , Ni, Y , Yi, C , Fang, Y , Ning, Q, et al. Global prevalence of overweight and obesity in children and adolescents: a systematic review and meta-analysis. JAMA Pediatr. (2024) 178:800–13. doi: 10.1001/jamapediatrics.2024.1576
8. Carson, V , Lee, E-Y , Hewitt, L , Jennings, C , Hunter, S , Kuzik, N, et al. Systematic review of the relationships between physical activity and health indicators in the early years (0-4 years). BMC Public Health. (2017) 17:33–63. doi: 10.1186/s12889-017-4860-0
9. García-Hermoso, A , Alonso-Martinez, AM , Ramírez-Vélez, R , and Izquierdo, M . Effects of exercise intervention on health-related physical fitness and blood pressure in preschool children: a systematic review and meta-analysis of randomized controlled trials. Sports Med. (2020) 50:187–203. doi: 10.1007/s40279-019-01191-w
10. Sneck, S , Viholainen, H , Syväoja, H , Kankaapää, A , Hakonen, H , Poikkeus, A-M, et al. Effects of school-based physical activity on mathematics performance in children: a systematic review. Int J Behav Nutr Phys Act. (2019) 16:109–15. doi: 10.1186/s12966-019-0866-6
11. Timmons, BW , LeBlanc, AG , Carson, V , Connor Gorber, S , Dillman, C , Janssen, I, et al. Systematic review of physical activity and health in the early years (aged 0–4 years). Appl Physiol Nutr Metab. (2012) 37:773–92. doi: 10.1139/h2012-070
12. Liberati, A , Altman, DG , Tetzlaff, J , Mulrow, C , Gøtzsche, PC , Ioannidis, JP, et al. The PRISMA statement for reporting systematic reviews and meta-analyses of studies that evaluate health care interventions: explanation and elaboration. Ann Intern Med. (2009) 151:W-65–94. doi: 10.1136/bmj.b2700
13. Maher, CG , Sherrington, C , Herbert, RD , Moseley, AM , and Elkins, M . Reliability of the PEDro scale for rating quality of randomized controlled trials. Phys Ther. (2003) 83:713–21. doi: 10.1093/ptj/83.8.713
14. Viechtbauer, W . Bias and efficiency of meta-analytic variance estimators in the random-effects model. J Educ Behav Stat. (2005) 30:261–93. doi: 10.3102/10769986030003261
15. Cochran, WG . The combination of estimates from different experiments. Biometrics. (1954) 10:101–29. doi: 10.2307/3001666
16. Higgins, JP , and Thompson, SG . Quantifying heterogeneity in a meta-analysis. Stat Med. (2002) 21:1539–58. doi: 10.1002/sim.1186
17. Riley, RD , Higgins, JP , and Deeks, JJ . Interpretation of random effects meta-analyses. BMJ. (2011) 342:d549–9. doi: 10.1136/bmj.d549
18. Viechtbauer, W , and Cheung, MWL . Outlier and influence diagnostics for meta-analysis. Res Synth Methods. (2010) 1:112–25. doi: 10.1002/jrsm.11
19. Begg, CB , and Mazumdar, M . Operating characteristics of a rank correlation test for publication bias. Biometrics. (1994) 50:1088. doi: 10.2307/2533446
20. Sterne, JA , and Egger, M . Regression methods to detect publication and other bias in mete-analysis Chichester, Chichester, West Sussex, England, John Wiley & Sons Ltd (2005). 99–110.
21. Viechtbauer, W . Conducting meta-analyses in R with the metafor package. J Stat Softw. (2010) 36:1–48. doi: 10.18637/jss.v036.i03
22. Aguilar-Cordero, MJ , Rodríguez-Blanque, R , Leon-Ríos, X , Expósito Ruiz, M , García García, I , and Sánchez-López, AM . Influence of physical activity on blood pressure in children with overweight/obesity: a randomized clinical trial. Am J Hypertens. (2020) 33:131–6. doi: 10.1093/ajh/hpz174
23. Annesi, JJ , Smith, AE , and Tennant, GA . Effects of a cognitive–behaviorally based physical activity treatment for 4-and 5-year-old children attending US preschools. Int J Behav Med. (2013) 20:562–6. doi: 10.1007/s12529-013-9361-7
24. Bellows, LL , Davies, PL , Anderson, J , and Kennedy, C . Effectiveness of a physical activity intervention for head start preschoolers: a randomized intervention study. Am J Occup Ther. (2013) 67:28–36. doi: 10.5014/ajot.2013.005777
25. Bocca, G , Corpeleijn, E , Stolk, RP , and Sauer, PJ . Results of a multidisciplinary treatment program in 3-year-old to 5-year-old overweight or obese children: a randomized controlled clinical trial. Arch Pediatr Adolesc Med. (2012) 166:1109–15. doi: 10.1001/archpediatrics.2012.1638
26. Brasil, I , Monteiro, W , Lima, T , Seabra, A , and Farinatti, P . Effects of judo training upon body composition, autonomic function, and cardiorespiratory fitness in overweight or obese children aged 8-to 13 years. J Sports Sci. (2020) 38:2508–16. doi: 10.1080/02640414.2020.1792189
27. Donath, L , Faude, O , Hagmann, S , Roth, R , and Zahner, L . Fundamental movement skills in preschoolers: a randomized controlled trial targeting object control proficiency. Child Care Health Dev. (2015) 41:1179–87. doi: 10.1111/cch.12232
28. Espinoza Silva, JM , Latorre Román, PÁ , Cabrera Linares, JC , Párraga Montilla, JA , and Martínez Salazar, C . Effects of a high intensity interval training (HIIT) program on anthropomorphic and cardiometabolic variables in school children with overweight and obesity. Children. (2023) 10:317. doi: 10.3390/children10020317
29. Fitzgibbon, ML , Stolley, MR , Schiffer, L , Kong, A , Braunschweig, CL , Gomez-Perez, SL, et al. Family-based hip-hop to health: outcome results. Obesity. (2013) 21:274–83. doi: 10.1002/oby.20269
30. Genitsaridi, S-M , Giannios, C , Karampatsou, S , Papageorgiou, I , Papadopoulos, G , Farakla, I, et al. A comprehensive multidisciplinary management plan is effective in reducing the prevalence of overweight and obesity in childhood and adolescence. Horm Res Paediatr. (2020) 93:94–107. doi: 10.1159/000507760
31. Hacke, C , Ketelhut, S , Wendt, U , Müller, G , Schlesner, C , and Ketelhut, K . Effectiveness of a physical activity intervention in preschoolers: a cluster-randomized controlled trial. Scand J Med Sci Sports. (2019) 29:742–52. doi: 10.1111/sms.13390
32. Jones, RA , Riethmuller, A , Hesketh, K , Trezise, J , Batterham, M , and Okely, AD . Promoting fundamental movement skill development and physical activity in early childhood settings: a cluster randomized controlled trial. Pediatr Exerc Sci. (2011) 23:600–15. doi: 10.1123/pes.23.4.600
33. Ketelhut, K , Mohasseb, I , and Ketelhut, RG . Two years of regular exercise decreases blood pressure and improves motor skills in early childhood. Sport Sci Health. (2018) 14:571–8. doi: 10.1007/s11332-018-0463-0
34. Ketelhut, S , Ketelhut, SR , and Ketelhut, K . School-based exercise intervention improves blood pressure and parameters of arterial stiffness in children: a randomized controlled trial. Pediatr Exerc Sci. (2020) 33:1–7. doi: 10.1123/pes.2020-0053
35. Latorre-Román, P , Mora-López, D , and García-Pinillos, F . Effects of a physical activity programme in the school setting on physical fitness in preschool children. Child Care Health Dev. (2018) 44:427–32. doi: 10.1111/cch.12550
36. Lima, RA , Andersen, LB , Soares, FC , and Kriemler, S . The causal pathway effects of a physical activity intervention on adiposity in children: the KISS study cluster randomized clinical trial. Scand J Med Sci Sports. (2020) 30:1685–91. doi: 10.1111/sms.13741
37. Mannarino, S , Santacesaria, S , Raso, I , Garbin, M , Pipolo, A , Ghiglia, S, et al. Benefits in cardiac function from a remote exercise program in children with obesity. Int J Environ Res Public Health. (2023) 20:1544. doi: 10.3390/ijerph20021544
38. Martínez-Vizcaíno, V , Pozuelo-Carrascosa, DP , García-Prieto, JC , Cavero-Redondo, I , Solera-Martínez, M , Garrido-Miguel, M, et al. Effectiveness of a school-based physical activity intervention on adiposity, fitness and blood pressure: MOVI-KIDS study. Br J Sports Med. (2020) 54:279–85. doi: 10.1136/bjsports-2018-099655
39. Migueles, JH , Cadenas-Sanchez, C , Lubans, DR , Henriksson, P , Torres-Lopez, LV , Rodriguez-Ayllon, M, et al. Effects of an exercise program on cardiometabolic and mental health in children with overweight or obesity: a secondary analysis of a randomized clinical trial. JAMA Netw Open. (2023) 6:e2324839–9. doi: 10.1001/jamanetworkopen.2023.24839
40. Nambi, G , Alghadier, M , Elnegamy, TE , Basuodan, RM , Alwhaibi, RM , Vellaiyan, A, et al. Clinical (BMI and MRI) and biochemical (adiponectin, leptin, TNF-α, and IL-6) effects of high-intensity aerobic training with high-protein diet in children with obesity following COVID-19 infection. Int J Environ Res Public Health. (2022) 19:7194. doi: 10.3390/ijerph19127194
41. Nemet, D , Geva, D , and Eliakim, A . Health promotion intervention in low socioeconomic kindergarten children. J Pediatr. (2011) 158:e791:796–801. doi: 10.1016/j.jpeds.2010.10.040
42. Puder, JJ , Marques-Vidal, P , Schindler, C , Zahner, L , Niederer, I , Bürgi, F, et al. Effect of multidimensional lifestyle intervention on fitness and adiposity in predominantly migrant preschool children (Ballabeina): cluster randomised controlled trial. BMJ. (2011) 343:d6195. doi: 10.1136/bmj.d6195
43. Roth, K , Kriemler, S , Lehmacher, W , Ruf, KC , Graf, C , and Hebestreit, H . Effects of a physical activity intervention in preschool children. Med Sci Sports Exerc. (2015) 47:2542–51. doi: 10.1249/MSS.0000000000000703
44. Sacher, PM , Kolotourou, M , Chadwick, PM , Cole, TJ , Lawson, MS , Lucas, A, et al. Randomized controlled trial of the MEND program: a family-based community intervention for childhood obesity. Obesity. (2010) 18:S62–8. doi: 10.1038/oby.2009.433
45. Serra-Paya, N , Ensenyat, A , Castro-Vinuales, I , Real, J , Sinfreu-Bergues, X , Zapata, A, et al. Effectiveness of a multi-component intervention for overweight and obese children (Nereu program): a randomized controlled trial. PLoS One. (2015) 10:e0144502. doi: 10.1371/journal.pone.0144502
46. Stavnsbo, M , Aadland, E , Anderssen, SA , Chinapaw, M , Steene-Johannessen, J , Andersen, LB, et al. Effects of the active smarter Kids (ASK) physical activity intervention on cardiometabolic risk factors in children: a cluster-randomized controlled trial. Prev Med. (2020) 130:105868. doi: 10.1016/j.ypmed.2019.105868
47. Tan, S , Chen, C , Sui, M , Xue, L , and Wang, J . Exercise training improved body composition, cardiovascular function, and physical fitness of 5-year-old children with obesity or normal body mass. Pediatr Exerc Sci. (2017) 29:245–53. doi: 10.1123/pes.2016-0107
48. Tan, S , Yang, C , and Wang, J . Physical training of 9-to 10-year-old children with obesity to lactate threshold intensity. Pediatr Exerc Sci. (2010) 22:477–85. doi: 10.1123/pes.22.3.477
49. van Leeuwen, J , Andrinopoulou, E-R , Hamoen, M , Paulis, WD , van Teeffelen, J , Kornelisse, K, et al. The effect of a multidisciplinary intervention program for overweight and obese children on cardiorespiratory fitness and blood pressure. Fam Pract. (2019) 36:147–53. doi: 10.1093/fampra/cmy061
50. Vandoni, M , Carnevale Pellino, V , Gatti, A , Lucini, D , Mannarino, S , Larizza, C, et al. Effects of an online supervised exercise training in children with obesity during the COVID-19 pandemic. Int J Environ Res Public Health. (2022) 19:9421. doi: 10.3390/ijerph19159421
51. Williams, CF , Bustamante, EE , Waller, JL , and Davis, CL . Exercise effects on quality of life, mood, and self-worth in overweight children: the SMART randomized controlled trial. Transl Behav Med. (2019) 9:451–9. doi: 10.1093/tbm/ibz015
52. Zask, A , Adams, JK , Brooks, LO , and Hughes, DF . Tooty fruity vegie: an obesity prevention intervention evaluation in Australian preschools. Health Promot J Austr. (2012) 23:10–5. doi: 10.1071/HE12010
53. Page, MJ , McKenzie, JE , Bossuyt, PM , Boutron, I , Hoffmann, TC , Mulrow, CD, et al. The PRISMA 2020 statement: an updated guideline for reporting systematic reviews. Int J Surg. (2021) 88:105906. doi: 10.1136/bmj.n71
54. Lavoie, J-M , and Gauthier, M-S . Regulation of fat metabolism in the liver: link to non-alcoholic hepatic steatosis and impact of physical exercise. Cell Mol Life Sci. (2006) 63:1393–409. doi: 10.1007/s00018-006-6600-y
55. Wang, Y , Cai, L , Wu, Y , Wilson, R , Weston, C , Fawole, O, et al. What childhood obesity prevention programmes work? A systematic review and meta-analysis. Obes Rev. (2015) 16:547–65. doi: 10.1111/obr.12277
56. Waters, E , de Silva-Sanigorski, A , Burford, BJ , Brown, T , Campbell, KJ , Gao, Y, et al. Interventions for preventing obesity in children. Cochrane Database Syst Rev. (2011) 12:32–34. doi: 10.1002/14651858.CD001871.pub3
57. WHO . Childhood overweight and obesity. (2017). Available online at: https://www.who.int/dietphysicalactivity/childhood/en/ (Accessed March 31, 2019)
Keywords: preschool, school-based, children, obesity, exercise, meta-analysis
Citation: Wang N, Wang Q, Wang M and Abdul Rahman MNB (2025) Effect of physical activity on anthropometric and physiological parameters in preschool and school-aged children: a systematic review and meta-analysis of randomized controlled trials. Front. Public Health. 13:1592098. doi: 10.3389/fpubh.2025.1592098
Edited by:
Luís Branquinho, Polytechnic Institute of Portalegre, PortugalReviewed by:
Yean Chun Loh, University of Science Malaysia (USM), MalaysiaSuryanto Suryanto, Airlangga University, Indonesia
Oki Candra, Islamic University of Riau, Indonesia
Copyright © 2025 Wang, Wang, Wang and Abdul Rahman. This is an open-access article distributed under the terms of the Creative Commons Attribution License (CC BY). The use, distribution or reproduction in other forums is permitted, provided the original author(s) and the copyright owner(s) are credited and that the original publication in this journal is cited, in accordance with accepted academic practice. No use, distribution or reproduction is permitted which does not comply with these terms.
*Correspondence: Qinglei Wang, cWluZ2xlaXdhbmdAMTYzLmNvbQ==
†These authors have contributed equally to this work