 Gabriela Vatavuk-Serrati
 Katie A. Meyer
 Donna R. Miles2
 Lindsey Smith Taillie
- 1Department of Nutrition, Gillings School of Global Public Health, University of North Carolina at Chapel Hill, Chapel Hill, NC, United States
- 2Carolina Population Center, University of North Carolina at Chapel Hill, Chapel Hill, NC, United States
- 3Nutrition Research Institute, University of North Carolina at Chapel Hill, Kannapolis, NC, United States
Background: Ultra-processed foods (UPFs) are an increasing global health concern, but their prevalence across the food supply is unknown. This is particularly important in developing countries such as Latin America, where consumption is lower but increasing. We quantified country-specific metrics of UPFs in the food supply across the Americas, including the prevalence of UPFs, the presence and number of additives, and the extent to which UPFs and non-UPFs are high in saturated fat, sugar, and sodium (HFSS).
Methods: Using data on packaged products launched between 2018 and 2023 from the Mintel Global New Products Database in 11 North and Latin American countries (n = 207,363 products), we identified the presence of ultra-processing markers, such as additives, in foods and beverages’ ingredient lists. We compared the prevalence of UPFs and food additives in each country to the U.S. and the mean number of additives by additive class and country. The prevalence of HFSS for ultra-processed and non-ultra-processed packaged foods and beverages was estimated in a subsample (n = 123,072) based on the Chilean nutrient profile model.
Results: The prevalence of UPFs ranged from 69 in Venezuela to 85% in Costa Rica. Flavors and other additives were the most prevalent, ranging from 60 to 78% and 49 to 70% in Venezuela and Costa Rica, respectively. The mean number of additives ranged from 3.9 in Venezuela to 7.1 in Peru. For foods, but not beverages, a higher percentage of ultra-processed products were HFSS compared to non-ultra-processed products.
Conclusion: The prevalence of UPFs among newly launched products is high across all countries in the Americas. Policies are needed to create healthier food supplies in the region.
1 Introduction
In recent years, public health organizations have paid close attention to ultra-processed foods (UPFs), which are industrially produced foods that contain additives and typically have high energy density and are high in saturated fats, sugar, and sodium (HFSS) (1, 2). Numerous studies have shown that consumption of UPFs is linked to increased obesity and associated health outcomes worldwide (3–15). Apart from the low-quality nutrient profile of UPFs (high in added sugars, unhealthy fats, and energy), it has been shown that ultra-processed diets are associated with the replacement of healthy dietary components, such as fiber and micronutrients (16–19). Further, some evidence suggests that UPFs are ultra-palatable and generate a reward stimulus, which has been likened to an addiction (20, 21).
Despite these health concerns, UPFs are increasingly prevalent around the globe, accounting for up to almost 60% of the average per capita daily energy intake in high-income countries (4, 5, 22–24), with rapid increases in many low- and middle-income countries (25, 26). However, significant differences remain between countries in terms of consumption, even among countries in more advanced stages of the nutrition transition. For example, recent estimates in the U.S. suggest that between 57 and 67% of total calories come from UPFs, compared to around 30% in Brazil, Chile, and Mexico (3, 27–32).
A major unresolved question relates to the prevalence of UPFs in the packaged food supply, which accounts for a sizeable proportion of diets. Understanding this is important for several reasons. First, given the flow of migrants from one country to another, understanding the prevalence of UPFs in the packaged food supply can help provide context on how individuals may be differentially exposed to UPFs over time (33–43). Second, an increasing number of countries in Latin America have implemented policies to reduce the consumption of foods HFSS. Although UPFs and HFSS are different constructs, there is a high degree of overlap between them, making it useful to understand whether countries with HFSS policies have a lower proportion of UPFs in their food supply. Lastly, alongside concerns about UPFs in general, there have been growing concerns about specific additives, including non-nutritive sweeteners (NNS), colorings, flavorings, and emulsifiers or preservatives, and their association with cancer, metabolic disturbances, and cognitive and gut issues. Despite these concerns regarding UPFs, to our knowledge, no studies have characterized the food supply in Latin American countries in terms of the prevalence of UPFs, HFSS, or additives.
To address this critical gap in the field, we leveraged a unique data resource to generate estimates of the: (1) prevalence of UPFs in the food supply of 11 countries in Latin and North America (United States, Argentina, Brazil, Chile, Colombia, Costa Rica, Ecuador, Mexico, Peru, Puerto Rico, and Venezuela) between 2018 and 2023; (2) prevalence, and average number, of additives, which include preservatives, colorants, flavor enhancers, and non-nutritive sweeteners (NNS), in the packaged food supply in the U.S. compared to Latin American countries; and (3) prevalence of foods and beverages high in calories, sugar, sodium, or saturated fat in UPFs and non-UPFs, by country.
2 Materials and methods
2.1 Study design and dataset
Data were from the Mintel Global New Products Database (GNPD), an online database of newly launched consumer products in global markets (44, 45). This database has been widely used in various studies that investigate health claims and/or nutritional content in packaged products (46–53). This study includes data from the Nutrition Facts Label (NFL) of foods and beverages available in the United States and ten Latin American countries with available data for all 6 years (Argentina, Brazil, Chile, Colombia, Costa Rica, Ecuador, Mexico, Peru, Puerto Rico, and Venezuela) from 2018 to 2023. This period of data is likely to capture what is currently on the market while still providing a large enough sample size for analysis, while using older data would have been more likely to have included products that have been discontinued or reformulated. The definition of “newly launched” encompasses products that were introduced or that underwent changes in their formulation or packaging during the study period. Secret shoppers photograph the packaging and manually enter information about the product into the Mintel system.
The data used in this study are proprietary and available via an institutional contract with Mintel. The statistical code used to generate the results is available in the Open Science Framework at DOI 10.17605/OSF. IO/PC4FX. The present study includes data on 258,513 newly launched products. Product records were excluded if they were missing the ingredients list (n = 8,827), had duplicate barcodes (n = 34,650), or included products typically classified as culinary ingredients, such as sugar and sweeteners, oils, butter, and others, or alcoholic beverages (n = 7,673). Alcoholic beverages were excluded from the analyses due to differences in their regulation. For instance, alcoholic beverages in the U.S., like beer, wine, and spirits, are not required to list a full ingredient list or nutritional information on their labels (54). For duplicate records, the most recent version of the product was kept. The final sample comprised 167,190 foods and 40,173 beverages.
Foods were categorized into 15 groups (baby food; bakery products; breakfast cereals; candy, gum, and chocolate; cheese and yogurt; desserts and ice cream; fruits and vegetables; other dairy products; pasta, rice, and other starchy dishes; processed fish, meat, and egg products; ready-to-eat/heat foods; sauces and seasonings; savory spreads; snacks (savory and sweet); and sweet spreads), and beverages were categorized into eight groups (beverage mixes and concentrates; carbonated soft drinks; coffee, tea, and hot chocolate; juice and fruit drinks; milk, other dairy beverages, and plant-based alternatives; meal replacements and nutritional drinks; plain and flavored water; and sports and energy drinks). Supplementary Table 1 details the foods and beverages included in each group.
2.2 Classification of ultra-processed foods
To identify UPFs, we adapted an algorithmic approach used by Popkin et al. (55, 56). In general, this approach identifies a product as an UPFs if it contains at least one additive that is not typically used in culinary preparations, indicating that it was processed in a factory. Popkin et al. found that the presence of additives, particularly colors and flavors, in addition to the HFSS classification, identified 100% of foods that should be targeted for healthy eating policies. We applied this approach by assessing the presence of food additives commonly utilized in UPFs, using a list based on the Codex General Standard for Food Additives (GSFA) Online Database, published by the World Health Organization (WHO) and the Food and Agriculture Organization (FAO) (57). Additives were classified according to their function into five groups: (1) flavor enhancers, (2) color additives, (3) preservatives, (4) non-nutritive sweeteners (NNS) and sugar alcohols, and (5) other additives, which include thickeners and emulsifiers, among others.
Supplementary Table 2 provides the list of additives used as search terms by class. We searched each product’s ingredient list and created variables for the presence of additives and the number of additives from each class.
2.3 Classification of products high in energy and nutrients of concern
To classify products “high in,” we adopted nutrient thresholds established by the final phase of the Chilean Nutrient Profile Model (NPM). The NPM is a set of guidelines that classify foods and drinks as high in nutrients of concern or energy if they contain added sugar, sodium, or saturated fats (per the ingredients list) and exceed thresholds for the total amount of these nutrients or energy on a per 100 g or per 100 mL basis for solids and liquids, respectively. We note that when applying the Chilean NPM, some products were excluded because the NPM did not apply to them (e.g., products without the addition of sugar, salt, or saturated fats) or because information about energy, sugar, sodium, or saturated fat was not available.
We chose to adopt the Chilean NPM because data on the amount of added sugar were not available from the nutrition facts panel for all products in the GNPD. In contrast, the nutrient profile model proposed by the Pan American Health Organization (PAHO) defines thresholds based on free sugars, which include added sugars as well as sugars naturally present in honey, syrups, and fruit juices and concentrates (58). Supplementary Table 3 summarizes the criteria for the classification of foods and beverages as UPFs and high in nutrients of concern and energy.
2.4 Data analysis
Searches for additives in the ingredient lists were performed using the stringr package in R. Figures were also plotted using R (version 4.4.1, R Foundation for Statistical Computing, Vienna, Austria). Statistical analyses were performed using Stata (version 18, College Station, TX). Using logit regression, we estimated country-specific proportions of products: (1) classified as UPFs, (2) containing each class of food additives, and (3) foods high in energy and HFSS. In addition, we calculated the proportion of products identified as ultra-processed by food and beverage groups. We used a Poisson regression model to estimate country-specific mean counts of additives. All analyses were corrected for multiple comparisons using Bonferroni, and a p-value of <0.05 was considered statistically significant.
3 Results
The final sample included 207,363, of which 80.6% were foods and 19.4% were beverages. The U.S. had the most newly launched products in the period between 2018 and 2023, with 81,693 products (39.4%), followed by Brazil (42,435 products, 20.5%) and Mexico (25,169, 12.1%). The country with the least newly launched products was Venezuela, with 3,030 (1.5%).
Table 1 provides information about the number of newly launched products by country. Thus, Table 1 also lists the products for which analyses of foods and beverages “high in” were limited.

Table 1. Total sample size of foods and beverages, by country, and products for which the Chilean NPM was applied, Mintel, 2018–2023.
Figure 1 displays the percentage of newly launched products classified as ultra-processed by country, which ranged between 69 and 85% of the products in Venezuela and Costa Rica, respectively (Supplementary Table 4). Despite percentages being statistically different from the U.S., where the prevalence of UPFs was 81%, the magnitude of these differences was modest. An exception was Venezuela, where less than 70% of products were UPFs.
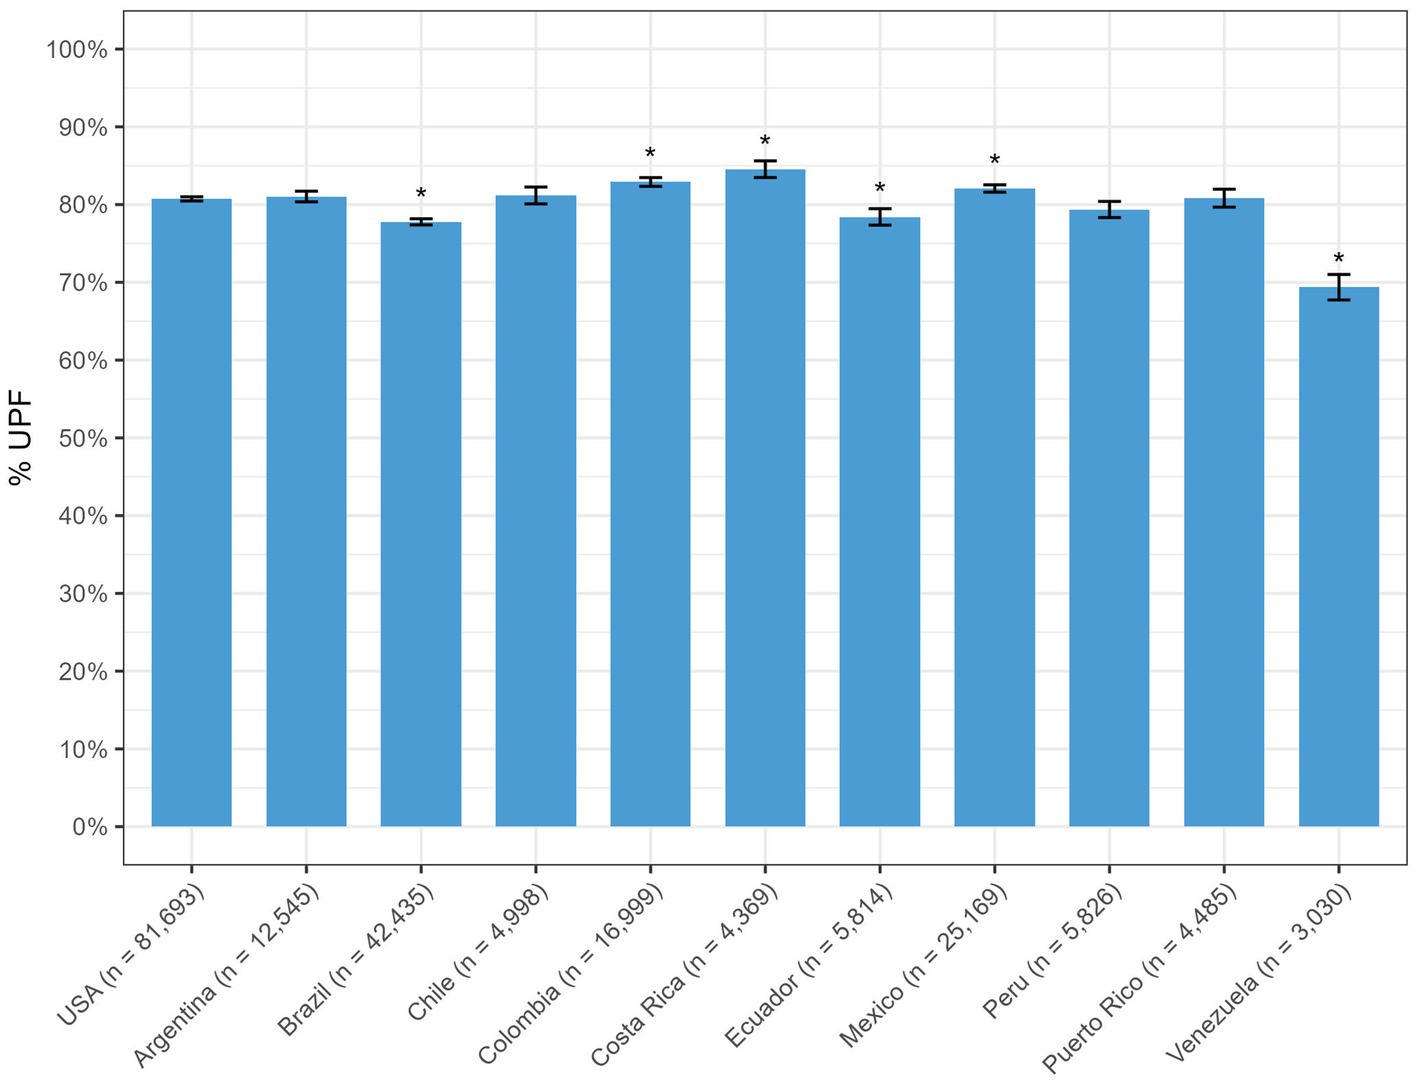
Figure 1. Percentage of ultra-processed foods, by country, across the U.S. and Latin America, Mintel, 2018–2023.
Overall, the percentage of beverages considered ultra-processed was slightly higher than the percentage of foods for all countries (Table 2; Supplementary Tables 5, 6). As expected, the fruits and vegetables group consistently had the lowest percentage of UPFs, ranging between 35% (Puerto Rico) and 64% (Peru). Similarly, between 25% (Venezuela) and 72% (Puerto Rico) of pasta, rice, and other starchy dishes were ultra-processed. On the other hand, candy, gum, chocolate, desserts, and ice cream had the highest prevalence of UPFs, ranging from 97% (Peru) and 99% (Chile and Colombia), and between 94% (Brazil and Ecuador) and 100% (Chile and Peru), respectively. Among beverages, ultra-processing was high for all categories, with more than 80% of beverages being UPFs across all countries. The highest percentage of UPFs observed for carbonated soft drinks and sports and energy drinks, in which almost 100% of products were UPFs.
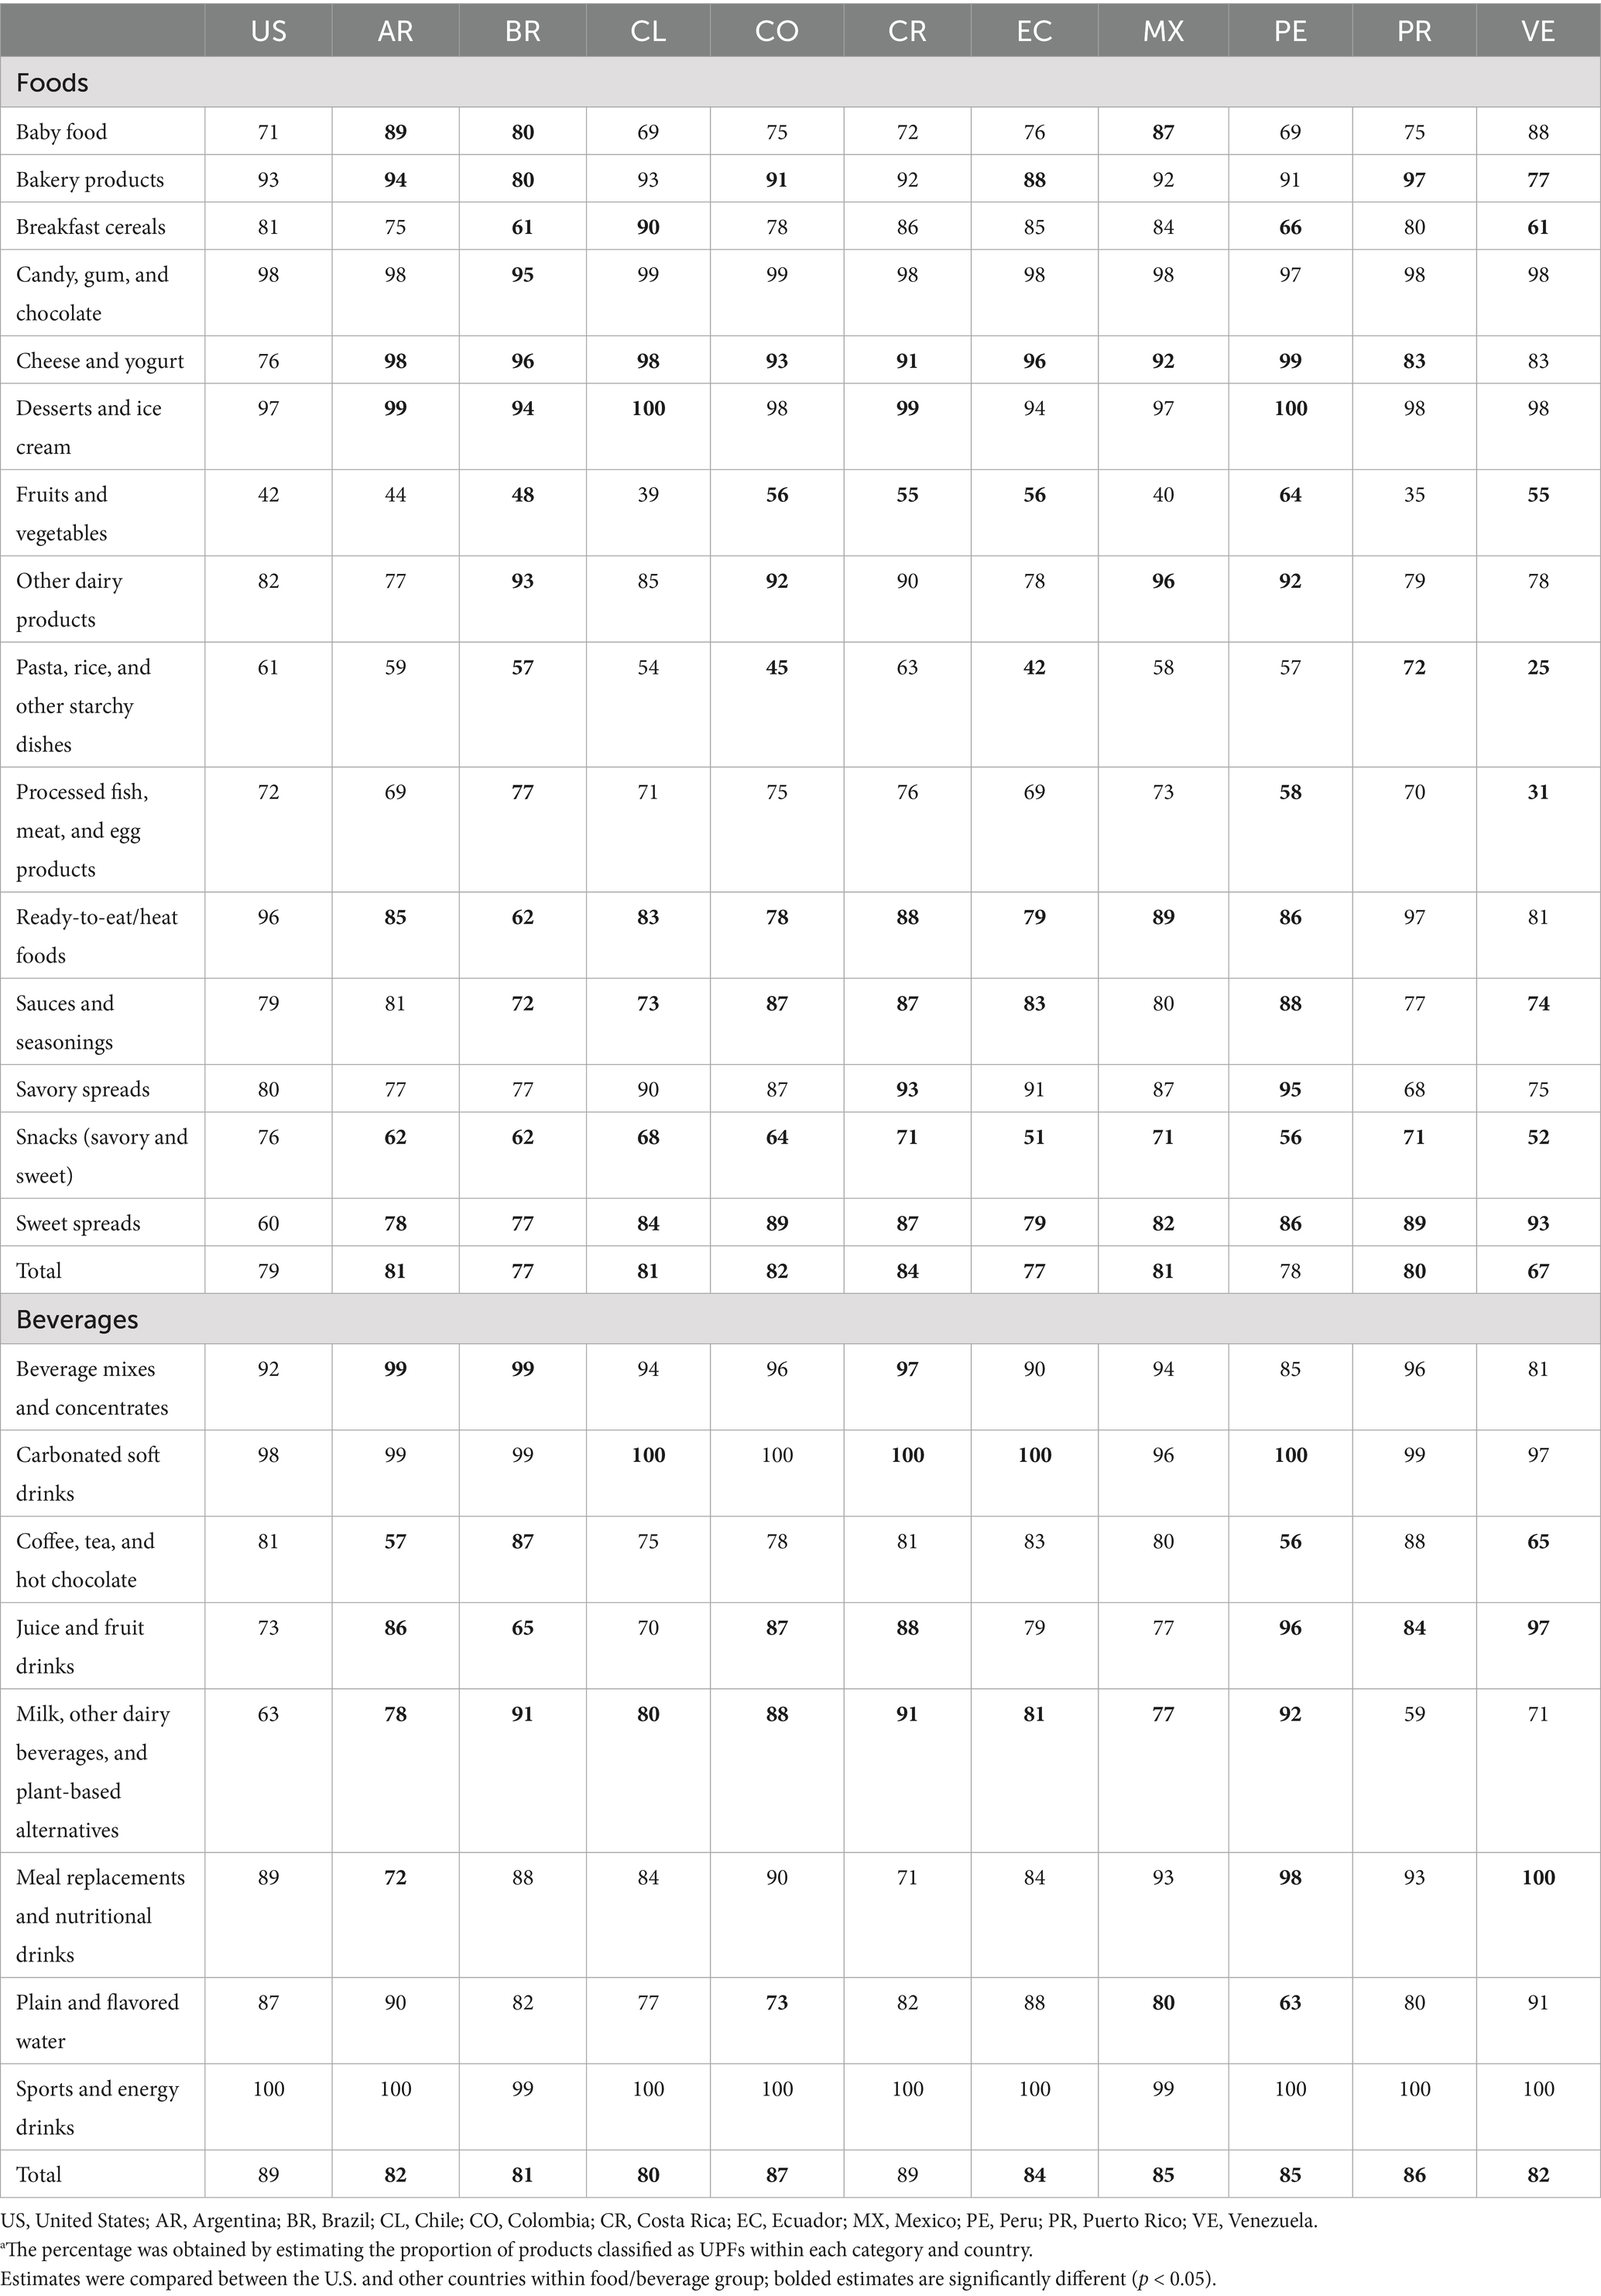
Table 2. Percentage (%)a of ultra-processed foods and beverages in the packaged food supply, by food categories, across the U.S. and Latin America, Mintel, 2018–2023.
We next examined the percentage of foods and beverages containing additives by country (Figure 2). Flavor additives were the most prevalent class in the food supply, ranging from 60% of all products in Venezuela to 78% in Costa Rica. The other additives (e.g., emulsifiers and thickeners) class was less prevalent, ranging from 49% of products in Venezuela to 70% in Costa Rica. The percentage of foods and beverages containing preservatives ranged from 50% (Venezuela) to 64% (Costa Rica). Between 23% (Venezuela) and 44% (Argentina, Mexico, and Puerto Rico) of products contained coloring. NNS were the least prevalent across all countries, ranging from 7% in Puerto Rico to 20% in Chile.

Figure 2. Proportion of foods and beverages containing additives across North and Latin America, by class and country, Mintel, 2018–2013.
Countries varied in terms of the mean number of additives among products (Table 3). Among products that contained additives, the mean number varied between 3.9 additives for Venezuela and 7.1 for Peru. Across all countries, Venezuela had the lowest means for all categories of additives except NNS. The highest means were observed for flavor additives, which ranged from 2.8 (Venezuela) to 4.8 (U.S.), and for other additives, ranging from 2.3 (Venezuela) to 4.0 (Peru).
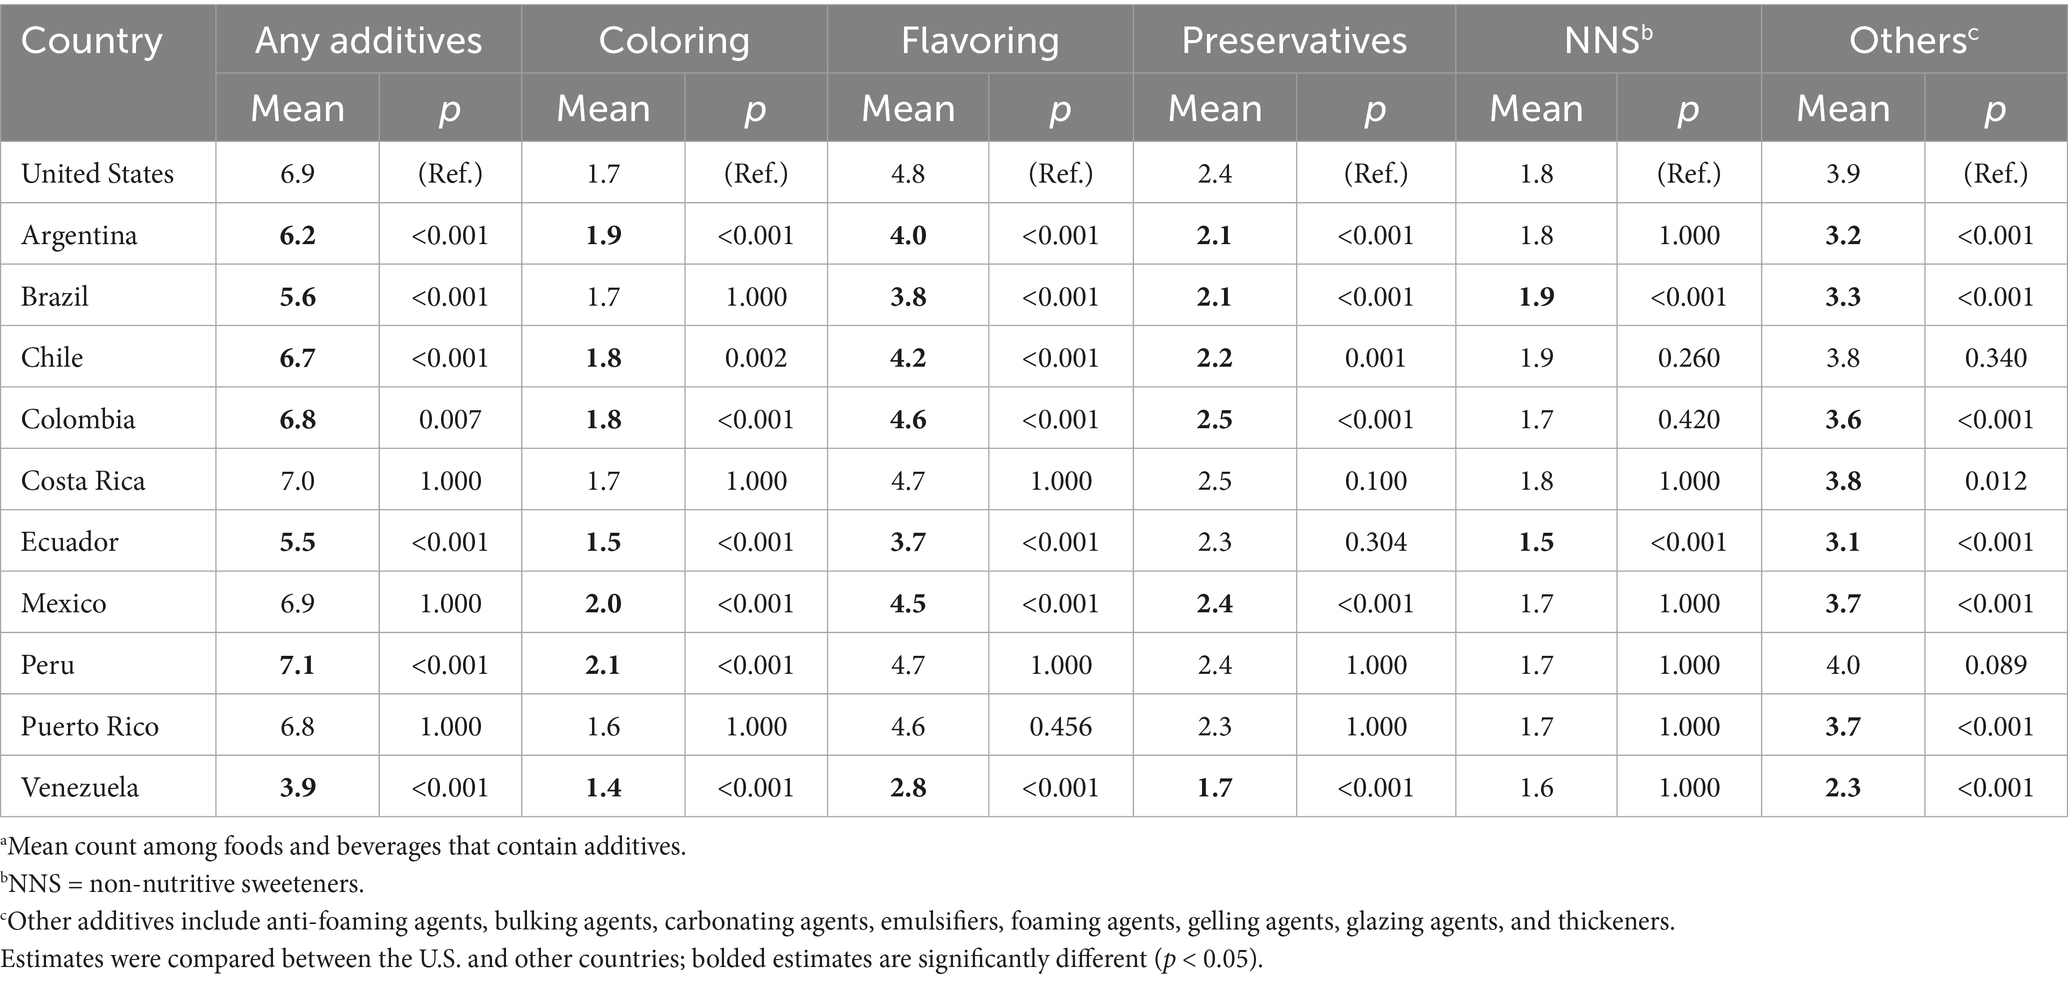
Table 3. Meana number of additives, by category, among products containing additives across North and Latin America, Mintel, 2018–2023.
We compared the country-specific percentage of foods “high in” for UPFs and non-UPFs (Figure 3; Supplementary Table 7). As expected, a large percentage of UPFs were considered high in energy, sugar, and saturated fats. Interestingly, non-UPFs products had a similar or higher prevalence of high sodium than UPFs in most countries, except Colombia, Ecuador, Peru, and Puerto Rico.
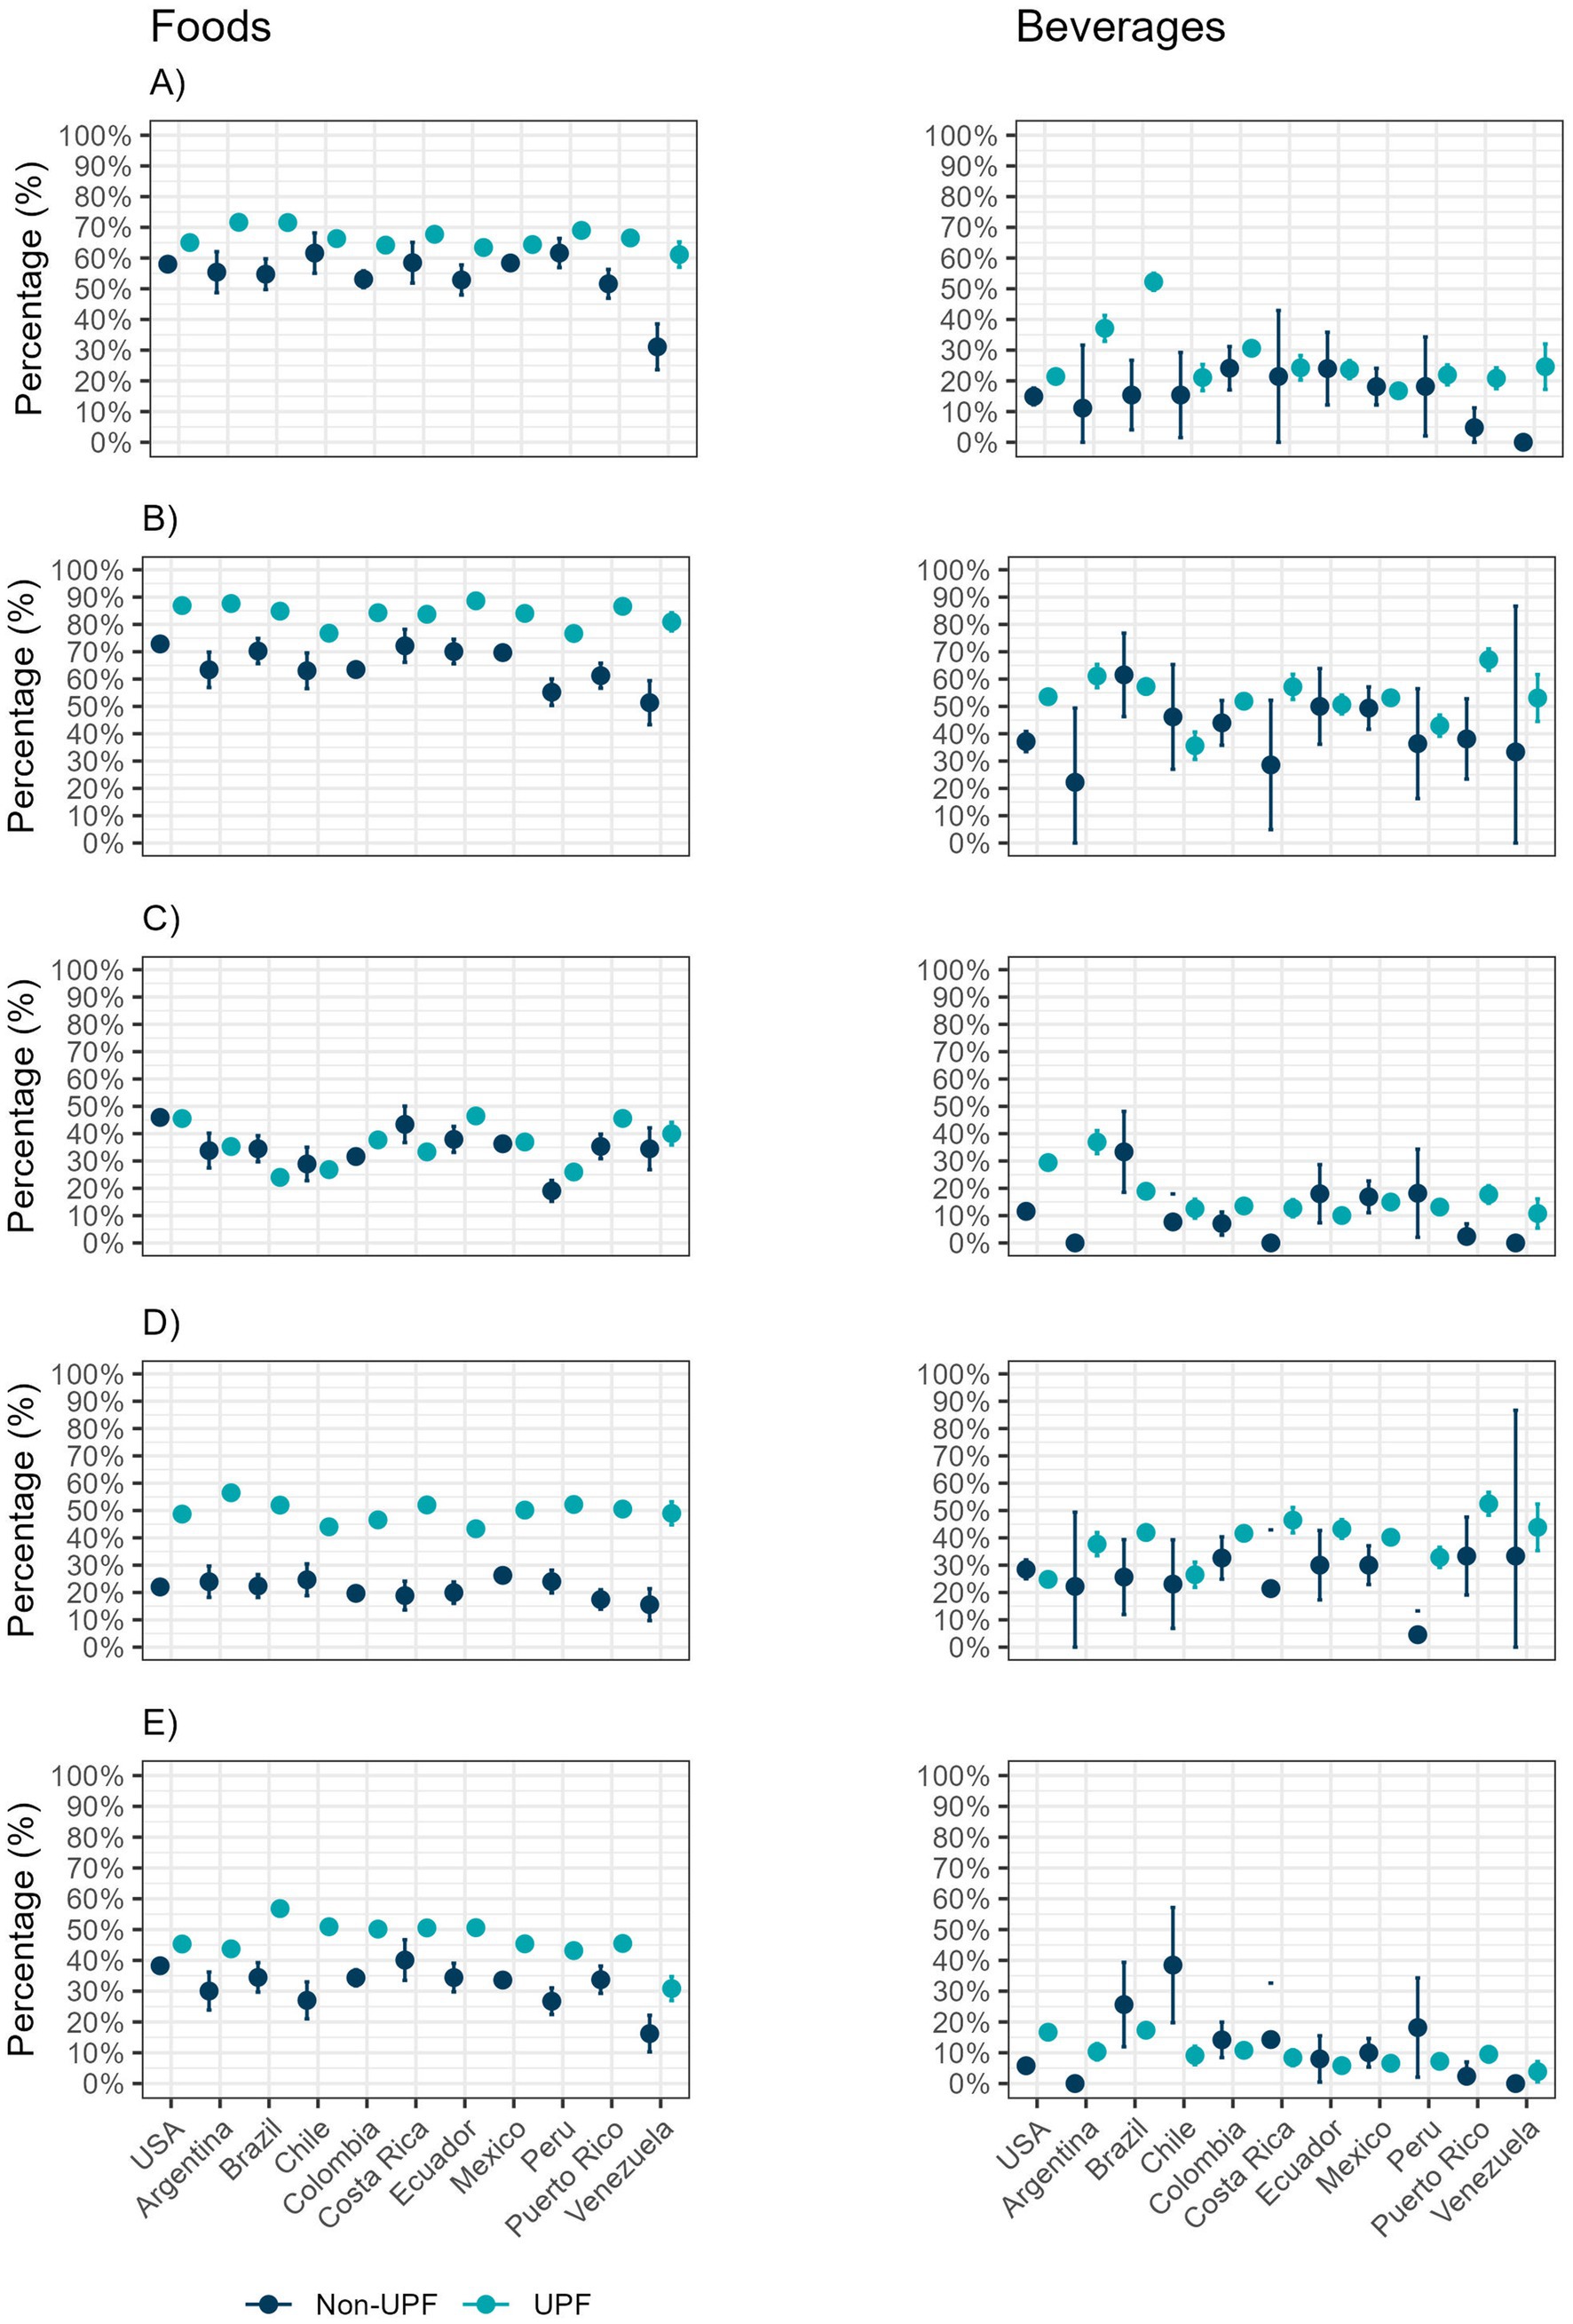
Figure 3. Proportion of foods and beverages “high in,” by country, 2018–2023. (A) High in energy; (B) High in any nutrient of concern; (C) High in sodium; (D) High in sugar; (E) High in saturated fat.
Overall, smaller percentages of beverages were “high in” than foods (22 to 67% of beverages vs. 51–89% for foods, Figure 3; Supplementary Table 8). In Venezuela, none of the newly launched, non-UPFs beverages were classified as high in energy, sodium, or saturated fats. A higher percentage of ultra-processed beverages, compared to non-ultra-processed (17–52% vs. 0–24%), was classified as high in energy, except in Ecuador and Mexico. In general, a larger percentage of UPFs beverages were high in sugar, except in the U.S. (25–52% vs. 5–33%), and high in sodium, except in Brazil, Ecuador, Mexico, and Peru, compared to non-UPFs beverages (11–37% vs. 0–33%). In most countries, a larger prevalence of non-UPFs beverages high in saturated fats was observed, compared to UPFs, except for the U.S., Argentina, Puerto Rico, and Venezuela (0–38% vs. 4–17%).
4 Discussion
In this study, the prevalence of newly launched products between 2018 and 2023 in the U.S. and Latin America that were considered ultra-processed was high across all countries, with 81% in the U.S. and ranging from 69% (Venezuela) to 85% (Costa Rica). However, it is important to note that the availability of packaged foods in those countries is still different. For instance, in the U.S., over 80,000 products were introduced or modified during that period, whereas in other countries with a smaller population, such as Chile, Costa Rica, Ecuador, Peru, Puerto Rico, and Venezuela, that number was much lower, ranging between 3,000 and 6,000. The prevalence of packaged and ultra-processed foods in the diet of these countries’ populations still varies, and a high prevalence of UPFs among newly launched products does not necessarily translate into a high percentage of consumption since intake so depends on the prevalence of UPFs in existing products as well as consumption of packaged and non-packaged foods in general. Still, given the association between UPFs and adverse health outcomes (14, 59–62), the overall high prevalence of UPFs among newly launched products across countries represents an important public health concern.
The prevalence of UPFs in soft drinks was high across all countries. This finding is expected, given that sodas and sports/energy drinks typically contain colors, flavors, or sweeteners. More unexpectedly, the proportion of UPFs in the category of plain and flavored waters was also relatively high across countries (63–91%), suggesting a high prevalence of flavored waters since bottled waters are not UPFs. This high rate may potentially reflect an artifact of the Mintel database, which generates new records every time a product is reformulated or re-marketed (e.g., changes packaging). Since bottled water cannot be reformulated and may be less subject to new marketing schemes, it may have fewer records in the database than flavored waters, which is a rapidly growing category. The global flavored water market size in 2022 was estimated to be US$16.6 bi and expected to grow to US$ 40.6 billion in 10 years (63).
Mirroring the high prevalence of UPFs, a high percentage of newly launched products contained additives, particularly flavoring (60–78%) and other additives (i.e., emulsifiers, thickeners, etc.; 49–70%). Among the additives, NNS was the category with the lowest prevalence (7–20%) for all countries. Overall, Venezuela was the country with the lowest mean number of additives across all categories except NNS, likely due to the ongoing political and economic scenario (64, 65). The total number of additives varied between 3.9 (Venezuela) and 7.1 (Peru). A study investigating additives in products purchased by U.S. households found that, between 2001 and 2019, the mean number of additives increased from 4.0 to 4.6, a lower average than what was observed among newly introduced products in the same market (56). In addition, the same study found that between 49.6 and 59.5% of products contained any additive, an estimate lower than what we observed (56). This might be due to the outcomes weighted by sales volume, while the current study only focuses on product availability in the market and not on purchases by consumers. Our results were in line with a study developed in Brazil, which concluded that almost 80% of the products contained at least one additive, with flavoring agents being the most commonly found (58.8%) (66). It is possible that that percentage was even higher, given the different classifications of additive classes adopted in the study. Another study investigating the presence of 64 most commonly used additives in the U.S. estimated that 64.9% of the foods contained at least one additive (67). In France, a study revealed that 53.8% of the food supply contained at least one additive (68).
The excess of nutrients of concern and energy is one of the top reasons UPFs have drawn the attention of public health organizations. In this study, UPFs were, in general, higher in nutrients of concern and energy than non-UPFs, supporting that view, especially among foods. However, it is important to note that, although beverages had, in general, a lower percentage of products high in energy, sugar, sodium, and saturated fats than foods, they had a higher prevalence of products considered UPFs. This is because beverages often contain flavoring and coloring but are rarely considered high in nutrients of concern other than sugar. In addition, diet beverages often contain NNS, which reduces their sugar content but increases the number of additives (69–71). This indicates that, although there is an overlap between nutrient content and the presence of markers of ultra-processing, which include additives, these two approaches are not the same. This is supported by Popkin et al., who concluded that the definition of foods and beverages HFSS did not encompass all products that should be targeted by policy as unhealthy, and that the best method to identify them is a combination between Nova and HFSS (55, 72).
This study has public health implications. We found an overall equally high prevalence of UPFs in the U.S. and Latin American countries. Studies have described the transformation of the food system in Latin America in the last decades, with increased participation of large retailers and multinational food industries (73–75). The increased availability of UPFs has contributed to dietary changes, including increased UPFs intake and, consequently, multiple negative health outcomes (76–78). However, it is still unclear whether this is due to the unique aspects of processing, which can lead to overconsumption or higher energy density and, hence, higher caloric intake (79). We also found a high prevalence of food additives. However, additive categories are broad classes representing a range of different substances with different biological impacts on the body. Although studies have demonstrated that additives are considered safe in small amounts (80), others have shown associations between some of those compounds and allergic reactions, hyperactivity, gut dysbiosis, increased risk of cancer, obesity, and other metabolic disturbances, and gastrointestinal issues (81–85). It is challenging to determine the dose–response or how much individuals usually ingest, given that nutrition facts labels do not include the amount included in foods and beverages. Furthermore, most products contain multiple additives, making it difficult to pinpoint the individual impact of each additive on health (86). However, it is important to also consider the possible synergistic and antagonistic effects between different additives. For instance, a recent prospective cohort study has found associations between commonly consumed additive mixtures and type 2 diabetes (87). Future studies should focus on better understanding the potential detrimental effects of additives in the diet to inform regulations.
This study also has policy implications. During the study period, many Latin American countries have implemented food policies focusing on front-of-package warning labels to inform about the presence of nutrients of concern, such as sodium, added sugars, and saturated fats. Currently, Brazil, Chile, Colombia, Mexico, and Peru have such policies, with Mexico and Colombia also requiring warning labels for the presence of NNS and Mexico and Chile requiring a label for excess calories. This approach, while effective in informing decisions and contributing to a decrease in the intake of these nutrients, can have effects on the formulation of products since companies are incentivized to reduce sugar, sodium, and saturated fat to avoid the policy (88–93). However, these reductions in nutrients of concern do not necessarily translate to reductions in the prevalence of UPFs since sugar, sodium, and saturated fat content alone do not make a product UPFs, suggesting that such policies could keep the prevalence of UPFs stable or possibly even increase it, without improving the products’ healthfulness. An interesting example is beverages: the data from Chile show a substantial replacement of sugar with NNS in beverages, with a 35.4% increase in sweetness from NNS and a 14.5% decrease in sweetness from total sugars (94). This would seem to increase the prevalence of UPFs in beverages since NNS is an additive; however, most beverages with added sweeteners also often contain added color and/or flavor. Although the reformulation might be beneficial in reducing sugar, it is likely that the percentage of UPFs would remain the same. Unfortunately, we were unable to evaluate percentual changes in UPFs over time due to the pooled nature of our data. Annual-level data would be useful to examine how the food supply changed regarding both UPFs and HFSS in response to policy action. At a minimum, our results suggest that if policymakers want to reduce UPFs, they will need to use broader criteria than the classic approach of looking at HFSS only to address this issue.
This study is not without limitations, with the main one being related to the dataset. The GNPD includes only packaged, newly launched products. This can introduce bias to the analyses in a few different ways. First, a large proportion of minimally processed foods, such as fruits, vegetables, milk, eggs, and meats, are not packaged and thus were not included in the analyses, which can result in overestimates of the proportion of UPFs. Second, the dataset is restricted to newly launched products, and unless products underwent any reformulations and/or changes in packaging between 2018 and 2023, those were not included in the analyses despite potentially being often consumed. This could introduce selection bias since UPFs are more likely to undergo reformulations and changes in packaging as a result of marketing strategies (95–99) and thus more likely to be included in the dataset. However, despite these limitations, the study is informative about what types of products are being introduced in the markets and might reflect trends in consumer behavior and desirability.
Some other limitations include not considering the market share of products, instead attributing equal weight to every newly launched product. This prevents any inferences about the intake of UPFs, given that ultra-processed products could be consumed in smaller or larger frequency and quantity. Future studies should investigate the intersection between food supply and purchases or dietary intake regarding ultra-processing. In addition, many of the products did not contain information about nutrients of concern or energy, and this was differential across countries due to distinct local laws and regulations for the required information in the NFL and/or packaging, which limited our ability to apply the Chilean NPM and could have resulted in selection bias. In particular, our results might be an underestimation if manufacturers chose not to include that information on products that tend to be higher in those nutrients. Lastly, our algorithmic approach to identify additives and classify UPFs did not undergo a formal validity test.
The study also presents strengths. First, it investigates a large database of newly introduced foods and beverages in the U.S. and ten other markets across Latin America. Second, the database comprises information contained in the packaging of products, which results in objective information about the nutritional content. Third, identifying UPFs algorithmically proves beneficial because it allows for ingredient lists of individual products to be searched for additives, avoiding subjectivity and the classification of every product in the same group in a similar manner, despite the composition. Lastly, to identify UPFs, we searched for a comprehensive list containing more than 4,000 additives, increasing the likelihood of capturing all products.
5 Conclusion
Newly launched products in the U.S. and Latin America are largely ultra-processed, with a high prevalence of additives and products high in energy, sodium, sugar, and saturated fats, nutrients that contribute to the development of obesity, non-communicable diseases, and early mortality. However, since this study only reflects newly launched products, future studies should investigate the prevalence of UPFs across the entire food supply. Policies such as front-of-package labeling might be helpful in informing the general public that foods are ultra-processed.
Data availability statement
The data analyzed in this study is subject to the following licenses/restrictions: the data used in this study are proprietary and available via an institutional contract with Mintel. Requests to access these datasets should be directed to DM, ZHJtaWxlc0BlbWFpbC51bmMuZWR1.
Author contributions
GV-S: Conceptualization, Data curation, Formal analysis, Visualization, Writing – original draft, Writing – review & editing, Investigation, Methodology. KM: Conceptualization, Supervision, Writing – review & editing, Methodology. DM: Data curation, Formal analysis, Writing – review & editing. LT: Conceptualization, Funding acquisition, Methodology, Supervision, Writing – review & editing, Resources.
Funding
The author(s) declare that financial support was received for the research and/or publication of this article. Funding for this study comes from Bloomberg Philanthropies, Healthy Food Policy Program, grant number 2019-71181. We thank Bloomberg Philanthropies, and NIH grant to CPC P2C HD050924 for financial support.
Acknowledgments
We thank Bloomberg Philanthropies, and the NIH for financial support. We also wish to thank Bridget Hollingsworth and Melissa Lam-McCarthy for administrative assistance.
Conflict of interest
The authors declare that the research was conducted in the absence of any commercial or financial relationships that could be construed as a potential conflict of interest.
Generative AI statement
The authors declare that no Gen AI was used in the creation of this manuscript.
Any alternative text (alt text) provided alongside figures in this article has been generated by Frontiers with the support of artificial intelligence and reasonable efforts have been made to ensure accuracy, including review by the authors wherever possible. If you identify any issues, please contact us.
Publisher’s note
All claims expressed in this article are solely those of the authors and do not necessarily represent those of their affiliated organizations, or those of the publisher, the editors and the reviewers. Any product that may be evaluated in this article, or claim that may be made by its manufacturer, is not guaranteed or endorsed by the publisher.
Supplementary material
The Supplementary material for this article can be found online at: https://www.frontiersin.org/articles/10.3389/fpubh.2025.1659915/full#supplementary-material
References
1. Monteiro, CA, Cannon, G, Levy, RB, Moubarac, JC, Louzada, ML, Rauber, F, et al. Ultra-processed foods: what they are and how to identify them. Public Health Nutr. (2019) 22:936–41. doi: 10.1017/S1368980018003762
2. Monteiro, CA, Moubarac, JC, Cannon, G, Ng, SW, and Popkin, B. Ultra-processed products are becoming dominant in the global food system. Obes Rev. (2013) 14:21–8. doi: 10.1111/obr.12107
3. Monteiro, CA, Levy, RB, Claro, RM, de Castro, IR, and Cannon, G. Increasing consumption of ultra-processed foods and likely impact on human health: evidence from Brazil. Public Health Nutr. (2011) 14:5–13. doi: 10.1017/S1368980010003241
4. Monteiro, CA, Moubarac, JC, Levy, RB, Canella, DS, Louzada, M, and Cannon, G. Household availability of ultra-processed foods and obesity in nineteen European countries. Public Health Nutr. (2018) 21:18–26. doi: 10.1017/S1368980017001379
5. Monteiro, CA, Cannon, G, Lawrence, M, Costa Louzada, ML, and Pereira, MP. Ultra-processed foods, diet quality, and health using the NOVA classification system. Rome: FAO (2019).
6. Elizabeth, L, Machado, P, Zinöcker, M, Baker, P, and Lawrence, M. Ultra-processed foods and health outcomes: a narrative review. Nutrients. (2020) 12:1955. doi: 10.3390/nu12071955
7. Chen, X, Zhang, Z, Yang, H, Qiu, P, Wang, H, Wang, F, et al. Consumption of ultra-processed foods and health outcomes: a systematic review of epidemiological studies. Nutr J. (2020) 19:86. doi: 10.1186/s12937-020-00604-1
8. Lawrence, MA, and Baker, PI. Ultra-processed food and adverse health outcomes. BMJ. (2019) 365:l2289. doi: 10.1136/bmj.l2289
9. Poti, JM, Braga, B, and Qin, B. Ultra-processed food intake and obesity: what really matters for health-processing or nutrient content? Curr Obes Rep. (2017) 6:420–31. doi: 10.1007/s13679-017-0285-4
10. Poti, JM, Mendez, MA, Ng, SW, and Popkin, BM. Is the degree of food processing and convenience linked with the nutritional quality of foods purchased by US households? Am J Clin Nutr. (2015) 101:1251–62. doi: 10.3945/ajcn.114.100925
11. Mendonça, RD, Pimenta, AM, Gea, A, de la Fuente-Arrillaga, C, Martinez-Gonzalez, MA, Lopes, AC, et al. Ultraprocessed food consumption and risk of overweight and obesity: the University of Navarra Follow-up (SUN) cohort study. Am J Clin Nutr. (2016) 104:1433–40. doi: 10.3945/ajcn.116.135004
12. Levy, RB, Rauber, F, Chang, K, Louzada, M, Monteiro, CA, Millett, C, et al. Ultra-processed food consumption and type 2 diabetes incidence: a prospective cohort study. Clin Nutr. (2021) 40:3608–14. doi: 10.1016/j.clnu.2020.12.018
13. Vandevijvere, S, Jaacks, LM, Monteiro, CA, Moubarac, JC, Girling-Butcher, M, Lee, AC, et al. Global trends in ultraprocessed food and drink product sales and their association with adult body mass index trajectories. Obes Rev. (2019) 20:10–9. doi: 10.1111/obr.12860
14. Hall, KD. From dearth to excess: the rise of obesity in an ultra-processed food system. Philos Trans R Soc Lond Ser B Biol Sci. (1885) 378:20220214. doi: 10.1098/rstb.2022.0214
15. Pagliai, G, Dinu, M, Madarena, MP, Bonaccio, M, Iacoviello, L, and Sofi, F. Consumption of ultra-processed foods and health status: a systematic review and meta-analysis. Br J Nutr. (2021) 125:308–18. doi: 10.1017/S0007114520002688
16. Martini, D, Godos, J, Bonaccio, M, Vitaglione, P, and Grosso, G. Ultra-processed foods and nutritional dietary profile: a Meta-analysis of nationally representative samples. Nutrients. (2021) 13:3390. doi: 10.3390/nu13103390
17. Martínez Steele, E, Baraldi, LG, Louzada, ML, Moubarac, JC, Mozaffarian, D, and Monteiro, CA. Ultra-processed foods and added sugars in the US diet: evidence from a nationally representative cross-sectional study. BMJ Open. (2016) 6:e009892. doi: 10.1136/bmjopen-2015-009892
18. Martínez Steele, E, Popkin, BM, Swinburn, B, and Monteiro, CA. The share of ultra-processed foods and the overall nutritional quality of diets in the US: evidence from a nationally representative cross-sectional study. Popul Health Metrics. (2017) 15:6. doi: 10.1186/s12963-017-0119-3
19. Srour, B, Kordahi, MC, Bonazzi, E, Deschasaux-Tanguy, M, Touvier, M, and Chassaing, B. Ultra-processed foods and human health: from epidemiological evidence to mechanistic insights. Lancet Gastroenterol Hepatol. (2022) 7:1128–40. doi: 10.1016/S2468-1253(22)00169-8
20. Whatnall, M, Clarke, E, Collins, CE, Pursey, K, and Burrows, T. Ultra-processed food intakes associated with “food addiction” in young adults. Appetite. (2022) 178:106260. doi: 10.1016/j.appet.2022.106260
21. Calcaterra, V, Cena, H, Rossi, V, Santero, S, Bianchi, A, and Zuccotti, G. Ultra-processed food, reward system and childhood obesity. Children (Basel). (2023) 10:804. doi: 10.3390/children10050804
22. Monteiro, CA, Cannon, G, Moubarac, JC, Levy, RB, Louzada, MLC, and Jaime, PC. The UN decade of nutrition, the NOVA food classification and the trouble with ultra-processing. Public Health Nutr. (2018) 21:5–17. doi: 10.1017/S1368980017000234
23. Monteiro, CA, Levy, RB, Claro, RM, Castro, IR, and Cannon, G. A new classification of foods based on the extent and purpose of their processing. Cad Saude Publica. (2010) 26:2039–49. doi: 10.1590/S0102-311X2010001100005
24. Liu, J, Steele, EM, Li, Y, Karageorgou, D, Micha, R, Monteiro, CA, et al. Consumption of Ultraprocessed foods and diet quality among U.S. children and adults. Am J Prev Med. (2022) 62:252–64. doi: 10.1016/j.amepre.2021.08.014
25. Popkin, BM, Adair, LS, and Ng, SW. Global nutrition transition and the pandemic of obesity in developing countries. Nutr Rev. (2012) 70:3–21. doi: 10.1111/j.1753-4887.2011.00456.x
26. Baker, P, Machado, P, Santos, T, Sievert, K, Backholer, K, Hadjikakou, M, et al. Ultra-processed foods and the nutrition transition: global, regional and national trends, food systems transformations and political economy drivers. Obes Rev. (2020) 21:e13126. doi: 10.1111/obr.13126
27. Juul, F, Parekh, N, Martinez-Steele, E, Monteiro, CA, and Chang, VW. Ultra-processed food consumption among US adults from 2001 to 2018. Am J Clin Nutr. (2022) 115:211–21. doi: 10.1093/ajcn/nqab305
28. Wolfson, JA, Tucker, AC, Leung, CW, Rebholz, CM, Garcia-Larsen, V, and Martinez-Steele, E. Trends in adults' intake of un-processed/minimally processed, and ultra-processed foods at home and away from home in the United States from 2003-2018. J Nutr. (2025) 155:280–92. doi: 10.1016/j.tjnut.2024.10.048
29. Wang, L, Martínez Steele, E, Du, M, Pomeranz, JL, O'Connor, LE, Herrick, KA, et al. Trends in consumption of Ultraprocessed foods among US youths aged 2-19 years, 1999-2018. JAMA. (2021) 326:519–30. doi: 10.1001/jama.2021.10238
30. Marrón-Ponce, JA, Sánchez-Pimienta, TG, Louzada, M, and Batis, C. Energy contribution of NOVA food groups and sociodemographic determinants of ultra-processed food consumption in the Mexican population. Public Health Nutr. (2018) 21:87–93. doi: 10.1017/S1368980017002129
31. Cediel, G, Reyes, M, da Costa Louzada, ML, Martinez Steele, E, Monteiro, CA, Corvalán, C, et al. Ultra-processed foods and added sugars in the Chilean diet (2010). Public Health Nutr. (2018) 21:125–33. doi: 10.1017/S1368980017001161
32. Matos, RA, Adams, M, and Sabaté, J. Review: the consumption of ultra-processed foods and non-communicable diseases in Latin America. Front Nutr. (2021) 8:622714. doi: 10.3389/fnut.2021.622714
33. Ayala, GX, Baquero, B, and Klinger, S. A systematic review of the relationship between acculturation and diet among Latinos in the United States: implications for future research. J Am Diet Assoc. (2008) 108:1330–44. doi: 10.1016/j.jada.2008.05.009
34. Creighton, MJ, Goldman, N, Pebley, AR, and Chung, CY. Durational and generational differences in Mexican immigrant obesity: is acculturation the explanation? Soc Sci Med. (2012) 75:300–10. doi: 10.1016/j.socscimed.2012.03.013
35. Pachipala, K, Shankar, V, Rezler, Z, Vittal, R, Ali, SH, Srinivasan, MS, et al. Acculturation and associations with ultra-processed food consumption among Asian Americans: NHANES, 2011-2018. J Nutr. (2022) 152:1747–54. doi: 10.1093/jn/nxac082
36. Arandia, G, Sotres-Alvarez, D, Siega-Riz, AM, Arredondo, EM, Carnethon, MR, Delamater, AM, et al. Associations between acculturation, ethnic identity, and diet quality among U.S. Hispanic/Latino youth: findings from the HCHS/SOL youth study. Appetite. (2018) 129:25–36. doi: 10.1016/j.appet.2018.06.017
37. Ramírez, AS, Wilson, MD, and Soederberg Miller, LM. Segmented assimilation as a mechanism to explain the dietary acculturation paradox. Appetite. (2022) 169:105820. doi: 10.1016/j.appet.2021.105820
38. Delavari, M, Sønderlund, AL, Swinburn, B, Mellor, D, and Renzaho, A. Acculturation and obesity among migrant populations in high income countries--a systematic review. BMC Public Health. (2013) 13:458. doi: 10.1186/1471-2458-13-458
39. Isasi, CR, Ayala, GX, Sotres-Alvarez, D, Madanat, H, Penedo, F, Loria, CM, et al. Is acculturation related to obesity in Hispanic/Latino adults? Results from the Hispanic community health study/study of Latinos. J Obes. (2015) 2015:186276. doi: 10.1155/2015/186276
40. Steele, EM, Khandpur, N, Sun, Q, and Monteiro, CA. The impact of acculturation to the US environment on the dietary share of ultra-processed foods among US adults. Prev Med. (2020) 141:106261. doi: 10.1016/j.ypmed.2020.106261
41. Zhang, Q, Liu, R, Diggs, LA, Wang, Y, and Ling, L. Does acculturation affect the dietary intakes and body weight status of children of immigrants in the U.S. and other developed countries? A systematic review. Ethn Health. (2019) 24:73–93. doi: 10.1080/13557858.2017.1315365
42. McLeod, DL, Buscemi, J, and Bohnert, AM. Becoming American, becoming obese? A systematic review of acculturation and weight among Latino youth. Obes Rev. (2016) 17:1040–9. doi: 10.1111/obr.12447
43. Satia, JA. Dietary acculturation and the nutrition transition: an overview. Appl Physiol Nutr Metab. (2010) 35:219–23. doi: 10.1139/H10-007
44. Mintel. Mintel global new products database. Available online at: https://www.mintel.com/products/mintel-gnpd/ (accessed September 8, 2024).
45. Solis, E. Mintel global new products database (GNPD). J Bus Financ Librariansh. (2016) 21:79–82. doi: 10.1080/08963568.2016.1112230
46. Dunford, EK, Alsukait, RF, Alkhalaf, MM, Hamza, MM, Shahin, MA, Cetinkaya, V, et al. The healthiness of packaged food and beverage products in the Kingdom of Saudi Arabia. Nutrients. (2025) 17:1895. doi: 10.3390/nu17111895
47. Dunford, EK, Miles, DR, Hollingsworth, BA, Heller, S, Popkin, BM, Ng, SW, et al. Defining "high-in" saturated fat, sugar, and sodium to help inform front-of-pack Labeling efforts for packaged foods and beverages in the United States. Nutrients. (2024) 16:4345. doi: 10.3390/nu16244345
48. MacLean, S, Bolton, KA, Dickie, S, Woods, J, and Lacy, KE. Energy density and level of processing of packaged food and beverages intended for consumption by Australian children. Nutrients. (2025) 17:2293. doi: 10.3390/nu17142293
49. Wang, YF, Marsden, S, DiAngelo, C, Clarke, A, Chung, A, Yu, J, et al. Disconnection between sugars reduction and calorie reduction in baked goods and breakfast cereals with sugars-related nutrient content claims in the Canadian marketplace. Front Nutr. (2025) 12:1539695. doi: 10.3389/fnut.2025.1539695
50. Fu, H, Lee, CH, Nolden, AA, and Kinchla, AJ. Nutrient density, added sugar, and Fiber content of commercially available fruit snacks in the United States from 2017 to 2022. Nutrients. (2024) 16:292. doi: 10.3390/nu16020292
51. Tassy, M, Rytz, A, Drewnowski, A, Lecat, A, Jacquier, EF, and Charles, VR. Monitoring improvements in the nutritional quality of new packaged foods launched between 2016 and 2020. Front Nutr. (2022) 9:983940. doi: 10.3389/fnut.2022.983940
52. Leroy, F, Rytz, A, Drewnowski, A, Tassy, M, Orengo, A, Charles, VR, et al. A new method to monitor the nutritional quality of packaged foods in the global food supply in order to provide feasible targets for reformulation. Nutrients. (2021) 13:576. doi: 10.3390/nu13020576
53. Kikuta, C, Borges, CA, and Duran, AC. Monitoring health and nutrition claims on food labels in Brazil. Front Nutr. (2024) 11:1308110. doi: 10.3389/fnut.2024.1308110
54. U.S. Department of Treasury, Alcohol and Tobacco Tax and Trade Bureau. Alcohol beverage Labeling. (2024). Available online at: https://www.ttb.gov/regulated-commodities/beverage-alcohol/wine/labeling-wine/alcohol-beverage-labeling (accessed July 30, 2025).
55. Popkin, BM, Miles, DR, Taillie, LS, and Dunford, EK. A policy approach to identifying food and beverage products that are ultra-processed and high in added salt, sugar and saturated fat in the United States: a cross-sectional analysis of packaged foods. Lancet Reg Health Am. (2024) 32:100713. doi: 10.1016/j.lana.2024.100713
56. Dunford, EK, Miles, DR, and Popkin, B. Food additives in ultra-processed packaged foods: an examination of US household grocery store purchases. J Acad Nutr Diet. (2023) 123:889–901. doi: 10.1016/j.jand.2022.11.007
57. Food and Agriculture Organization of the United Nations; World Health Organization. Codex general standard for food additives (GSFA) online database. (2024).
59. Berthoud, HR. The neurobiology of food intake in an obesogenic environment. Proc Nutr Soc. (2012) 71:478–87. doi: 10.1017/S0029665112000602
60. Nicolaidis, S. Environment and obesity. Metabolism. (2019) 100:153942. doi: 10.1016/j.metabol.2019.07.006
61. Swinburn, BA, Sacks, G, Hall, KD, McPherson, K, Finegood, DT, Moodie, ML, et al. The global obesity pandemic: shaped by global drivers and local environments. Lancet. (2011) 378:804–14. doi: 10.1016/S0140-6736(11)60813-1
62. Almeida, LB, Scagliusi, FB, Duran, AC, and Jaime, PC. Barriers to and facilitators of ultra-processed food consumption: perceptions of Brazilian adults. Public Health Nutr. (2018) 21:68–76. doi: 10.1017/S1368980017001665
63. Market.US. Global Flavored water market by type (sparkling water and still water), by distribution channel (online platforms and offline stores), by region and companies - industry segment outlook, market assessment, competition scenario, trends, and forecast 2023–2032. (2023).
64. Bull, B, and Rosales, A. The crisis in Venezuela: drivers, transitions, and pathways. Eur Rev Lat Am Caribb Stud. (2020) 109:1–20. doi: 10.32992/erlacs.10587
65. Venezuelan, A, and Ausman, J. The devastating Venezuelan crisis. Surg Neurol Int. (2019) 10:145. doi: 10.25259/SNI_342_2019
66. Montera, V, Martins, APB, Borges, CA, and Canella, DS. Distribution and patterns of use of food additives in foods and beverages available in Brazilian supermarkets. Food Funct. (2021) 12:7699–708. doi: 10.1039/D1FO00429H
67. Tseng, M, Grigsby, CJ, Austin, A, Amin, S, and Nazmi, A. Sensory-related industrial additives in the US packaged food supply. Front Nutr. (2021) 8:762814. doi: 10.3389/fnut.2021.762814
68. Chazelas, E, Deschasaux, M, Srour, B, Kesse-Guyot, E, Julia, C, Alles, B, et al. Food additives: distribution and co-occurrence in 126,000 food products of the French market. Sci Rep. (2020) 10:3980. doi: 10.1038/s41598-020-60948-w
69. Scrinis, G, and Monteiro, CA. Ultra-processed foods and the limits of product reformulation. Public Health Nutr. (2018) 21:247–52. doi: 10.1017/S1368980017001392
70. Urrialde, R, Cano, A, Estévez-Martínez, I, and Perales-García, A. Evolution in the supply of non-alcoholic beverages in the last 25 years: reduction of sugar as a critical nutrient and use of sweeteners. Nutr Hosp. (2018) 35:30–5. doi: 10.20960/nh.2284
71. Chen, L, Wu, W, Zhang, N, Bak, KH, Zhang, Y, and Fu, Y. Sugar reduction in beverages: current trends and new perspectives from sensory and health viewpoints. Food Res Int. (2022) 162:112076. doi: 10.1016/j.foodres.2022.112076
72. Astrup, A, and Monteiro, CA. Does the concept of "ultra-processed foods" help inform dietary guidelines, beyond conventional classification systems? Debate consensus. Am J Clin Nutr. (2022) 116:1489–91. doi: 10.1093/ajcn/nqac230
73. Popkin, BM, and Reardon, T. Obesity and the food system transformation in Latin America. Obes Rev. (2018) 19:1028–64. doi: 10.1111/obr.12694
74. Coleman, RW. Globalization of food retailing: the case of Latin America. Lat Am Bus Rev. (2004) 4:23–41. doi: 10.1300/J140v04n04_02
75. Pérez-Ferrer, C, Auchincloss, AH, de Menezes, MC, Kroker-Lobos, MF, Cardoso, LO, and Barrientos-Gutierrez, T. The food environment in Latin America: a systematic review with a focus on environments relevant to obesity and related chronic diseases. Public Health Nutr. (2019) 22:3447–64. doi: 10.1017/S1368980019002891
76. Leite, FHM, de Carvalho, CE, de Abreu, DSC, Oliveira, MA, Budd, N, and Martins, PA. Association of neighbourhood food availability with the consumption of processed and ultra-processed food products by children in a city of Brazil: a multilevel analysis. Public Health Nutr. (2018) 21:189–200. doi: 10.1017/S136898001600361X
77. Lane, MM, Davis, JA, Beattie, S, Gómez-Donoso, C, Loughman, A, O'Neil, A, et al. Ultraprocessed food and chronic noncommunicable diseases: a systematic review and meta-analysis of 43 observational studies. Obes Rev. (2021) 22:e13146. doi: 10.1111/obr.13146
78. Lane, MM, Gamage, E, Du, S, Ashtree, DN, McGuinness, AJ, Gauci, S, et al. Ultra-processed food exposure and adverse health outcomes: umbrella review of epidemiological meta-analyses. BMJ. (2024) 384:e077310. doi: 10.1136/bmj-2023-077310
79. Hall, KD, Ayuketah, A, Brychta, R, Cai, H, Cassimatis, T, Chen, KY, et al. Ultra-processed diets cause excess calorie intake and weight gain: an inpatient randomized controlled trial of ad libitum food intake. Cell Metab. (2019) 30:67–77.e3. doi: 10.1016/j.cmet.2019.05.008
81. Debras, C, Chazelas, E, Srour, B, Druesne-Pecollo, N, Esseddik, Y, Szabo de Edelenyi, F, et al. Artificial sweeteners and cancer risk: results from the NutriNet-santé population-based cohort study. PLoS Med. (2022) 19:e1003950. doi: 10.1371/journal.pmed.1003950
82. Chazelas, E, Pierre, F, Druesne-Pecollo, N, Esseddik, Y, Szabo de Edelenyi, F, Agaesse, C, et al. Nitrites and nitrates from food additives and natural sources and cancer risk: results from the NutriNet-santé cohort. Int J Epidemiol. (2022) 51:1106–19. doi: 10.1093/ije/dyac046
83. Besedin, D, Shah, R, Brennan, C, Panzeri, E, Hao Van, TT, and Eri, R. Food additives and their implication in inflammatory bowel disease and metabolic syndrome. Clin Nutr ESPEN. (2024) 64:483–95. doi: 10.1016/j.clnesp.2024.10.171
84. Barra, NG, Fang, H, Bhatwa, A, Schmidt, AM, Syed, SA, Steinberg, GR, et al. Food supply toxicants and additives alter the gut microbiota and risk of metabolic disease. Am J Physiol Endocrinol Metab. (2025) 328:E337–53. doi: 10.1152/ajpendo.00364.2024
85. Valluzzi, RL, Fierro, V, Arasi, S, Mennini, M, Pecora, V, and Fiocchi, A. Allergy to food additives. Curr Opin Allergy Clin Immunol. (2019) 19:256–62. doi: 10.1097/ACI.0000000000000528
86. Recoules, C, Touvier, M, Pierre, F, and Audebert, M. Evaluation of the toxic effects of food additives, alone or in mixture, in four human cell models. Food Chem Toxicol. (2025) 196:115198. doi: 10.1016/j.fct.2024.115198
87. Payen de la Garanderie, M, Hasenbohler, A, Dechamp, N, Javaux, G, Szabo de Edelenyi, F, Agaësse, C, et al. Food additive mixtures and type 2 diabetes incidence: results from the NutriNet-santé prospective cohort. PLoS Med. (2025) 22:e1004570. doi: 10.1371/journal.pmed.1004570
88. Saavedra-Garcia, L, Meza-Hernández, M, Diez-Canseco, F, and Taillie, LS. Reformulation of top-selling processed and ultra-processed foods and beverages in the Peruvian food supply after front-of-package warning label policy. Int J Environ Res Public Health. (2022) 20:424. doi: 10.3390/ijerph20010424
89. Lowery, CM, Mora-Plazas, M, Gómez, LF, Popkin, B, and Taillie, LS. Reformulation of packaged foods and beverages in the Colombian food supply. Nutrients. (2020) 12:3260. doi: 10.3390/nu12113260
90. Fretes, G, Corvalán, C, Reyes, M, Taillie, LS, Economos, CD, Wilson, NLW, et al. Changes in children's and adolescents' dietary intake after the implementation of Chile's law of food labeling, advertising and sales in schools: a longitudinal study. Int J Behav Nutr Phys Act. (2023) 20:40. doi: 10.1186/s12966-023-01445-x
91. Taillie, LS, Bercholz, M, Popkin, B, Rebolledo, N, Reyes, M, and Corvalán, C. Decreases in purchases of energy, sodium, sugar, and saturated fat 3 years after implementation of the Chilean food labeling and marketing law: an interrupted time series analysis. PLoS Med. (2024) 21:e1004463. doi: 10.1371/journal.pmed.1004463
92. Taillie, LS, Bercholz, M, Popkin, B, Reyes, M, Colchero, MA, and Corvalán, C. Changes in food purchases after the Chilean policies on food labelling, marketing, and sales in schools: a before and after study. Lancet Planet Health. (2021) 5:e526–33. doi: 10.1016/S2542-5196(21)00172-8
93. Reyes, M, Smith Taillie, L, Popkin, B, Kanter, R, Vandevijvere, S, and Corvalán, C. Changes in the amount of nutrient of packaged foods and beverages after the initial implementation of the Chilean law of food labelling and advertising: a nonexperimental prospective study. PLoS Med. (2020) 17:e1003220. doi: 10.1371/journal.pmed.1003220
94. Rebolledo, N, Bercholz, M, Corvalán, C, Ng, SW, and Taillie, LS. Did the sweetness of beverages change with the Chilean food Labeling and marketing law? A before and after study. Front Nutr. (2022) 9:1043665. doi: 10.3389/fnut.2022.1043665
95. Boyland, EJ, Nolan, S, Kelly, B, Tudur-Smith, C, Jones, A, Halford, JC, et al. Advertising as a cue to consume: a systematic review and meta-analysis of the effects of acute exposure to unhealthy food and nonalcoholic beverage advertising on intake in children and adults. Am J Clin Nutr. (2016) 103:519–33. doi: 10.3945/ajcn.115.120022
96. Nieto, C, Jáuregui, A, Contreras-Manzano, A, Potvin Kent, M, Sacks, G, White, CM, et al. Adults' exposure to unhealthy food and beverage marketing: a multi-country study in Australia, Canada, Mexico, the United Kingdom, and the United States. J Nutr. (2022) 152:25s–34s. doi: 10.1093/jn/nxab449
97. Andrade, GC, Mais, LA, Ricardo, CZ, Duran, AC, and Martins, APB. Promotion of ultra-processed foods in Brazil: combined use of claims and promotional features on packaging. Rev Saude Publica. (2023) 57:44. doi: 10.11606/s1518-8787.2023057004410
98. Harris, JL, Schwartz, MB, and Brownell, KD. Marketing foods to children and adolescents: licensed characters and other promotions on packaged foods in the supermarket. Public Health Nutr. (2010) 13:409–17. doi: 10.1017/S1368980009991339
Keywords: additives, diet disparities, packaged foods and beverages, saturated fats, sodium, sugars, trends, ultra-processed foods and beverages
Citation: Vatavuk-Serrati G, Meyer KA, Miles DR and Taillie LS (2025) Prevalence of ultra-processed foods and beverages in newly launched products across the Americas: a comparison between the United States and Latin American countries from 2018 to 2023. Front. Public Health. 13:1659915. doi: 10.3389/fpubh.2025.1659915
Edited by:
Flávia Dos Santos Barbosa Brito, Rio de Janeiro State University, BrazilReviewed by:
Taciana Sousa, Rio de Janeiro State University, BrazilAriane Romeiro, Centro Universitário Serra dos Órgãos, Brazil
Copyright © 2025 Vatavuk-Serrati, Meyer, Miles and Taillie. This is an open-access article distributed under the terms of the Creative Commons Attribution License (CC BY). The use, distribution or reproduction in other forums is permitted, provided the original author(s) and the copyright owner(s) are credited and that the original publication in this journal is cited, in accordance with accepted academic practice. No use, distribution or reproduction is permitted which does not comply with these terms.
*Correspondence: Lindsey Smith Taillie, dGFpbGxpZUB1bmMuZWR1