Abstract
Introduction:
Assessing and intervening in food environments constitutes a critical strategy for addressing the obesity epidemics. However, existing assessments predominantly focus on either objective or perceived dimensions, with limited attention to developing countries. This study investigates the impact of neighborhood-level food environments on resident obesity in a national central city of China and establishes a typology of obesogenic community profiles.
Methods:
We developed an integrative tool that harmonizes objective geospatial data with subjective perceptual metrics. Leveraging stratified sampling survey data on neighborhood food environments (N = 405) and multiscale geospatial datasets from Tianjin, China (2023), we establish a comprehensive indicator repository for neighborhood food environments. Dimensionality reduction via principal component analysis (PCA) was applied to all measured indicators, followed by an ordinal multinomial regression model to identify significant obesogenic determinants at the neighborhood level. Finally, the K-means clustering algorithm was subsequently implemented to delineate prototypical obesogenic neighborhood typologies.
Results:
Among 10 principal components derived from PCA, four obesogenic factors were identified, ranked by effect magnitude: FAC_8 (Perceived Community Food Accessibility Index, β = −0.382, p = 0.001, OR = 0.68), FAC_4 (Food Availability and Diversity within 500-1000m, β = 0.225, p = 0.061, OR = 1.25), FAC_6 (Unhealthy Dietary Behavior, β = −0.191, p = 0.066, OR = 0.68), and FAC_3 (Retail Food Environment Index within 500m, β = −0.184, p = 0.078, OR = 0.83). K-means clustering delineated three obesogenic neighborhood types: Objective Deprived (N = 10, 6.1%), Objective Overloaded (N = 37, 22.56%), and Objective Overloaded-Dietary Behavior Integrated (N = 117, 71.34%).
Discussion:
This study revealed that within the context of China’s urban built environment, the prevalence of “food deserts” is minimal. Conversely, an augmented proportion of widely recognized healthy food facilities in developed Western countries has been observed to heighten the risk of obesity, including supermarkets and fresh food markets. This phenomenon exhibits a scale-dependence, indicating that its impact increases with the magnitude of the scale. The most salient characteristic of obesogenic neighborhoods in China is their high objective environmental risk. The study examined and identified neighborhood-level obesity factors and provided a generalizable method for identifying obesogenic neighborhood types, thereby providing empirical evidence for obesity research in developing countries.
1 Introduction
Globally, obesity and its associated metabolic syndromes and cardiovascular diseases are proliferating at an alarming rate as critical public health crises. World Health Organization data indicates a near-tripling of global obesity prevalence since 1975, with urban populations constituting over 75% of cases. The etiology of obesity spans multidimensional determinants ranging from individual stress-related eating behaviors (1), and sociocultural evolution (2) to built environment characteristics (3), Environmental modification strategies demonstrate greater feasibility and efficacy compared to individual-centric lifestyle interventions (4). The retail food environment, as a critical built environment component, exhibits strong associations with dietary patterns: Limited access to healthy foods may precipitate adverse dietary behaviors and health outcomes (5, 6). Consequently, community-level food environment optimization has been widely advocated as a strategic obesity intervention (7).
Low-quality food environments are typically categorized as “food deserts” (8) or “food swamps” (9). The former concept, originating from a 1990 Scottish government publication, describes areas with limited access to healthy foods, frequently operationalized through metrics assessing retail food availability (e.g., supermarket scarcity versus convenience store predominance) (10). The latter term, emerging from 2009 U. S. scholarship, characterizes environments where energy-dense food options overwhelm healthy alternatives, exacerbating nutritional risks (11). Concurrently, the “obesogenic environment” framework proposed by Swinburn et al. (12) through the ANGELO (Analysis Grid for Environments Linked to Obesity) model provides a holistic conceptualization of environmental obesogenicity. However, these constructs predominantly reflect developed nations’ contexts, and their applicability to, for example, non-developed Asian countries is difficult to ascertain (13). While significant spatial disparities persist across urban–rural gradients (14), national boundaries (15), and income strata (16). Notably, low- and middle-income countries (LMICs) face escalating obesity burdens yet remain critically understudied (constituting merely 10% of research output) (17), with scant evidence linking food environment exposures to health outcomes (16).
In China, obesity has emerged as a paramount public health challenge amidst the dual burden of undernutrition and overnutrition (18, 19). Distinct from Western contexts, Chinese urban food environments and dietary cultures demonstrate unique sociocultural configurations (20), While consensus exists regarding food environment-obesity associations, critical knowledge gaps persist: (1) Limited evidence on specific food environment typologies’ differential impacts (21); (2) Methodological bifurcation between perceived versus objective measurement approaches (22–25); and (3) Absence of integrated assessment frameworks.
Objective measurement dominates food environment research (>60% of studies) through GIS-based analyses and statistical indicators (e.g., food outlet density within buffer zones) (26–28), while enabling standardized spatial quantification, this approach neglects individual-level behavioral mediators—for instance, temporal or economic constraints altering accessibility perceptions despite equivalent spatial proximity (29, 30). Perceptual assessments, though underutilized, capture subjective experiences and preferences, offering complementary insights (31, 32). The synergistic integration of both paradigms remains empirically underexplored.
Building upon this foundation, our study investigates the obesogenic food environment in Tianjin—a Chinese metropolis with distinct dietary patterns—through a dual-measurement integrative lens. In particular, it is emphasized that in our study, “food environment” is operationally defined as neighborhood-level points of interest (POIs) associated with food retail facilities, while regionally embedded culinary cultural landscapes are explicitly excluded from the scope of investigation. We address three core inquiries as follows: (1) Do objective food environments, perceived food environments, and dietary behaviors all influence weight outcomes among Chinese? (2) Based on the positive findings from the first question, what are the key environmental factors and individual-level determinants influencing weight outcomes? (3) Based on the evidence from Question 1 and Question 2, how can we classify and assess the overall obesity risk status of typical Chinese urban communities?
2 Study area and methods
2.1 Study area and participants
This study utilized a cross-sectional survey conducted from January to March 2023 in the main urban area of Tianjin, China (Figure 1). The research focused on the metropolitan core of Tianjin (38°34′–40°15′N, 116°43′–118°04′E), a critical coastal hub connecting the Beijing-Tianjin-Hebei urban agglomeration and Northeast Asia. Characterized by its 153-kilometer Bohai Sea coastline and Haihe River Basin, Tianjin exhibits a unique dietary culture shaped by its geographical advantages and historical urban development, featuring abundant riverine and marine delicacies, as well as poultry and game meats (33). Notably, Tianjin ranks third in China for overweight and obesity prevalence (64), making it an ideal case for investigating dietary-environment interactions. The study area encompassed central urban districts and four suburban zones (including Binhai New Area), yielding 405 valid questionnaires. This region represents 72.22% of Tianjin’s population, ensuring demographic representativeness and high participant engagement.
Figure 1
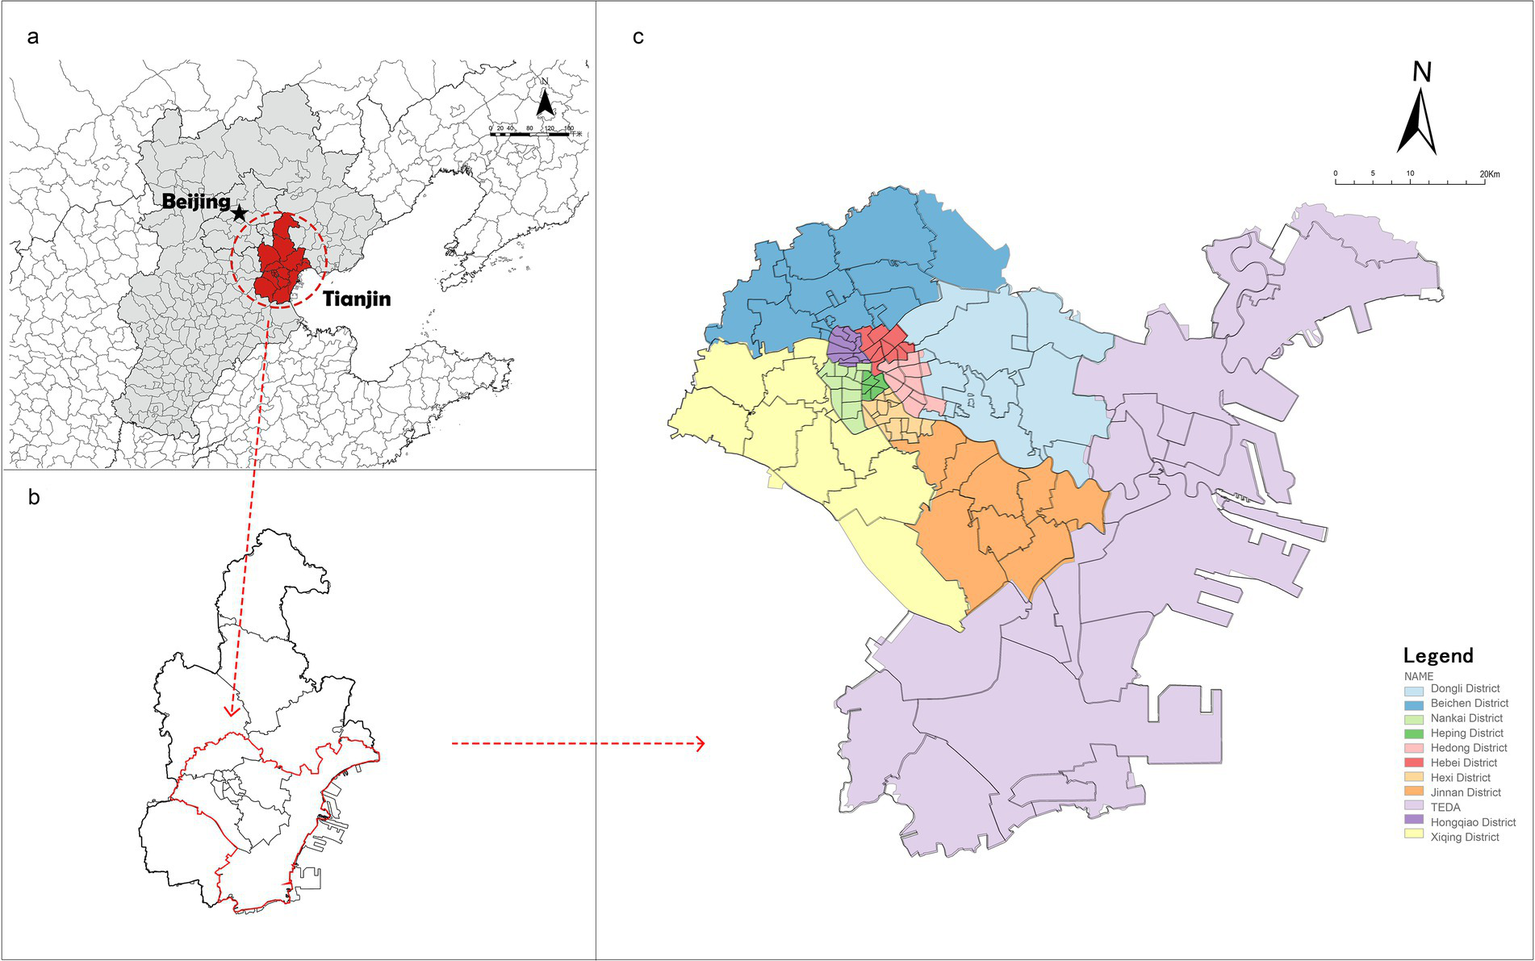
Study area. (a) Circum-Bohai sea economic zone, China. (b) Tianjin, Circum-Bohai sea economic zone, China. (c) Main urban, suburban and TEDA (Tianjin economic-technological development area), Tianjin.
The study adopts residents’ daily living circles as the analytical scale, operationalized through ArcGIS-based buffer analysis. Specifically, we generated buffer maps in ArcGIS with 300m, 500m (primary), and 1000m radii to simulate 5-, 10-, and 15-min urban pedestrian catchments—thresholds aligned with China’s official daily living circles standards for neighborhood service accessibility (35). Preliminary analyses revealed limited food environment exposure within 300m buffers, attributable to the prevalence of large-scale gated communities in Chinese cities that create spatial discontinuities in facility distribution. Consequently, the 300m scale was excluded from subsequent analyses. Final operationalization employed 500m and 1000m buffers to represent: High-frequency pedestrian food procurement zones (daily walking accessibility) and Periodic procurement corridors (walking/short-drive accessibility). The prioritization of pedestrian metrics reflects empirical evidence that walking constitutes the predominant mode for food acquisition in Chinese urban contexts (36). This multiscalar approach captures the hierarchical structure of food environment exposure while addressing the morphological specificities of Chinese urban form.
2.2 Data measurement
Objective food environment data were derived from open-source geospatial databases and survey questionnaires. Community-level spatial data, including retail and food service facilities, were obtained from OpenStreetMap, the Chinese Academy of Sciences Data Center,1 and the Tianjin Municipal Open Data Platform. After data cleaning—which removed 891 irrelevant entries—75,079 valid points of interest (POIs) were retained, comprising 15,959 food retail facilities and 59,120 food service establishments (Table 1).
Table 1
| Level I | Level II | Level III | Quantity (bars) | Total (bars) |
|---|---|---|---|---|
| Food retail facilities | Supermarkets | X1 supermarket | 68 | 15959 |
| Vegetable market/farmer’s market | X2 vegetable market/farmer’s market | 5034 | ||
| Community supermarkets/grocery stores | X3 community supermarket/grocery store | 2724 | ||
| Convenience Store | X4 convenience store | 2981 | ||
| Fresh food shops | X5 fresh food speciality store | 5152 | ||
| Catering facilities | Takeaway restaurants | X6 Takeaway Restaurants | 8086 | 59120 |
| Fast food restaurants | X7 fast food—Chinese | 8464 | ||
| X8 fast food—western | 325 | |||
| Restaurant Ching | X9 restaurant-Chinese | 34043 | ||
| X10 restaurant-western | 2544 | |||
| Dessert shop | X11 dessert shop | 5658 |
List of POIs of food facilities within the study area.
Perceived community food environment data originated from the 2023 Tianjin Health Survey (N = 405 valid responses; 55.0% online and 81.9% offline response rates; overall 73% validity deemed acceptable), a structured questionnaire comprising four modules: Individual socioeconomic attributes, Community food environment perceptions, dietary behavior patterns, and health status indicators (the questionnaire can be found in Supplementary Material 1). Data collection employed a hybrid web-based (via Credamo, a questionnaire data platform from China, the link is: https://www.credamo.com/#/) and face-to-face (street-intercept sampling) protocol. All participants provided written informed consent prior to engagement and received ¥5 RMB monetary compensation. Final analytical samples included 405 validated responses, with differential validity rates across modalities: Online surveys: 55.0% validity (platform-mediated recruitment), Offline surveys: 81.9% validity (controlled field sampling). The validity discrepancy primarily stemmed from performance on an embedded attention-check question, where offline participants demonstrated superior engagement. The aggregate validity rate of 73% meets methodological acceptability thresholds for community-level observational studies.
2.2.1 Outcome variable
The study operationalized body weight outcomes at the individual level as the primary dependent variable. Specific measurements included self-reported height, weight. Body Mass Index (BMI) was calculated to two decimal places using the Equation 1:
Classification followed the Chinese BMI classification, BMI < 18.5 denotes underweight, 18.5 ≤ BMI < 24.0 denotes normal weight, 24.0 ≤ BMI < 28.0 denotes overweight, and BMI ≥ 28.0 denotes obesity. The WHO standard defines adult overweight as BMI 25.0–29.9 kg/m2, and obesity as BMI ≥ 30.0 kg/m2. However, accumulated evidence indicated that variations in the association between BMI and health risks, such as body composition (e.g., body fat percentage, muscle mass), across different ethnicities and populations (37). Standards in this research developed based on epidemiological data specific to the Chinese population can more accurately identify health risks associated with overweight and obesity in this demographic. To intuitively reflect the graded health risks associated with each BMI category, we also present the assessment scoring system recommended by the Chinese Guidelines for the Prevention and Control of Overweight and Obesity in Adults (38). This system assigns a score of 100 for normal weight (G1 = 100), 80 for overweight (G2 = 80), and 60 for obesity (G3 = 60), which quantitatively signifies a decline in health status across categories. For the purpose of all subsequent regression analyses, BMI was treated as a categorical variable. The scoring is presented here for descriptive clarity and to align with the public health practice in the study context; it was not used as a continuous variable in statistical models.
2.2.2 Explanatory variable
2.2.2.1 Objective community food environment metrics
The accessibility of objective community food facilities was measured by calculating the point density of facility categories within three buffer zones. Equation 2 is defined as:where represents the number of food facility POIs within a circular buffer of radius centered at coordinates . Buffer areas were derived using ArcGIS, incorporating road network accessibility and sample point locations to ensure spatial accuracy.
This study employs the modified RFEI to measure the healthiness of the objective food environment. The Retail Food Environment Index (RFEI) was originally proposed by the California Center for Public Health Advocacy and developed for the United States and Canada (39). It is defined as the ratio of less healthy food retailers (e.g., fast-food outlets and convenience stores) to healthy food retailers (e.g., grocery stores and supermarkets) within a given area (e.g., a census tract). Compared to traditional quantitative measures, the RFEI more effectively reflects the healthiness of a community’s food environment. However, to better align with the characteristics of China’s food environment, we have modified the original RFEI based on the research approach of Amin et al. (40), who proposed a machine learning-enhanced modified Retail Food Environment Index (mRFEI), to ensure its applicability in China. Equations 3–6 are as follows:
Where represents the number of healthy food retailers, including supermarkets, wet markets and fresh food specialty stores. represents the number of unhealthy food retailers, including the other food retailers. represents the number of Groceries. represents the number convenience stores. represents the number of Chinese restaurants.
The diversity index is a measure of differences in the number and type of different food facilities in a community food environment. In landscape ecology, diversity indices are measured in a variety of ways, among which, Diversity was quantified using the Shannon-Wiener Index, adapted from ecological studies (41). The Shannon-Weiner Index was used to calculate the diversity of food facilities at different ranges of measurement for the food facility diversity studied in this research, and Equation 7 is as follows:
Where represents the diversity index, and denotes the proportion of the I-th facility type relative to the total facilities N in the community (e.g., ).
2.2.2.2 Perceived neighborhood food environment metrics
Perceived food environment data were collected via the 2023 Tianjin Community Food Environment Survey, employing a five-dimensional framework (42), which includes perceived availability, perceived accessibility, perceived affordability, perceived adaptability and perceived serviceability. Responses were recorded using 7-point Likert scales (1 = strongly disagree; 7 = strongly agree). Detailed metrics and survey items are outlined in Table 2.
Table 2
| Type | Target layer | Indicator description | Evaluation criteria |
|---|---|---|---|
| Residents’ subjective perception of the neighborhood food environment | Perceived availability | F1-Nutritious food can be easily purchased in this neighborhood, e.g., a full range of foods such as staple foods, main dishes and side dishes. | Using a 7-point Richter scale: Strongly disagree = 1, Strongly agree = 7 |
| Perceived accessibility | F2-It is easy to buy daily food on foot, and there is good transport to get to the food facilities, so there are no inconveniences in daily shopping | ||
| Perceived affordability | F3-Nutritionally balanced food is available in the neighborhood at more affordable prices | ||
| Perceived accommodation | F41-The opening hours and service of facilities such as supermarkets or grocery shops are satisfactory when buying necessary ingredients/food in the neighborhood | ||
| F42-The environmental quality of facilities such as supermarkets or grocery shops is satisfactory when buying necessary ingredients/food in this neighborhood | |||
| F4- Satisfactory service quality of facilities such as supermarkets or grocery shops when buying necessary ingredients/food in this neighborhood | |||
| Perceived acceptability | F51-The quality and appearance of ingredients/food bought in this neighborhood are satisfactory. | ||
| F52-I feel confident that there are trustworthy merchants and producers in this neighborhood in terms of food safety | |||
| Perceived availability | R1-There are a lot of restaurants around where I live that are easy to find that offer a full range of foods that are nutritious, e.g., starters, mains and side dishes; | ||
| Perceived accessibility | R2-It is easy to walk to nearby restaurants and there is good transport to restaurants, so there are no inconveniences to daily meals R3-I can buy well-balanced food at a relatively affordable price at nearby restaurants | ||
| Perceived affordability | R3-I can buy well-balanced food at a reasonable price at nearby restaurants. | ||
| Perceived accommodation | R41-Satisfactory opening hours and service when I want to eat in a restaurant. | ||
| R42-The quality of the environment in the restaurant is satisfactory when I want to eat in the restaurant | |||
| R43-The level of service quality in the restaurant is satisfactory when I dine in the restaurant | |||
| Perceived acceptability | R51-The quality and taste of ingredients/dishes served in restaurants in this neighborhood is satisfactory | ||
| R52-Feeling confident about the food safety in the neighborhood, with more established businesses and producers that I can trust. |
Measurement indicators and enquiry methods of the five-dimensional perception questionnaire.
2.2.2.3 Dietary behavior metrics
Dietary behavior serves as a critical determinant of body weight outcomes and has been empirically validated as a mediator between built environments and individual health outcomes (
43). Drawing from established domestic measurement frameworks, this study operationalized dietary behavior through four dimensions:
dietary diversity,
food procurement patterns,
dining locations, and
dietary content. A one-week dietary recall method was employed, with participants reporting:
Dietary diversity: Assessed via a 7-point Likert scale (1 = “extremely monotonous” to 7 = “extremely diverse”) based on self-evaluations of meal variety over the preceding week.
Food procurement patterns: Habitual channels for food acquisition (e.g., markets, online platforms).
Dining locations: Frequency of meals consumed at home, workplaces, or commercial establishments.
Dietary content: Self-reported frequency and portion sizes of both healthy (e.g., vegetables, whole grains) and unhealthy foods (e.g., sugary beverages, processed snacks) consumed during the recall period.
2.2.3 Control variables
In addition to the above variables, this study included individual demographic information of the participants who took part in the questionnaire, which was divided into personal information and household information, including gender, age, household registration, levels of education and chronic disease history. The household information includes the geographical location of the neighborhood, size of the household, annual household income, whether they own a private car, and employment status.
2.3 Methodology
2.3.1 Study design
Guided by socioecological theory (63), this study investigates how socioecological frameworks influence individual health outcomes through four core propositions: (1) environmental impacts on health behaviors are multifaceted and operate across multiple levels; (2) factors at different levels and dimensions interact dynamically; (3) hierarchical distinctions exist among systems, necessitating multi-level environmental interventions to effectively modify health beliefs and behaviors. The analytical framework focuses on the effects of objective food environments and perceived food environmental factors on obesity outcomes, with measurement indicators illustrated in Figure 2.
Figure 2
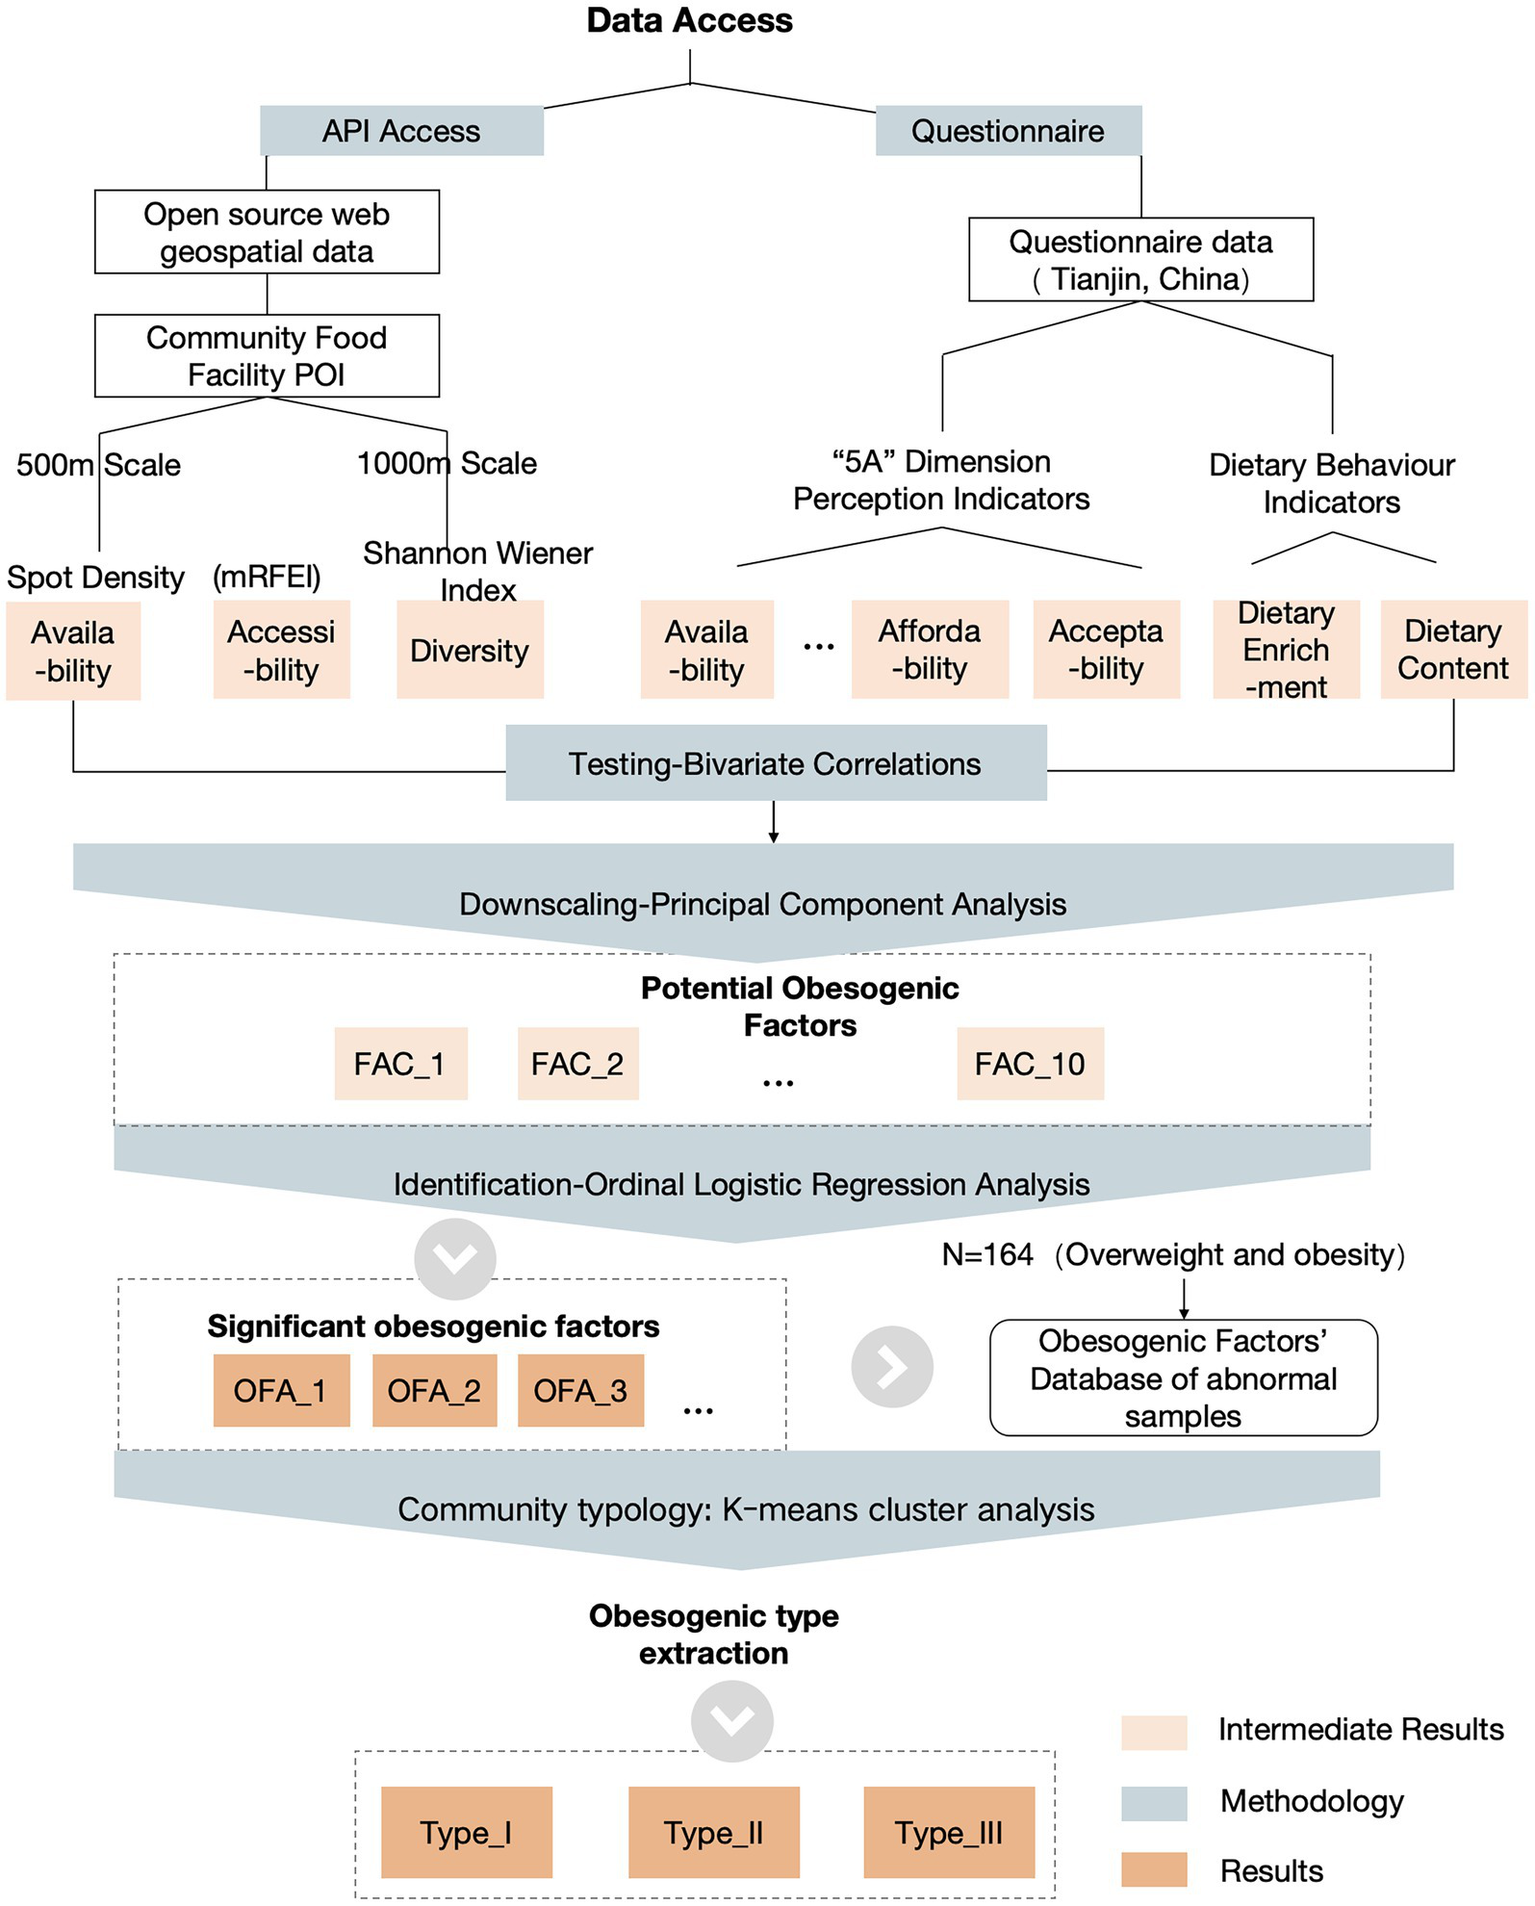
Study design framework and technical path.
2.3.2 Data analysis
This section delineates the sequential analytical strategy employed to address the study’s core research questions. Initially, bivariate correlation analysis was employed to assess individual associations and ordinal weighting outcomes among each initial variable across three conceptual dimensions (objective, perceived, and behavioral). Subsequently, principal component analysis (PCA) was conducted to mitigate multicollinearity and identify key latent factors for robust modeling. A simplified set of orthogonal factors derived from PCA was then utilized in multivariate ordinal logistic regression models. Controlling for sociodemographic covariates, the simultaneous influence of the three dimensions on weight outcomes was tested, addressing Question 1. The output from the ordered logistic regression model identified key obesity-promoting factors, directly addressing Question 2. Finally, K-means clustering was employed for standardization and integration, enabling community classification by assessing shared obesity risk profiles.
2.3.2.1 Bivariate correlation
Bivariate correlation analysis was conducted to measure the strength and direction of the relationships between the objective food environment, perceived food environment, individual dietary behaviors, and weight outcomes (addressing Research Question 1). We employed SPSS 28.0 software to conduct bivariate analyses on all initial variables. This served two purposes: firstly, to examine whether the objective food environment, perceived food environment, and individual dietary behaviors were associated with weight outcomes; secondly, to preliminarily assess whether multiple factors presented a risk of multicollinearity.
2.3.2.2 Multifactor dimensionality reduction
After analyzing the multicollinearity test of the 38 measures obtained from the above pathway measurements, we found that these measures have multicollinearity problems within the three dimensions (objective indicator pool, perception indicator pool, and eating behavior indicator pool). Principal Component Analysis (PCA) is a commonly used dimensionality reduction method on medium-sized datasets and non-sparse dataset scenarios, transforming high-dimensional data into low-dimensional data through linear transformation. The study utilizes SPSS 28.0 software for Principal Component Analysis (PCA) of indicators to organize and merge these potential indicators to improve the data processing efficiency of the subsequent study.
2.3.2.3 Identification of obesogenic factors
Given the ordered categorical nature of the dependent variable (weight outcomes: G1 = 100, G2 = 80, G3 = 60), ordinal logistic regression was employed to identify obesogenic factors while controlling for sociodemographic covariates. This method is preferred over linear regression for ordinal outcomes, as it models cumulative probabilities across response categories. The logit function is expressed as:
For each ordered category of the dependent variable Y, the model establishes a relationship through a Logit link function of cumulative probabilities (Equation 8):where Y is an ordered categorical dependent variable (body weight outcomes) with values of 1, 2. K. is the intercept term for category (needs to satisfy ). where represents the independent variables (objective food environment factor, perceived food environment factor, and eating behavior factor). are regression coefficients for the independent variables.
2.3.2.4 Probability calculation
The probability of each category is derived from the difference in the cumulative probabilities (Equation 9):
where the accumulation probability is computed via an inverse logit function (Equation 10):
2.3.2.5 Neighborhood typology and evaluation
Existing studies classify obesogenic environments primarily at the facility level, neglecting systemic neighborhood-scale assessments. To address this gap, we developed a neighborhood obesogenic risk evaluation model via the following workflow:
Data standardization: We extracted 164 obesogenic factors from the sample of weight outlier samples [overweight (N = 131, 79.8%), obese (N = 33, 20.2%)] for classification. Since the scale and positive and negative orientation of each indicator in the indicator system are different, it is necessary to standardize the indicators before downgrading the obesogenic factors for subsequent comprehensive evaluation. The specific processing Equations 11–12 is as follows:
where denotes the standardized value of the j-th indicator in the i-th dimension. The data were processed in SPSS 28.0 to generate a harmonized dataset.
K-means clustering: K-means clustering was first determined by contour coefficients together with the elbow rule, using the SSE value of each cluster calculated from 2–28; according to the elbow rule, the inflection point of the SSE value was selected as the optimal number of clusters. Then, K-means clustering analysis was carried out in the following steps: select the initialized k samples as the initial clustering centers for each sample in the dataset, calculate its distance to the k clustering centers and classify it into the class corresponding to the clustering center with the smallest distance; for each category , recalculate its clustering centers (Equation 13):
Then, steps 2–3 are repeated until convergence is reached (max number of iterations = 100; tolerance = 105).
3 Results
3.1 Descriptive statistics
Table 3 presents the postcleaning descriptive statistics for all the variables, including the means, standard deviations, skewness, and kurtosis. The absolute skewness values ranged from 0.024 to 1.80, and the kurtosis values ranged from 0.06 to 4.56, all within acceptable thresholds (skewness < ±2, kurtosis < ±7), indicating no significant deviation from normality in the data distribution.
Table 3
| Variable | Mean value | Average | Median | Standard | Skewness | Kurtosis |
|---|---|---|---|---|---|---|
| Gender | Male = 1, Female = 0 | 0.45 | - | 0.50 | 0.184 | −1.976 |
| Age1 | Age of participants | - | 3 | 1.30 | 0.346 | −0.967 |
| Household registration | Local domicile = 1, other domicile = 0 | 0.79 | - | 0.41 | −1.449 | 0.099 |
| Levels of education2 | Levels of education to the highest level of qualification | - | 16 | 2.49 | 0.957 | 1.231 |
| Household size | Number of family members living together | 3.15 | - | 0.99 | 0.480 | 0.945 |
| Annual household income3 | Participants’ total annual household income | - | 3 | 1.31 | 0.130 | −0.979 |
| Own a private car | Own a private car = 1, no private car = 0 | 0.74 | - | 0.44 | −1.103 | −0.788 |
| Employment status | Be on board = 1, other = 0 | 0.87 | - | 0.33 | −1.263 | 2.159 |
Descriptive statistics of the socioeconomic attributes of the sample.
1This variable is an ordinal categorical variable, under 18 = 1, 18−29 = 2, 30–39 = 3, 40–49 = 4, 50–59 = 5, 60 and above = 6. 50 ~ 59 years old = 5, 60 years old and above = 6. 2This variable is an ordinal categorical variable, primary school and below = 1, junior secondary school = 2, senior secondary school/vocational secondary school = 3, college/higher vocational colleges = 4, Bachelor’s degree = 5, postgraduate (master’s degree and above) = 6. 3This variable is an ordinal categorical variable, less than 30,000 yen = 1, 30–99,000 yen = 2, 100–149,000 yen = 3, 15–19,000 yen = 4, 20–39,000 yen = 5, 400,000 yen and above = 6. “-” indicates meaninglessness.
The sample comprised 45% male (N = 184/405) and 55% female (N = 221/405) participants, with a median age range is 30–39 years old. Among the respondents, 79% held Tianjin hukou (household registration, N = 321/405), and (equivalent to college-level education). These sociodemographic characteristics align with Tianjin’s 7th National Population Census (34), confirming sample representativeness.
Bivariate tests (Figure 3) revealed significant correlations among three core dimensions: objective food environments, perceived food environments, and dietary behaviors. These findings indicate multicollinearity among initial evaluation metrics, necessitating dimensionality reduction prior to modeling. Furthermore, these findings provide preliminary answers to question 1. We observed that perceived food environment, dietary behaviors, and physical activity all exhibit direct associations with weight outcomes. Within perceived food environments, R1-perceived availability (β = −0.126*) and R2-perceived accessibility (β = −0.122*) exhibited negative correlations with weight outcomes. Regarding dietary behaviors, average weekly intake of healthy food (β = −0.148*), total weekly intake of healthy food (β = −0.139**), average weekly intake of unhealthy food (β = −0.207**), and total weekly intake of unhealthy food (β = −0.138**) were negatively correlated with weight outcomes. Conversely, dietary intake diversity (β = 0.141**) showed a positive correlation with weight outcomes. Furthermore, we observed that the direct association between the objective food environment and weight outcomes was weak. However, it was associated with the subjective perception of the food environment and physical activity levels (correlation coefficients detailed in Supplementary Material 2). This suggests that the objective food environment may not directly influence weight outcomes but could exert an effect through mediating mechanisms.
Figure 3
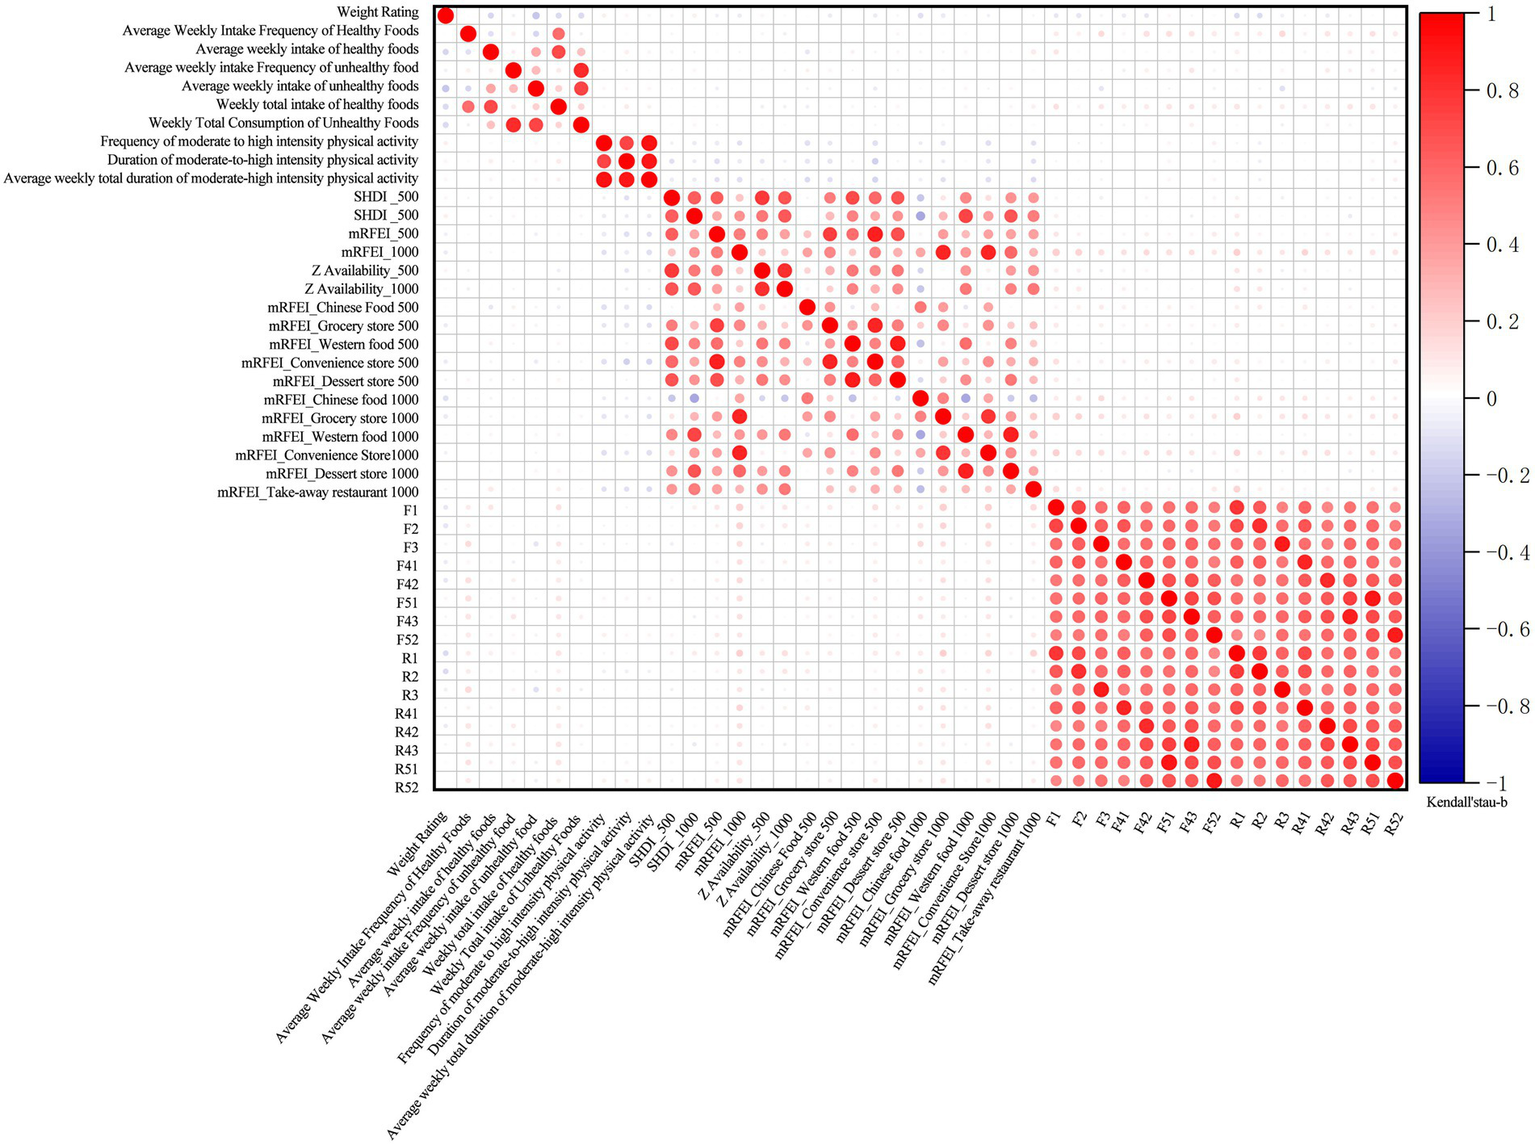
Correlation matrix of individual, behavioral, and environmental factors with weight outcomes.
3.2 Identification of obesogenic factors
3.2.1 Dimensionality reduction
Collinearity diagnostics confirmed multicollinearity across objective/perceived food environments and dietary behavior indicators. Principal component analysis (PCA) was conducted after verifying suitability via the KMO measure: 0.776 (>0.5 threshold) and Bartlett’s Sphericity test: χ2 = 17,896.391, p < 0.001 (Table 4). The PCA extracted 10 principal components (eigenvalues >1) from 38 standardized indicators, cumulatively explaining 77.15% of the variance (Table 5). All communalities exceeded 0.5, confirming robust factor retention.
Table 4
| KMO number of sample suitability measures | 0.776 | |
| Bartlett’s test of Sphericity | Approximate chi-square (math.) | 17896.391 |
| degree of freedom (df) | 903 | |
| Significance | 0 | |
KMO and Bartlett’s sphericity test results.
Table 5
| Number | Factor meaning | Cumulative value in percent | Indicators included in factors |
|---|---|---|---|
| FAC_1 | Integrated perceived neighborhood food environment | 25.37 | F3, R3, F41, R41, F42, R42, F43, R43, F5 1, R51, F52, R52. |
| FAC_2 | 1000-meter modified retail food environment index | 38.99 | mRFEI_1000, mRFEI_ Convenience Store 1000, mRFEI_Groceries1000. |
| FAC_3 | 500-meter modified retail food environment index | 46.63 | mRFEI_500, mRFEI_ Convenience Store 500, mRFEI_Groceries_500. |
| FAC_4 | 500 m-1000 m food availability and diversity | 52.59 | Z Availaibility_1000, Z Availability _500, SHDI_500. |
| FAC_5 | Moderate to high intensity physical activity | 58.05 | Average weekly total duration of moderate-high intensity (min), frequency of moderate-high intensity physical activity (times/week), duration of moderate-high intensity physical activity (min). |
| FAC_6 | Unhealthy eating behavior | 63.32 | Total weekly intake of unhealthy food, Average weekly frequency of unhealthy food intake, average weekly intake of unhealthy food. |
| FAC_7 | Index of food facilities in Chinese restaurants in the 500 m-1000 m buffer zone | 67.30 | mRFEI_ Chinese Restaurants 1000, mRFEI_ Chinese Restaurants 500, SHDI_1000. |
| FAC_8 | Perceived food availability and accessibility | 70.96 | F2, R2, F1, R1 |
| FAC_9 | Healthy food intake | 74.32 | Average weekly intake of healthy food, Total weekly intake of healthy food |
| FAC_10 | Frequency and abundance of healthy food intake | 77.15 | Average weekly frequency of healthy food intake, dietary intake richness |
Implications of principal component factors for dimensionality reduction.
3.2.2 Analysis of obesogenic factors
An ordered logistic regression analysis was conducted between the 10 clustered factors and weight health ratings. The model demonstrated good fit (Table 6), with a significant p value of 0.000 (<0.05). The parallel lines assumption was tested using a Chi-Squared test. For this specific test, a non-significant result (p > 0.05) is desirable, as it indicates that the null hypothesis—that the slope coefficients are equal across all categories of the ordinal outcome—cannot be rejected. Thus, the result (Table 7: χ2 = 43.201, p = 0.056) supports the validity of the proportional odds assumption for the ordered logistic regression model.
Table 6
| Model | −2 Log-likelihood | Cardinality | Degree of freedom | Significance |
|---|---|---|---|---|
| intercept only | 737.131 | |||
| final | 655.727 | 81.403 | 25 | 0.000 |
Model fit information.
Table 7
| Model | -2 Log-likelihood | Cardinality | Degree of freedom | Significance |
|---|---|---|---|---|
| Original hypothesis | 646.939 | |||
| conventional | 603.738b | 43.201c | 30 | 0.056 |
Parallel line test results.
Table 8 presents the full-sample regression outcomes. The analysis identified four factors with statistically significant effects on weight outcomes. At the environmental level, two significant factors were identified: FAC_3 (500-meter modified retail food environment index: β = −0.184, SE = 0.104, p < 0.1, OR = 0.83) and FAC_4 (500–1000 m food availability and diversity: β = 0.225, SE = 0.12, p < 0.1, OR = 1.25). At the individual level, two significant factors emerged: FAC_6 (unhealthy eating behavior: β = −0.191, SE = 0.104, p < 0.1, OR = 0.83), and FAC_8 (perceived food availability and accessibility: β = −0.382, SE = 0.113, p < 0.001, OR = 0.68).
Table 8
| Factor code | Coefficient | S. E. | Wald | p value | 95% CI | OR(EXP(B)) | |
|---|---|---|---|---|---|---|---|
| lcl | ucl | ||||||
| FAC_1 | −0.037 | 0.109 | 0.116 | 0.733 | −0.252 | 0.177 | 0.96 |
| FAC_2 | −0.055 | 0.105 | 0.274 | 0.601 | −0.261 | 0.151 | 0.95 |
| FAC_3 | −0.184 | 0.104 | 3.1 | 0.078 | −0.388 | 0.021 | 0.83 |
| FAC_4 | 0.225 | 0.12 | 3.501 | 0.061 | −0.011 | 0.461 | 1.25 |
| FAC_5 | 0.152 | 0.11 | 1.922 | 0.166 | −0.063 | 0.367 | 1.16 |
| FAC_6 | −0.191 | 0.104 | 3.377 | 0.066 | −0.395 | 0.013 | 0.83 |
| FAC_7 | −0.072 | 0.108 | 0.448 | 0.503 | −0.283 | 0.139 | 0.93 |
| FAC_8 | −0.382 | 0.113 | 11.371 | 0.001 | −0.604 | −0.16 | 0.68 |
| FAC_9 | −0.131 | 0.105 | 1.562 | 0.211 | −0.336 | 0.074 | 0.88 |
| FAC_10 | 0.069 | 0.111 | 0.387 | 0.534 | −0.148 | 0.286 | 1.07 |
| Gender = 0 | 1.006 | 0.227 | 19.588 | 0 | 0.561 | 1.452 | 2.73 |
| Gender = 1 | 0a | ||||||
| Age = 1 | 0.405 | 1.146 | 0.125 | 0.724 | −1.841 | 2.651 | 1.5 |
| Age = 2 | 1.222 | 0.656 | 3.474 | 0.062 | −0.063 | 2.506 | 3.39 |
| Age = 3 | 1.073 | 0.661 | 2.635 | 0.105 | −0.223 | 2.368 | 2.92 |
| Age = 4 | 0.569 | 0.646 | 0.776 | 0.378 | −0.697 | 1.835 | 1.77 |
| Age = 5 | 0.669 | 0.582 | 1.321 | 0.25 | −0.472 | 1.809 | 1.95 |
| Age = 6 | 0a | ||||||
| AFI = I | −0.027 | 0.333 | 0.007 | 0.935 | −0.679 | 0.625 | 0.97 |
| AFI = II | 0.373 | 0.287 | 1.692 | 0.193 | −0.189 | 0.935 | 1.45 |
| AFI = III | 0a | ||||||
| HR = 0 | 0.335 | 0.287 | 1.358 | 0.244 | −0.228 | 0.898 | 1.4 |
| HR = 1 | 0a | ||||||
| EA = 1 | −1.146 | 2.078 | 0.304 | 0.581 | −5.218 | 2.927 | 0.32 |
| EA = 2 | −0.949 | 0.604 | 2.465 | 0.116 | −2.133 | 0.236 | 0.39 |
| EA = 3 | −1.132 | 0.508 | 4.955 | 0.026 | −2.128 | −0.135 | 0.32 |
| EA = 4 | −0.566 | 0.443 | 1.627 | 0.202 | −1.435 | 0.303 | 0.57 |
| EA = 5 | −0.57 | 0.348 | 2.691 | 0.101 | −1.252 | 0.111 | 0.57 |
| EA = 6 | 0a | ||||||
| PC = 0 | −0.357 | 0.271 | 1.736 | 0.188 | −0.889 | 0.174 | 0.7 |
| PC = 1 | 0a | ||||||
| Chronic = 0 | 0.125 | 0.226 | 0.305 | 0.581 | −0.318 | 0.568 | 1.13 |
| Chronic = 1 | 0a | ||||||
Parameter estimates for the full sample model.
Where AFI represents annual household income, which is an ordinal categorical variable, less than 30,000 yen = 1, 30–99,000 yen = 2, 100–149,000 yen = 3, 15–19,000 yen = 4, 20–39,000 yen = 5, 400,000 yen and above = 6. HR represents household registration, which is a unordered categorical variable, local = 1, Non-local = 0. EA represents levels of education, which is an ordinal categorical variable, primary school and below = 1, junior secondary school = 2, senior secondary school/vocational secondary school = 3, college/higher vocational colleges = 4, Bachelor’s degree = 5, postgraduate (master’s degree and above) = 6. PC represents private car ownership, which is a unordered categorical variable, own a car or more = 1, no car = 0.
Among four objective food environment factors, the neighborhood-level Retail Food Environment Index (FAC_3) exhibited negative associations with healthy weight outcomes (β = −0.184, SE = 0.104, p < 0.1, OR = 0.83), significant only at the 500-meter scale. A 1-unit increase in this index reduced healthy weight likelihood by 17%. This counterintuitive finding challenges existing literature that categorizes fresh food markets as health-promoting facilities (44, 45). Food Availability and Diversity (FAC_4) demonstrated positive associations (β = 0.225, SE = 0.12, p < 0.1, OR = 1.25) at the 500-1000m scale, suggesting moderate-scale food resource richness may enhance dietary choices. While perceived food availability and accessibility (FAC_8) significantly influenced weight outcomes (β = −0.382, SE = 0.113, p < 0.001, OR = 0.68), with each unit increase reducing healthy weight likelihood by 32%.
Unhealthy Dietary Behaviors (FAC_6) increased obesity risk (= − 0.191, SE = 0.104, p < 0.1, OR = 0.83), where each unit elevation decreased healthy weight probability by 17%. Notably, Healthy Food Intake (FAC_9) showed no statistical significance (p = 0.211), potentially reflecting nutritional inequality in community food environments that negates individual healthy consumption efforts.
In addition to this, there are other factors that can have an impact on the weight of the population. Gender and levels of education significantly moderated weight outcomes: Females showed 2.81-fold higher likelihood of maintaining healthy weight than males (p < 0.001), potentially reflecting gendered health behavior patterns (46). Bachelor’s/high-school educated groups exhibited lower weight health than postgraduates (OR = 0.31/0.54, p < 0.01), suggesting positive educational gradients in weight management. Non-significant factors included age, income, vehicle ownership, chronic conditions, and substance use.
3.2.3 Obesogenic neighborhood typology
Based on regression outcomes from Section 3.2 (Table 8), we analyzed 164 weight-abnormal cases (overweight samples: N = 131, 79.8%; obesity samples: N = 33, 20.2%) from the full sample (N = 405). Key obesogenic factors (FAC_3, FAC_6, FAC_8) were extracted for cluster analysis, and the elbow method identified three clusters as optimal, corresponding to distinct obesogenic neighborhood types (Table 9). The results reveal three primary obesogenic community types within the survey sample: Type I-Objective deprived (N = 10, 6.0%), Type II-Objective overloaded (N = 37, 22.5%), and Type III-Objective overloaded-Dietary behavior integrated (N = 117, 71.3%).
Table 9
| Clustering results | |||
|---|---|---|---|
| Cluster I | Cluster II | Cluster III | |
| 500-meter modified retail food environment index | 0.3165 | 0.8075 | 0.7776 |
| Unhealthy eating behavior | 0.6311 | 0.4577 | 0.8297 |
| Perceived food availability and accessibility | 0.5151 | 0.5195 | 0.5004 |
| Number of cases | 10 | 37 | 117 |
| Total | 164 | ||
| Type | Objective deprived | Objective overloaded | Objective overloaded-dietary behavior integrated |
K-means clustering results.
Type I communities (N = 10, 6.0%), categorized as Objectively resource-deficient type, demonstrated the lowest sample size and objective food environment index (FAC_3 = 0.3165) while maintaining normative levels in perceived healthy food accessibility (FAC_8 = 0.5151) and dietary behaviors (FAC_6 = 0.6311). Predominantly located in suburban areas, these communities exhibited underdeveloped urban infrastructure compared to central districts, coupled with significantly younger demographics (Mean Age Group = 4.04). The observed subject-object environmental cognition discrepancy may stem from rapid lifestyle transformations among Chinese youth, characterized by diversified food acquisition methods and emerging digital food environments (DFEs). Notably, food delivery services have effectively decoupled dietary accessibility from physical spatial constraints (47).
Type II communities (N = 37, 22.5%), identified as objectively resource-overload type, presented the highest objective retail food environment index (FAC_3 = 0.8075) with minimal unhealthy dietary behaviors (FAC6 = 0.4577), yet paradoxically exhibited elevated obesity risk (standardized OR = 1.38). This cohort demonstrates that prolonged exposure to food-dense environments elevates obesity susceptibility despite self-reported healthy dietary practices. Socioeconomically disadvantaged populations within these communities (Mean AHI Type = 1.59) potentially face dual challenges: cognitive biases in nutritional assessment and economic constraints limiting dietary diversity, typically manifesting as carbohydrate-dominated nutritional patterns that paradoxically exacerbate metabolic risks.
Type III communities (N = 117, 71.3%), classified as behavior-driven integrated type, constituted the predominant urban distribution. These communities exhibited elevated objective food environment indices (FAC_3 = 0.7776), maximal unhealthy dietary behaviors (FAC_6 = 0.8297), and intermediate perceived food accessibility (FAC_8 = 0.5004). The identified obesogenic pathway aligns with established food environment models, demonstrating synergistic effects of food swamp (excessive unhealthy food outlets) and food desert (limited healthy food access) configurations (48). Chronic exposure to this dual environmental stressor – nutritional scarcity perception amidst hyper-available obesogenic foodscapes – likely drives sustained unhealthy dietary patterns through environmental-behavioral interactions.
4 Discussion
This study investigates the impacts of objective food environments, perceived food accessibility, and dietary behaviors on residents’ weight outcomes at the community scale in Tianjin, China, while establishing an obesogenic community typology based on localized determinants. Results reveal significant associations between food environment characteristics, dietary patterns, and obesity risks. Increased proportions of fresh vegetable outlets, heightened perceived accessibility, and frequent unhealthy dietary behaviors were associated with elevated obesity risks, whereas greater food environment diversity correlated with reduced risks. Spatial analysis demonstrated scale-dependent heterogeneity in environmental effects. Using k-means clustering, three obesogenic community types were identified: the majority (71.34%) exhibited high objective environmental risks combined with prevalent unhealthy eating behaviors, reflecting a distinctive obesogenic landscape in middle-income urban settings. These findings highlight the necessity for policymakers and urban planners to prioritize context-specific strategies that integrate food environment optimization with behavioral interventions in health-conscious urban governance.
Our study reveals a paradoxical association between excessive community provision of fresh produce and increased obesity risk, which invites a reconsideration of the conventional health benefits attributed to the Retail Food Environment Index (RFEI) (49, 50) across both objective and perceived dimensions. Specifically, elevated modified Retail Food Environment Index (mRFEI) values within 500-meter buffers showed positive associations with obesity (β = −0.184, p = 0.078, OR = 0.83), while heightened perceived food accessibility similarly correlated with elevated obesity risk (β = −0.191, p = 0.066, OR = 0.83). Previous studies using either RFEI metrics or perceptual evaluations generally associate higher densities of fresh fruit and vegetable outlets with lower obesity risks (44, 45, 50–52) However, 90% of these studies were conducted in high-income countries such as those in North America and Europe, with no universally applicable standards due to contextual complexities (17). Both mRFEI and perceptual measures in our study indicate that fresh produce markets—retail food facilities conventionally deemed healthy—may unexpectedly elevate obesity risks. Parallel concerns emerge from a Guatemalan study revealing 42% misclassification errors in traditional RFEI’s “healthy” food outlet categorization (49). Research in Hong Kong also demonstrates significantly higher densities of both healthy and unhealthy food outlets compared to findings in the United States, United Kingdom, and Canada (53).
These disparities likely stem from China’s unique built environment, dietary habits, and food facility characteristics. Regarding the built environment, Chinese urban areas exhibit high-density development patterns that enhance accessibility to diverse food facilities. Government-led infrastructure initiatives, such as ubiquitous wet markets (54), render “food deserts” virtually nonexistent. Paradoxically, communities with high Retail Food Environment Index values often feature monotonous food supply options, potentially increasing obesity risks by limiting dietary diversity. In terms of dietary behavior, fresh produce markets—perceived as scarce “healthy facilities” in Global North studies (8, 55, 56)—are deeply embedded in Chinese daily life. Higher perceived accessibility to these facilities may amplify total caloric intake (regardless of food healthiness) through habitual purchasing patterns (57). Furthermore, Chinese fresh food retail outlets frequently sell both healthy items (e.g., vegetables and fruits) and energy-dense snacks (e.g., fried foods), complicating their health impacts through heterogeneous product offerings.
Another key finding reveals scale-dependent effects of neighborhood food environments on residents’ weight outcomes. Our analysis demonstrates that the obesogenic effects of the Retail Food Environment Index (RFEI) become insignificant at larger spatial scales (1000m radius), with obesity risk showing significant association only with facilities within the immediate living area (500m radius). Notably, improved food accessibility within the 500–1000m range significantly enhanced weight-related health outcomes. This spatial gradient aligns with existing evidence (50) documented similar scale dependence in Edmonton, Canada, where food environment impacts emerged at 800m but dissipated at 1600m. However, these spatial patterns exhibit geographic variability: Bodor et al. (44) identified significant obesogenic effects up to 2000m in New Orleans, while Acciai et al. (58) observed beneficial BMI associations with small grocery stores within 0.4km in New Jersey’s low-income communities. The 500-1000m health effect window in our study likely reflects China’s distinctive urban morphology characterized by gated residential communities. Typical Chinese neighborhood units (300-500m radius) concentrate daily amenities through planned development, creating concentrated foodscape exposures. This spatial configuration intensifies food environment impacts at intermediate scales, as residents’ routine activities remain anchored to these planned service clusters. The observed effects may stem from the compound interaction between objective deprivation (limited healthy options in immediate vicinity) and behavior-driven integrated factors (travel patterns constrained by community design).
Through K-means clustering analysis, we identified three distinct obesogenic community typologies in Tianjin. The most prevalent type, Type III-Behaviorally Dominant Composite Obesogenic, is characterized by abundant objective food environments yet persistent unhealthy dietary behaviors among residents. Type I communities, conversely, exhibit limited objective food infrastructure but still face obesity risks, often located in suburban areas with younger populations. Here, digital food environments (e.g., food delivery platforms) compensate for physical food access deficiencies (47). Meanwhile, Type II communities reveal a critical cognitive dissonance: residents self-report minimal unhealthy dietary behaviors despite elevated obesity risks, reflecting widespread misconceptions about healthy eating. In China, many individuals—particularly older adults and lower-income groups—equate high carbohydrate intake (e.g., rice, noodles) with nutritional adequacy, overlooking balanced protein, dietary fats, and fiber consumption (59). Compared to these studies, the addition of food environment indicators based on residents’ subjective perceptions in this study helps to bridge this gap.
Our findings reaffirm the established pathway linking unhealthy food environments and dietary behaviors to obesity in China, while also exposing a health perception gap between objective and perceived environments. This misalignment mirrors recent studies (
60,
61), such as Philadelphia-based research demonstrating that perceived food environments better capture local fresh produce quality and affordability than objective metrics (
62)—insights unattainable through purely environmental audits. Current obesogenic interventions, particularly those targeting nutritional inequality in developing countries, disproportionately emphasize improving healthy food accessibility or walkability. These results necessitate a paradigm shift for policymakers and planners: optimizing objective environments alone proves insufficient. We advocate for contextualized interventions that address both foodscape realities and residents’ health literacy, including:
Redefining “healthy” food facilities through community-engaged assessments.
Developing typology-specific strategies (e.g., digital food environment regulation for Type I; nutrition education for Type II).
Integrating multi-scalar planning frameworks based on the link between physical infrastructure and behavioral factors.
This study has some limitations, which include the cross-sectional design’s inability to resolve endogeneity and omitted variables. First, the cross-sectional design of the questionnaire data limits causal inference due to potential reverse causality, which requires longitudinal or experimental designs to resolve. Second, while obesity involves multifactorial determinants, this analysis may omit other dimensions: (1) Built environment factors: open spaces, sports facilities, and street walkability. (2) Individual-level confounders: perceived environmental stress, regional dietary preferences, and household food cultures. (3) Geographical spillovers: workplace/school food environments.
Despite these constraints, the study illuminates middle-income countries’ unique obesogenic foodscapes, offering critical insights for health-promoting urban governance. Future research should adopt longitudinal designs and expand geographical samples to disentangle the complex interplay between food environments, cultural norms, and dietary transitions in Global South countries.
Statements
Data availability statement
The raw data supporting the conclusions of this article will be made available by the authors, without undue reservation.
Ethics statement
The studies involving humans were approved by the Biomedical Ethics Review Committee at Dalian University of Technology. The studies were conducted in accordance with the local legislation and institutional requirements. Written informed consent for participation was not required from the participants or the participants’ legal guardians/next of kin in accordance with the national legislation and institutional requirements.
Author contributions
YS: Investigation, Methodology, Writing – original draft. WL: Conceptualization, Methodology, Project administration, Supervision, Writing – review & editing. JG: Data curation, Formal analysis, Investigation, Visualization, Writing – original draft. YY: Funding acquisition, Project administration, Resources, Supervision, Writing – review & editing. TW: Data curation, Project administration, Writing – review & editing.
Funding
The author(s) declare that financial support was received for the research and/or publication of this article. This work was supported by the Social Science Foundation of Liaoning Province (L21BSH003).
Acknowledgments
We thank the funders who supported this research through contributions to the Social Science Foundation of Liaoning Province and Fundamental Research Funds for the Central Universities.
Conflict of interest
The authors declare that the research was conducted in the absence of any commercial or financial relationships that could be construed as a potential conflict of interest.
Generative AI statement
The author(s) declare that no Gen AI was used in the creation of this manuscript.
Any alternative text (alt text) provided alongside figures in this article has been generated by Frontiers with the support of artificial intelligence and reasonable efforts have been made to ensure accuracy, including review by the authors wherever possible. If you identify any issues, please contact us.
Publisher’s note
All claims expressed in this article are solely those of the authors and do not necessarily represent those of their affiliated organizations, or those of the publisher, the editors and the reviewers. Any product that may be evaluated in this article, or claim that may be made by its manufacturer, is not guaranteed or endorsed by the publisher.
Supplementary material
The Supplementary material for this article can be found online at: https://www.frontiersin.org/articles/10.3389/fpubh.2025.1665021/full#supplementary-material
Footnotes
References
1.
Torres SJ Nowson CA . Relationship between stress, eating behavior, and obesity. Nutrition. (2007) 23:887–94. doi: 10.1016/j.nut.2007.08.008
2.
Brown PJ . Culture and the evolution of obesity. Hum Nat. (1991) 2:31–57. doi: 10.1007/BF02692180
3.
Papas MA Alberg AJ Ewing R Helzlsouer KJ Gary TL Klassen AC . The built environment and obesity. Epidemiol Rev. (2007) 29:129–43. doi: 10.1093/epirev/mxm009
4.
Sallis JF Glanz K . Physical activity and food environments: solutions to the obesity epidemic. Milbank Q. (2009) 87:123–54. doi: 10.1111/j.1468-0009.2009.00550.x
5.
Cobb LK Appel LJ Franco M Jones-Smith JC Nur A Anderson CAM . The relationship of the local food environment with obesity: a systematic review of methods, study quality, and results. Obesity. (2015) 23:1331–44. doi: 10.1002/oby.21118
6.
Gamba RJ Schuchter J Rutt C Seto EYW . Measuring the food environment and its effects on obesity in the United States: a systematic review of methods and results. J Community Health. (2015) 40:464–75. doi: 10.1007/s10900-014-9958-z
7.
Anderson Steeves E Martins PA Gittelsohn J . Changing the food environment for obesity prevention: key gaps and future directions. Curr Obes Rep. (2014) 3:451–8. doi: 10.1007/s13679-014-0120-0
8.
Cummins S Macintyre S . Food deserts—evidence and assumption in health policy making. BMJ. (2002) 325:436–8. doi: 10.1136/bmj.325.7361.436
9.
Ares G Turra S Bonilla L Costa M Verdier S Brunet G et al . WEIRD and non-consensual food deserts and swamps: a scoping review of operational definitions. Health Place. (2024) 89:103315. doi: 10.1016/j.healthplace.2024.103315
10.
Walker RE Keane CR Burke JG . Disparities and access to healthy food in the United States: a review of food deserts literature. Health Place. (2010) 16:876–84. doi: 10.1016/j.healthplace.2010.04.013
11.
Rose D Bodor JN Swalm CM Rice JC Farley TA Hutchinson PL , Deserts in New Orleans? Illustrations of urban food access and implications for policy. Ann Arbor, MI: University of Michigan National Poverty Center/USDA Economic Research Service Research (2009).
12.
Swinburn B Egger G Raza F . Dissecting obesogenic environments: the development and application of a framework for identifying and prioritizing environmental interventions for obesity. Prev Med. (1999) 29:563–70. doi: 10.1006/pmed.1999.0585
13.
Vidal L Alcaire F Brunet G Costa M Verdier S Curutchet MR et al . Validation of secondary data sources of the retail food environment in the capital of Uruguay, an emerging Latin American country. Health Place. (2024) 90:103356. doi: 10.1016/j.healthplace.2024.103356
14.
Lenardson JD Hansen AY Hartley D . Rural and remote food environments and obesity. Curr Obes Rep. (2015) 4:46–53. doi: 10.1007/s13679-014-0136-5
15.
Díez J Bilal U Cebrecos A Buczynski A Lawrence RS Glass T et al . Understanding differences in the local food environment across countries: a case study in Madrid (Spain) and Baltimore (USA). Prev Med. (2016) 89:237–44. doi: 10.1016/j.ypmed.2016.06.013
16.
Turner C Kalamatianou S Drewnowski A Kulkarni B Kinra S Kadiyala S . Food environment research in low- and middle-income countries: a systematic scoping review. Adv Nutr. (2020) 11:387–97. doi: 10.1093/advances/nmz031
17.
Pineda E Stockton J Scholes S Lassale C Mindell JS . Food environment and obesity: a systematic review and Meta-analysis. BMJ Nutr Prev Health. (2024) 7:204–11. doi: 10.1136/bmjnph-2023-000663
18.
Huang L Wang Z Wang H Zhao L Jiang H Zhang B et al . Nutrition transition and related health challenges over decades in China. Eur J Clin Nutr. (2021) 75:247–52. doi: 10.1038/s41430-020-0674-8
19.
Pan X-F Wang L Pan A . Epidemiology and determinants of obesity in China. Lancet Diab Endocrinol. (2021) 9:373–92. doi: 10.1016/S2213-8587(21)00045-0
20.
Ma G . Food, eating behavior, and culture in Chinese society. J Ethnic Foods. (2015) 2:195–9. doi: 10.1016/j.jef.2015.11.004
21.
An R He L Shen MJ . Impact of Neighbourhood food environment on diet and obesity in China: a systematic review. Public Health Nutr. (2020) 23:457–73. doi: 10.1017/S1368980019002167
22.
Tian X. Zhong L. Cramon-Taubadel S. von Tu H. Wang H. Restaurants in the neighborhood, eating away from home and BMI in China PLoS One 11:e0167721 (2016). doi: 10.1371/journal.pone.0167721
23.
Xu H Short SE Liu T . Dynamic relations between fast-food restaurant and body weight status: a longitudinal and multilevel analysis of Chinese adults. J Epidemiol Community Health. (2013) 67:271–9. doi: 10.1136/jech-2012-201157
24.
Zhang M Guo W Zhang N He H Zhang Y Zhou M et al . Association between neighborhood food environment and body mass index among older adults in Beijing, China: a cross-sectional study. Int J Environ Res Public Health. (2020) 17:7658. doi: 10.3390/ijerph17207658
25.
Zhang M Zhang N Zhou M Ma G . Association between neighborhood food environment and dietary diversity score among older people in Beijing, China: a cross-sectional study. Front Nutr. (2022) 9:903214. doi: 10.3389/fnut.2022.903214
26.
Charreire H Casey R Salze P Simon C Chaix B Banos A et al . Measuring the food environment using geographical information systems: a methodological review. Public Health Nutr. (2010) 13:1773–85. doi: 10.1017/S1368980010000753
27.
Lytle LA Sokol RL . Measures of the food environment: a systematic review of the field, 2007-2015. Health Place. (2017) 44:18–34. doi: 10.1016/j.healthplace.2016.12.007
28.
McKinnon RA Reedy J Morrissette MA Lytle LA Yaroch AL . Measures of the food environment: a compilation of the literature, 1990–2007. Am J Prev Med. (2009) 36:S124–33. doi: 10.1016/j.amepre.2009.01.012
29.
Morland K Filomena S . The utilization of local food environments by urban seniors. Prev Med. (2008) 47:289–93. doi: 10.1016/j.ypmed.2008.03.009
30.
Zenk SN Schulz AJ Israel BA Mentz G Miranda PY Opperman A et al . Food shopping Behaviours and exposure to discrimination. Public Health Nutr. (2014) 17:1167–76. doi: 10.1017/S136898001300075X
31.
Bailey RL Merle P Kwon K Yegiyan N . Perceived stress increases susceptibility to visual food cues in fast-food menu selections. Physiol Behav. (2023) 266:114205. doi: 10.1016/j.physbeh.2023.114205
32.
Portel C d S da Silva WP Tavares Filho ER Pagani MM Pimentel TC Mársico ET et al . Are healthiness and pleasure dimensions perceived similarly by people with food addiction in Brazil? A case study using holistic sensory methodologies. Food Res Int. (2023) 173:113206. doi: 10.1016/j.foodres.2023.113206
33.
Bai Z . A foreign diet: on the type and consumption of urban Western food and drink in modern times—taking Tianjin in modern times as the case. Dyn Soc Sci. (2021):89–94. Available online at: https://kns.cnki.net/KCMS/detail/detail.aspx?dbcode=CJFQ&dbname=CJFDLAST2021&filename=SKDT202106013
34.
Tianjin Municipal Bureau of Statistics . (2021). Tianjin Municipality’s 2020 Seventh National Population Census Principal Data Bulletin (No. 1). Available online at: https://stats.tj.gov.cn
35.
Chai Y Li C . Urban life cycle planning: from research to practice. City Plann Rev. (2019) 43:9–16, 60. doi: 10.11819/cpr20190503a
36.
Sun D Chai Y . Study on the urban community life sphere system and optimization of public service facilities: a case study of Qinghe area in Beijing. Urban Dev Stud. (2017) 24:7–14, 25,2. doi: 10.3969/j.issn.1006-3862.2016.09.001
37.
Ting P Wang T Fu M Lin R Hong M Zheng Z et al . Prevalence and inequalities of obesity and associated complications in China: a multicentre Nationwide survey. Public Health. (2024) 237:97–106. doi: 10.1016/j.puhe.2024.09.021
38.
National Bureau of Disease Control and Prevention . Guidelines for the prevention and control of overweight and obesity in Chinese adults. (2021). Available online at: https://cread.jd.com/read/startRead.action?bookId=30808569&readType=1 (2021). [Accessed April 28 2025].
39.
California Center for Public Health Advocacy . Searching for healthy food:The food landscape in California cities and counties. (2007). vailable online at: http://www.publichealthadvocacy.org/RFEI/policybrief_final.pdf (Accessed May 15, 2025).
40.
Amin MD Badruddoza S McCluskey JJ . Predicting access to healthful food retailers with machine learning. Food Policy. (2021) 99:101985. doi: 10.1016/j.foodpol.2020.101985
41.
Fedor P. J. Spellerberg I. F. , Shannon–Wiener Index, in Reference module in earth systems and environmental sciences, Elsevier, (Accessed April 11, 2025). Available online at: https://www.sciencedirect.com/science/article/pii/B9780124095489006023, (2013).
42.
Penchansky R Thomas JW . The concept of access: definition and relationship to consumer satisfaction. Med Care. (1981) 19:127–40. doi: 10.1097/00005650-198102000-00001
43.
Yu H Li M Qian G Yue S Ossowski Z Szumilewicz A . A systematic review and Bayesian network meta-analysis comparing in-person, remote, and blended interventions in physical activity, diet, education, and behavioral modification on gestational weight gain among overweight or obese pregnant individuals. Adv Nutr. (2024) 15:100253. doi: 10.1016/j.advnut.2024.100253
44.
Bodor JN Rice JC Farley TA Swalm CM Rose D . The association between obesity and urban food environments. J Urban Health. (2010) 87:771–81. doi: 10.1007/s11524-010-9460-6
45.
Cooksey-Stowers K Schwartz M Brownell K . Food swamps predict obesity rates better than food deserts in the United States. Int J Environ Res Public Health. (2017) 14:1366. doi: 10.3390/ijerph14111366
46.
Dong Y . A sociological analysis of women's weight loss behavior. J Chifeng Univ. (2016) 37:87–8. doi: 10.13398/j.cnki.issn1673-2596.2016.04.035
47.
Kong Y Zhen F Zhang S Chang E Cheng L Witlox F . Unveiling the influence of the extended online-to-offline food delivery service environment on urban residents’ usage: a case study of Nanjing, China. Cities. (2024) 152:105220. doi: 10.1016/j.cities.2024.105220
48.
Jin H Lu Y . SAR-gi*: taking a spatial approach to understand food deserts and food swamps. Appl Geogr. (2021) 134:102529. doi: 10.1016/j.apgeog.2021.102529
49.
Chuvileva YE Manangan A Chew A Rutherford G Barillas-Basterrechea M Barnoya J et al . What north American retail food environment indices miss in Guatemala: cultural considerations for the study of place and health. Appl Geogr. (2024) 164:103204. doi: 10.1016/j.apgeog.2024.103204
50.
Spence JC Cutumisu N Edwards J Raine KD Smoyer-Tomic K . Relation between local food environments and obesity among adults. BMC Public Health. (2009) 9:192. doi: 10.1186/1471-2458-9-192
51.
Althoff T Nilforoshan H Hua J Leskovec J . Large-scale diet tracking data reveal disparate associations between food environment and diet. Nat Commun. (2022) 13:267. doi: 10.1038/s41467-021-27522-y
52.
Morland KB Evenson KR . Obesity prevalence and the local food environment. Health Place. (2009) 15:491–5. doi: 10.1016/j.healthplace.2008.09.004
53.
Zhang T Huang B . Local retail food environment and consumption of fruit and vegetable among adults in Hong Kong. Int J Environ Res Public Health. (2018) 15:2247. doi: 10.3390/ijerph15102247
54.
Li X Zhang H Yu D Li X Zhang H . Research on the configuration method of community convenience commercial facilities driven by network economy: a case study of grocery market. Modern Urban Res. (2020) 2:33–41. Available online at: https://kns.cnki.net/KCMS/detail/detail.aspx?dbcode=CJFQ&dbname=CJFDLAST2020&filename=XDCS202002007
55.
Bastian ND Swenson ER Ma L Na HS Griffin PM . Incentive contract design for food retailers to reduce food deserts in the US. Socio Econ Plan Sci. (2017) 60:87–98. doi: 10.1016/j.seps.2017.03.003
56.
McPhail D Chapman GE Beagan BL . The rural and the rotund? A critical interpretation of food deserts and rural adolescent obesity in the Canadian context. Health Place. (2013) 22:132–9. doi: 10.1016/j.healthplace.2013.03.009
57.
Wei Y . Effect of Built Environment on Frequency of Food Market Use for Elderly and Planning Intervention. Dalian, China:Dalian University of Technology (2020).
58.
Acciai F DeWeese RS Yedidia MJ Lloyd K Tulloch D DeLia D et al . Differential associations between changes in food environment and changes in BMI among adults living in urban, low-income communities. J Nutr. (2022) 152:2582–90. doi: 10.1093/jn/nxac186
59.
Cao Y Yang Y Chang Q . The supply and demand relationship of corn in China urban the big food concept: issues and challenges. Chin J Agric Res Reg Plan. (2025):1–11.
60.
D’Hooghe S Inaç Y Vandevijvere S Deforche B Ridder K Van Dyck D et al . Exploring the multiple dimensions of perceived food access in the local food environment in Flanders: perceptions of adults in socioeconomically disadvantaged situations. Appetite. (2024) 203:107609. doi: 10.1016/j.appet.2024.107609
61.
Gao X Engeda J Moore LV Auchincloss AH Moore K Mujahid MS . Longitudinal associations between objective and perceived healthy food environment and diet: the multi-ethnic study of atherosclerosis. Soc Sci Med. (2022) 292:114542. doi: 10.1016/j.socscimed.2021.114542
62.
Alber JM Green SH Glanz K . Perceived and observed food environments, eating behaviors, and BMI. Am J Prev Med. (2018) 54:423–9. doi: 10.1016/j.amepre.2017.10.024
63.
Murray B . Social ecology and communalism. Chico, America:AK Press (2007).
64.
Tianjin Municipal Health and Health Committee . (2021). Tianjin Municipal Report on the Health Status of Residents. Available online at: https://wsjk.tj.gov.cn/XWZX6600/YQFKDT1752/202112/W020211224546089911804.pdf [Accessed April 15, 2025].
Summary
Keywords
neighborhood food environment, overweight and obesity, perceived measurement, objective assessment, food deserts
Citation
Sun Y, Lu W, Gu J, Yao Y and Wan T (2025) Unveiling the obesogenic neighborhood food environment factors and typologies in Tianjin, China: an integrative analysis of perceived and objective measures. Front. Public Health 13:1665021. doi: 10.3389/fpubh.2025.1665021
Received
13 July 2025
Accepted
27 October 2025
Published
21 November 2025
Volume
13 - 2025
Edited by
Leslie Landaeta-Díaz, Universidad de las Américas, Chile
Reviewed by
Aida Turrini, Independent Researcher, Scansano, Italy
Emyr Reisha Isaura, Airlangga University, Indonesia
Updates
Copyright
© 2025 Sun, Lu, Gu, Yao and Wan.
This is an open-access article distributed under the terms of the Creative Commons Attribution License (CC BY). The use, distribution or reproduction in other forums is permitted, provided the original author(s) and the copyright owner(s) are credited and that the original publication in this journal is cited, in accordance with accepted academic practice. No use, distribution or reproduction is permitted which does not comply with these terms.
*Correspondence: Yishu Yao, yaoyishu@dlut.edu.cn; Wei Lu, lw18641189998@qq.com
Disclaimer
All claims expressed in this article are solely those of the authors and do not necessarily represent those of their affiliated organizations, or those of the publisher, the editors and the reviewers. Any product that may be evaluated in this article or claim that may be made by its manufacturer is not guaranteed or endorsed by the publisher.