 Christoph Säckel
 Regine von Klitzing
 Renée Siegel2
 Michael Vogel
- 1Institute for Condensed Matter Physics, Technische Universität Darmstadt, Darmstadt, Germany
- 2Inorganic Chemistry III and Northern Bavarian NMR Centre, University of Bayreuth, Bayreuth, Germany
We use 2H nuclear magnetic resonance to study the dynamics of deuterated water in a solution of linear poly (N-isopropyl acrylamide) (pNIPAM, 4 wt%) across its coil-to-globule transition at a lower critical solubility temperature (LCST) around 32°C. In agreement with previous studies, we find that the 2H spin-lattice (T1) and, in particular, spin-spin (T2) relaxation times abruptly decrease when heating through the LCST, indicating that the polymer collapse causes an emergence of a water fraction with strongly reduced mobility. To quantify the dynamics of this slow water fraction, we exploit the fact that 2H field-cycling relaxometry allows us to measure the spectral density of the water reorientation in a broad frequency range. We find that the slow water fraction is characterised by a broad logarithmic Gaussian distribution of correlation times (σLG = 2.3), which is centred about τLG ≈ 10–9 s near the LCST. Hence, the common assumption of a Debye spectral density does not apply. We argue that a minor water fraction, which is located inside the pNIPAM globules and shows dynamics governed by the disordered polymer matrix, accompanies a major water fraction with bulk-like dynamics above the LCST. The former fraction amounts to about 0.4 water molecules per NIPAM monomer. Several findings indicate fast exchange between these bound and free water fractions on the T1 and T2 time scales.
1 Introduction
So-called smart polymers have attracted a lot of scientific interest (Lu and Ballauff, 2011; Scherzinger et al., 2014; Sierra-Martin et al., 2014; Halperin et al., 2015) due to their ability to reversibly collapse upon external stimuli such as temperature, irradiation with light, or solvent composition. This gives them great potential in technological applications such as drug delivery (Nolan et al., 2006), nano sensors and -valves (Richter et al., 2004), anti-fouling coatings (Yu et al., 2014) of, e. g. artificial joints and to grow cell cultures (Matsuda et al., 2007; Schmidt et al., 2010). They are also considered as possible model systems for DNA folding and protein denaturation (Yang et al., 2017). The most intensively studied representative of this class of polymers is poly (N-isopropyl acrylamide) (pNIPAM) due to a sharp lower critical solubility temperature (LCST) of 32°C (Halperin et al., 2015), which is near the human body temperature, rendering this polymer a promising candidate for applications in medicine and biology.
Tailoring pNIPAM solutions to a specific application requires a thorough understanding of the phenomena that affect its coil-to-globule transition. In this regard, pNIPAM and its derivatives continue to draw a lot of attention as, despite decades of research (Halperin et al., 2015), important aspects of the mechanism of the transition remain unclear. The situation becomes even more complicated in some mixed aqueous solvents (Backes et al., 2017a; b), where recently several competing models have been reviewed (Bharadwaj et al., 2022), or by the addition of salts (Zhang et al., 2007). There is, however, general agreement that the solvent plays an essential role for pNIPAM’s coil-to-globule transition. In particular, the breakage of polymer-water hydrogen bonds is considered to be a major factor for the chain collapse, as can also be seen in studies using ultrasound to quickly trigger the coil-to-globule transition of linear pNIPAM and pNIPAM microgels (Rahimzadeh et al., 2021; Stock et al., 2023; 2024). As such, it is important to investigate the polymer-water interplay around the LCST.
Several studies have set out to describe the water behaviour across the LCST of pNIPAM (gels) using, e. g., neutron scattering (Maccarrone et al., 2014; Hammouda et al., 2015; Niebuur et al., 2019), dielectric spectroscopy (Shiraga et al., 2015; Vijayakumar et al., 2022; Balachandar et al., 2023), differential scanning calorimetry (Lai et al., 2013) and molecular dynamics simulations (Podewitz et al., 2019). An inherent problem of these approaches is that the water fraction interacting with the polymer is small in the dilute or semi-dilute regimes and, hence, it is difficult to single out signal contributions, which directly inform about the pNIPAM-water interaction. Nevertheless, several studies deduced the number of bound water molecules per pNIPAM monomer at temperatures below and above the polymer’s collapse (Ono and Shikata, 2006; Yang et al., 2017; Yanase et al., 2018). However the results vary significantly from 8 to 34 below the LCST and 0–3 above this temperature. Moreover, the studies differed with regard to, e. g., polymer concentration and polymer architecture, hampering direct comparisons.
Nuclear magnetic resonance (NMR) experiments proved to be very suitable to determine microscopic details of the coil-to-globule transition of pNIPAM (copolymers) in solutions, gels, and at interfaces. Important earlier results can be found in a comprehensive review article (Spěváček, 2009). Performing 1H and, in some cases 13C, line-shape and relaxation-time studies, many researchers focused on changes of polymer dynamics during the chain collapse (Ohta et al., 1991a; Tokuhiro et al., 1991; Zeng et al., 1997; Deshmukh et al., 2000; Díez-Peña et al., 2002; Andersson and Maunu, 2006; Kametani et al., 2017). Furthermore, 1H NMR diffusometry yielded information about the temperature-dependent hydrodynamic radius (Larsson et al., 2001; Rusu et al., 2006; Spěváček, 2009). Other studies analysed 1H and 2H spin-lattice (T1) and spin-spin (T2) relaxation times to investigate the dynamics of water around the LCST (Ohta et al., 1991b; Tanaka et al., 1998; Sun et al., 2003; Sierra-Martin et al., 2005; Rusu et al., 2006; Kametani et al., 2017; Chakraborty et al., 2018). Commonly, a strong drop of the T1 and T2 times was observed when heating through the LCST. This finding was taken as evidence that, above the transition, a water fraction, which hardly interacts with the polymer and exhibits fast bulk-like dynamics, coexists with a water fraction, which is captured inside the pNIPAM globules and shows strongly slowed down dynamics. In the dilute and semi-dilute regimes, which provide most straightforward information about pNIPAM’s coil-to-globule transition, fast exchange between these “free” and “bound” water species establishes a common relaxation behaviour of all spins and, hence, the measured T1 and T2 times depend on both the respective fractions and mobilities (Sierra-Martin et al., 2005; Rusu et al., 2006; Starovoytova and Spěváček, 2006). Unfortunately, these contributions cannot reliably be disentangled based on measurements at a single Larmor frequency ωL, limiting the available dynamical information. Only for concentrated solutions, water species with different spin-relaxation behaviours were observed in T1-T2 correlation maps when pNIPAM aggregates in the gel phase above the LCST (Kametani et al., 2017).
Here, we employ 2H NMR to study the solvent dynamics in a semi-dilute pNIPAM-D2O mixture (4 wt%). In addition to conventional measurements of the T1 and T2 relaxation times, we apply field-cycling relaxometry (FCR). While conventional approaches measure the T1 and T2 times in fixed magnetic fields and, thus, probe the spectral density of water dynamics at a single or at most very few Larmor frequencies, FCR uses an electromagnet to rapidly switch the applied magnetic field and, in this way, observes the spectral density over a broad frequency range (Kimmich and Anoardo, 2004; Kruk et al., 2012; Fujara et al., 2014; Steele et al., 2016; Becher et al., 2022). The capabilities of 1H FCR were exploited to characterise differences in polymer dynamics below and above the LCST (Kariyo et al., 2005). Here, 2H FCR allows us to observe that a slow water fraction develops during pNIPAM’s coil-to-globule transition and to quantitatively determine its spectral density. The analysis indicates strong dynamical heterogeneity or, in other words, strong deviations from a Lorentzian shape of the spectral density, which was often tacitly assumed in previous NMR studies.
2 Theoretical background
In 2H NMR relaxation experiments, we probe fluctuations in the quadrupolar frequency, which is given by (Schmidt-Rohr and Spiess, 1994):
Here, δ and η are the anisotropy and asymmetry parameters of the quadrupolar coupling tensor and the angles θ and ϕ describe the molecular orientation with respect to the applied magnetic field B0. In our case of D2O deuterons, the quadrupolar interaction is described by δ ≈ 2π × 161 kHz and η ≈ 0.1 (Sattig and Vogel, 2014). Under such circumstances, effects of the asymmetry parameter (∼η2) are negligible in 2H NMR relaxation studies and the rotational correlation function F2(t) of the second Legendre polynomial P2 (cos θ) is probed in these approaches see Eq. 1. Explicitly, the 2H T1 and T2 relaxation times depend on the Fourier transform of F2(t), i.e., the spectral density J2(ω), according to (Abragam, 1999):
Similarly, in supplementary 17O NMR relaxation measurements on a pNIPAM-
Usually, it is assumed that molecular reorientation is described by a single correlation time τ and that the spectral density has a Lorentzian shape, JL(ω) = τ/(1 + ω2τ2). However, in disordered systems, molecular dynamics is often described by broad distributions of correlation times. Various empirical functions were proposed to consider such dynamical heterogeneity (Beckmann, 1988). The Cole-Davidson (CD) spectral density,
describes an asymmetric broadening of the distribution of correlation times, where γCD is a width parameter. It enabled successful analyses of temperature-dependent T1 and T2 times for many (viscous) liquids (Rössler and Sillescu, 1984; Dries et al., 1988; Böhmer et al., 2001; Becher et al., 2022). Therefore, one may expect that JCD(ω) also characterises the reorientation of free water at sufficiently large distances from the pNIPAM molecules. A symmetric broadening can be described by the logarithmic Gaussian (LG) spectral density:
Here, the time constant τLG and the standard deviation σLG characterise the position and width of the underlying distribution of correlation times. Such LG behaviour results from the Arrhenius law when a Gaussian distribution of energy barriers governs thermally activated motion (Beckmann, 1988). Gaussian energy landscapes are characteristic for many disordered materials, including polymer matrices. For example, LG behaviour was found for rotational motion of plasticizer molecules in polymer matrices (Jansen-Glaw et al., 1989). Hence, one may speculate that JLG(ω) also describes the reorientation of water captured inside pNIPAM globules.
In the limit of fast motion, i. e., when ωLτ ≪ 1 holds for all correlation times from the distribution, T1 = T2 is obeyed. Moreover, the T1 and T2 relaxation times can be related to the mean correlation time ⟨τ⟩ of the distribution in a model-free way. Specifically, in this limit, J2 = ⟨τ⟩, independent of the exact value of the Larmor frequency and the shape of the distribution, leading to
Hence, in the limit ωLτ ≪ 1, T1 and T2 increase/decrease when molecular dynamics becomes faster/slower. For the above CD and LG distributions, the mean correlation times ⟨τ⟩ are related to the respective parameters by.
and
In the above discussion, it was assumed that exchange between molecules with diverse dynamics is fast on the time scale of the spin-lattice and spin-spin relaxation measurements so that common T1 and T2 times are established. This pertains in particular to possible free and bound water species in the pNIPAM solution. This commonly used assumption of rapid exchange was supported by the observation of single exponential relaxation behaviours (Van der Beek et al., 1991; Sierra-Martin et al., 2005; Rusu et al., 2006; Starovoytova and Spěváček, 2006). Furthermore, a hydrogen-exchange study (Ahmed et al., 2009) found that the diffusion of water molecules in and out of pNIPAM globules was not significantly hindered even in the collapsed state of pNIPAM. Finally, high-resolution NMR spectra (Starovoytova and Spěváček, 2006) of dilute pNIPAM solutions did not show separate lines of free and bound water although both species are expected to have a resolvable chemical shift difference of 0.1 ppm (Wang et al., 2009; Hofmann et al., 2013). Likewise, high-resolution spectra of the present sample do not provide evidence for distinguishable lines associated with different water species, implying that exchange between the different water fractions occurs with a rate higher than the inverse line distance, i. e., faster than ∼10 ms; see Supplementary Material.
Based on these and other (Ono and Shikata, 2006; Nachaki et al., 2022) findings, we conclude that the fast-exchange limit is obeyed in the present experiments. In such a situation, the measured relaxation rates 1/Ti (i = 1, 2) are given by the rate average of the individual contributions. For example, when bound and free water species with individual relaxation times
Here, R and 1 − R are the fractions of bound and free water, respectively, and
3 Experimental details
3.1 Sample preparation
D2O with 99.9% isotopic purity and (not crosslinked) pNIPAM with Mn = 40,000 g mol−1 were purchased from Sigma Aldrich. D2O was used as obtained, while pNIPAM was vacuum dried over night at 1.6 × 10⁻⁵ mbar before sample preparation. After drying, pNIPAM was quickly filled in NMR glass tubes and weighted before the solvent was added. For the sample used in the home-built spectrometers, 3.25 mg and 77.9 µL of dried polymer and D2O, respectively, were used, resulting in a polymer concentration of 3.6 wt%, or, equivalently, a monomer concentration of 0.6 mol%. After the pNIPAM was dissolved (within a few minutes), the open end of the sample tube was flame-sealed while damage to the sample material was avoided by immersing the lower part in liquid nitrogen. The sample for the Bruker spectrometer contained 29.85 mg of dried polymer and 650 µL of D2O. This sample was sealed with a pressure cap and sealing film. After preparation, the samples were repeatedly weighted over the course of several weeks to verify that they were leak-proof during all measurements.
3.2 NMR measurements
Fixed-field 2H T1 and T2 measurements were conducted at several B0 fields produced by superconducting magnets. The corresponding 2H Larmor frequencies (ωL/2π) amounted to 24.8 MHz, 46.1 MHz, and 153 MHz. Explicitly, we used two home-built spectrometers for the experiments at the two smaller Larmor frequencies and a Bruker 1 GHz-AEON spectrometer for the highest frequency. In these setups, the T1 times were measured using the inversion or saturation recovery pulse sequences. The waiting times between scans were 5T1 to ensure full equilibration of the magnetisation but at least 2 s to avoid unwanted sample heating. The T2 times were measured with the CPMG sequence (Carr and Purcell, 1954; Meiboom and Gill, 1958). To avoid sample heating also in these experiments, the number of pulses was limited to ∼30 per scan and the waiting time between scans was increased to 30 s. In order to nonetheless cover the entire decay of the transversal magnetisation, we combined measurements with various interpulse delays while taking care of sufficient overlap of the respective magnetisation decays. In doing so, we ensured that, even for longer interpulse delays, diffusion during these periods did not interfere with echo formation and, thus, did not impair the measured T2 times. Supplementary 17O T1 measurements were performed using the same methodology at a 17O Larmor frequency of 40.7 MHz.
A detailed description of the home-built field cycling relaxometer can be found elsewhere (Kresse et al., 2011). Briefly, an electromagnet is used to quickly switch the applied magnetic field B0 and, in this way, measure the T1 relaxation time in a broad range of Larmor frequencies ωL. In particular, the field-cycling approach allows one to overcome the low signal-to-noise ratios inherent to T1 measurements at low magnetic fields. In total, our 2H field cycling experiments cover a range of 5 kHz ≤ ωL/(2π) ≤ 4.6 MHz.
In the home-built fixed field setups, a cryostat operated by utilising liquid nitrogen as cooling agent was employed to set temperature. For the Bruker spectrometer and the field-cycling relaxometer, temperature was controlled using a tempered gas flow. In all setups, temperature accuracy was better than ±1 K and temperature stability better than ±0.5 K. The 90° pulse lengths were ∼3 µs in the home-built setups, including the field-cycling relaxometer, while they amounted to ∼200 µs in the 153 MHz setup. Further details about the home-built setups can be found in previous work (Schiller and Vogel, 2024).
To determine T1 relaxation times, we fit the experimental magnetization data M(t) with a modified stretched exponential function:
Here, A = 1 and A = 2 in saturation-recovery and inversion-recovery experiments, respectively, while the fit parameter M1 serves to adapt the equation to experimental imperfections or the situation in field-cycling measurements. The stretching parameter β in Eq. 10 allows for possible nonexponential 2H spin-lattice relaxation in disordered materials. However, the analysis revealed that the recovery occurs in a single exponential manner in the present measurements, i. e., β ≈ 1, see Supplementary Material. As aforementioned, this finding means that, provided slow and fast subensembles exist, rapid exchange between them occurs on the T1 time scale. With this in mind, we fit the CPMG data with single exponential decays to extract T2 times.
4 Results
4.1 Measurements in fixed fields
In Figure 1, we show 2H T1 and T2 relaxation times of D2O in the pNIPAM mixture for a fixed Larmor frequency of ωL = 2π ⋅46 MHz. Both T1 and T2 react to the LCST of pNIPAM with a rapid decrease. Similar changes across the LCST were observed in previous NMR works (Ohta et al., 1991b; Tanaka et al., 1998; Schönhoff et al., 2002; Kariyo et al., 2005; Sierra-Martin et al., 2005; Kametani et al., 2017). While T1 ≈ T2 below the LCST, as expected for fast liquid dynamics with ωLτ ≪ 1, T2 is notably shorter than T1 above the coil-to-globule transition. Except near the LCST, both relaxation times increase when the temperature is increased, reflecting the corresponding speedup of water reorientation.
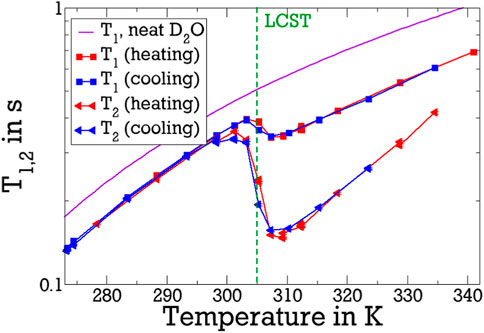
Figure 1. 2H T1 and T2 relaxation times of the D2O-pNIPAM mixture at a Larmor frequency of ωL = 2π ⋅46 MHz. Results obtained during heating and cooling show only minor differences if any. For comparison, data of neat D2O are included as solid line (Hindman et al., 2003). The vertical dashed line marks the LCST.
To remove this trivial effect and focus on the influence of pNIPAM, we renormalise T1 and T2 on their corresponding values in neat D2O (Hindman et al., 2003) in Figure 2. The step-like decrease of T1 and T2 across the LCST is even more apparent on the basis of the renormalised relaxation times. The temperature of the coil-to-globule transition is in agreement with LCST values of 305 K in the literature (Halperin et al., 2015). Note that the LCST transition of pNIPAM was reported to be mildly broadened and shifted to higher temperatures when deuterated solvent is used (Shirota et al., 1999). Moreover, the renormalised data reveal that a heating-cooling hysteresis in the range from around 305 K–315 K is very small, consistent with previous results (Sierra-Martin et al., 2005; Rusu et al., 2006).
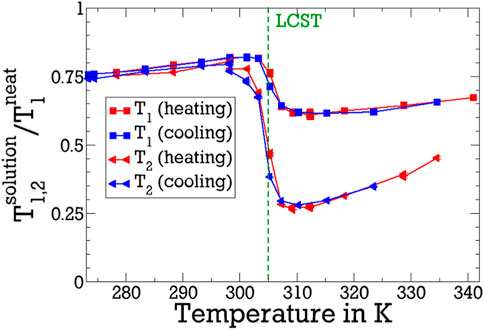
Figure 2. Renormalised spin relaxation times
Naively one might assume that T1 and T2 increase rather than decrease when heating through the LCST because the accessible surface of collapsed pNIPAM is reduced (Vijayakumar et al., 2022) and polymer-water hydrogen bonds are broken so that less solvent molecules are slowed down by the interaction with the polymer. This could, however, be overcompensated if water molecules in contact with pNIPAM experience a particularly strong slowdown when the polymer is collapsed. The observation that T2 is shorter than T1 above the LCST is a first hint that such very slow water fraction emerges during the coil-to-globule transition. Specifically, because T2, unlike T1, depends on J2 (0), see Eqs 2, 3, this difference suggests that, above the LCST, some water molecules do not obey the limit of fast motion (ωLτ ≪ 1) in the fixed-field measurements. Because detailed information about the dynamics of this slow water species is not available from conventional high-field T1 and T2 measurements at a single or at most very few Larmor frequencies, we will use 2H FCR for further quantification below.
Below the LCST, the T1 and T2 times of D2O in the solution are smaller than those in the neat liquid and, hence, the renormalised values of the pNIPAM solutions are smaller than unity. Specifically, the ratio r of the relaxation times of the studied solution and the neat solvent amounts to r ≈ 0.8 well below the LCST. This finding, which again agrees with previous results (Sierra-Martin et al., 2005; Rusu et al., 2006), has several origins. First, it reflects the general increase in viscosity η when adding a solute, which, due to
One might object that the observed drops of the 2H T1 and T2 times across the LCST do not reflect changes of water dynamics but result from altered relaxation behaviour of the small fraction of deuterons, which arrived at the amide groups of the polymer by chemical exchange. For example, one might argue that pNIPAM’s side group motion changes during the coil-to-globule transition such that the amide deuterons exhibit shorter T1 and T2 times above the LCST than below and, as a result, the measured exchange-averaged relaxation times decrease upon heating through this temperature. To dispel this objection, we performed supplementary 17O T1 measurements. In these experiments, chemical exchange with the polymer does not play a role and the results exclusively reflect water (
Thus, in agreement with previous studies (Ohta et al., 1991b; Tanaka et al., 1998; Schönhoff et al., 2002; Kariyo et al., 2005; Sierra-Martin et al., 2005; Kametani et al., 2017), our 2H NMR findings indicated that a slow water fraction emerges during the coil-to-globule transition of pNIPAM. This conclusion was confirmed by new 17O NMR results. However, such measurements at a single Larmor frequency do not allow one to independently determine the amount and the slowdown of the emerging bound water fraction.
4.2 Field cycling relaxometry
Next, we apply 2H FCR to analyse the evolution of the spectral density of D2O reorientation across pNIPAM’s coil-to-globule transition in more detail. In Figure 3, we see that the FCR approach yields T1 times over a frequency range of three orders of magnitude and by adding T1 data from measurements in superconducting magnets more than 4 decades are covered. In this figure, we do not show T1 (ωL) but rather 1/T1 (ωL), which is related more directly to the spectral density J2 (ωL), see Eq. 2. In panel (A), the field-cycling and fixed-field data consistently show that, in the accessible frequency range, the 1/T1 rates of the D2O-pNIPAM mixture do not exhibit a significant dependence on ωL at T ≲300 K. Such an absence of 1/T1 dispersion is expected for the limit of fast motion, i. e., for Larmor frequencies in the range ωL ≪ 1/τ, where the spectral density has a frequency-independent value, see Eq. 6. For the temperatures shown in panel (B) and also the higher temperatures shown in panel (A), we see that a frequency dependence of 1/T1 develops when heating through the LCST. Specifically, 1/T1 (ωL) significantly increases when the Larmor frequency is decreased, indicating the emergence of a slow dynamical process. Thus, above the LCST, a minor fraction of D2O, which shows slowed-down reorientation and adds a broad low-frequency dispersion, accompanies the major proportion of D2O, which shows fast bulk-like reorientation outside the accessible frequency range and, hence, contributes with a frequency-independent 1/T1 plateau. In the following text, we refer to these fractions as bound (b) water and free (f) water, respectively.
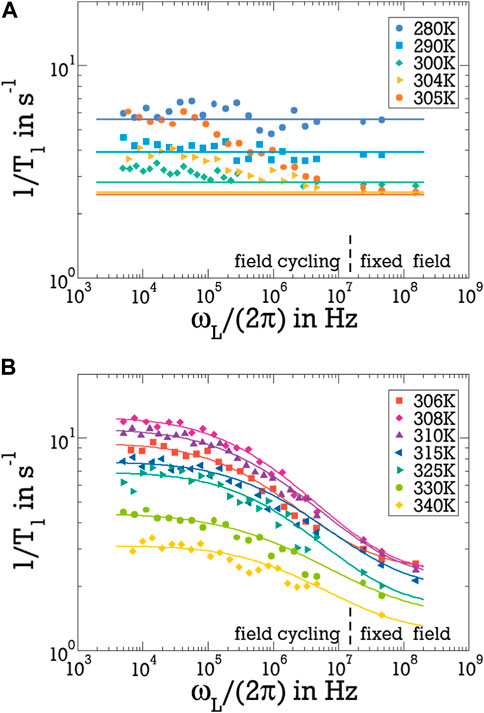
Figure 3. 2H spin-lattice relaxation rates 1/T1 (ωL) for the D2O-pNIPAM mixture at temperatures (A) up to the LCST and (B) above the LCST. Data below and above ωL = 2π × 107 Hz were obtained from field-cycling and fixed-field measurements, respectively. The horizontal solid lines in panel (A) reveal that no significant frequency dependence is observed at T ≲300 (K). They were calculated from the frequency independent CD contribution of free water using the obtained average slowdown of s = 1.25; see text for details. The solid lines in panel (B) are fits with Eq. 12.
To consider the existence of two D2O species with distinguishable dynamics, we assume that the spectral density J2 (ωL) is a weighted sum of two contributions:
with 0 ≤ R ≤ 1 and JCD and JLG given by Eqs 4, 5, respectively. Thereby, the CD spectral density accounts for the faster free water species at sufficiently large distances from the pNIPAM molecules, which shows bulk-like reorientation, often characterised by such CD behaviour, whereas the LG spectral density describes the slower bound water species, which strongly interacts with the polymer and, hence, should experience a Gaussian energy landscape typical of disordered matrices. We note that the use of a CD form is not critical to our results but other spectral densities allowing for a constant value in the studied frequency range could have been employed as well. However, we determined that a LG spectral density better describes the observed increase of 1/T1 (ωL) at small Larmor frequencies than several other functional forms, e.g., a CD form. Using this weighted superposition of JCD (ωL) and JLG (ωL) in Eq. 2, we fit the 1/T1 (ωL) data of the D2O-pNIPAM mixture, as will be described next.
Free fits suffer from the fact that the dynamics of free water is too fast to result in a 1/T1 (ωL) dispersion in the accessible frequency range, interfering with a reliable determination of the parameters of JCD. Explicitly, free water obeys ωL ≪ 1/τ in the whole frequency window and, hence, yields a frequency-independent contribution to the spectral density, JCD = ⟨τf⟩ = τCDγCD, see Eq. 7. The corresponding 1/T1 (ωL) plateau is clearly observed when bound water is absent well below the LCST, see Figure 3A, but a flattening out of the 1/T1 dispersion at the highest of the studied Larmor frequencies implies that such plateau also exists above the LCST, see Figure 3B. Therefore, it is sufficient to use JCD = ⟨τf⟩ in the fit analysis. Moreover, when we assume that the reorientation dynamics of free water molecules at sufficient distances from the pNIPAM molecules is not affected by the coil-to-globule transition, it is possible to predetermine this frequency-independent value at all studied temperatures based on existing knowledge. Specifically, using Eq. 11 and identifying ⟨τsolution⟩ with ⟨τf⟩, the slowdown s of water dynamics in the solution can be obtained by comparison of the dispersion-free T1 times well below the LCST with the values for neat D2O (Hindman et al., 2003), see Figure 3A. An average over the results for temperatures in the range 280–300 K yields a slowdown of s = 1.25, which is consistent with the above finding of r = 0.8 in the fixed-field measurements. Keeping this value of s fixed even above the LCST, yields ⟨τf⟩ from the results for neat D2O (Hindman et al., 2003). Having obtained the CD spectral density at all temperatures in this manner, the remaining free fit parameters are the fraction R of bound water and the time constant τLG and standard deviation σLG of its LG distribution.
In Figure 3, we see that the fits with this two-species model, see Eq. 12, well describe the FCR data. In particular, the low-frequency process associated with the slow water fraction is well described by the LG spectral density JLG at all temperatures T ≥ 306 K. As aforementioned, such a shape of the spectral density is not found in pure (viscous) liquids or polymer melts, where CD behaviour prevails, but it is often observed when a mobile component moves in a disordered matrix so that thermally activated motion is governed by a Gaussian distribution of energy barriers. Aside from the previously mentioned plasticizer molecules in polymer matrices (Jansen-Glaw et al., 1989), such a situation was also reported for mobile ions in disordered solid electrolytes (Haaks et al., 2017; Winter et al., 2020). Moreover, LG-like behaviours, explicitly, Cole-Cole spectral densities, were used to describe water dynamics in the hydration shells of proteins and polymers (Cerveny et al., 2004; 2008; Lusceac et al., 2011). Thus, the observed LG shape confirms the above suggestion that the low-frequency process can be assigned to a water fraction which strongly interacts with pNIPAM. Explicitly, we propose that the bound water species moves inside the dense polymer matrix formed by the collapsed pNIPAM globules and, in this way, shows rotational dynamics as they would result from a Gaussian distribution of energy barriers.
The resulting fit parameters are displayed in Figure 4. First, we focus on the findings at temperatures T ≥ 306 K. The time constant of the LG contribution, which specifies the peak position of the associated distribution of correlation times, amounts to τLG ≈ 10–9 s near the LCST and decreases when the temperature is increased. The standard deviation σLG, which describes the width of the distribution, has a basically temperature-independent value of σLG ≈ 2.3. Thus, the LG distribution has a full width at half maximum of more than two orders of magnitude, indicating that very strong dynamical heterogeneity results from the interaction of bound water with the pNIPAM molecules in their collapsed state. To quantify the difference in the dynamics of free and bound water, it is important to characterize the respective distributed dynamics with the same type of average. Here, we utilize the mean correlation times ⟨τf⟩ and ⟨τb⟩ for this comparison, where the latter is available from τLG and σLG using Eq. 8. In Figure 4B, we see that ⟨τb⟩ is about 3 orders of magnitude longer than ⟨τf⟩ well above the LCST. Altogether, the 2H FCR analysis shows that the interaction with pNIPAM globules leads to strongly slowed down and much more heterogeneous water dynamics.
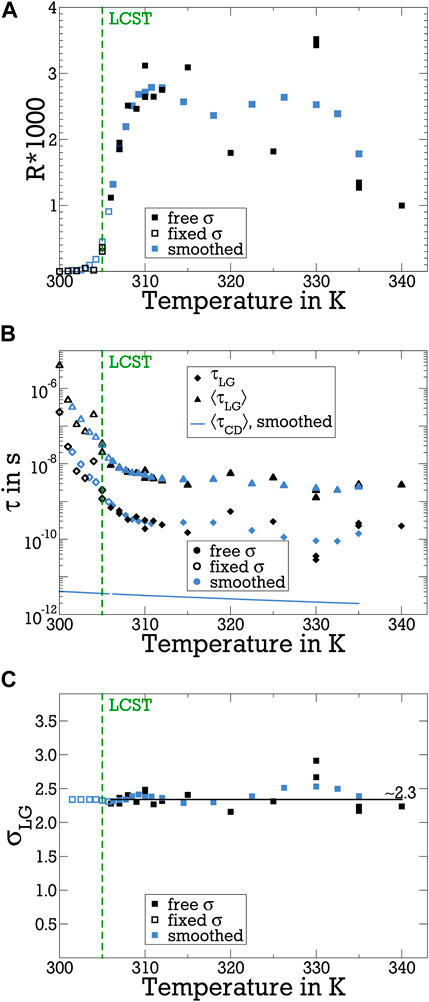
Figure 4. Parameters of the LG spectral density JLG obtained from fitting the 2H 1/T1 dispersions in Figure 3: (A) weighting factor R, (B) correlation times τLG, and (C) standard deviation σLG. In all panels, the solid symbols at T ≥ 306 K result from fits treating σLG as a free parameter, while the open symbols indicate that the standard deviation was fixed at the average value σLG = 2.3 at lower temperatures, where the fit results suffer from significant statistical uncertainty. Furthermore, blue data are smoothed by a running average over 4 consecutive data points. For comparison, the mean correlation times of bound water (⟨τLG⟩≡⟨τb⟩) and free water (⟨τCD⟩≡⟨τf⟩) are included in panel (B). The vertical dashed lines mark the LCST.
The bound water fraction is very small. It amounts to R = 0.002–0.003 above the LCST. To follow its evolution during the coil-to-globule transition, we extend the range of our fit analysis to lower temperatures, where less prominent 1/T1 (ωL) dispersions lead to enhanced statistical uncertainty. Therefore, unlike in the above discussed fits at T ≥ 306 K, where σLG was treated as free parameter, we fix the standard deviation of the LG contribution at the average of the values at such higher temperatures, σLG = 2.3, when fitting data at lower temperatures. The results of fits with this constraint are shown as open symbols in Figure 4. We observe that R is negligibly small below 300 K and rapidly increases when heating across the LCST, confirming that the emergence of the slow water species is caused by pNIPAM’s coil-to-globule transition. The fit result of a significant temperature dependence of τLG near the LCST should be taken with great caution because of the marginal 1/T1 dispersion below 306 K, see Figure 3A.
Although only a very small water fraction strongly interacts with the polymer at a given instant, it should be noted that an exchange between bound and free water fractions occurs in the course of time. Moreover, we need to consider that a small value of R is a direct consequence of using a dilute solution. Specifically, considering the large molar fraction of water (99.4 mol%) in our sample, R = 0.002–0.003 still implies that 0.3–0.45 water molecules per NIPAM unit are slowed down. Currently available other estimates of the number of water molecules per NIPAM unit in the collapsed state of the polymer scatter significantly, e. g., values of 0.2–0.4 (Lele et al., 1997), 1.8 (Vorob’ev and Faleev, 2005), 4.5 (Balachandar et al., 2023), 6 (Philipp et al., 2014), and 8 (Heskins and Guillet, 1968) were reported. However, it should be mentioned in this context that these values may characterise metastable states because waiting-time dependent T2 measurements indicated that the captured water molecules are expelled from the pNIPAM globules on the time scale of ∼4 days (Starovoytova and Spěváček, 2006).
To check the results of our FCR analysis for consistency, we use the obtained fit parameters to calculate the evolution of the T1 and T2 times across the LCST for various fixed Larmor frequencies ωL. In doing so, a running average is applied to mitigate the statistical fluctuations of the LG parameters and, thus, smoothen their temperature dependence. The resulting smoothed parameters are included in Figure 4. It can be seen in Figure 5 that the calculated T1 values well reproduce the temperature dependence of the experimental T1 times for all studied frequencies. In particular, the observation that the change across the LCST is much stronger for lower values of ωL is well captured. This effect results from the finding, see Figure 3, that, above the LCST, the slow reorientation of the bound water influences the spectral density particularly at lower frequencies, whereas the fast dynamics of the free water continues to dominate J2 at higher frequencies. Likewise, we observe in Figure 6 that the JLG and JCD spectral densities obtained from the above T1 analysis even allow us to satisfactorily describe the variation of T2 across the LCST. Because T2, unlike T1, depends on J2 (0), see Eq. 3, the former relaxation time changes less than the latter when the Larmor frequency ωL is varied in our case. Furthermore, the fact that the fits exclusively involved T1 data, which are independent of J2 (0), may rationalise the observation that the experimental T2 data, which strongly depend on this contribution, are less accurately described by the predictions calculated therefrom. Altogether, the determined spectral densities of the bound and free water fractions consistently describe the T1 and T2 relaxation times of the studied D2O-pNIPAM mixture in broad temperature and frequency ranges. This is evidence that a small water fraction emerges during the collapse of the pNIPAM molecules, which shows much slower and more heterogeneous reorientation dynamics than bulk water.
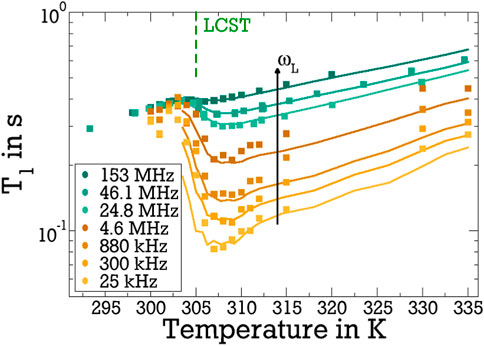
Figure 5. Temperature-dependent 2H T1 relaxation times for the indicated Larmor frequencies (ωL/2π). The green data are from measurements in superconducting magnets, the brown and yellow data are obtained from the field-cycling data in Figure 3 by cutting along ωL = const. The lines are T1 values calculated based on the fit results for JLG and JCD.
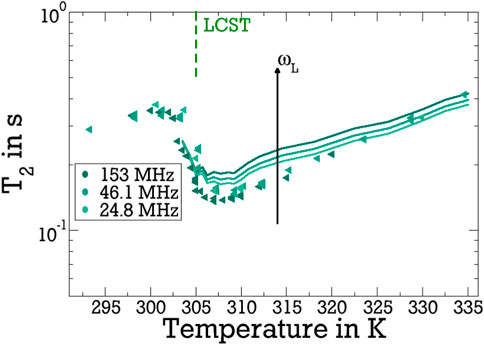
Figure 6. Temperature-dependent 2H T2 relaxation times for the indicated Larmor frequencies (ωL/2π). The lines are T2 values calculated based on the fit results for JLG and JCD obtained from the above T1 analysis.
To further illustrate our findings for bound water, we characterise the reorientation of this species by an NMR susceptibility χNMR (ωL). For this purpose, we first determine the contribution of bound water to the 1/T1 (ωL) dispersion by subtracting the contribution of free water from the experimental data, explicitly,
In doing so,
Figure 7 shows the thus determined NMR susceptibilities of bound water. In this susceptibility representation of the results, it becomes particularly clear that the bound water shows a very broad susceptibility peak and, hence, very strong dynamical heterogeneity, which is well described by a LG distribution of correlation times. The susceptibility peak is even broader than the accessible frequency range. Specifically, information about its high-frequency flank is not available from the present 2H NMR relaxation study. Due to the prominent dynamical heterogeneity in combination with the small fraction of the bound water, the faster of these molecules do not cause a notable 1/T1 dispersion before the contribution of the major fraction of free water governs the experimental findings at sufficiently large Larmor frequencies ωL.
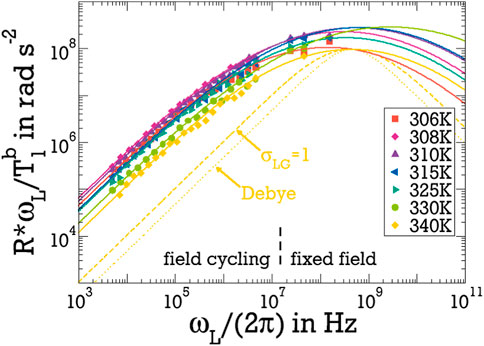
Figure 7. NMR susceptibility of the bound water fraction,
5 Conclusion
2H NMR relaxometry yielded valuable insights into the reorientation dynamics of D2O in a semi-dilute solution of linear pNIPAM (4 wt%) across the LCST. Consistent with previous results, we observed that the 2H T1 and T2 relaxation times abruptly decrease when pNIPAM undergoes a coil-to-globule transition at ∼32°C. This indicates that the major fraction of free water becomes accompanied by a minor fraction of bound water, which strongly interacts with the collapsed chains and shows slow dynamics. However, it is difficult to independently determine the amount and the slowdown of the bound water fraction based on such temperature-dependent T1 and T2 measurements at a single Larmor frequency ωL.
Therefore, we employed 2H FCR for T1 measurements over a broad range of Larmor frequencies ωL. Moreover, we exploited the fact that the resulting frequency-dependent relaxation rates 1/T1 (ωL) provide straightforward access to the spectral density J2 (ωL) of D2O reorientation. We found that 1/T1 (ωL) can be described by a superposition of LG and CD spectral densities associated with the dynamics of bound and free water species, respectively. Because of the fast dynamics of free water, only the low-frequency plateau of the CD spectral density was observed in the accessible range of Larmor frequencies ωL. This contribution was predetermined from 1/T1 data of neat D2O and fixed in our fit approach.
The reorientation of bound water was well described by the LG spectral density. Hence, bound water shows prominent dynamical heterogeneity, resembling the motion of various molecules or ions in disordered matrices. Specifically, the underlying LG distribution of correlation times is described by a standard deviation of σLG ≈ 2.3, corresponding to a full width at half maximum of more than two orders of magnitude. Hence, the common assumption of a Debye spectral density does not apply. The peak of the LG distribution is located at τLG ≈ 10–9 s near the LCST and shifts to shorter times when the temperature is increased. The difference in the dynamics of free and bound water was characterized based on the respective mean correlation times, ⟨τb⟩ and ⟨τf⟩. We found that the interaction with the pNiPAM globules leads to a slowdown of water dynamics by about 3 orders of magnitude. Various findings indicated fast exchange between bound and free water on the T1 and T2 time scales.
The possibility to observe both the height and the position of the 1/T1 (ωL) dispersion in FCR allowed us to disentangle effects of the dynamics and the fraction of bound water on the NMR relaxation behavior and, in this way, obtain an estimate for the amount of water molecules captured inside the pNIPAM globules above the LCST. Such disentanglement was not possible in previous studies using a single Larmor frequency (Ohta et al., 1991b; Tanaka et al., 1998; Schönhoff et al., 2002; Kariyo et al., 2005; Sierra-Martin et al., 2005; Kametani et al., 2017). In the studied solution, the fraction R of bound water is very small, ca. 0.2%–0.3%. However, because of the dilute conditions, this value still corresponds to ∼0.4 bound water molecules per NIPAM monomer. In the literature, a broad range of numbers was reported. In this context, it should be noted that the bound fraction may decrease in the course of days (Starovoytova and Spěváček, 2006).
Altogether, 2H NMR relaxometry, in particular, our 2H FCR analysis, revealed that, during the coil-to-globule transition of pNIPAM, a small fraction of bound water emerges, which exhibits very heterogeneous and strongly slowed dynamics. Importantly, our approach provided quantitative information about these effects. We propose that these water molecules show the observed reorientation in the interior of the collapsed polymers, but are capable of escaping from these captivities on longer time scales.
Data availability statement
The raw data supporting the conclusion of this article will be made available by the authors, without undue reservation.
Author contributions
CS: Conceptualization, Data curation, Formal Analysis, Investigation, Validation, Writing–original draft, Writing–review and editing. RK: Conceptualization, Resources, Writing–review and editing. RS: Data curation, Investigation, Writing–review and editing. JS: Conceptualization, Resources, Writing–review and editing. MV: Conceptualization, Data curation, Formal Analysis, Funding acquisition, Methodology, Resources, Supervision, Validation, Writing–original draft, Writing–review and editing.
Funding
The author(s) declare that financial support was received for the research, authorship, and/or publication of this article. Financial support by the DFG, Project No. 492723217 (CRC 1585), subproject A04 is gratefully acknowledged.
Acknowledgments
We thank the Northern Bavarian NMR Center for giving us access to their high-resolution spectrometer and K. Schweimer for assisting us in using this equipment.
Conflict of interest
The authors declare that the research was conducted in the absence of any commercial or financial relationships that could be construed as a potential conflict of interest.
Publisher’s note
All claims expressed in this article are solely those of the authors and do not necessarily represent those of their affiliated organizations, or those of the publisher, the editors and the reviewers. Any product that may be evaluated in this article, or claim that may be made by its manufacturer, is not guaranteed or endorsed by the publisher.
Supplementary material
The Supplementary Material for this article can be found online at: https://www.frontiersin.org/articles/10.3389/frsfm.2024.1379816/full#supplementary-material
References
Ahmed, Z., Gooding, E. A., Pimenov, K. V., Wang, L., and Asher, S. A. (2009). UV resonance Raman determination of molecular mechanism of poly(N-isopropylacrylamide) volume phase transition. J. Phys. Chem. B 113, 4248–4256. doi:10.1021/jp810685g
Andersson, M., and Maunu, S. L. (2006). Volume phase transition and structure of poly(N-isopropylacrylamide) microgels studied with 1H-NMR spectroscopy in D2O. Colloid Polym. Sci. 285, 293–303. doi:10.1007/s00396-006-1563-y
Backes, S., Krause, P., Tabaka, W., Witt, M. U., Mukherji, D., Kremer, K., et al. (2017a). Poly(N-isopropylacrylamide) microgels under alcoholic intoxication: when a LCST polymer shows swelling with increasing temperature. ACS Macro Lett. 6, 1042–1046. doi:10.1021/acsmacrolett.7b00557
Backes, S., Krause, P., Tabaka, W., Witt, M. U., and von Klitzing, R. (2017b). Combined cononsolvency and temperature effects on adsorbed PNIPAM microgels. Langmuir 33, 14269–14277. doi:10.1021/acs.langmuir.7b02903
Balachandar, V., Takatsuka, M., Kita, R., Shinyashiki, N., Yagihara, S., and Sampathkumar, R. (2023). Dynamic behavior of heavy water inside and outside of poly (N-isopropylacrylamide) (PNIPAM) microgel using broadband dielectric spectroscopy. IEEE Trans. Dielectr. Electr. Insul. 30, 1657–1662. doi:10.1109/TDEI.2023.3261832
Becher, M., Lichtinger, A., Minikejew, R., Vogel, M., and Rössler, E. A. (2022). NMR relaxometry accessing the relaxation spectrum in molecular glass formers. Int. J. Mol. Sci. 23, 5118. doi:10.3390/ijms23095118
Beckmann, P. A. (1988). Spectral densities and nuclear spin relaxation in solids. Phys. Rep. 171, 85–128. doi:10.1016/0370-1573(88)90073-7
Bharadwaj, S., Niebuur, B.-J., Nothdurft, K., Richtering, W., van der Vegt, N. F. A., and Papadakis, C. M. (2022). Cononsolvency of thermoresponsive polymers: where we are now and where we are going. Soft Matter 18, 2884–2909. doi:10.1039/D2SM00146B
Böhmer, R., Diezemann, G., Hinze, G., and Rössler, E. (2001). Dynamics of supercooled liquids and glassy solids. Prog. Nucl. Mag. Res. Sp. 39, 191–267. doi:10.1016/S0079-6565(01)00036-X
Carr, H. Y., and Purcell, E. M. (1954). Effects of diffusion on free precession in nuclear magnetic resonance experiments. Phys. Rev. 94, 630–638. doi:10.1103/PhysRev.94.630
Cerveny, S., Alegría, N., and Colmenero, J. (2008). Broadband dielectric investigation on poly(vinyl pyrrolidone) and its water mixtures. J. Chem. Phys. 128, 044901. doi:10.1063/1.2822332
Cerveny, S., Schwartz, G. A., Bergman, R., and Swenson, J. (2004). Glass transition and relaxation processes in supercooled water. Phys. Rev. Lett. 93, 245702. doi:10.1103/PhysRevLett.93.245702
Chakraborty, I., Mukherjee, K., De, P., and Bhattacharyya, R. (2018). Monitoring coil–globule transitions of thermoresponsive polymers by using NMR solvent relaxation. J. Phys. Chem. B 122, 6094–6100. doi:10.1021/acs.jpcb.8b02179
Deshmukh, M. V., Vaidya, A. A., Kulkarni, M. G., Rajamohanan, P. R., and Ganapathy, S. (2000). LCST in poly(N-isopropylacrylamide) copolymers: high resolution proton NMR investigations. Polymer 41, 7951–7960. doi:10.1016/S0032-3861(00)00174-9
Díez-Peña, E., Quijada-Garrido, I., Barrales-Rienda, J. M., Wilhelm, M., and Spiess, H. W. (2002). NMR studies of the structure and dynamics of polymer gels based on N-isopropylacrylamide (NiPAAm) and methacrylic acid (MAA). Macromol. Chem. Physic. 203, 491–502. doi:10.1002/1521-3935(20020201)203:3⟨491::AID-MACP491⟩3.0.CO;2-1
Dries, T., Fujara, F., Kiebel, M., Rössler, E., and Sillescu, H. (1988). 2H-NMR study of the glass transition in supercooled ortho-terphenyl. J. Chem. Phys. 88, 2139–2147. doi:10.1063/1.454047
Fujara, F., Kruk, D., and Privalov, A. F. (2014). Solid state field-cycling NMR relaxometry: instrumental improvements and new applications. Prog. Nucl. Mag. Res. Sp. 82, 39–69. doi:10.1016/j.pnmrs.2014.08.002
Haaks, M., Martin, S. W., and Vogel, M. (2017). Relation of short-range and long-range lithium ion dynamics in glass-ceramics: insights from 7Li NMR field-cycling and field-gradient studies. Phys. Rev. B 96, 104301. doi:10.1103/PhysRevB.96.104301
Halperin, A., Kröger, M., and Winnik, F. M. (2015). Poly(N-isopropylacrylamide) phase diagrams: fifty years of research. Angew. Chem. Int. Ed. 54, 15342–15367. doi:10.1002/anie.201506663
Hammouda, B., Jia, D., and He, C. (2015). Single-chain conformation for interacting poly(N-isopropylacrylamide) in aqueous solution. Open Access J. Sci. Technol. 3. doi:10.11131/2015/101152
Heskins, M., and Guillet, J. E. (1968). Solution properties of poly(N-isopropylacrylamide). J. Macromol. Sci. Part A Pure Appl. Chem. 2, 1441–1455. doi:10.1080/10601326808051910
Hindman, J. C., Zielen, A. J., Svirmickas, A., and Wood, M. (2003). Relaxation processes in water. The spin–lattice relaxation of the deuteron in D2O and oxygen-17 in H217O. J. Chem. Phys. 54, 621–634. doi:10.1063/1.1674887
Hofmann, C. H., Plamper, F. A., Scherzinger, C., Hietala, S., and Richtering, W. (2013). Cononsolvency revisited: solvent entrapment by N-isopropylacrylamide and N,N-diethylacrylamide microgels in different water/methanol mixtures. Macromolecules 46, 523–532. doi:10.1021/ma302384v
Jansen-Glaw, B., Rössler, E., Taupitz, M., and Vieth, H. M. (1989). Hexamethylbenzene as a sensitive nuclear magnetic resonance probe for studying organic crystals and glasses. J. Chem. Phys. 90, 6858–6866. doi:10.1063/1.456259
Kametani, S., Sekine, S., Ohkubo, T., Hirano, T., Ute, K., Cheng, H. N., et al. (2017). NMR studies of water dynamics during sol-to-gel transition of poly (N-isopropylacrylamide) in concentrated aqueous solution. Polymer 109, 287–296. doi:10.1016/j.polymer.2016.12.063
Kariyo, S., Küppers, M., Badiger, M. V., Prabhakar, A., Jagadeesh, B., Stapf, S., et al. (2005). Morphology and chain dynamics during collapse transition of PNIPAM gels studied by combined imaging, relaxometry and 129Xe spectroscopy techniques. Magn. Reson. Imaging 23, 249–253. doi:10.1016/j.mri.2004.11.019
Kimmich, R., and Anoardo, E. (2004). Field-cycling NMR relaxometry. Prog. Nucl. Mag. Res. Sp. 44, 257–320. doi:10.1016/j.pnmrs.2004.03.002
Kresse, B., Privalov, A. F., and Fujara, F. (2011). NMR field-cycling at ultralow magnetic fields. Solid State Nucl. Mag. 40, 134–137. doi:10.1016/j.ssnmr.2011.10.002
Kruk, D., Herrmann, A., and Rössler, E. A. (2012). Field-cycling NMR relaxometry of viscous liquids and polymers. Prog. Nucl. Mag. Res. Sp. 63, 33–64. doi:10.1016/j.pnmrs.2011.08.001
Lai, H., Chen, Q., and Wu, P. (2013). The core–shell structure of PNIPAM collapsed chain conformation induces a bimodal transition on cooling. Soft Matter 9, 3985–3993. doi:10.1039/C3SM27761E
Larsson, A., Kuckling, D., and Schönhoff, M. (2001). 1H NMR of thermoreversible polymers in solution and at interfaces: the influence of charged groups on the phase transition. Colloids Surf. A 190, 185–192. doi:10.1016/S0927-7757(01)00678-1
Lele, A. K., Hirve, M. M., Badiger, M. V., and Mashelkar, R. A. (1997). Predictions of bound water content in poly(N-isopropylacrylamide) gel. Macromolecules 30, 157–159. doi:10.1021/ma950894l
Lu, Y., and Ballauff, M. (2011). Thermosensitive core-shell microgels: from colloidal model systems to nanoreactors. Prog. Polym. Sci. 36, 767–792. doi:10.1016/j.progpolymsci.2010.12.003
Lusceac, S. A., Rosenstihl, M., Vogel, M., Gainaru, C., Fillmer, A., and Böhmer, R. (2011). NMR and dielectric studies of hydrated collagen and elastin: evidence for a delocalized secondary relaxation. J. Non-Cryst. Solids 357, 655–663. doi:10.1016/j.jnoncrysol.2010.07.035
Maccarrone, S., Scherzinger, C., Holderer, O., Lindner, P., Sharp, M., Richtering, W., et al. (2014). Cononsolvency effects on the structure and dynamics of microgels. Macromolecules 47, 5982–5988. doi:10.1021/ma500954t
Matsuda, N., Shimizu, T., Yamato, M., and Okano, T. (2007). Tissue engineering based on cell sheet technology. Adv. Mater. 19, 3089–3099. doi:10.1002/adma.200701978
Meiboom, S., and Gill, D. (1958). Modified spin-echo method for measuring nuclear relaxation times. Rev. Sci. Instrum. 29, 688–691. doi:10.1063/1.1716296
Nachaki, E. O., Leonik, F. M., and Kuroda, D. G. (2022). Effect of the N-alkyl side chain on the amide–water interactions. J. Phys. Chem. B 126, 8290–8299. doi:10.1021/acs.jpcb.2c04988
Niebuur, B.-J., Lohstroh, W., Appavou, M.-S., Schulte, A., and Papadakis, C. M. (2019). Water dynamics in a concentrated poly(N-isopropylacrylamide) solution at variable pressure. Macromolecules 52, 1942–1954. doi:10.1021/acs.macromol.8b02708
Nolan, C. M., Gelbaum, L. T., and Lyon, L. A. (2006). H NMR investigation of thermally triggered insulin release from poly(N-isopropylacrylamide) microgels. Biomacromolecules 7, 2918–2922. doi:10.1021/bm060718s
Ohta, H., Ando, I., Fujishige, S., and Kubota, K. (1991a). A 13C PST/MAS NMR study of of poly(N-isopropylacrylamide) in solution and in the gel phase. J. Mol. Struct. 245, 391–397. doi:10.1016/0022-2860(91)87113-V
Ohta, H., Ando, I., Fujishige, S., and Kubota, K. (1991b). Molecular motion and 1H NMR relaxation of aqueous poly(N-isopropylacrylamide) solution under high pressure. J. Polym. Sci. Part B Polym. Phys. 29, 963–968. doi:10.1002/polb.1991.090290806
Ono, Y., and Shikata, T. (2006). Hydration and dynamic behavior of poly(N-isopropylacrylamide)s in aqueous solution: a sharp phase transition at the lower critical solution temperature. J. Am. Chem. Soc. 128, 10030–10031. doi:10.1021/ja063990i
Philipp, M., Kyriakos, K., Silvi, L., Lohstroh, W., Petry, W., Krüger, J. K., et al. (2014). From molecular dehydration to excess volumes of phase-separating PNIPAM solutions. J. Phys. Chem. B 118, 4253–4260. doi:10.1021/jp501539z
Podewitz, M., Wang, Y., Quoika, P. K., Loeffler, J. R., Schauperl, M., and Liedl, K. R. (2019). Coil–globule transition thermodynamics of poly(N-isopropylacrylamide). J. Phys. Chem. B 123, 8838–8847. doi:10.1021/acs.jpcb.9b06125
Rahimzadeh, A., Rutsch, M., Kupnik, M., and Klitzing, R. v. (2021). Visualization of acoustic energy absorption in confined aqueous solutions by pnipam microgels: effects of bulk viscosity. Langmuir 37, 5854–5863. doi:10.1021/acs.langmuir.1c00235
Richter, A., Howitz, S., Kuckling, D., Kretschmer, K., and Arndt, K.-F. (2004). Automatically and electronically controllable hydrogel based valves and microvalves – design and operating performance. Macromol. Symp. 210, 447–456. doi:10.1002/masy.200450650
Rössler, E., and Sillescu, H. (1984). 2H NMR study of supercooled toluene. Chem. Phys. Lett. 112, 94–98. doi:10.1016/0009-2614(84)87048-7
Rusu, M., Wohlrab, S., Kuckling, D., Möhwald, H., and Schönhoff, M. (2006). Coil-to-globule transition of PNIPAM graft copolymers with charged side chains: a 1H and 2H NMR and spin relaxation study. Macromolecules 39, 7358–7363. doi:10.1021/ma060831a
Sattig, M., and Vogel, M. (2014). Dynamic crossovers and stepwise solidification of confined water: a 2H NMR study. J. Phys. Chem. Lett. 5, 174–178. doi:10.1021/jz402539r
Scherzinger, C., Schwarz, A., Bardow, A., Leonhard, K., and Richtering, W. (2014). Cononsolvency of poly-N-isopropyl acrylamide (PNIPAM): microgels versus linear chains and macrogels. Curr. Opin. Colloid In. 19, 84–94. doi:10.1016/j.cocis.2014.03.011
Schiller, V., and Vogel, M. (2024). Ice-water equilibrium in nanoscale confinement. Phys. Rev. Lett. 132, 016201. doi:10.1103/PhysRevLett.132.016201
Schmidt, S., Zeiser, M., Hellweg, T., Duschl, C., Fery, A., and Möhwald, H. (2010). Adhesion and mechanical properties of PNIPAM microgel films and their potential use as switchable cell culture substrates. Adv. Funct. Mater. 20, 3235–3243. doi:10.1002/adfm.201000730
Schmidt-Rohr, K., and Spiess, H. W. (1994). Multidimensional solid-state NMR and polymers. Cambridge: Academic Press.
Schönhoff, M., Larsson, A., Welzel, P. B., and Kuckling, D. (2002). Thermoreversible polymers adsorbed to colloidal silica: a 1H NMR and DSC study of the phase transition in confined geometry. J. Phys. Chem. B 106, 7800–7808. doi:10.1021/jp015538l
Shiraga, K., Naito, H., Suzuki, T., Kondo, N., and Ogawa, Y. (2015). Hydration and hydrogen bond network of water during the coil-to-globule transition in poly(N-isopropylacrylamide) aqueous solution at cloud point temperature. J. Phys. Chem. B 119, 5576–5587. doi:10.1021/acs.jpcb.5b01021
Shirota, H., Kuwabara, N., Ohkawa, K., and Horie, K. (1999). Deuterium isotope effect on volume phase transition of polymer gel: temperature dependence. J. Phys. Chem. B 103, 10400–10408. doi:10.1021/jp992401a
Sierra-Martin, B., Retama, J. R., Laurenti, M., Barbero, A. F., and Cabarcos, E. L. (2014). Structure and polymer dynamics within PNIPAM-based microgel particles. Adv. Colloid Interfac. 205, 113–123. doi:10.1016/j.cis.2013.11.001
Sierra-Martin, B., Romero-Cano, M. S., Cosgrove, T., Vincent, B., and Fernandez-Barbero, A. (2005). Solvent relaxation of swelling PNIPAM microgels by NMR. Colloids Surf. A 270-271, 296–300. doi:10.1016/j.colsurfa.2005.06.044
Spěváček, J. (2009). NMR investigations of phase transition in aqueous polymer solutions and gels. Curr. Opin. Colloid Interface Sci. 14, 184–191. doi:10.1016/j.cocis.2008.10.003
Starovoytova, L., and Spěváček, J. (2006). Effect of time on the hydration and temperature-induced phase separation in aqueous polymer solutions. 1H NMR study. Polymer 47, 7329–7334. doi:10.1016/j.polymer.2006.08.002
Steele, R. M., Korb, J.-P., Ferrante, G., and Bubici, S. (2016). New applications and perspectives of fast field cycling NMR relaxometry. Magn. Reson. Chem. 54, 502–509. doi:10.1002/mrc.4220
Stock, S., Mirau, L., Rutsch, M., Wismath, S., Kupnik, M., von Klitzing, R., et al. (2023). Ultrasound-induced adsorption of acousto-responsive microgels at water–oil interface. J. Adv. Sci. 11, 2305395. doi:10.1002/advs.202305395
Stock, S., von Klitzing, R., and Rahimzadeh, A. (2024). Dynamic light scattering for particle characterization subjected to ultrasound: a study on compact particles and acousto-responsive microgels. Sci. Rep. 14, 989. doi:10.1038/s41598-024-51404-0
Sun, P., Li, B., Wang, Y., Ma, J., Ding, D., and He, B. (2003). 1H NMR studies of poly(N-isopropylacrylamide) gels near the phase transition. Eur. Polym. J. 39, 1045–1050. doi:10.1016/S0014-3057(02)00326-9
Tanaka, N., Matsukawa, S., Kurosu, H., and Ando, I. (1998). A study on dynamics of water in crosslinked poly (N-isopropylacrylamide) gel by n.m.r. spectroscopy. Polymer 39, 4703–4706. doi:10.1016/S0032-3861(97)10210-5
Tokuhiro, T., Amiya, T., Mamada, A., and Tanaka, T. (1991). NMR study of poly(N-isopropylacrylamide) gels near phase transition. Macromolecules 24, 2936–2943. doi:10.1021/ma00010a046
Van der Beek, G. P., Stuart, M. A. C., and Cosgrove, T. (1991). Polymer adsorption and desorption studies via proton NMR relaxation of the solvent. Langmuir 7, 327–334. doi:10.1021/la00050a022
Vijayakumar, B., Takatsuka, M., Kita, R., Shinyashiki, N., Yagihara, S., and Rathinasabapathy, S. (2022). Dynamics of the poly(N-isopropylacrylamide) microgel aqueous suspension investigated by dielectric relaxation spectroscopy. Macromolecules 55, 1218–1229. doi:10.1021/acs.macromol.1c02083
Vorob’ev, M. M., and Faleev, N. G. (2005). Water ordering measurements in the aqueous polymer systems by waveguide dielectric resonance method. Mendeleev Commun. 15, 259–261. doi:10.1070/MC2005v015n06ABEH002160
Wang, N., Ru, G., Wang, L., and Feng, J. (2009). 1H MAS NMR studies of the phase separation of poly(N-isopropylacrylamide) gel in binary solvents. Langmuir 25, 5898–5902. doi:10.1021/la8038363
Winter, E., Seipel, P., Miß, V., Spannenberger, S., Roling, B., and Vogel, M. (2020). 7Li NMR studies of short-range and long-range lithium ion dynamics in a heat-treated lithium iodide-doped lithium thiophosphate glass featuring high ion conductivity. J. Phys. Chem. C 124, 28614–28622. doi:10.1021/acs.jpcc.0c08801
Yanase, K., Buchner, R., and Sato, T. (2018). Microglobule formation and a microscopic order parameter monitoring the phase transition of aqueous poly(N-isopropylacrylamide) solution. Phys. Rev. Mater. 2, 085601. doi:10.1103/PhysRevMaterials.2.085601
Yang, M., Su, W., and Zhao, K. (2017). Quantification of solvent water and hydration dynamic of thermo-sensitive microgel by dielectric spectroscopy. J. Polym. Sci. Part B Polym. Phys. 55, 1859–1864. doi:10.1002/polb.24513
Yu, Q., Ista, L. K., and López, G. P. (2014). Nanopatterned antimicrobial enzymatic surfaces combining biocidal and fouling release properties. Nanoscale 6, 4750–4757. doi:10.1039/C3NR06497B
Zeng, F., Tong, Z., and Feng, H. (1997). N.m.r. investigation of phase separation in poly(N-isopropyl acrylamide)/water solutions. Polymer 38, 5539–5544. doi:10.1016/S0032-3861(97)00118-3
Keywords: water, poly (N-isopropyl acrylamide), NMR, field cycling NMR, molecular dynamics
Citation: Säckel C, von Klitzing R, Siegel R, Senker J and Vogel M (2024) Water dynamics in solutions of linear poly (N-isopropyl acrylamide) studied by 2H NMR field-cycling relaxometry. Front. Soft Matter 4:1379816. doi: 10.3389/frsfm.2024.1379816
Received: 31 January 2024; Accepted: 06 March 2024;
Published: 21 March 2024.
Edited by:
Wensheng Xu, Chinese Academy of Sciences (CAS), ChinaReviewed by:
Rongchun Zhang, South China University of Technology, ChinaSiegfried Stapf, Technische Universität Ilmenau, Germany
Copyright © 2024 Säckel, von Klitzing, Siegel, Senker and Vogel. This is an open-access article distributed under the terms of the Creative Commons Attribution License (CC BY). The use, distribution or reproduction in other forums is permitted, provided the original author(s) and the copyright owner(s) are credited and that the original publication in this journal is cited, in accordance with accepted academic practice. No use, distribution or reproduction is permitted which does not comply with these terms.
*Correspondence: Michael Vogel, bWljaGFlbC52b2dlbEBwa20udHUtZGFybXN0YWR0LmRl