 Abdallah Elshawadfy Elwakeel1*
 Hany S. El-Mesery2,3
 Ahmed Elbeltagi4
 Ali Salem5,6*
 Ayman Sabry7Dalia I. Saleh8Moustapha Eid Moustapha9Hadeer L. Abu-Taha10
 Wael F. Elkot11
- 1Agricultural Engineering Department, Faculty of Agriculture and Natural Resources, Aswan University, Aswan, Egypt
- 2School of Energy and Power Engineering, Jiangsu University, Zhenjiang, China
- 3Agricultural Engineering Research Institute, Agricultural Research Center, Giza, Egypt
- 4Agricultural Engineering Department, Faculty of Agriculture, Mansoura University, Mansoura, Egypt
- 5Civil Engineering Department, Faculty of Engineering, Minia University, Minia, Egypt
- 6Structural Diagnostics and Analysis Research Group, Faculty of Engineering and Information Technology, University of Pécs, Pécs, Hungary
- 7Department of Biology, College of Science, Taif University, Taif, Saudi Arabia
- 8Department of Chemistry, College of Science, Taif University, Taif, Saudi Arabia
- 9Department of Chemistry, College of Science and Humanities, Prince Sattam bin Abdulaziz University, Al-Kharj, Saudi Arabia
- 10Department of Agricultural Engineering, Faculty of Agriculture, Kafrelsheikh University, Kafr El Sheikh, Egypt
- 11Dairy Science and Technology Department, Faculty of Agriculture & Natural Resources, Aswan University, Aswan, Egypt
The current study aims to develop and conduct a techno-environmental evaluation of a new sustainable forced convection solar dryer (SFCSD). Where the developed SFCSD was integrated with a unique electronic circuit that enables it to operate in two different modes: 1. forced air circulation (active mode) and 2. natural air circulation (passive mode), based on the air temperature (AT) inside the drying room and the ambient light intensity (Li). Furthermore, the SFCSD is equipped with an early warning system (SOS) that can send a warning message (SMS) to the operator in case of system failure. The Aswan region of Egypt uses the developed SFCSD to dry the most famous five date fruit varieties (Shamia, Bartamuda, Sakkoti, Malkabii, and Gondaila). The speed sensor of air suction fan, Li sensor, relative humidity (RH) sensor and AT sensor were calibrated against standard devices before used. The results showed a strong correlation between the measured and reference values. Despite the slight underestimation of the values, the sensors’ response remains consistent and predictable. The R2 values for the speed sensor, the Li sensor, the AT sensor, and the RH sensor were, in that order, 0.9904, 0.987, and 0.9863. The average daily solar radiation, ambient AT, and RH during field tests were 494.78 W/m2, 29.46°C, and 23.68%, respectively. The initial moisture content (MC) of the different date fruit (DF) varieties used in the current study ranged between 10.32 and 12.56%, and the DF samples reached equilibrium MC at 9 days. The effective moisture diffusivity (EMD) ranged between 3.5569 × 10⁻⁷ m2/s and 3.9489 × 10⁻⁷ m2/s. The maximum efficiency of the photovoltaic (PV) system and the solar collector was 25.28 and 69.52%, respectively. The analysis of environmental impact revealed that the energy payback time (EPP) for the developed SFCSD is 7.15 years, which represented only 23.83% of the system’s lifetime. The developed SFCSD has a CO2 mitigation value of 93.2 tons and earned carbon credit (ECC) valued of 6757.02 USD throughout its estimated lifetime of 30 years. The environmental impact analysis demonstrates that the developed SFCSD is an appropriate alternative for preserving agricultural products while maintaining environmental sustainability.
1 Introduction
Date fruit (DF) is regarded as a symbol of life in the desert because it is the most significant crop used for subsistence in hot, dry climates (Ben-Amor et al., 2016; Arielli, 2025; Banadka et al., 2025). Globally, 7.6 million tons of DF were produced in 2017 (Seerangurayar et al., 2019). Aswan Governorate is recognized as the largest governorate in Egypt, renowned for its production of dried dates, with the most notable kinds being Sakkoti, Bartamuda, Gondaila, Malkabi, and Shimia. In Aswan, the sun-drying procedure for date fruit in the open air often requires 1–2 months. The prevailing drying technique in Aswan Governorate is direct solar exposure outdoors, contaminating dates with dust, insects, rodents, animals, and other substances that may occasionally induce poisoning. This contamination might jeopardize the dates’ safety and quality, rendering them less appealing for consumption. Consequently, better-regulated drying methods could alleviate the considerable health hazards linked to sun drying (Elghazali et al., 2020a). DF is an excellent source of minerals, some vitamins, dietary fibers, and carbs (Alu’datt et al., 2025; Eid et al., 2025). Furthermore, because of its high vitamin and bioactive chemical content, DF is well-liked for its health advantages in addition to its delightfully sweet flavor. DF is often harvested and sold during the khalal, rutab, and tamr ripening periods (Amira et al., 2012; Al-Mssallem et al., 2024). Dates have a short shelf life because of their high MC, which makes them vulnerable to biological deterioration after they are ripe (Seerangurayar et al., 2019; Arielli, 2025; Zhao et al., 2025). In this case, the DF can be used more economically and its shelf life extended by using the crucial and necessary technique of drying (Jia et al., 2019; Li et al., 2019; Kayacan et al., 2020).
Unfortunately, there are some drawbacks to OSD, such as increased drying times, a greater need for open space, and a higher risk of contamination, which leads to lower-quality products (Tunde-Akintunde, 2011; Samimi-Akhijahani and Arabhosseini, 2018). Therefore, solar dryers (SD) could be a promising method of applying solar energy as a substitute for OSD in order to avoid these drawbacks (Fudholi et al., 2014). Numerous studies on the SD for different agricultural products have been published, such as grapes (Kontaxakis et al., 2024), turmeric (Mahajan et al., 2024), stevia (Kumar and Tripathy, 2024), sweet basil (Akbar et al., 2024), chili pepper (Getahun et al., 2024), tomatoes (Elwakeel et al., 2024a), DF (Seerangurayar et al., 2024), potato (Vyas et al., 2024), banana (Suherman et al., 2024), and red pepper (Admass et al., 2024; Getahun et al., 2024).
The SDs are classified into three types, namely, direct solar dryers (DSD), indirect solar dryers (ISD), and hybrid solar dryers (HSD) (Hii et al., 2012; Tham et al., 2017; Rizal and Muhammad, 2018; Elwakeel et al., 2024b). The DSD comprises a drying room (DR) coated in plastic or glass, which is where fresh fruit or vegetable is placed, heated directly by the sun’s rays (Hii et al., 2012; VijayaVenkataRaman et al., 2012; Jain and Tewari, 2015). The ISD consists of an opaque DR integrated with a solar collector (SC). Convective heat transfer occurs during this drying process between the produce and hot air (Hii et al., 2012; Tibebu, 2015; Kumar et al., 2016; Yassen and Al-Kayiem, 2016). The HSD merged with both DSD and ISD to enhance the drying process (Hii et al., 2012; Tibebu, 2015; Kumar et al., 2016; Wang et al., 2018). But based on the operation mode, SDs are further classified into natural convection SDs (passive mode) and forced convection SDs (active mode) (Hii et al., 2012; VijayaVenkataRaman et al., 2012; Navale et al., 2015; Kumar et al., 2016; Lingayat et al., 2017). The forced convection SD (active mode) used motorized fans to circulate the hot air inside the DR, while the natural convection SD (passive mode) depends on the natural circulation of the hot air based on the density difference between the hot air inside the DR and ambient air (Belessiotis and Delyannis, 2011).
There are researchers across the globe who have dedicated their efforts to the study of the drying process of DF. Falade and Abbo (2007) conducted a study on the drying and rehydration properties of DF. In their investigation, they employed an oven to dry the DF within the temperature range of 50–80°C. The authors applied Fick’s diffusion model to calculate the effective diffusivities and activation energies. Ertekin and İpek (2020) investigated the drying process of date palm fruits and the microbiological properties of fresh and dried dates. The results revealed that the drying time decreased as the temperature increased; however, the color of the dried date palm fruit became increasingly darker at higher temperatures. The chemical structure of the fruit, however, remained unaffected. Almuhanna (2012) conducted a study to investigate the possibility of using a solar greenhouse as a SD for drying DF by taking advantage of solar energy as a source of heat to speed up the drying process. The study reported an overall thermal efficiency of 57.2% for the solar greenhouse. According to Mennouche et al. (2017), the quality of Algerian Deglet-Nour dates can be improved through the use of an indirect SD. The study found that the SD was effective with a control temperature of 50°C and an air velocity of 1.2 m/s. The indirect SD method is an innovative and sustainable solution for improving the quality and shelf life of Deglet-Nour dates. This approach is of particular interest to the agricultural sector, which is continuously looking for ways to reduce waste and improve the quality of their products. These results highlight the potential of the ASD as an efficient and sustainable method for drying DF. The integration of a PV system and a FPSC enhances the performance of the ASD, resulting in a higher drying rate than that of OSD. Moreover, the reduced drying time and lower MC achieved by the ASD can lead to improved quality of the dried DF. These findings have important implications for the DF industry, as they suggest that ASD is a promising alternative to traditional drying methods.
The present study aims to: 1. Develop a PV operated SFCSD, 2. Evaluate the developed system in the field for drying different varieties of date fruit, and measuring parameters such as, moisture content, and effective moisture diffusivity, 3. Calibrate the different electronic circuits, 4. Evaluate the efficiency of the solar collector and PV system, 5. Analyze the environmental impact of the developed system and measure some important parameters, such as, EPP, CO2 Emission, CO2 mitigation, and earns carbon credits. The developed SFCSD was integrated with a unique electronic circuit that enables it to operate in two different modes: forced air circulation (active mode) or natural air circulation (passive mode). The system automatically switches between these modes based on the hot AT inside the DR and the ambient light intensity. Data such as AT, RH, and Li can be automatically transmitted to the operator through a GSM module. This data can also be displayed on an integrated LCD. Furthermore, the SFCSD is equipped with a novel early warning system (SOS) that can send a warning message (SMS) to the operator in case of system failure.
2 Materials and methods
2.1 Description of the SFCSD
This study presents an innovative design for a hot-air indirect SFCSD that operates using a PV system. Figure 1 shows the SFCSD used in the current study, which is integrated with the PV system. The SFCSD was manufactured in Aswan, Egypt, using locally available materials.
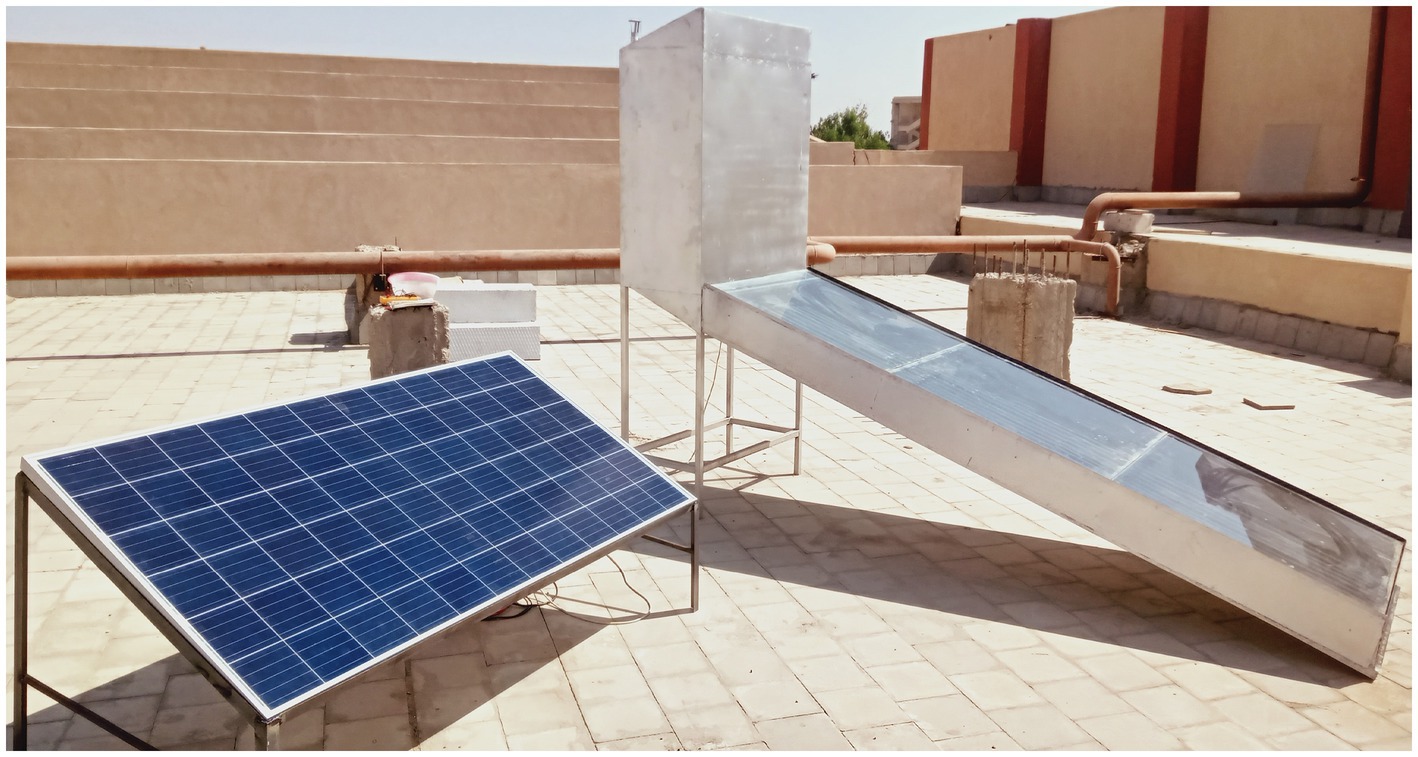
Figure 1. The SFCSD used in the current study is integrated with the PV system.
Galvanized corrugated sheets painted matte black with a thickness of 3 mm were used for absorbing the solar rays. The main frame of the SC was made of angle steel (L) 3 * 3 cm, measuring 300 cm in length and 100 cm in width. The sawdust was used to reduce heat loss, and it was layered between corrugated sheets and the main frame. A glass cover, 3.0 mm thick, is strategically placed 15 cm from the absorbent plate. The SC is inclined at a 20° with the horizontal, facing north south. The SFCSD is made up of two sections, the SC and the DR, to enable easy installation, transportation, maintenance, and repair. The DR is 98 cm high, 45 cm wide, and 100 cm long, with a primary structure constructed from 3.0 cm by 3.0 cm square metal bars. An AC suction fan was used to circulate the hot air inside the DR. The DR contains nine drying trays with 11 cm spacing between each one; the surface area of each tray is 95 * 45 cm2. Figure 2 shows the main components of the SFCSD.
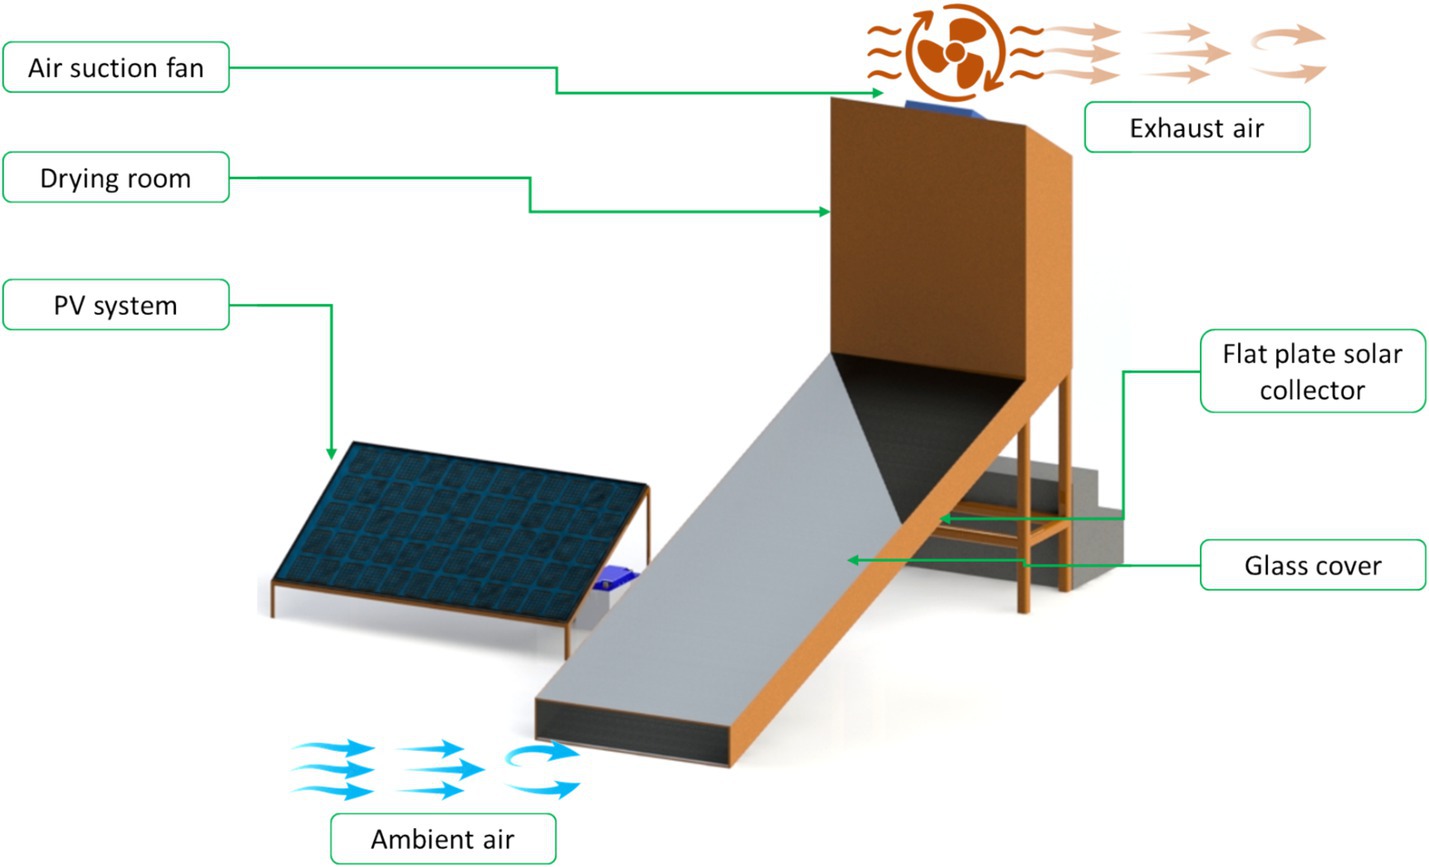
Figure 2. Main components of the SFCSD.
2.2 Preparing of DF samples
In order to evaluate the efficacy of the developed SFCSD, DF was utilized as biological material in a field test conducted at Aswan University. A total of 20 kg of five distinct DF varieties, which were cultivated in the Aswan region, were collected in October 2023. Figure 3 illustrates the most popular DF varieties grown in the Aswan region, where 3.0 kg of each date variety was loaded onto a separate tray, as depicted in Figure 4.
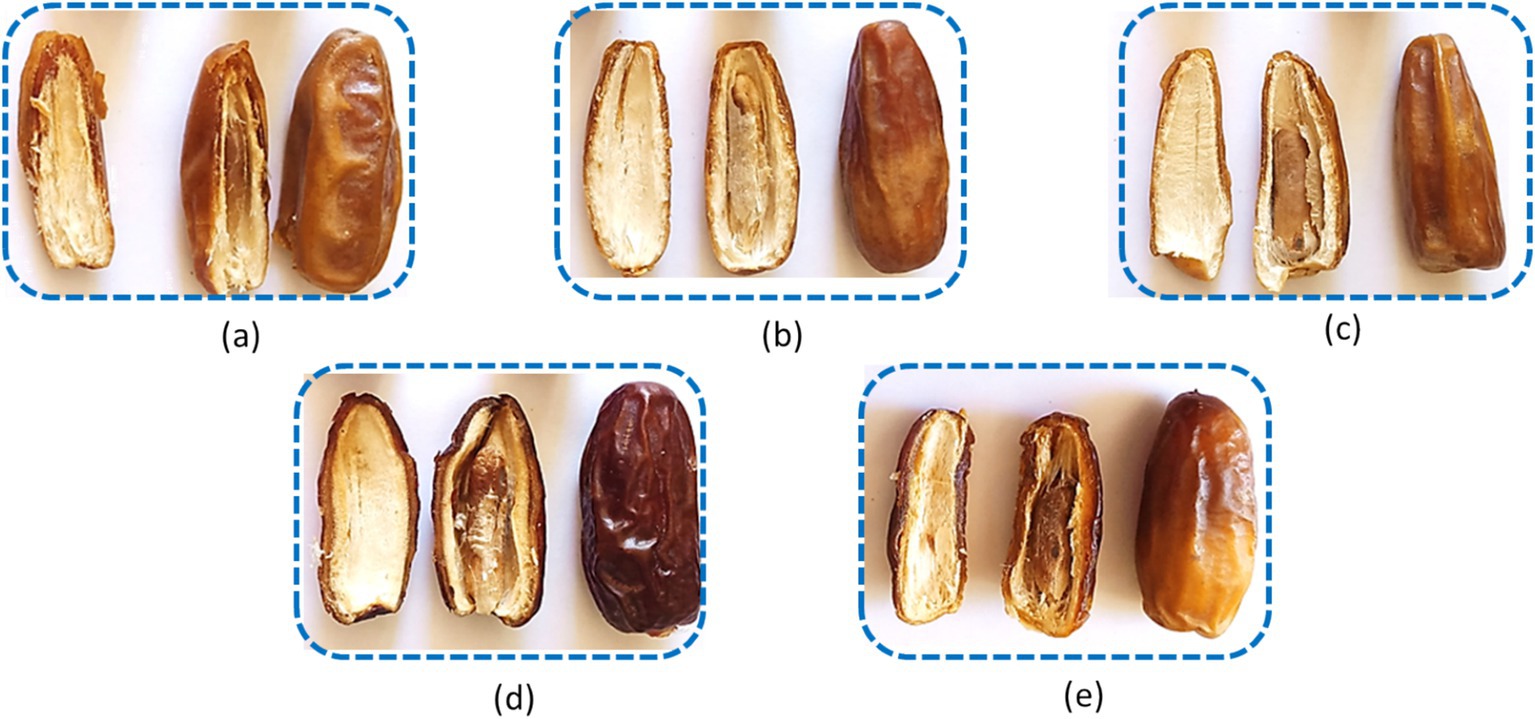
Figure 3. The most popular date varieties cultivated in Aswan, Egypt. (a) bartamuda; (b) sakkoti; (c) shamia; (d) malkabii; (e) gondaila.
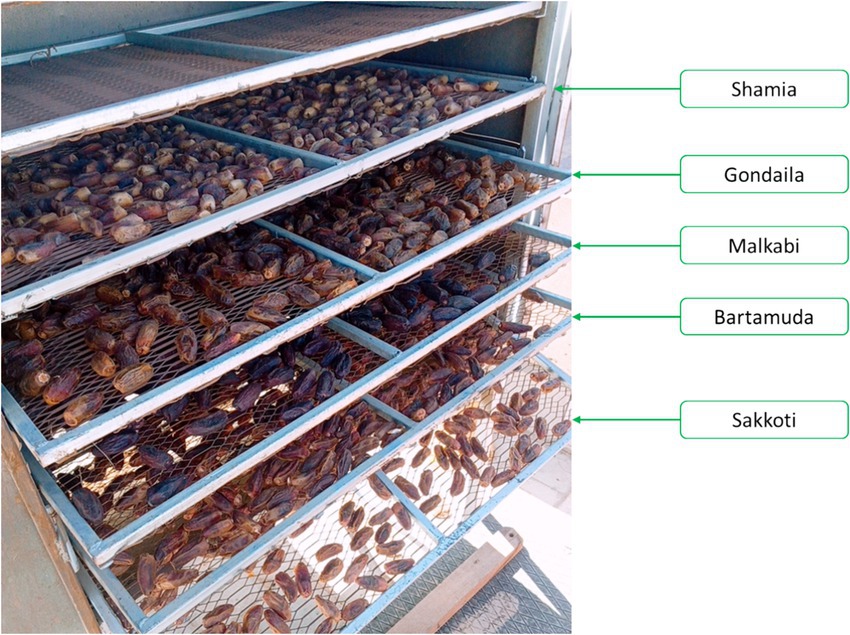
Figure 4. Distribution of different varieties of dates in the dryer.
2.3 The PV system
The PV system consists of a solar panel module type universal-TPS-P6U (72)-320 W. This panel is strategically installed with a tilt angle of 30° and oriented towards the north–south direction. As part of the system, there is a battery charger rated at 12/24 V and 20 A, in addition to a 12 V/60 Ah battery. To ensure adequate air circulation within the SFCSD, an AC suction fan rated at 220 V and 50 W is also integrated into the system.
2.4 Performance analysis of the SFCSD
2.4.1 Moisture content (MC)
The determination of MC in DF samples was carried out through a heating process at 105°C for a duration of 10 h in an electrical oven. This method is in accordance with the procedure outlined by AOAC (2005). The initial and final MC of the DF samples were calculated using Equation 1, as elucidated by Eke and Simonyan (2014),
where: is the MC on a wet basis, %; is the wet weight of the DF samples, gm; is dry weight of the DF samples, gm.
2.4.2 Weight loss
To estimate weight loss during drying of different DF samples, the following steps are followed: First, the fresh DF samples (Wt) are weighed a precision balance, then spread evenly on the drying trays and placed inside the solar dryer. At regular intervals, the different DF samples are removed, and their weight (Wt + 1) is recorded. Drying is continued until the weight stabilizes (constant weight, W₃). Weight loss is calculated using Equation 2 (ES et al., 2023; Metwally et al., 2024).
2.4.3 Moisture ratio (MR)
Moisture ratio is a dimensionless parameter and is evaluated by dividing the actual moisture content and the initial moisture content of the different DF samples. The drying rate refers to the velocity at which interior moisture dissipates into the environment (Elwakeel et al., 2023; Elmessery et al., 2024; Khater et al., 2024; El-Mesery et al., 2025). The moisture ratio of the dried different DF samples under was calculated according to Equation 3, as mentioned by Rabha et al. (2017).
where: is the initial moisture content in %, is the EMC in %, and is the moisture content at any time in %.
Consequently, as per (Doymaz, 2004), the moisture ratio of different DF samples can be expressed as depicted in Equation 4.
2.4.4 Drying rate
The drying rate of different DF samples were calculated using Equation 5, as described by (Etim et al., 2019).
2.4.5 Thermal balance of PV system
The determination of the PV system’s efficiency is a critical aspect of its performance evaluation, which requires a comprehensive analysis of the energy generation associated with its AC suction fans, control circuit, and measurement electronic circuit (Elwakeel et al., 2021). According to previous research by Shen et al. (2020), this energy generation () can be calculated using Equation 6. Therefore, to ensure an accurate assessment of the PV system’s efficiency, it is crucial to consider these factors and incorporate them into the overall analysis.
where: is the open circuit voltage, V; is the short current voltage, A.
The fill factor (FF) of a PV system is defined as the ratio of the maximum output power (), denoted as , to the output power (Qi and Wang, 2013; Mahmoud et al., 2022). The fill factor is a key performance metric of such systems and is calculated using Equation 7,
From the above equations, the PV conversion efficiency can be calculated according to Equation 8,
where, is the input power, watt, is the solar intensity, Watt/m2, is the total surface area of the PV system, m2.
2.4.6 Thermal analysis of the SCs
The efficiency of the SC can be defined as the ratio of input power () absorbed from the solar radiation (SR), and output power () consumed to raise the AT (Bala and Janjai, 2005; Usub et al., 2008). Energy input from the SC was calculated according to Equation 9.
where, is the total surface area of the SC, m2, is the solar intensity, watt/m2.
Energy output from the SC was calculated according to Equations 10, 11.
where, is the air mass flowrate, Kg/s, is the specific heat of air, kJ/kg.k, is the air temperature difference between ambient air and output air form the SC, k, ρa is the air density, kg/m3, Va is the volumetric air flowrate, m3/s, ua is the air speed, m/s.
As demonstrated in the above equation, the SC efficiency (ηcoll, %) was calculated based on Equation 12.
2.5 Experimental procedure
In the current study, we used five DF varieties, which presented the most widely grown DF variety in Aswan, Egypt. All tests associated with the drying process were carried out at Aswan University, during October 2023. The drying process and recorded data started at 7 a.m. and ended at 5 p.m. for 10 h per day. AT and RH were measured at three positions (1. outside the drying room, 2. the lower points of the DR and 3. The upper points of the DR), as shown in Figure 5. The sample’s weight for each variety was measured and recorded at 5 p.m. each day. All experiments related to the determination of the MC of fresh date samples were carried out at Aswan University. Table 1 shows the accuracy, range, and resolution of the devices and sensors used in the current study.

Figure 5. The relation between operated speed and observes speed of the speed sensor integrated with the air suction fan.
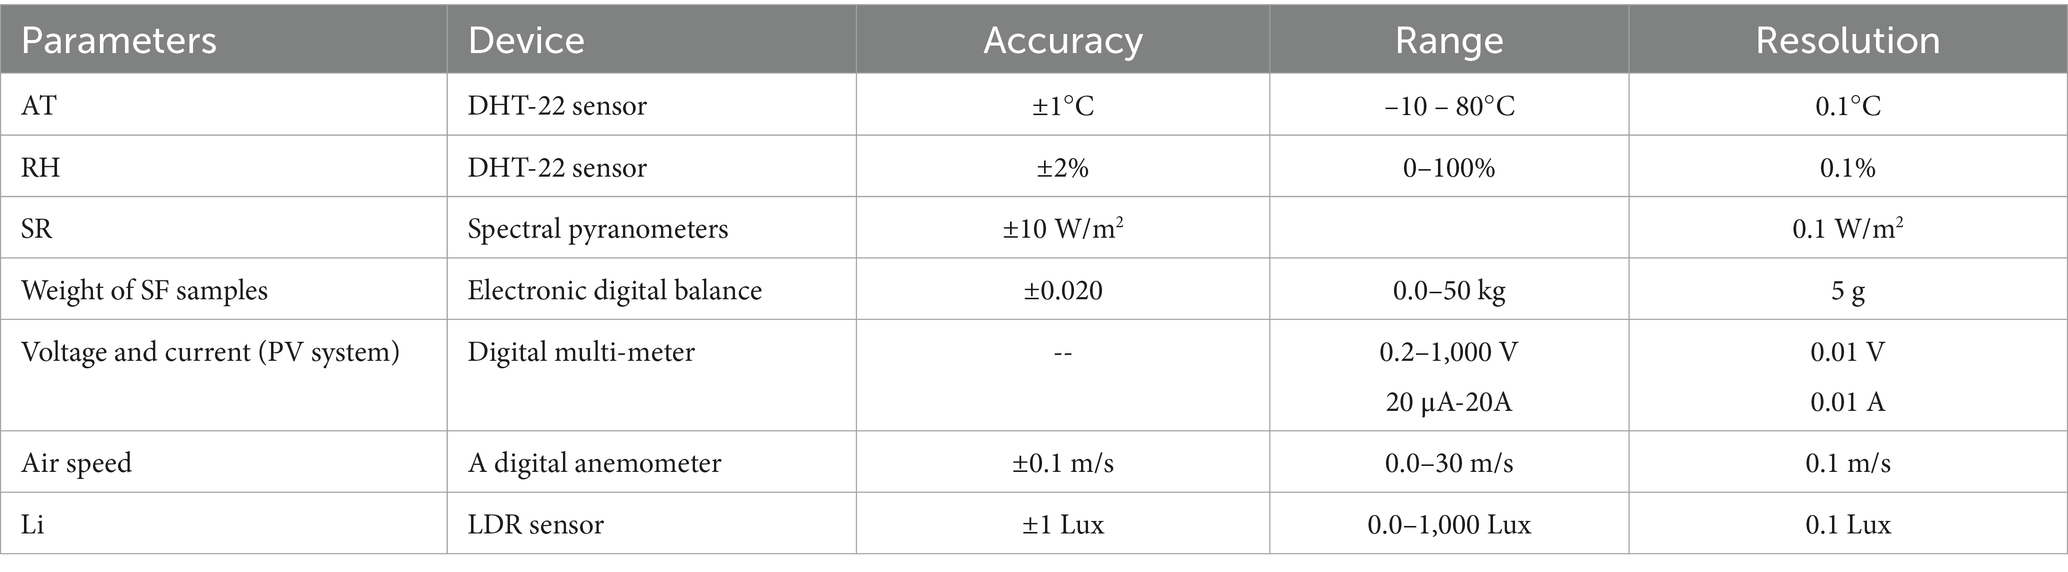
Table 1. The accuracy, range, and resolution of the measuring devices and sensors.
2.6 Effective moisture diffusivity (EMD)
The moisture ratio () of the dried DF samples was calculated using Equation 13, as stated by (Crank, 1975; Doymaz, 2011; Coşkun et al., 2017; Samimi-Akhijahani and Arabhosseini, 2018; Badaoui et al., 2019),
where: M is the final MC, %; is the initial MC, %; n is the number of terms; is the effective moisture diffusivity, m2/s; t is the time in s; is the determination of coefficient.
Neglecting the higher terms of Equation 14 due to longer drying times, the moisture ratio can be evaluated using Equation 14 or Equation 15.
OR
The diffusion coefficient () was obtained by plotting experimental drying data in terms of versus time (s). The slope (k0) was calculated by plotting versus time, as follows:
2.7 Environmental analysis
Every constructed facility requires a significant amount of energy during its life cycle, including building, operation, and disposal stages. Energy consumption can be divided into embodied energy (EE) and operating energy. Embodied energy (EE) refers to the overall energy consumption involved in extracting raw materials, transporting them, producing, constructing, using (including maintenance and restoration), and disposing of them (Vijayan et al., 2020). Operating energy refers to the amount of energy needed to support the functioning or implementation of a system during specific periods. The operating energy of a system constitutes a significant proportion of the overall energy consumption. Nevertheless, in the design of energy-efficient structures, embodied energy constitutes a growing part of overall energy consumption throughout the whole lifespan.
Recently, there has been a growing focus among researchers on reducing the overall energy consumption (including electrical energy and oil energy) in constructed buildings, with the aim of decreasing reliance on traditional energy sources. Solar dryers are energy-efficient structures that operate using freely accessible solar energy, which is eco-friendly and a clean renewable energy source. The energy efficiency of the system may be analyzed by considering its total energy consumption. Additionally, the environmental impact of the system can be evaluated by examining indicators such as EE, EPP, and greenhouse gas emissions during its life cycle.
Table 2 provides the EE of the various materials utilized in the manufacturing of the developed SFCSD. The developed SFCSD consists of several materials, with a total mass of 85.5 kg (without PV system).
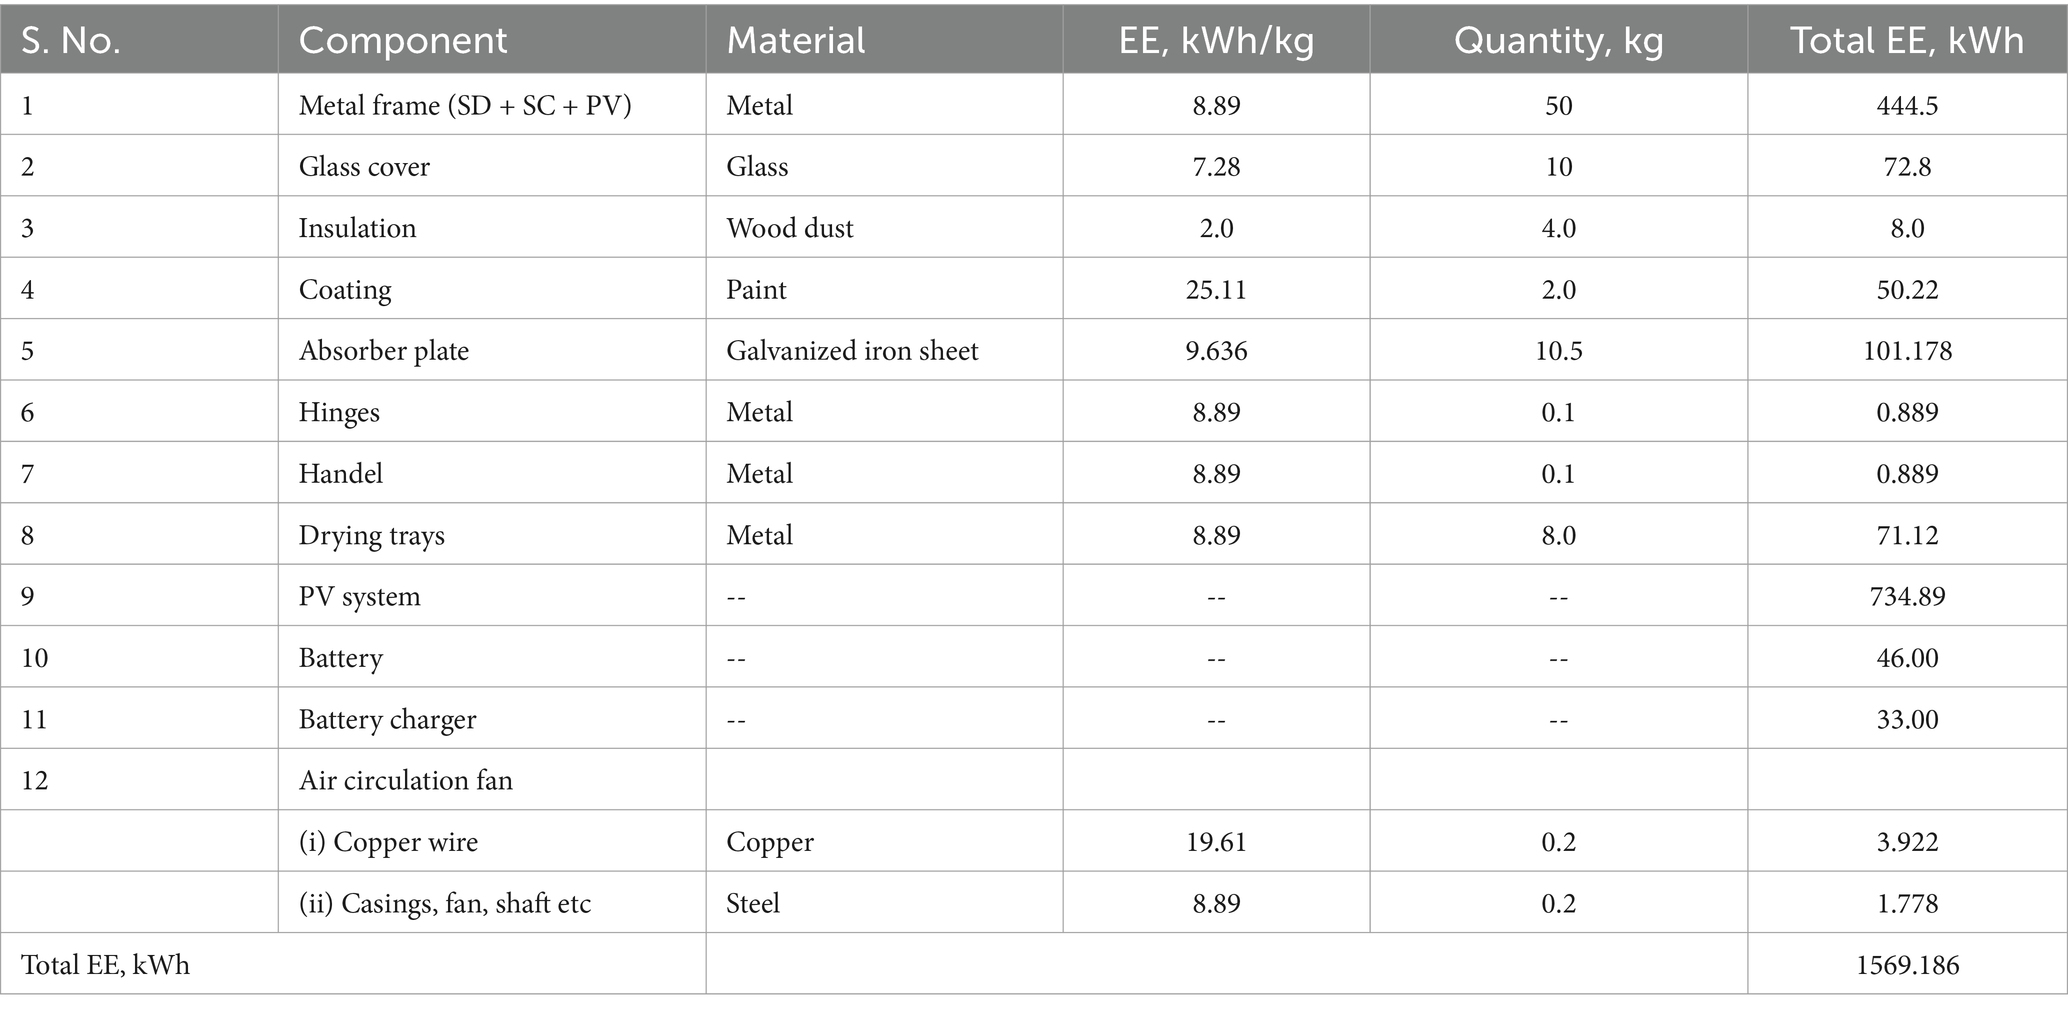
Table 2. EE calculation data for manufacturing of the developed SFCSD (Grazieschi et al., 2021; Aubin et al., 2022; Wikoff et al., 2022).
2.7.1 Energy payback period (EPP)
The EPP refers to the duration required to compensate for the amount of energy invested in the manufacturing of the SFCSD. The EPP is calculated using Equations 17–19 (Vijayan et al., 2020).
2.7.2 CO2 emission
The average CO2 emission for energy generated by coal is around 0.98 kg of CO2 per kilowatt-hour (kWh), additionally, if the transmission losses are assumed as Lt, and La are equal 40 and 20%, respectively, due to old appliances. The annual CO2 emissions can be determined by utilizing Equation 20 (Prakash and Kumar, 2014a).
2.7.3 CO2 mitigation
The CO2 mitigation of the developed SFCSD can be estimated using Equation 21, according to (Nayak et al., 2012).
2.7.4 Earned carbon credit (ECC)
Each ECC corresponds to the reduction of one metric ton (1,000 kg) of CO2 emissions, and the credit obtained from the developed SFCSD was determined using Equation 22 (Vijayan et al., 2020).
The calculations and input parameter values are illustrated in Table 3.

Table 3. Calculations and input parameter value of the developed SFCSD.
2.8 Statistical analysis
It is usual practice to evaluate the level of correlation between measured data using a variety of measures. The coefficient of determination, or R2, is one example of such a statistic. To determine the R2 value in the current study, Excel 365 from Microsoft Office was used. This software program was selected since it is widely used for data analysis in both business and academic settings.
3 Results and discussion
3.1 Calibration of different sensors
In order to validate sensor data prior to its utilization, it is imperative to apply sensor calibrations that are influenced by the aforementioned elements. To ensure the accuracy of data acquisition, it is necessary to calibrate the output signals generated by the sensors against the reference standard instrument, thereby creating calibration curves that illustrate the sensors’ responses to the reference instrument data. This calibration process is vital as it provides a framework for the development of accurate and reliable sensor data output (Cold and Facilities, 2022).
3.1.1 Calibration of speed sensor
The speed sensor serves an integral function in ensuring the safety and optimal performance of the suction fan as it forms a crucial component of the automatic warning system that measures the fan’s speed. By incorporating this sensor into the fan’s system, an operator can be confident that the equipment is being continuously monitored, and any possible malfunctions will be detected in a timely fashion. As a result, it is imperative that the suction fan is equipped with a reliable speed sensor to guarantee the smooth running of the entire system without any potential risks.
Figure 5 illustrates the relationship between the speed values of the sensor as observed and operated. The y-axis displays the observed speed measured by the speed sensor (model: LM393IC), while the x-axis denotes the operated speed measured by the Uni-T Tachometer (model: UT371). Ideally, both values should be identical, indicating a perfect calibration. However, a slight difference exists between them, and this disparity is mathematically represented by the equation y = 0.9858x + 0.2062, which demonstrates a linear relationship between the two values. The gradient of the line is 0.9858, and the y-intercept is 0.2062, which implies that the sensor underestimates the speed by a small amount. The value of R2, which is 0.9904, indicates a strong correlation between the observed and operated speeds.
3.1.2 Calibration of Li sensor
The integration of a Li sensor with the automatic control circuit has enabled the facilitation of the drying process. The system is designed to activate the drying process during the day while preventing it from operating during the night to avoid the possibility of remoisturizing the date samples. This approach ensures that the drying process is carried out efficiently and that the quality of the samples is maintained.
Figure 6 shows the calibration of a Li sensor (model: GL5506). The y-axis, labeled “measured Li (Lux),” represents the sensor’s output voltage converted to Li in lux. The x-axis, labeled “reference Li (Lux),” represents the actual Li measured by a calibrated reference device (model: UT383s). The ideal scenario would be a straight line at a 45-degree angle, indicating perfect calibration where the measured intensity perfectly matches the reference intensity. However, the line in the graph slants slightly upward, indicating that the sensor underestimating the actual light intensity. The equation y = 0.9966x + 0.9525 represents the linear relationship between the measured and reference light intensities. The slope of 0.9966 is very close to 1.0, indicating a nearly proportional relationship. The y-intercept of 0.9525 indicates a small systematic bias. The R2 value of 0.987 indicates a very strong correlation between the measured and reference intensities, meaning the sensor’s response is consistent and predictable, despite the slight underestimation.
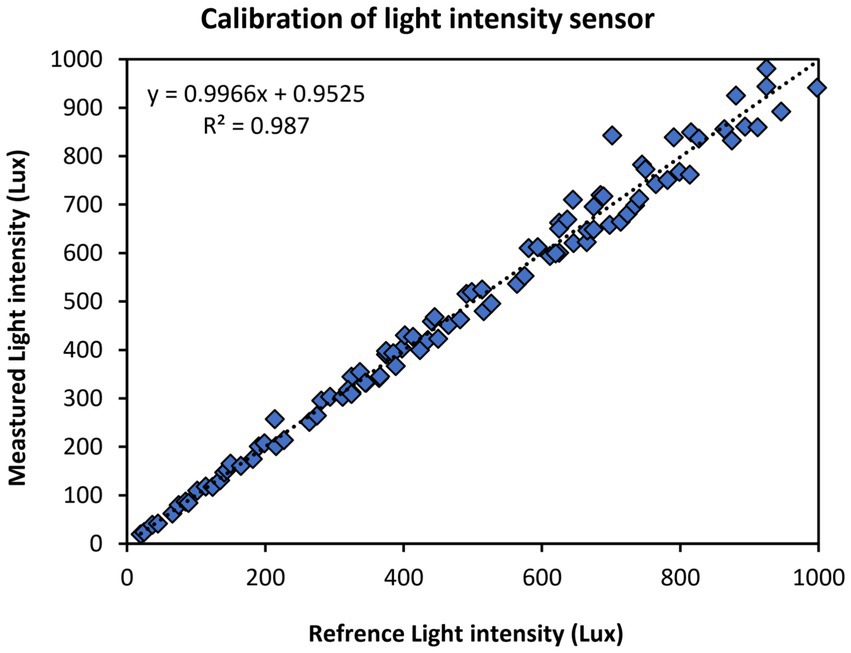
Figure 6. Relation between reference and measured Li of the Li sensor integrated with the automatic control circuit.
3.1.3 Calibration of the AT sensor
The AT sensor is an indispensable component of the automatic control circuit. It is responsible for regulating the air suction fan, a key element in the drying process, by detecting and responding to changes in ambient AT. Specifically, the AT sensor initiates the forced convection system when the AT inside the DR exceeds the predetermined value. Conversely, it deactivates the forced convection system and activates the natural convection system when the AT inside the DR falls below the set value. As such, the AT sensor plays a crucial role in optimizing the drying process and ensuring that it is efficient, effective, and consistent.
The AT sensor calibration (model: DHT-22) is displayed in Figure 7 in comparison to the reference digital AT meter (model: UT333s). Plotting the measured AT values against the calibration bath’s reference AT data was done. Along with the R2 value, which indicates how well the data fits the linear model, the line of best fit is also displayed. The AT sensor’s excellent calibration is further demonstrated by Figure 7, which displays an R2 value of 0.9863. This indicates that 98.63% of the variation in the data can be explained by the linear model. This suggests that the calibration bath’s AT is being precisely measured by the AT sensor.
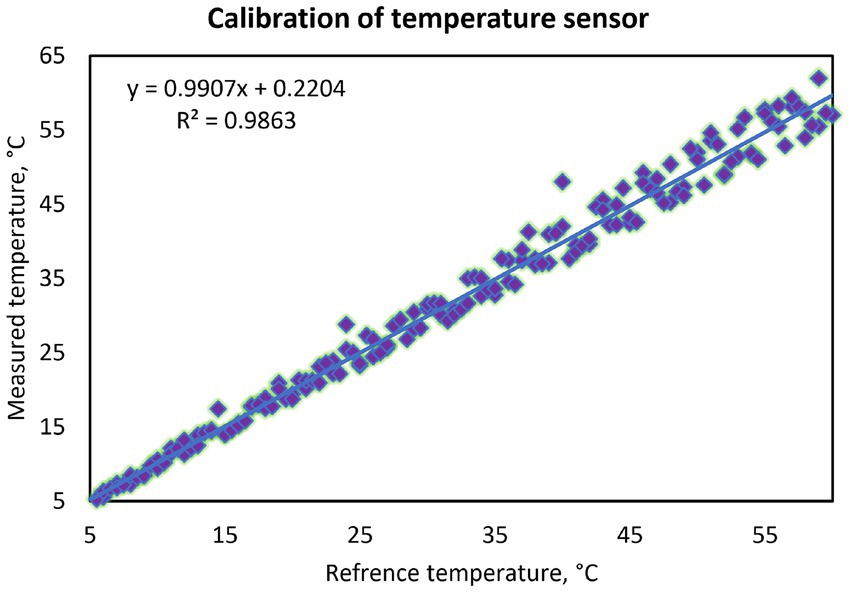
Figure 7. Relation between reference and measured AT by AT sensor integrated with the automatic control circuit.
3.2 Estimation of weather conditions
The SR, ambient AT, and RH were acquired from the weather station located within Aswan University. Figure 8 shows variation in SR, ambient AT, and RH during the drying test period from October 10, 2023, to October 18, 2023, from 7 a.m. to 5 p.m.
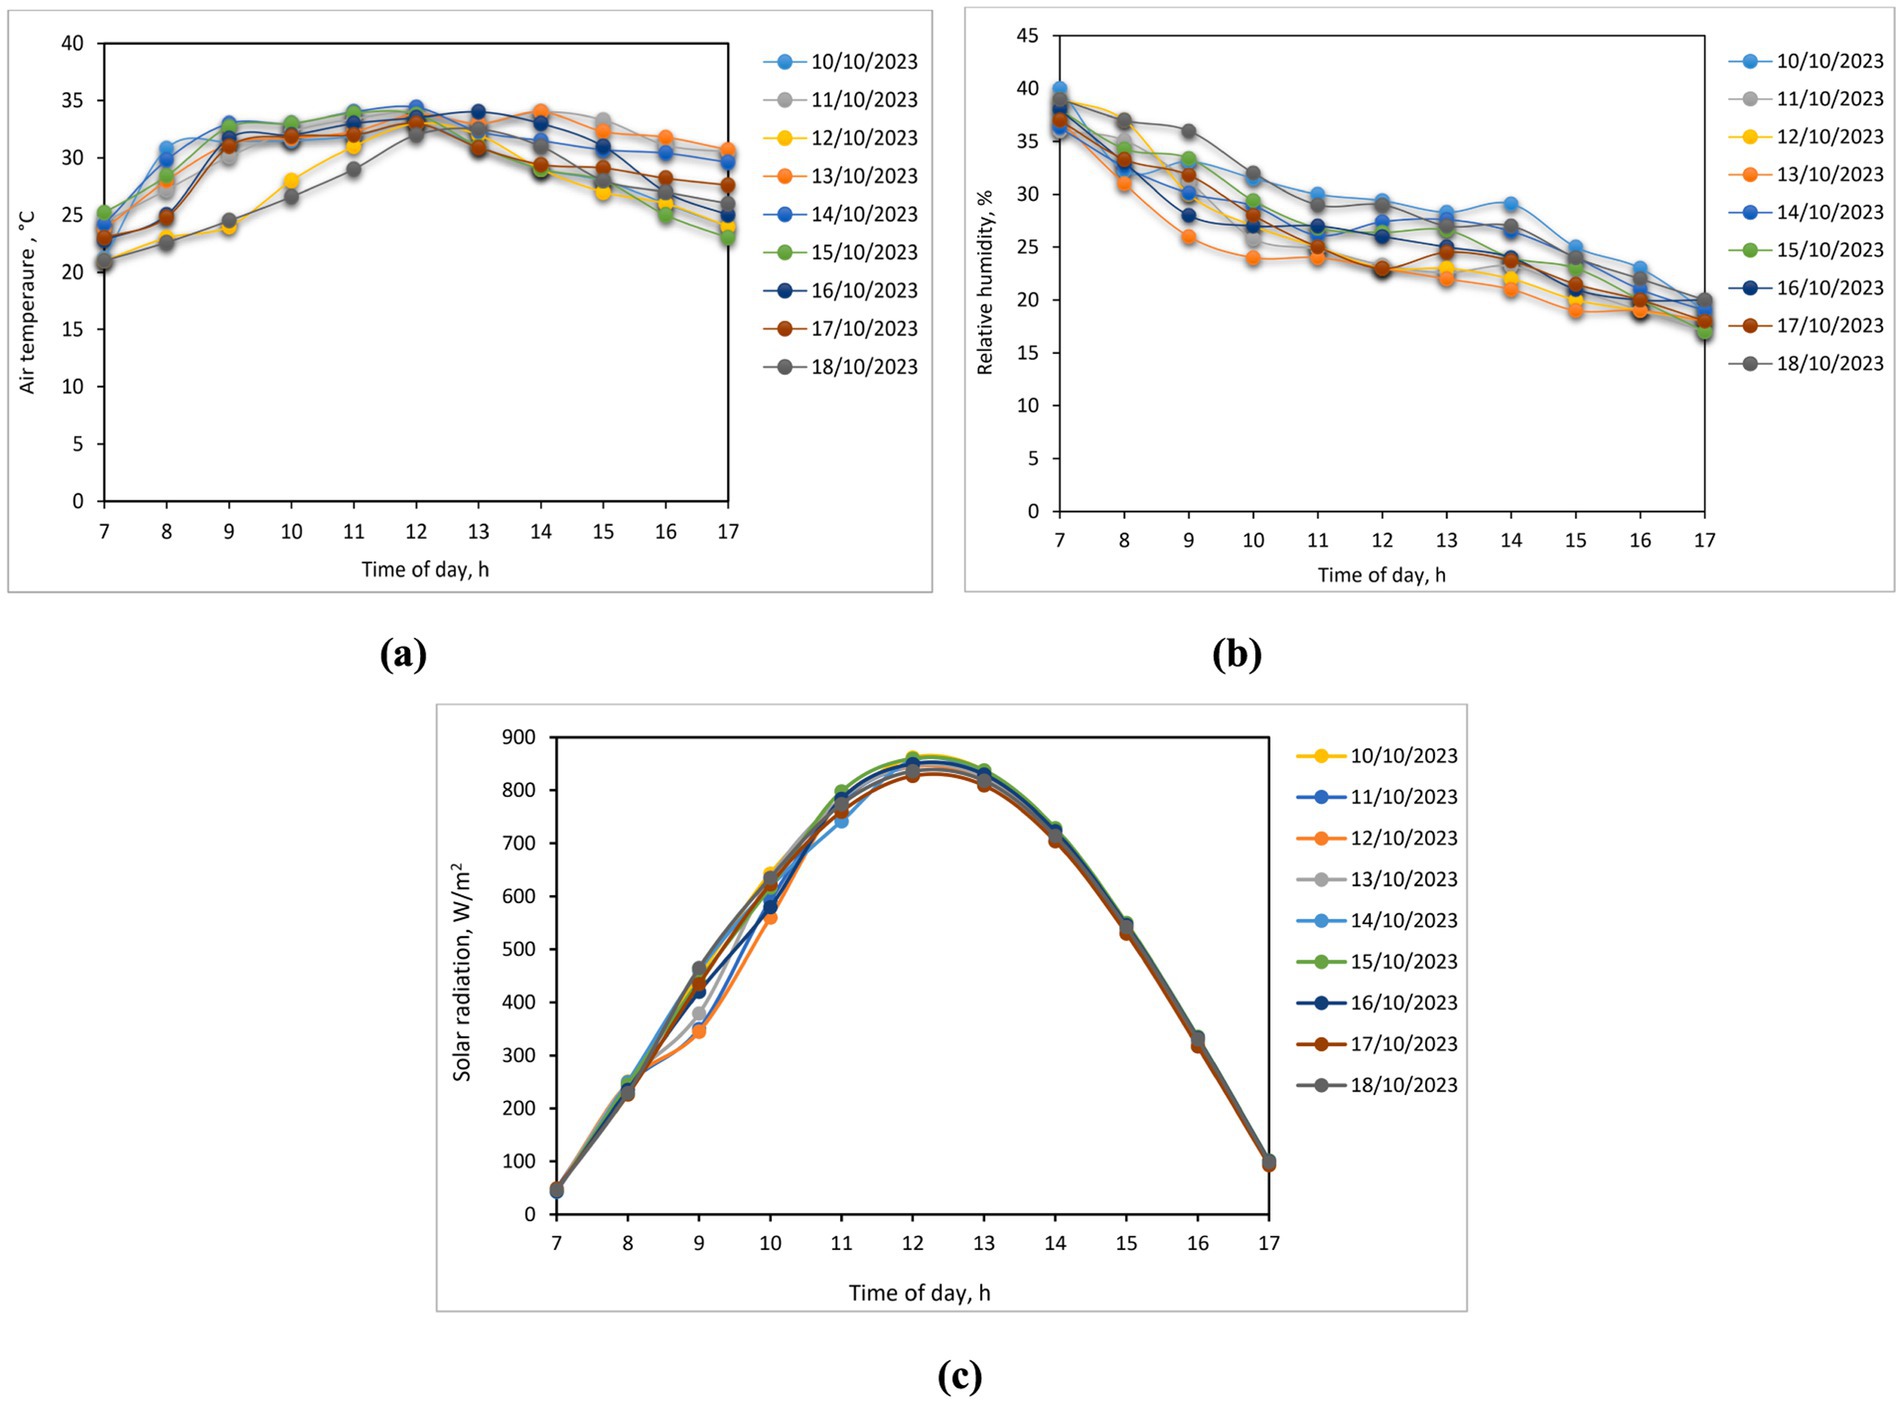
Figure 8. Variation on SR, ambient AT, and RH during the drying test. (a) Ambient AT; (b) RH of ambient air; (c) SR.
During the drying tests the maximum and minimum daily ambient AT were 34.4°C and 21°C, respectively, whereas the average ambient AT was 29.46°C. Moreover, the maximum and minimum daily ambient air humidities were recorded as 39.4 and 15% respectively, with the average ambient RH being 23.68% during the drying tests. Lastly, the maximum and minimum daily SR intensities were recorded at 862 W/m2 and 43 W/m2, respectively, with the average SR intensity during the drying tests being 494.78 W/m2. It is evident that the ambient AT and RH, along with the SR intensity, play a crucial role in the drying process. These factors are essential to consider while designing and optimizing drying systems, especially for heat-sensitive materials. Where the results of the drying test are heavily contingent on the variation of SR, ambient AT, and RH. As such, it is imperative that these variables are meticulously monitored and controlled throughout the test to ensure precise and reliable outcomes. Meticulous management of these variables can lead to accurate results and informed decision-making based on the outcomes of the test.
3.3 Moisture content (MC)
The initial and final MC (w.b.) of the DF samples were 12.08 and 4.57% for shamia, 10.32 and 3.89% for bartamuda, 11.21 and 4.15% for sakkoti, 12.56 and 4.41% for malkabii, and 10.75 and 3.98% for gondaila, on a dry basis (Elwakeel et al., 2023) reported that the MC (w.b.) of fresh and dried DF varieties sakkoti, gondaila, and malkabii were 17.64 and 6.06%, 15.68 and 6.58%, and 14.89 and 5.56%, respectively. Elghazali et al. (2020a, 2020b) stated that the MC (w.b.) of fresh and dried date varieties sakkoti, bartamuda, gondaila, malkabii, and shamia were 18.28 and 4.16%, 19.49 and 3.25%, 14.38 and 3.35%, 13.47 and 3.48%, 17.20 and 4.93%, respectively. The drying curves for five different DF varieties are shown in Figure 9, where MC was shown to gradually decline over time. The drying process of the different DF varieties required nearly 90 h (9 days) to reach EMC, the initial MC that is 12.08% for shamia, 10.32% for bartamuda, 11.21% for sakkoti, 12.56% for malkabii, and 10.75% for gondaila, on a dry basis, to reach the final MC that is 4.57% for shamia, 3.89% for bartamuda, 4.15% for sakkoti, 4.41% for malkabii, and 3.98% for gondaila, on a dry basis. Figure 9 demonstrated that major moisture loss occurred during the falling rate period, which come in agreement with previous studies reported by many researchers (Stephen, 2014; Navale et al., 2015; Farag et al., 2016; Téllez et al., 2018; Babar et al., 2020; Etim et al., 2020; Tesfaye and Habtu, 2022).
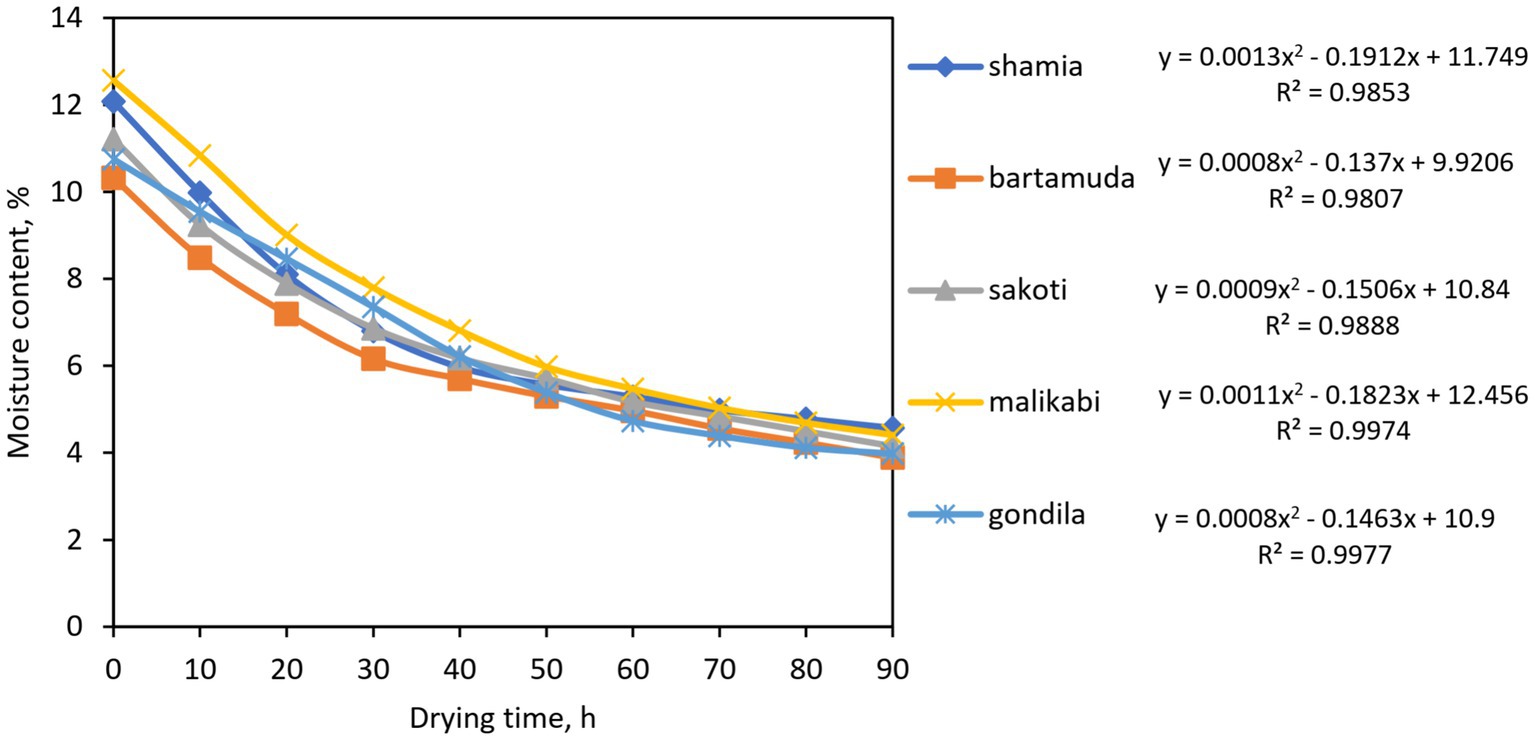
Figure 9. Moisture content during solar drying of five different DF varieties.
3.4 Weight loss
Some agricultural products lose a lot of weight, which hurts their quality and makes them less profitable. For example, they might lose shape or texture, or the color might turn bad (Wang et al., 2018). The primary cause of weight loss is the process of leaching and diffusion when water-soluble elements are released from tissue into the surroundings (Mukherjee and Chattopadhyay, 2007). Figure 10 shows weight losses of different DF samples as a function of drying time. The illustrated data in the same figure showed that the weight loss of different DF varieties did not significantly differ with increasing the drying time. The previous study conducted by Elghazali et al. (2020b), Elghazali et al. (2020a), and Elghazali et al. (2020b), showed that the Aswan date varieties reached the EMC after 14 days using passive ISD integrated with FPSC and 25 days in OSD. In this study it was demonstrated that a shorter drying time of 90 h (9 days) was necessary to reach the EMC for all DF varieties. In addition, (Elwakeel et al., 2023), stated that the DF samples reached the EMC on the ASD connected with FPSC after 8 days for both Malkabi and Gondaila and 9 days for Sakkoti, while it took 14 to 15 days on OSD.
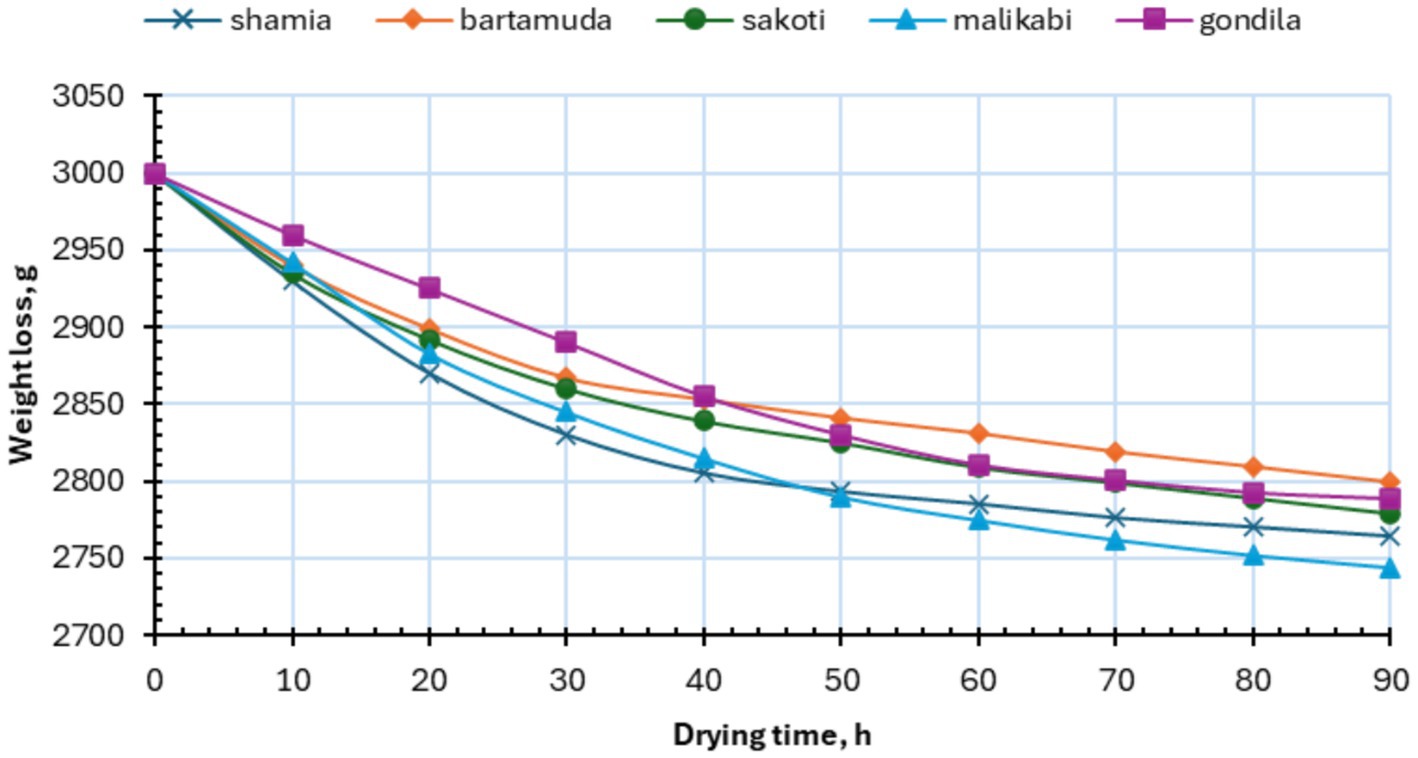
Figure 10. Weight loss verses drying time for different DF samples.
3.5 Moisture ratio
The moisture ratio of DF is a critical parameter in drying processes, indicating the reduction in moisture content over time. Using a solar dryer, dates are dehydrated efficiently by harnessing solar energy, which evaporates moisture while preserving nutrients. The moisture ratio decreases as drying progresses, ensuring optimal texture and shelf life (Elghazali et al., 2020a; Elwakeel et al., 2022). Figure 11 illustrates the variation of moisture ratio relative to drying time for different DF varieties. After reaching the equilibrium MC, the moisture ratio was 0.38, and it was observed in DF varieties of shamia and bartamuda, while the lowest moisture ratio was 0.35 in DF of malikabi.
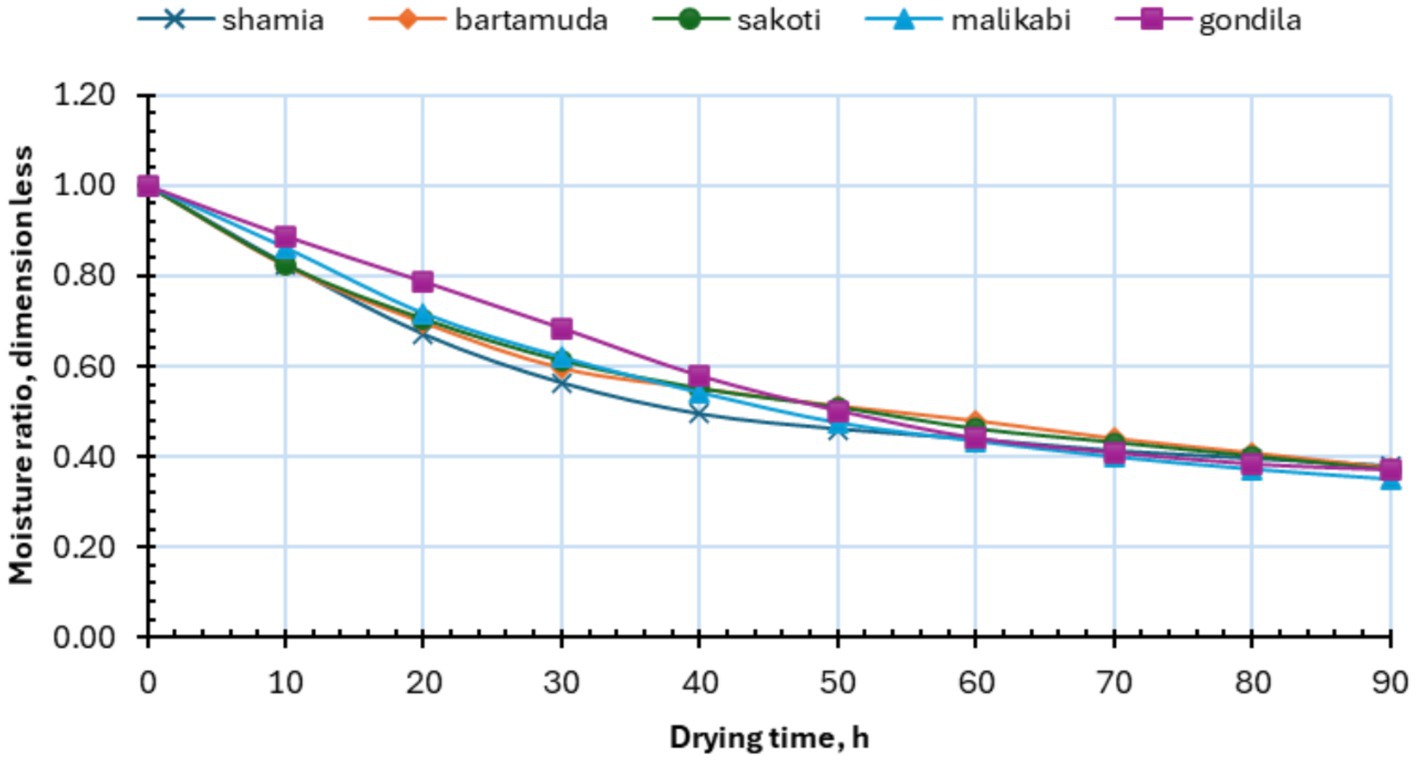
Figure 11. Moisture ratio verses drying time for different DF samples.
3.6 Drying rate
In Figure 12 the drying rates are reported as a function of time for all DT varieties, while in Figure 13 the moisture content of dates is reported as a function of the drying rate. The drying rates of the different DF varieties dried using the SFCSD ranged was 7.0 kgwater/kgdry matter/h, 6.5 kgwater/kgdry matter/h, 6.0 kgwater/kgdry matter/h, 5.8 kgwater/kgdry matter/h, and 4.0 kgwater/kgdry matter/h for DT variety of shamia, sakkoti, bartamuda, malikabi and gondila, respectively. The drying rate is significantly influenced by both drying temperature and layer thickness. Higher drying temperatures inside the SFCSD accelerate the drying rate by providing more thermal energy, which enhances moisture evaporation and internal diffusion. Conversely, thicker dried materials, such as DF, slow down the drying process because heat penetration and moisture diffusion to the surface become less efficient. Balancing these factors is crucial for optimizing drying efficiency: too high temperature may damage heat-sensitive materials, while excessive layer thickness can lead to uneven drying and prolonged drying times (Elshehawy and Mosad, 2022).
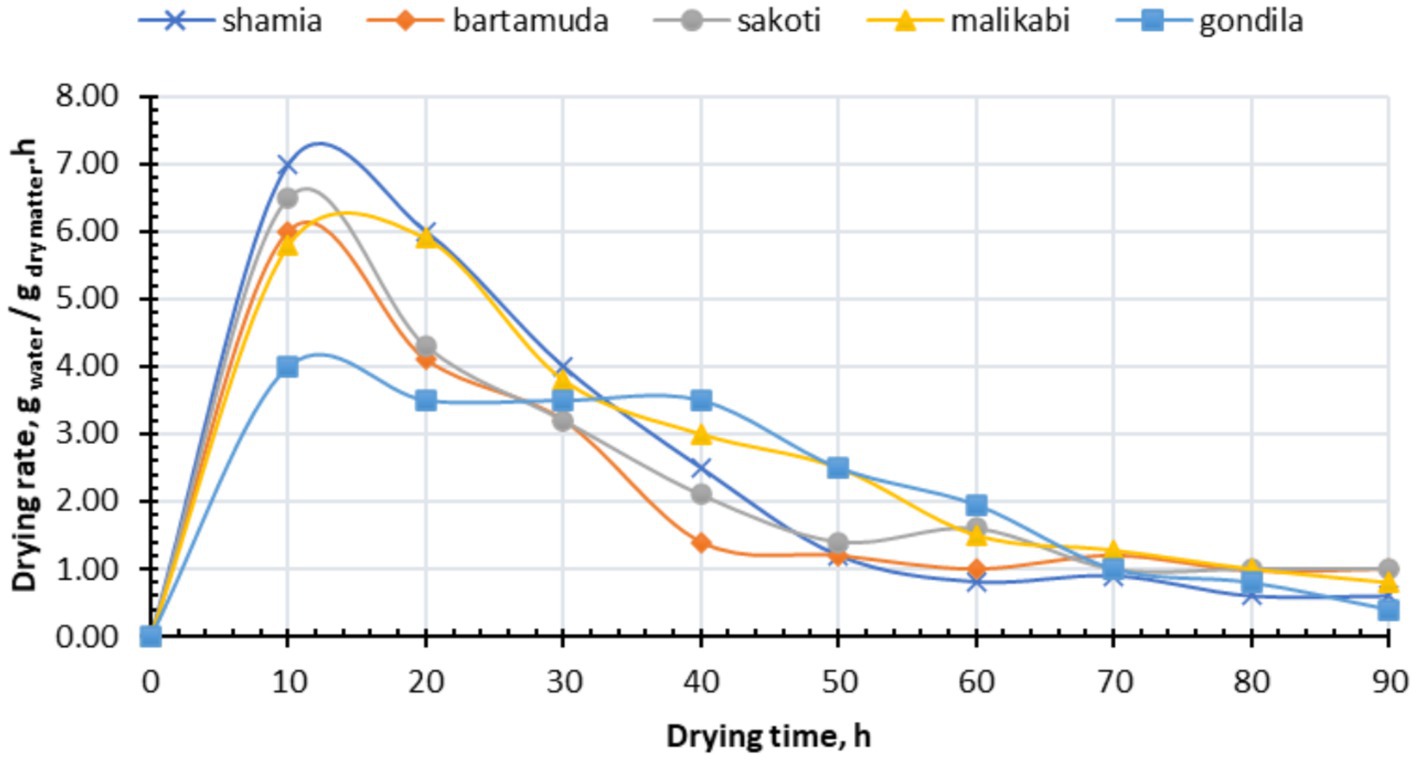
Figure 12. Drying rate verses drying time for different DF samples.
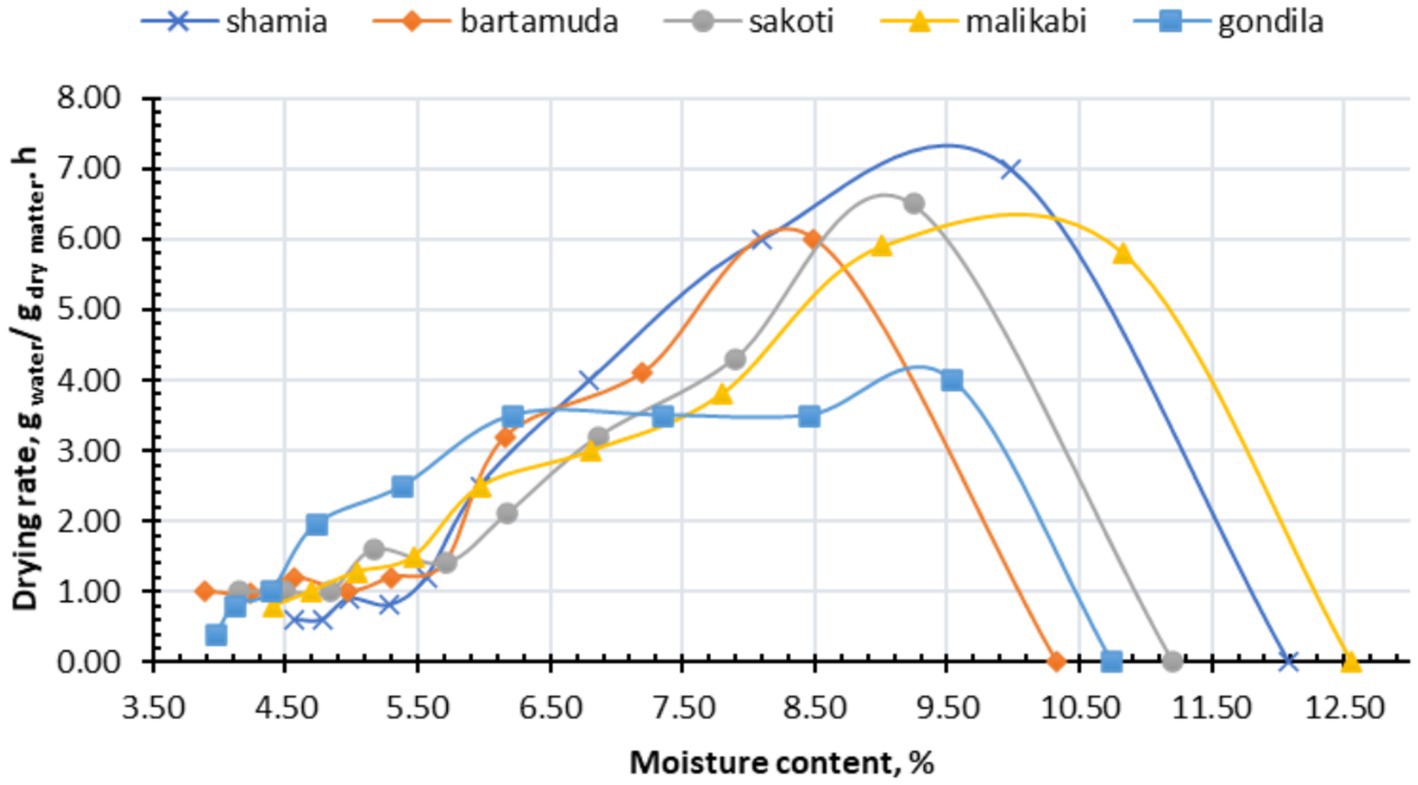
Figure 13. Drying rate verses moisture content for different DF samples.
3.7 Effective moisture diffusivity (EMD)
The values of EMC for various DF varieties, including shamia, bartamuda, sakkoti, malkabii, and gondaila, were calculated using Eq. 11. (Touil et al., 2014), demonstrated that that the EMD value is influenced by the reduced distance moisture must traverse prior to evaporating into the ambient atmosphere. Moisture gradients generated within the meal during drying induce strains in the cellular structure. According to Mayor and Sereno (Mayor and Sereno, 2004), this may result in structural failure, causing alterations in the material’s volume, shape, or dimensions. The duration of moisture diffusion from the interior of the meal to its exterior is influenced by the rupture of cell walls. Touil et al. (2014), assert that this feature must be incorporated into mathematical models to ensure accurate predictions of sample moisture content during drying or to choose the suitable EMD. Various aspects, such as the pre-treatment solution, AT, and the properties of the dried materials, influenced the EMD (Doymaz and İsmail, 2011; Elwakeel et al., 2024b). The values of Deff found were in the range between 3.5569 × 10⁻⁷ m2/s and 3.9489 × 10⁻⁷ m2/s. The EMD was affected by many factors, such as the pre-treatment solution, AT, and properties of the dried materials (Doymaz and İsmail, 2011). It can be seen that the EMD values for the malkabi date variety are greater than those obtained for the other DF varieties under the same drying conditions. Table 4 shows some previous studies that examined the Deff of dried products.
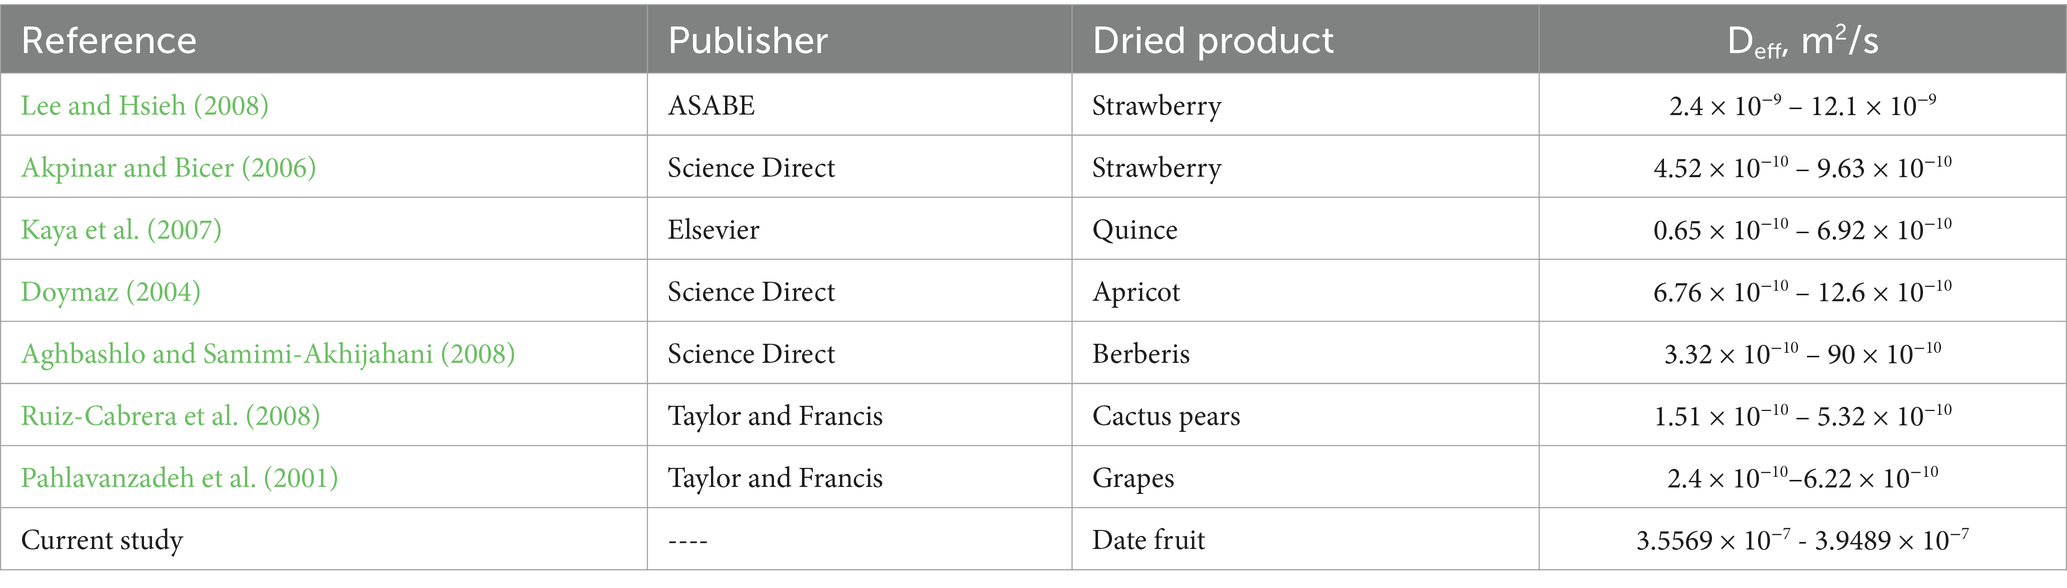
Table 4. Some studies are examining the Deff of dried products.
3.8 Thermal balance of PV system
The PV system was employed to supply electricity to the various electronic and control systems. Additionally, the system powered an air suction fan and a SFCSD in rural areas that lacked access to conventional power sources. The PV system has been demonstrated to be a viable and sustainable alternative for powering essential equipment in remote locations. Its implementation has led to a significant reduction in greenhouse gas emissions, thus contributing to a cleaner and more sustainable environment. Throughout the drying process, the open-circuit voltage and short-circuit current of the PV system were carefully measured on an hourly basis. Subsequently, the PV system’s efficiency was computed based on the daily SR while assuming a fill factor of 0.8. Figure 14 demonstrates the efficiency of the PV system versus SR. The maximum and minimum efficiency of the PV system were 25.28 and 9.14%, respectively. Jaiganesh and Duraiswamy (2013) reported that the efficiency of the PV panel ranged from 9.52 to 14.5%. Yamamoto et al. (2018), and Haschke et al. (2018) reported that the PV efficiency ranged between 24 and 27%. Ho et al. (2018) and (Müller et al. (2017) stated that PV systems currently commercially produced have an efficiency of between 14 and 19%.
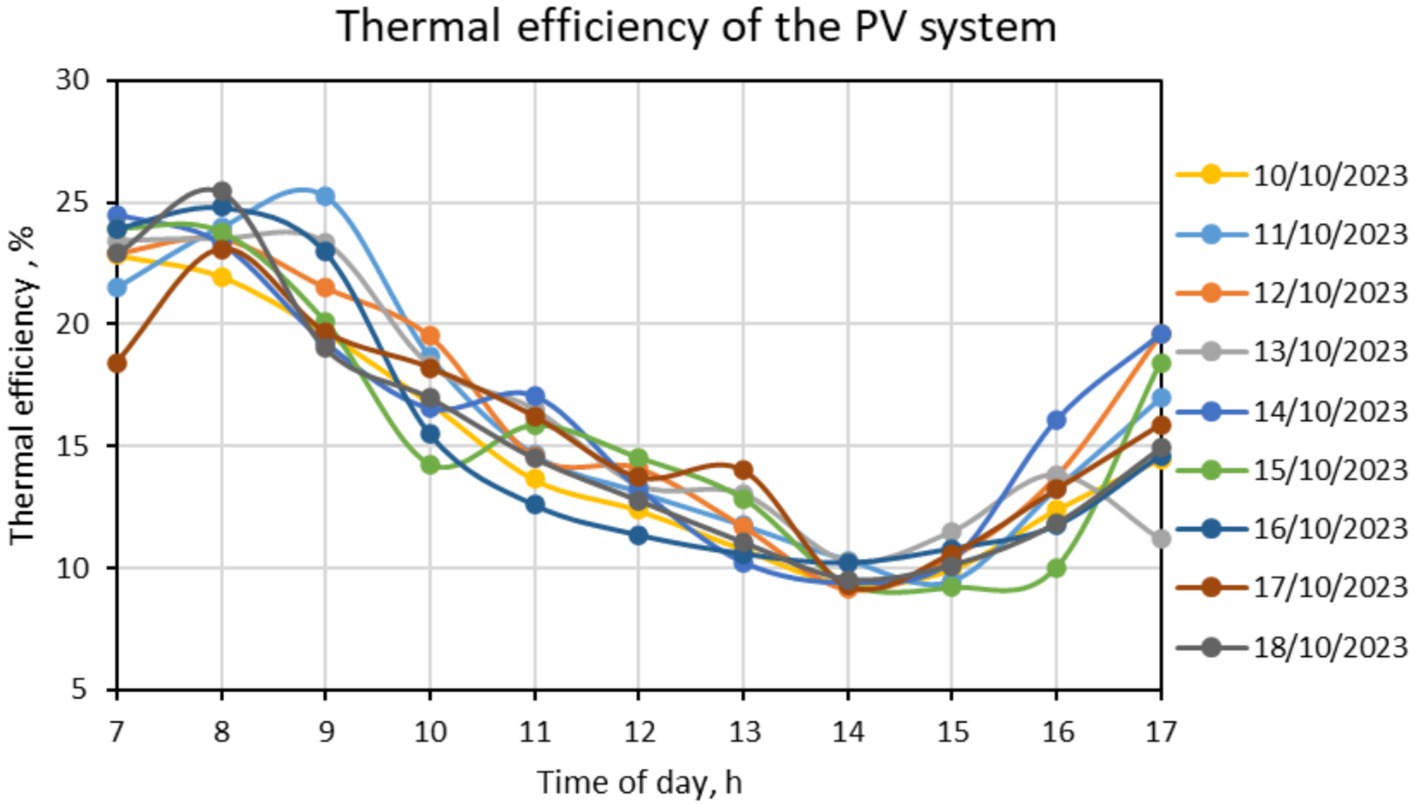
Figure 14. The thermal efficiency of the PV system during the test period.
3.9 The average efficiency of the SC
The present study aimed to assess the efficiency of a SC during the test period. To this end, both input and output energy were taken into account while calculating the SC’s efficiency. The input energy is derived from SR, whereas the output energy is determined by the difference between the AT of the heated air inside the collector and the ambient air. The input energy, in turn, is directly proportional to the SR that strikes the SC and its surface area in an hour. The results of this study are presented in Figure 15, which shows the average efficiency of the SC during the test period. These findings provide valuable insights into the performance of the SC and could inform future research and development in this area. The data shown in Figure 15 indicates that during the drying period, the SC’s efficiency progressively rises throughout the day. Additionally, the data shows that around 1 p.m., the SC’s highest efficiency was 69.52%. Furthermore, at 7 a.m. and 5 p.m., the SC’s minimum efficiency was 24.2 and 26.62%, respectively. Table 5 shows some earlier studies that estimated the efficiency of traditional FPSC.
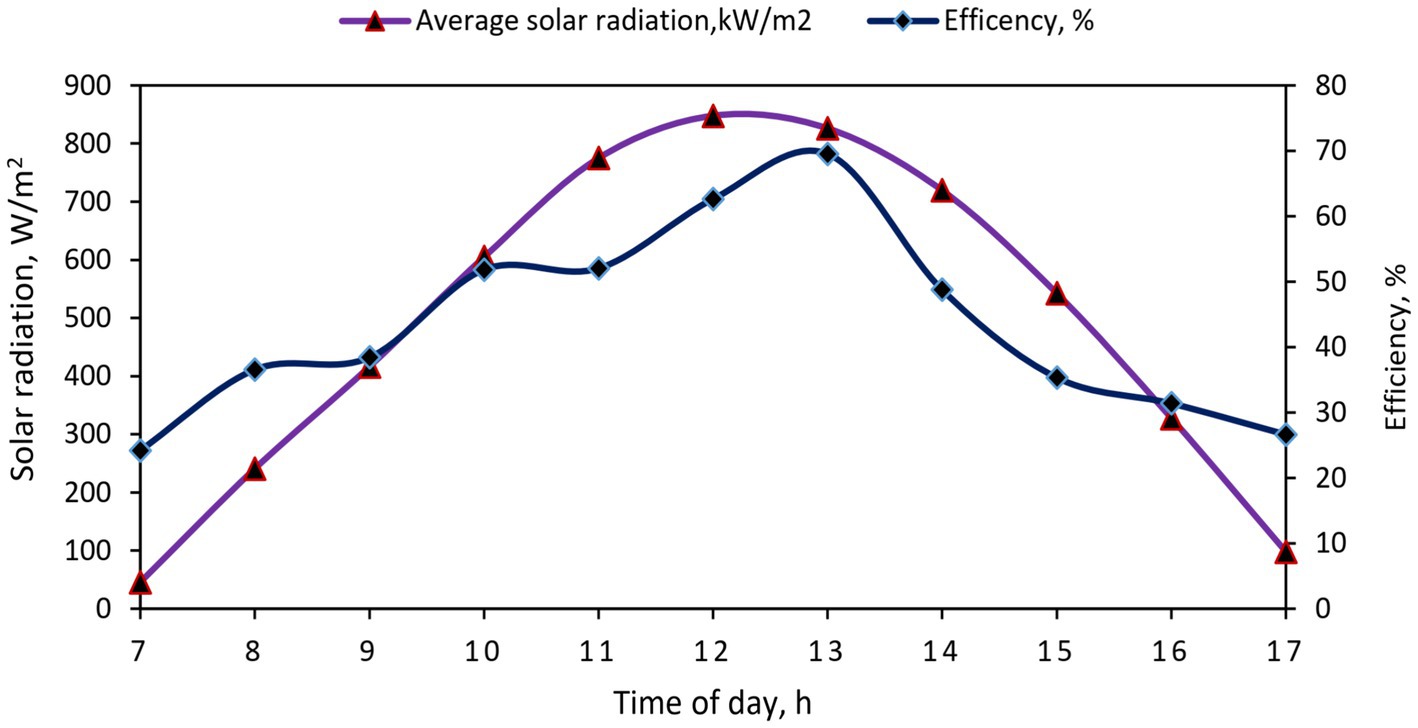
Figure 15. The average efficiency of the SC during the test period.
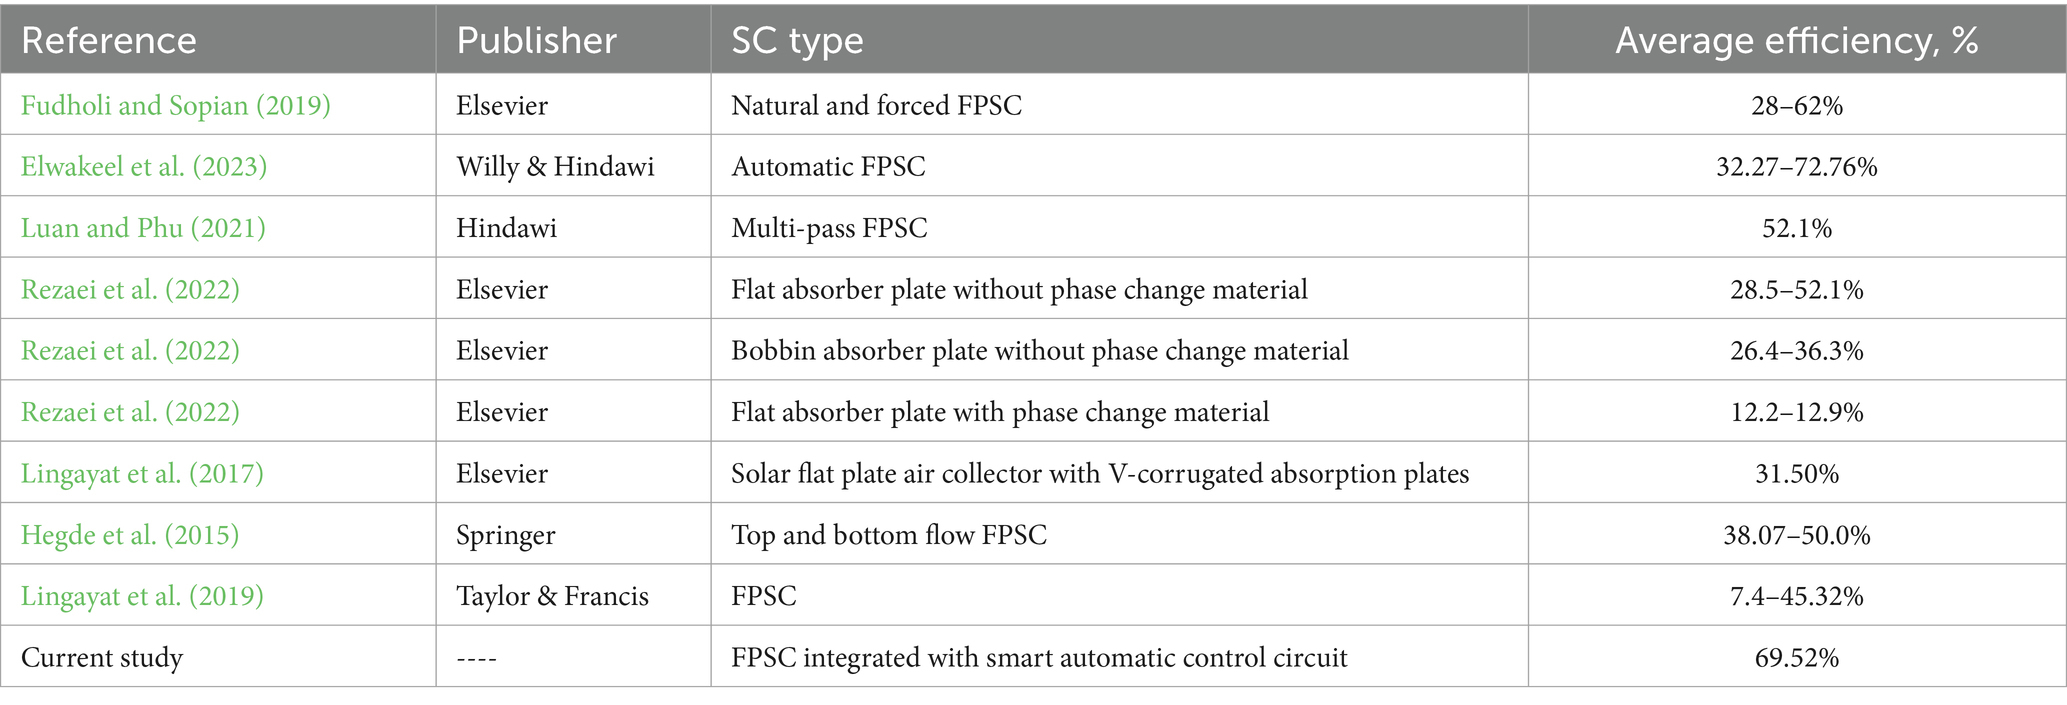
Table 5. Some studies are examining the efficiency of traditional FPSC.
3.10 Environmental analysis
Figure 16 displays the mass percentages of the materials. The majority of the weight, amounting to 59% (50 kg), is occupied by the metal frame for the drying room, SC, and PV. Following that, the glass cover and absorber plate of the SC account for 12% (10 kg) of the total weight. The remaining weight percentages are distributed among other components, including the insulation material, coating, hinges, handel, drying trays, and air circulation fan.
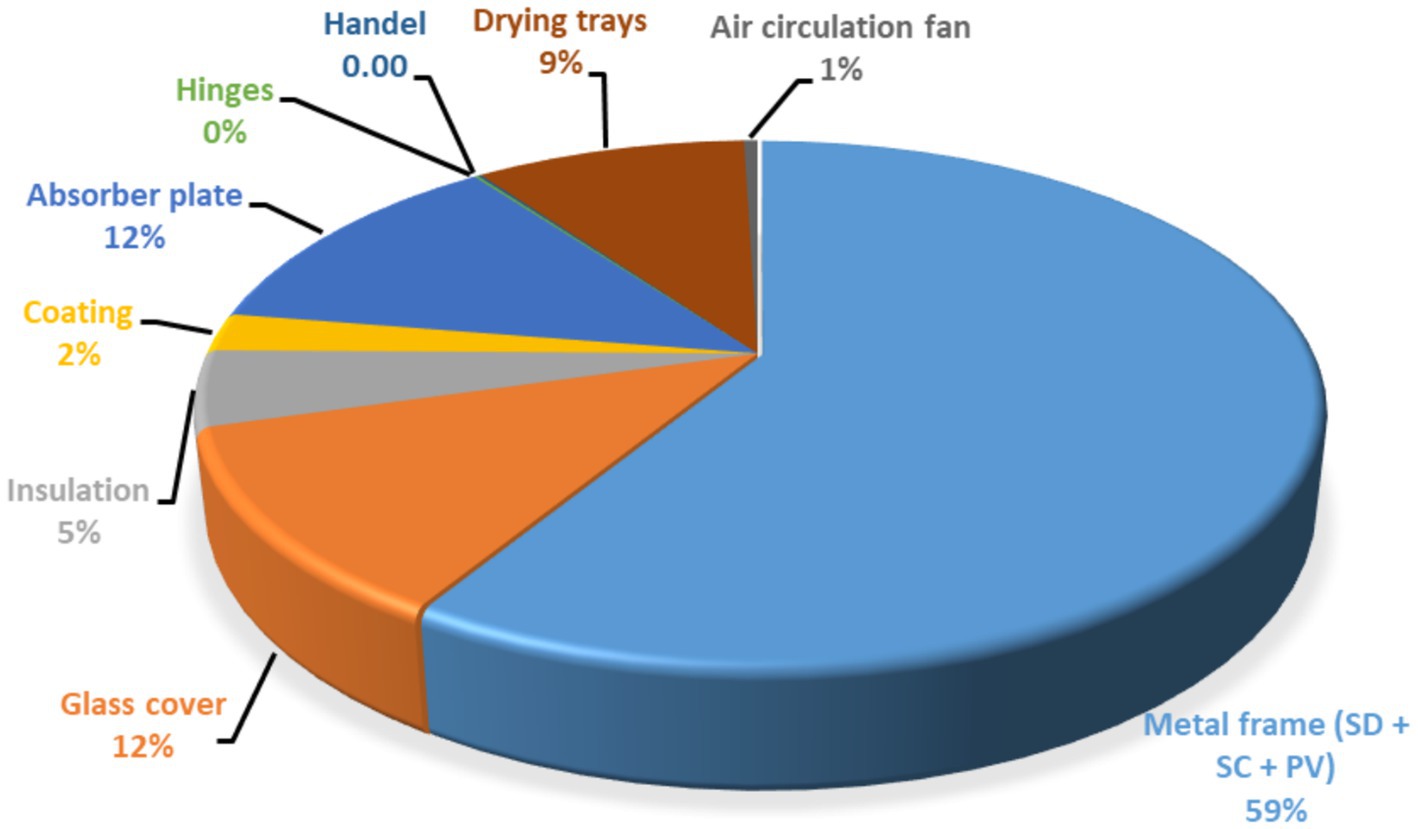
Figure 16. Break-up of mass of different materials used for manufacturing the developed SFCSD.
Figure 17 displays a comprehensive breakdown of the distribution of EE among various components utilized in the manufacturing of the developed SFCSD. The cumulative energy required for the established system is 1569.186 kW.h. The PV system (including PV panel, battery, and converter) represented the major value of the EE, amounting to 47% of total EE (734.89 kW.h). The metal frame and supporting structures are constructed using mild steel, which accounts for approximately 28% of the total EE. Approximately 6% of the total EE is attributed to the absorber plate, primarily due to their composition of metal material.
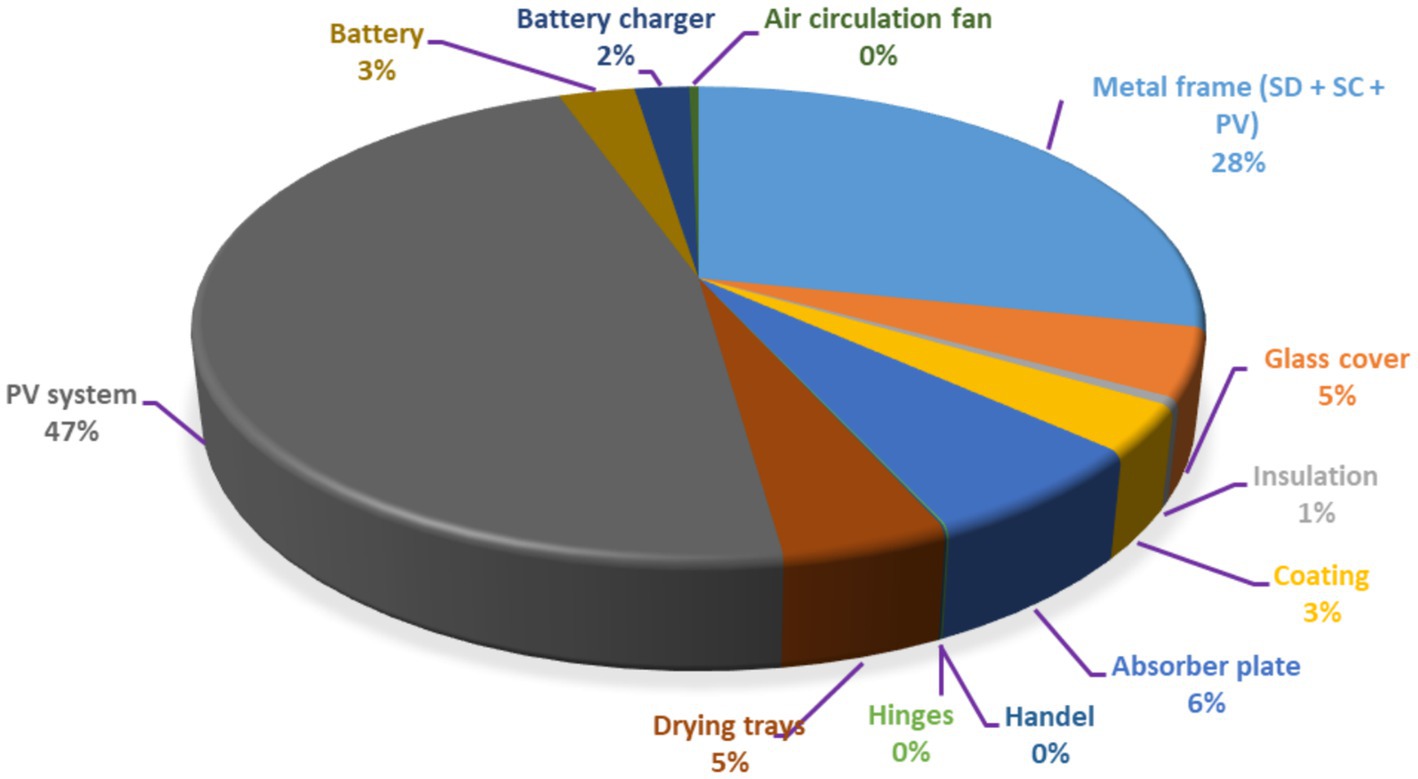
Figure 17. Break-up of EE of different materials used for manufacturing the developed SFCSD.
The developed SFCSD removes about 1 kg of moisture in 10 h per day, which is the time when the dryer was operating (from 07:00 to 17:00). Nevertheless, the operational duration may fluctuate based on the season. The average dryer’s evaporative capacity is estimated to be 1 kg per day. The value assigned to the latent heat of vaporization of water is 2,257 kJ/kg. The EPP for the developed SFCSD is determined to be 7.15 years. The current duration is significantly less in comparison to the lifespan of the established solar dryer (30 years). The annual CO2 emission quantity was calculated using Equation 22 for a duration of 5–30 years, and the findings are presented in Table 6.

Table 6. CO2 emission, CO2 mitigation, and ECC for developed SFCSD for different stages of the drying system’s lifetime.
Table 6 shows the environmental parameters for different stages of the drying system’s lifetime (5, 10, 15, 20, 25, and 30 years). This structured presentation allows readers to easily compare the environmental impact and benefits of the drying system over time. By highlighting CO2 mitigation and carbon credits at regular intervals, it emphasizes the long-term advantages of sustainable practices. These insights not only serve as a valuable resource for decision-makers but also promote awareness of the importance of adopting environmentally friendly technologies. As stakeholders review this information, they can better understand the potential for reducing their carbon footprint while simultaneously benefiting from economic incentives. The ECC of USD 72.50 per metric ton of CO2 (Charoentanaworakun et al., 2024).
4 Conclusion and future work
In today’s world, where sustainability and energy efficiency are paramount, the importance of the development of a sustainable forced convection solar dryer (SFCSD) cannot be overstated. These innovations have revolutionized the drying process by incorporating cutting-edge technology and smart controls, offering numerous advantages over traditional SDs. The EMC for all DF varieties was reached after a residence time in the SFCSD 9 days. The EMD ranged between 3.5569 × 10⁻⁷ m2/s and 3.9489 × 10⁻⁷ m2/s. The calibration of the different electronic circuits showed that the R2 values for the speed sensor, the Li sensor, the AT sensor, and the RH sensor were higher than 0.98. Furthermore, the thermal analysis of both the SC and PV systems showed that the maximum efficiency was 25.28 and 69.52%, respectively. Finally, the environmental impact data showed that the EPP for the developed SFCSD is only 0.24% of the system lifetime, and the CO2 mitigation value of 93.2 tons and earning carbon credits is 6757.02 USD throughout its estimated lifetime of 30 years. Further development of SD can include the use of machine learning and artificial intelligence to design and manufacture an intelligent automatic SD as well as remotely monitor the dryer’s performance and product quality.
Data availability statement
The original contributions presented in the study are included in the article/supplementary material, further inquiries can be directed to the corresponding author/s.
Author contributions
AEE: Conceptualization, Methodology, Project administration, Software, Supervision, Validation, Writing – original draft, Writing – review & editing. HE-M: Formal analysis, Investigation, Writing – review & editing. AE: Formal analysis, Investigation, Resources, Visualization, Writing – review & editing. AlS: Formal analysis, Funding acquisition, Investigation, Resources, Writing – review & editing. AyS: Formal analysis, Resources, Writing – review & editing. DS: Formal analysis, Funding acquisition, Investigation, Resources, Writing – review & editing. MM: Data curation, Investigation, Resources, Visualization, Writing – review & editing. HA-T: Data curation, Resources, Visualization, Writing – review & editing. WE: Data curation, Resources, Visualization, Writing – review & editing.
Funding
The author(s) declare that financial support was received for the research and/or publication of this article. The authors would like to acknowledge the Deanship of Graduate Studies and Scientific Research, Taif University for funding this work. Open access funding provided by University of Pécs.
Conflict of interest
The authors declare that the research was conducted in the absence of any commercial or financial relationships that could be construed as a potential conflict of interest.
Generative AI statement
The author(s) declare that no Generative AI was used in the creation of this manuscript.
Publisher’s note
All claims expressed in this article are solely those of the authors and do not necessarily represent those of their affiliated organizations, or those of the publisher, the editors and the reviewers. Any product that may be evaluated in this article, or claim that may be made by its manufacturer, is not guaranteed or endorsed by the publisher.
References
Admass, Z., Salau, A. O., Mhari, B., and Tefera, E. (2024). Red pepper drying with a double pass solar air heater integrated with aluminium cans. Sci. Rep. 14:2877. doi: 10.1038/s41598-024-53563-6
Aghbashlo, M., and Samimi-Akhijahani, H. (2008). Influence of drying conditions on the effective moisture diffusivity, energy of activation and energy consumption during the thin-layer drying of berberis fruit (Berberidaceae). Energy Convers. Manag. 49, 2865–2871. doi: 10.1016/j.enconman.2008.03.009
Akbar, F. N., Mahmood, S., Mueen-ud-din, G., Yamin, M., and Murtaza, M. A. (2024). Exploring the effects of drying method and temperature on the quality of dried basil (Ocimum basilicum L.) leaves: A sustainable and eco-friendly drying solution. Resources 13:121. doi: 10.3390/resources13090121
Akpinar, E. K., and Bicer, Y. (2006). Mathematical modeling and experimental study on thin layer drying of strawberry. Int. J. Food Eng. 2, 1–13. doi: 10.2202/1556-3758.1045
Al-Mssallem, M. Q., Al-Khayri, J. M., Alghamdi, B. A., Alotaibi, N. M., Alotaibi, M. O., Al-Qthanin, R. N., et al. (2024). “Role of date palm to food and nutritional security in Saudi Arabia, in food and nutrition security in the Kingdom of Saudi Arabia” in Macroeconomic policy and its implication on food and nutrition security, vol. 2 (Gewerbestrasse Cham, Switzerland: Springer), 337–358.
Almuhanna, E. A. (2012). Utilization of a solar greenhouse as a solar dryer for drying dates under the climatic conditions of the eastern province of Saudi Arabia. J. Agric. Sci. 4, 237–246. doi: 10.5539/jas.v4n3p237
Alu’datt, M. H., Rababah, T., Tranchant, C. C., Al-u’datt, D., Gammoh, S., Alrosan, M., et al. (2025). Date palm (Phoenix dactylifera) bioactive constituents and their applications as natural multifunctional ingredients in health-promoting foods and nutraceuticals: A comprehensive review. Compr. Rev. Food Sci. Food Saf. 24:e70084. doi: 10.1111/1541-4337.70084
Amira, E. A., Behija, S. E., Beligh, M., Lamia, L., Manel, I., Mohamed, H., et al. (2012). Effects of the ripening stage on phenolic profile, phytochemical composition and antioxidant activity of date palm fruit. J. Agric. Food Chem. 60, 10896–10902. doi: 10.1021/jf302602v
AOAC (2005). Official method of analysis. 18th Edn. Washington: Association of Officiating Analytical Chemists.
Aubin, C. A., Gorissen, B., Milana, E., Buskohl, P. R., Lazarus, N., Slipher, G. A., et al. (2022). Towards enduring autonomous robots via embodied energy. Nature 602, 393–402. doi: 10.1038/s41586-021-04138-2
Babar, O. A., Tarafdar, A., Malakar, S., Arora, V. K., and Nema, P. K. (2020). Design and performance evaluation of a passive flat plate collector solar dryer for agricultural products. J. Food Process Eng. 43, 1–13. doi: 10.1111/jfpe.13484
Badaoui, O., Hanini, S., Djebli, A., Haddad, B., and Benhamou, A. (2019). Experimental and modelling study of tomato pomace waste drying in a new solar greenhouse: evaluation of new drying models. Renew. Energy 133, 144–155. doi: 10.1016/j.renene.2018.10.020
Bala, B. K., and Janjai, S. (2005). Solar drying of fish (Bombay duck) using solar tunnel drier. Int. Energy J. New Haven, Connecticut and London, England. 6.
Banadka, A., Srinivas, K., Bhavsar, R., Sanjay, S., Shaikh, A., Murali, N., et al. (2025). “Genetic diversity of date palm (Phoenix dactylifera L.) and sustainable utilization” in Genetic diversity of fruits and nuts (Boca Raton, Florida: CRC Press), 187–226.
Belessiotis, V., and Delyannis, E. (2011). Solar drying. Sol. Energy 85, 1665–1691. doi: 10.1016/j.solener.2009.10.001
Ben-Amor, R., de Miguel-Gómez, M. D., Martínez-Sánchez, A., and Aguayo, E. (2016). Effect of hot air on Deglet Noor palm quality parameters and on Ectomyelois ceratoniae. J. Stored Prod. Res. 68, 1–8. doi: 10.1016/j.jspr.2016.03.001
Charoentanaworakun, C., Somprasong, K., Duongkaew, A., Wongchai, P., Katunyoo, P., and Thanaphanyakhun, P. (2024). Minimum carbon credit cost estimation for carbon geological storage in the Mae Moh Basin, Thailand. Energies (Basel) 17:2231. doi: 10.3390/en17092231
Cold, M., and Facilities, S. (2022). Design of a Smart IoT-based control system for remotely managing Cold storage Facilities.
Coşkun, S., Doymaz, İ., Tunçkal, C., and Erdoğan, S. (2017). Investigation of drying kinetics of tomato slices dried by using a closed loop heat pump dryer. Heat Mass Transf. 53, 1863–1871. doi: 10.1007/s00231-016-1946-7
Doymaz, İ. (2004). Effect of pre-treatments using potassium metabisulphide and alkaline ethyl oleate on the drying kinetics of apricots. Biosyst. Eng. 89, 281–287. doi: 10.1016/j.biosystemseng.2004.07.009
Doymaz, İ., and İsmail, O. (2011). Drying characteristics of sweet cherry. Food and bioproducts processing 89, 31–38. doi: 10.1016/j.fbp.2010.03.006
Eid, W. A. M., Azab, D. E.-S. H., and Negm, S. H. (2025). Characterization of a novel date energy bar fortified with Moringa oleifera leaves powder. J. Fut. Foods 5, 266–275. doi: 10.1016/j.jfutfo.2024.07.006
Eke, A. B., and Simonyan, K. J. (2014). Development of small scale direct mode passive solar dryers for effective drying of tomato. J. Appl. Agric. Res. 6, 111–119.
Elghazali, M. N., Tawfeuk, H. Z., Gomaa, R. A., Abbas, A. A., and Tantawy, A. A. (2020b). Effect of dehydration methods on physicochemical properties of Aswan dry dates. Assiut j. agri. sci. 51, 50–64. doi: 10.21608/ajas.2020.147566
Elghazali, M. N., Tawfeuk, H. Z., Gomaa, R. A., and Tantawy, A. A. (2020a). Technological studies on Aswan dry dates products after dehydration. Assiut J. Agric. Sci. 51, 32–49. doi: 10.21608/ajas.2020.147565
El-Mesery, H. S., Qenawy, M., Ali, M., Rostom, M., Elbeltagi, A., Salem, A., et al. (2025). Optimization of dried garlic physicochemical properties using a self-organizing map and the development of an artificial intelligence prediction model. Sci Rep 15:3105. doi: 10.1038/s41598-025-87167-5
Elmessery, W. M., Habib, A., Shams, M. Y., Abd El-Hafeez, T., El-Messery, T. M., Elsayed, S., et al. (2024). Deep regression analysis for enhanced thermal control in photovoltaic energy systems. Sci Rep 14:30600. doi: 10.1038/s41598-024-81101-x
Elshehawy, S. M., and Mosad, G. A. (2022). Mathematical modeling of tilapia fish fillets dried in thin layer. Journal of Soil Sciences and Agricultural Engineering 13, 359–364. doi: 10.21608/jssae.2022.166673.1108
Elwakeel, A. E., Ahmed, S. F., Zein, A. M., and Nasrat, L. (2021). Design of a novel electronic circuit for AC induction motor speed control. J. Agric. Eng. 1, 49–55. doi: 10.21608/azeng.2021.209949
Elwakeel, A. E., Tantawy, A. A., Alsebiey, M. M., and Elliby, A. K. (2022). The date fruit drying systems: acritical over review doi: 10.21608/azeng.2022.252898
Elwakeel, A. E., Eutyche, D., Wapet, M., Mahmoud, W. A. E., Abdallah, S. E., Mahmoud, M. M., et al. (2023). Design and implementation of a PV-integrated solar dryer based on internet of things and date fruit quality monitoring and control. Int. J. Energy Res. 2023, 1–17. doi: 10.1155/2023/7425045
Elwakeel, A. E., Gameh, M. A., Eissa, A. S., and Mostafa, M. B. (2024a). Recent advances in solar drying Technology for Tomato Fruits: a comprehensive review. Int. J. Appl. Energy Syst. 6, 37–44. doi: 10.21608/ijaes.2023.240781.1021
Elwakeel, A. E., Gameh, M. A., Oraiath, A. A. T., Elzein, I. M., Eissa, A. S., Mahmoud, M. M., et al. (2024b). Drying kinetics and thermo-environmental analysis of a PV-operated tracking indirect solar dryer for tomato slices. PLoS One 19:e0306281. doi: 10.1371/journal.pone.0306281
Ertekin, Ö., and İpek, Y. (2020). Modeling of drying processes of dates (Phoenix, arecaceae) with oven or TGA and microbiological properties of fresh and dried dates. Int. J. Fruit Sci. 20, S1530–S1538. doi: 10.1080/15538362.2020.1815117
ES, M., Hassan, M. A., Abdallah, Y. S., and Metwally, K. A. (2023). Effect of Using a New Automatic Heating System Powered by Renewable Energy on Poultry Houses. Zagazig Journal of Agricultural Research 50, 81–92. doi: 10.21608/zjar.2023.290106
Etim, P. J., Eke, A. B., and Simonyan, K. J. (2019). Effect of air inlet duct features and grater thickness on cooking banana drying characteristics using active indirect mode solar dryer. Nigerian Journal of Technology 38, 1056–1063. doi: 10.4314/njt.v38i4.31
Etim, P. J., Eke, A. B., and Simonyan, K. J. (2020). Design and development of an active indirect solar dryer for cooking banana. Sci Afr. :e00463:8. doi: 10.1016/j.sciaf.2020.e00463
Falade, K. O., and Abbo, E. S. (2007). Air-drying and rehydration characteristics of date palm (Phoenix dactylifera L.) fruits. J. Food Eng. 79, 724–730. doi: 10.1016/j.jfoodeng.2006.01.081
Farag, S. E.-S., Hassan, S. R., Younes, O. S., and Taha, S. A. (2016). Methods of drying of tomato slices and the effect of the using of its powder on the production and characteristics of extruded snacks. Misr J. Agric. Engin. 33, 1537–1558. doi: 10.21608/mjae.2016.97620
Fudholi, A., and Sopian, K. (2019). A review of solar air flat plate collector for drying application. Renew. Sust. Energ. Rev. 102, 333–345. doi: 10.1016/j.rser.2018.12.032
Fudholi, A., Sopian, K., Yazdi, M. H., Ruslan, M. H., Gabbasa, M., and Kazem, H. A. (2014). Performance analysis of solar drying system for red chili. Sol. Energy 99, 47–54. doi: 10.1016/j.solener.2013.10.019
Getahun, E., Delele, M. A., Gabbiye, N., Workneh, S., and Vanierschot, M. (2024). Influence of a double-stage solar tunnel dryer on the preservation of quality characteristics and the modelling of colour variations in red chili peppers. Heliyon 10:e36857. doi: 10.1016/j.heliyon.2024.e36857
Grazieschi, G., Asdrubali, F., and Thomas, G. (2021). Embodied energy and carbon of building insulating materials: A critical review. Cleaner Environmental Systems 2:100032. doi: 10.1016/j.cesys.2021.10003
Haschke, J., Dupré, O., Boccard, M., and Ballif, C. (2018). Silicon heterojunction solar cells: recent technological development and practical aspects-from lab to industry. Sol. Energy Mater. Sol. Cells 187, 140–153. doi: 10.1016/j.solmat.2018.07.018
Hegde, V. N., Hosur, V. S., Rathod, S. K., Harsoor, P. A., and Narayana, K. B. (2015). Design, fabrication and performance evaluation of solar dryer for banana. Energy Sustain. Soc. 5, 1–12. doi: 10.1186/s13705-015-0052-x
Hii, C. L., Jangam, S. V., Ong, S. P., and Mujumdar, A. S. (2012). Solar drying: Fundamentals, applications and innovations. Singapore: TPR Group Publication.
Ho, W.-J., Liu, J.-J., Yang, Y.-C., and Ho, C.-H. (2018). Enhancing output power of textured silicon solar cells by embedding indium plasmonic nanoparticles in layers within antireflective coating. Nano 8:1003. doi: 10.3390/nano8121003
Jaiganesh, K., and Duraiswamy, K. (2013). Experimental study of enhancing the performance of pv panel integrated with solar thermal system. Int. J. Engin. Technol. 5, 3419–3426.
Jain, D., and Tewari, P. (2015). Performance of indirect through pass natural convective solar crop dryer with phase change thermal energy storage. Renew. Energy 80, 244–250. doi: 10.1016/j.renene.2015.02.012
Jia, Y., Khalifa, I., Hu, L., Zhu, W., Li, J., Li, K., et al. (2019). Influence of three different drying techniques on persimmon chips’ characteristics: A comparison study among hot-air, combined hot-air-microwave, and vacuum-freeze drying techniques. Food Bioprod. Process. 118, 67–76. doi: 10.1016/j.fbp.2019.08.018
Kaya, A., Aydin, O., Demirtas, C., and Akgün, M. (2007). An experimental study on the drying kinetics of quince. Desalination 212, 328–343. doi: 10.1016/j.desal.2006.10.017
Kayacan, S., Karasu, S., Akman, P. K., Goktas, H., Doymaz, I., and Sagdic, O. (2020). Effect of different drying methods on total bioactive compounds, phenolic profile, in vitro bioaccessibility of phenolic and HMF formation of persimmon. LWT 118:108830. doi: 10.1016/j.lwt.2019.108830
Khater, E.-S. G., Bahnasawy, A. H., Oraiath, A. A. T., Alhag, S. K., Al-Shuraym, L. A., Moustapha, M. E., et al. (2024). Assessment of a LPG hybrid solar dryer assisted with smart air circulation system for drying basil leaves. Sci Rep 14:23922. doi: 10.1038/s41598-024-74751-4
Kontaxakis, E., Fysarakis, I., Mavromatakis, F., and Lydakis, D. (2024). Enhanced grape drying using indirect solar dryers: improved quality and safety of raisins. J. Food Prot. 87:100342. doi: 10.1016/j.jfp.2024.100342
Kumar, M., Sansaniwal, S. K., and Khatak, P. (2016). Progress in solar dryers for drying various commodities. Sustain. Energy Rev. 55, 346–360. doi: 10.1016/j.rser.2015.10.158
Kumar, P., and Tripathy, P. P. (2024). Experimental and computational analysis of drying characteristics and quality attributes of indirect and mixed-mode solar dried Stevia rebaudiana leaves. J. Food Process Eng. 47:e14760. doi: 10.1111/jfpe.14760
Lee, G., and Hsieh, F. (2008). Thin-layer drying kinetics of strawberry fruit leather. Trans. ASABE 51, 1699–1705. doi: 10.13031/2013.25292
Li, D., Xie, H., Liu, Z., Li, A. O., Li, J., Liu, B., et al. (2019). Shelf life prediction and changes in lipid profiles of dried shrimp (Penaeus vannamei) during accelerated storage. Food Chem. 297:124951. doi: 10.1016/j.foodchem.2019.124951
Lingayat, A., Chandramohan, V., and Raju, V. (2017). Design, development and performance of indirect type solar dryer for banana drying. Energy Procedia 109, 409–416. doi: 10.1016/j.egypro.2017.03.041
Lingayat, A., Chandramohan, V. P., and Raju, V. R. K. (2019). Energy and exergy analysis on drying of banana using indirect type natural convection solar dryer. Heat Transfer Engineering. 41, 551–561. doi: 10.1080/01457632.2018.1546804
Luan, N. T., and Phu, N. M. (2021). First and second law evaluation of multipass flat-plate solar air collector and optimization using preference selection index method. Math. Probl. Eng. 2021, 1–16. doi: 10.1155/2021/5563882
Mahajan, K. M., Patil, V. H., and Koli, T. A. (2024). Design analysis of an innovative solar biomass hybrid dryer for drying turmeric. Interactions 245:145. doi: 10.1007/s10751-024-01965-3
Mahmoud, M. M., Atia, B. S., Ratib, M. K., and Aly, M. M. (2022). Investigations on OTC-MPPT strategy and FRT capability for PMSG wind system with the support of optimized wind side controller based on GWO technique Energy Systems Research, 4.
Mayor, L., and Sereno, A. M. (2004). Modelling shrinkage during convective drying of food materials: a review. J Food Eng. 61, 373–386. doi: 10.1016/S0260-8774(03)00144-4
Mennouche, D., Boubekri, A., Chouicha, S., Bouchekima, B., and Bouguettaia, H. (2017). Solar drying process to obtain high standard “deglet-nour” date fruit. J. Food Process Eng. 40:e12546. doi: 10.1111/jfpe.12546
Metwally, K. A., Oraiath, A. A. T., Elzein, I. M., El-Messery, T. M., Nyambe, C., Mahmoud, M. M., et al. (2024). The Mathematical Modeling, Diffusivity, Energy, and Enviro-Economic Analysis (MD3E) of an Automatic Solar Dryer for Drying Date Fruits. Sustainability 16:3506. doi: 10.3390/su16083506
Mukherjee, S., and Chattopadhyay, P. K. (2007). Whirling bed blanching of potato cubes and its effects on product quality. J Food Eng. 78, 52–60. doi: 10.1016/j.jfoodeng.2005.09.001
Müller, M., Fischer, G., Bitnar, B., Steckemetz, S., Schiepe, R., Mühlbauer, M., et al. (2017). Loss analysis of 22% efficient industrial PERC solar cells. Energy Procedia 124, 131–137. doi: 10.1016/j.egypro.2017.09.322
Navale, S. R., Harpale, V. M., and Mohite, K. C. (2015). Comparative study of open sun and cabinet solar drying for fenugreek leaves. Int. J. Renewable Energy Technol. Res. 4, 1–9.
Nayak, S., Naaz, Z., Yadav, P., and Chaudhary, R. (2012). Economic analysis of hybrid photovoltaic-thermal (PVT) integrated solar dryer. Int. J. Engin. Invent. 1, 21–27.
Pahlavanzadeh, H., Basiri, A., and Zarrabi, M. (2001). Determination of parameters and pretreatment solution for grape drying. Dry. Technol. 19, 217–226. doi: 10.1081/DRT-100001363
Prakash, O., and Kumar, A. (2014a). Environomical analysis and mathematical modelling for tomato flakes drying in a modified greenhouse dryer under active mode. Int. J. Food Eng. 10, 669–681. doi: 10.1515/ijfe-2013-0063
Qi, B., and Wang, J. (2013). Fill factor in organic solar cells. Phys. Chem. Chem. Phys. 15, 8972–8982. doi: 10.1039/c3cp51383a
Rabha, D. K., Muthukumar, P., and Somayaji, C. (2017). Experimental investigation of thin layer drying kinetics of ghost chilli pepper (Capsicum Chinense Jacq.) dried in a forced convection solar tunnel dryer. Renew Energy 105, 583–589. doi: 10.1016/j.renene.2016.12.091
Rezaei, M., Sefid, M., Almutairi, K., Mostafaeipour, A., Ao, H. X., Dehshiri, S. J. H., et al. (2022). Investigating performance of a new design of forced convection solar dryer. Sustain Energy Technol Assess 50:101863:101863. doi: 10.1016/j.seta.2021.101863
Rizal, T., and Muhammad, Z. (2018). Fabrication and testing of hybrid solar-biomass dryer for drying fish. Case Stud. Therm. Eng. 12, 489–496. doi: 10.1016/j.csite.2018.06.008
Ruiz-Cabrera, M. A., Flores-Gómez, G., González-García, R., Grajales-Lagunes, A., Moscosa-Santillan, M., and Abud-Archila, M. (2008). Water diffusivity and quality attributes of fresh and partially osmodehydrated cactus pear (Opuntia ficus indica) subjected to air-dehydration. Int. J. Food Prop. 11, 887–900. doi: 10.1080/10942910701671349
Samimi-Akhijahani, H., and Arabhosseini, A. (2018). Accelerating drying process of tomato slices in a PV-assisted solar dryer using a sun tracking system. Renew. Energy 123, 428–438. doi: 10.1016/j.renene.2018.02.056
Seerangurayar, T., Al-Ismaili, A. M., Janitha Jeewantha, L. H., and Al-Habsi, N. A. (2019). Effect of solar drying methods on color kinetics and texture of dates. Food Bioprod. Process. 116, 227–239. doi: 10.1016/j.fbp.2019.03.012
Seerangurayar, T., Al-Ismaili, A. M., Jeewantha, L. H. J., and Al-Nabhani, A. (2019). Experimental investigation of shrinkage and microstructural properties of date fruits at three solar drying methods. Sol. Energy 180, 445–455. doi: 10.1016/j.solener.2019.01.047
Seerangurayar, T., Al-Ismaili, A. M., Jeewantha, L. H. J., Jeevarathinam, G., Pandiselvam, R., Kumar, S. D., et al. (2024). Experimental investigation and modeling of date drying under forced convection solar dryers. Biomass Convers. Biorefinery 14, 21705–21718. doi: 10.1007/s13399-023-04450-z
Shen, L., Li, Z., and Ma, T. (2020). Analysis of the power loss and quantification of the energy distribution in PV module. Appl. Energy 260:114333. doi: 10.1016/j.apenergy.2019.114333
Suherman, S., Hadiyanto, H., Asy-Syaqiq, M. A., Brastayudha, A. A., and Fahrudin, M. W. (2024). Drying banana slices using photovoltaic ventilation solar dryer. Food Res. 8, 90–102. doi: 10.26656/fr.2017.8(S1).13
Téllez, M. C., Figueroa, I. P., Téllez, B. C., Vidaña, E. C. L., and Ortiz, A. L. (2018). Solar drying of Stevia (Rebaudiana Bertoni) leaves using direct and indirect technologies. Sol. Energy 159, 898–907. doi: 10.1016/j.solener.2017.11.031
Tesfaye, A., and Habtu, N. G. (2022). Fabrication and performance evaluation of solar tunnel dryer for ginger drying. Int. J. Photoenergy 2022, 1–13. doi: 10.1155/2022/6435080
Tham, T. C., Ng, M. X., Gan, S. H., Chua, L. S., Aziz, R., Chuah, L. A., et al. (2017). Effect of ambient conditions on drying of herbs in solar greenhouse dryer with integrated heat pump. Dry. Technol. 35, 1721–1732. doi: 10.1080/07373937.2016.1271984
Tibebu, T. B. (2015). Design, construction and evaluation of performance of solar dryer for drying fruit PhD thesis, 2015. Ghana: College of Engineering, Kwame Nkrumah University of Science and Technology.
Touil, A., Chemkhi, S., and Zagrouba, F. (2014). Moisture diffusivity and shrinkage of fruit and cladode of Opuntia ficus-indica during infrared drying. Journal of food processing. doi: 10.1155/2014/175402
Tunde-Akintunde, T. Y. (2011). Mathematical modeling of sun and solar drying of chilli pepper. Renew. Energy 36, 2139–2145. doi: 10.1016/j.renene.2011.01.017
Usub, T., Lertsatitthanakorn, C., Poomsa-ad, N., Wiset, L., Yang, L., and Siriamornpun, S. (2008). Experimental performance of a solar tunnel dryer for drying silkworm pupae. Biosyst. Eng. 101, 209–216. doi: 10.1016/j.biosystemseng.2008.06.011
Vijayan, S., Arjunan, T. V., and Kumar, A. (2020). Exergo-environmental analysis of an indirect forced convection solar dryer for drying bitter gourd slices. Renew. Energy 146, 2210–2223. doi: 10.1016/j.renene.2019.08.066
VijayaVenkataRaman, S., Iniyan, S., and Goic, R. (2012). A review of solar drying technologies. Renew. Sust. Energ. Rev. 16, 2652–2670. doi: 10.1016/j.rser.2012.01.007
Vyas, S., Singh, P., Agrawal, H., Vishwakarma, G., and Yadav, A. (2024). Experimental comparison of solar drying based on evacuated tube collector with desiccant drying for dehydrating potato and ginger. Heat Transfer 53, 2128–2147. doi: 10.1002/htj.23030
Wang, W., Li, M., Hassanien, R. H. E., Wang, Y., and Yang, L. (2018). Thermal performance of indirect forced convection solar dryer and kinetics analysis of mango. Appl. Therm. Eng. 134, 310–321. doi: 10.1016/j.applthermaleng.2018.01.115
Wikoff, H. M., Reese, S. B., and Reese, M. O. (2022). Embodied energy and carbon from the manufacture of cadmium telluride and silicon photovoltaics. Joule 6, 1710–1725. doi: 10.1016/j.joule.2022.06.00
Yamamoto, K., Yoshikawa, K., Uzu, H., and Adachi, D. (2018). High-efficiency heterojunction crystalline Si solar cells. Jpn. J. Appl. Phys. 57:08RB20. doi: 10.7567/JJAP.57.08RB20
Yassen, T. A., and Al-Kayiem, H. H. (2016). Experimental investigation and evaluation of hybrid solar/thermal dryer combined with supplementary recovery dryer. Sol. Energy 134, 284–293. doi: 10.1016/j.solener.2016.05.011
Zhao, Y., Li, Y., and Yin, J. (2025). Improvement of quality and shelf-life in strawberries by Pichia guilliermondii and hot air treatment. N. Z. J. Crop. Hortic. Sci. 53, 163–179. doi: 10.1080/01140671.2023.2173255
Glossary
EPP – Energy payback period
SFCSD – sustainable forced convection solar dryer
PV – Photovoltaic
GSM – Global system for mobile communication
DF – Date fruit
OSD – Open sun drying
DR – Drying room
SD – Solar dryer
DSD – Direct solar dryer
ISD – Indirect solar dryer
HSD – Hybrid solar dryer
TGA – Thermogravimetric analysis
FPSC – Flat plate solar collector
ASD – Automatic solar dryer
AT – Air temperature
MC – Moisture content
RH – Relative humidity
SC – Solar collector
AC – Alternating current
Li – Light intensity
SMS – Short Message Service
SOS – Save our souls
EPP – Energy payback period
EE – Embodied energy
n – Number of terms
– Determination of coefficient
L – Lifetime of the SFCSD, years
R2 – R-squared correlation
𝜇w – Moisture content on wet basis, %
𝑊w – Wet weight, gm
𝑊d – Dry weight, gm
𝑉oc – Open circuit voltage, V
Isc – Short circuit current, A
𝑃max – Maximum power, W
𝐹𝐹 – Fill factor
𝐼𝑛𝑠PV – Intensity of the solar radiation, W/m2
M – Final MC, gm
𝑀0 – Initial MC, gm
𝑛 – Total number of data points
𝐴PV – Surface area of the PV system, m2
𝐸input.coll – Input power to the SC, W
𝐸input.coll – Output power to the SC, W
𝜂PV – Efficiency of the PV system, %
𝑚a – Air mass flowrate, Kg/s
𝐶p,a – Specific heat of air, kJ/kg.k
𝑇a,in − 𝑇a,out – Air temperature difference between ambient air and output air form the SC, k
𝑌 – Measured or observed value measured by the sensors
ρa – Air density, kg/m3
Va – Volumetric air flowrate, m3/s
ua – Air speed, m/s
Acoll – Total surface area of the SC, m2
𝜂coll – Efficiency of the SC, %
𝑈F – Uncertainty, %
𝐷eff – Diffusion coefficient, m2/s
𝑀𝑅 – Moisture ratio, %
– Solar intensity, watt/m2
M – Final moisture content, %
– Initial moisture content, %
Keywords: earned carbon credit, effective moisture diffusivity, sustainable agriculture, energy payback period, PV system, carbon footprint, solar drying, internet of things
Citation: Elwakeel AE, El-Mesery HS, Elbeltagi A, Salem A, Sabry A, Saleh DI, Moustapha ME, Abu-Taha HL and Elkot WF (2025) Development, drying characteristics, and environmental analysis of a PV operated automatic solar dryer for drying date. Front. Sustain. Food Syst. 9:1531601. doi: 10.3389/fsufs.2025.1531601
Edited by:
Giovanna Ferrari, University of Salerno, ItalyReviewed by:
Tarik Hadibi, Yunnan Normal University, ChinaPushpendra Singh, Indian Institute of Technology Guwahati, India
Copyright © 2025 Elwakeel, El-Mesery, Elbeltagi, Salem, Sabry, Saleh, Moustapha, Abu-Taha and Elkot. This is an open-access article distributed under the terms of the Creative Commons Attribution License (CC BY). The use, distribution or reproduction in other forums is permitted, provided the original author(s) and the copyright owner(s) are credited and that the original publication in this journal is cited, in accordance with accepted academic practice. No use, distribution or reproduction is permitted which does not comply with these terms.
*Correspondence: Ali Salem, c2FsZW0uYWxpQG1pay5wdGUuaHU=; Abdallah Elshawadfy Elwakeel, QWJkYWxsYWhfZWxzaGF3YWRmeUBhZ3IuYXN3dS5lZHUuZWc=