 Chai Qiangfei
 Yang Meirong2*
- 1School of Management, Nanjing University of Posts and Telecommunications, Nanjing, China
- 2Marketing Service Center, State Grid Jiangsu Electric Power Co., Ltd., Nanjing, China
The development of distributed photovoltaic (PV) on rural rooftops plays an important role in realizing China’s carbon peaking and carbon neutrality goals. Based on a total of 321 rural residents’ electricity consumption panel data containing 28 periods from January 2020 to April 2022, this paper uses a difference-in-difference model to quantitatively analyze the carbon emission reduction effect and changes in rural residents’ electricity consumption behavior before and after the installation of distributed PV. The results show that: the installation of rural residential distributed PV reduces the electricity purchased from the grid by 32.06kWh per month. It brings carbon emission reduction by about 20.97
1 Introduction
Environmental issues have raised significant concerns worldwide, and excessive carbon emissions are a key factor contributing to these environmental issues (Li et al., 2020; Bai and Rub, 2024). According to China’s carbon emission structure, 26% of energy consumption is directly used for residential living, which contributes more than 30% of the total carbon emissions. Therefore, controlling carbon emissions from residential life is an important pathway to achieve carbon peak and carbon neutrality. Residential rooftop distributed photovoltaics (RDPVs) utilize the roof space of residential homes to install photovoltaic (PV) panels for solar power generation. As a clean energy source, solar energy can reduce residential carbon emissions and contribute to the promotion of energy transition. In the field of power grids, the development of distributed PV is also an important way to achieve peak shaving and zero-carbon electricity.
Rural areas have abundant rooftop resources, which provide convenient conditions for the development of distributed PV. From 2021 to 2022, the application of RDPVs in rural areas expanded rapidly, with the annual installation of household PVs exceeding 20 million kilowatts for two consecutive years, surpassing the development scale of commercial and industrial distributed PVs. RDPVs not only provide electricity for rural production and living, but also facilitate the construction of a new rural energy systems based on rooftop PV, aiming to achieve comprehensive electrification and low-carbon development in rural areas. Additionally, rural RDPVs can provide a stable source of income for rural residents, as they can save on electricity bills and earn money by selling electricity. Therefore, the development of rural RDPVs can bring both economic and environmental benefits.
Assessing the economic and environmental benefits of rural RDPVs is crucial for the formulation of government policies, and it significantly influences the electricity consumption behavior of rural residents. Existing literature has analyzed the economic benefits of RDPVs. For example, Zhang L. et al. (2023) analyzed economic profits of RDPVs in country and found that the self-consumption ratio of power generation and use area of roofs are important factors influencing the benefits. Zhang C. et al. (2023) built an economic efficiency model and showed that the whole-county RDPVs project is economically viable. Furthermore, they found that engaging in the green power trading market significantly shortens the dynamic payback period. Zhu et al. (2024) developed an empirical model that took socio-economic factors into account and their results showed that RDPVs are more popular in low-income rural residents. Zhang et al. (2020) found that RDPVs installation could increase per-capita disposable income by 7–8% of rural residents in China. The above studies examine the factors influencing the economic benefits of RDPVs and validate the economic benefits of RDPVs.
However, the research on assessing the environmental benefits brought by the installation of rural RDPVs in China is little. In the limited existing research, He et al. (2024) found that developing PVs based on suitability can yield emission reduction of approximately one-third of Anhui Province’s carbon emissions in 2021. Although their study provides a quantitative analysis of the environmental benefits of PVs, the carbon reduction benefits are assessed through the estimation of potential PV power generation, which significantly overestimates the actual carbon reduction effects, as not all PV electricity generated would be used. Zhang Z. et al. (2023) utilized multi-source geospatial data and machine learning regression to estimate carbon mitigation potential of RDPVs at the city level. They estimated that the total carbon emission reduction potential from RDPVs in 354 cities reaches 4 billion tons in 2020 under ideal assumptions. However, as with previous studies, their assessment of the environmental benefits of RDPVs is based on idea estimation and theoretical calculation, not practical PV power generation data. Different from those studies, our study quantitatively assesses the carbon emission reduction of RDPVs by using the practical and updated PV electricity generation and consumption data of residents, providing a more realistic and reliable assessment of the environmental benefits of RDPVs in China.
Overall, there is a lack of research and empirical evidence on how much residential carbon emission reduction can be brought about by the installation of RDPVs in rural areas of China, and how it affects the electricity consumption behavior of rural residents. In addition, questions such as whether the installation of rural RDPVs would lead to a rebound in rural residents’ electricity consumption and whether it would inhibit the carbon emission reduction effectiveness need to be addressed. Therefore, in this paper, we aim to analyze the effect of rural RDPVs installation on rural residents’ carbon emission reduction and electricity consumption behavior through the difference-in-differences (DID) method based on recent real-world data. We use household level monthly electricity meter data and monthly PV power generation data from 95 RDPVs homes and 226 non-RDPVs homes from January 2020 to April 2022 which includes 8,988 samples in Nanjing of Jiangsu Province to provide empirical evidence. Employing a DID method, we assess the changes in solar and grid electricity usage behavior of residents before and after the installation of RDPV. After obtaining the basic regression results, we perform a parallel trend test and a placebo test to examine the causality and robustness of our results. Our models pass all the tests, suggesting that our results could be causal and reliable. Finally, we take a step further to analyze household self-consumption of PV users and the PV installation capacity heterogeneity, through which we can obtain more insights about rural residents’ power consumption behavior. Our study intends to provide critical insights for the formulation of RDPVs policies and electricity pricing policies to support carbon emission reduction and energy transition.
This paper contributes to the field in four main aspects. First, our study adds insights to the research on the PV rebound effect and rural residents’ power consumption behavior in developing countries context, which is significantly different from developed countries. Second, using a distinctive, real-world, and updated panel dataset, we quantitatively investigate the impacts of installing RDPVs on carbon emission reduction and rural residents’ electricity consumption behavior, which can provide a more realistic and reliable assessment of the environmental benefits of RDPVs in China. Third, we reveal that the rebound effect of installing RDPVs does also exist in China, which inhibits the carbon emission reduction to some extent. Fourth, through a heterogeneity analysis on the RDPVs installation capacity, we find that the rebound effect of installing high-capacity PV users is significantly higher than that of low-capacity PV users, and that installing medium-capacity PV equipment is the optimal choice for both carbon emission reduction effectiveness and investment returns.
The remainder of this paper is organized as follows. Section 2 reviews related literature. Section 3 introduces the policy background about PV electricity in China and the dataset. Section 4 shows the empirical model and the carbon emission model. Section 5 presents the empirical results, examines the robustness of the model, and analyzes household self-consumption of PV users and the PV installation capacity heterogeneity. Section 6 summarizes the main conclusions of this paper.
2 Literature review
The rebound effect in energy consumption refers to the phenomenon where improvements in energy efficiency do not lead to the expected reduction in energy use due to various behavioral and economic responses. It is first proposed by Jevons in 1865, who observed that technological improvements leading to more efficient use of coal also resulted in increased coal consumption (Alcott et al., 2012). Researchers mainly focus on exploring its theoretical underpinnings (Lange et al., 2021; Reimers et al., 2021), empirical evidence (Belaïd et al., 2018; Brockway et al., 2021; Berner et al., 2022; Miao and Zhen, 2023), influencing factors (Yang et al., 2023; Yin et al., 2024), and mitigation strategies (Meng and Li, 2022). Since this paper is mostly related to empirical evidence of rebound effect, we mainly review this stream of research. For the research on empirical evidence, Belaïd et al. (2018) used the standard OLS to estimate the rebound effect for residential gas consumption in France and found that the rebound effect in gas demand is around 60% in the long-run. Miao and Zhen (2023) confirmed the existence of an energy rebound effect through dynamic econometric modeling, and found that energy efficiency improvements in Chinese urban dwellings leads to an increase in carbon dioxide emissions. Berner et al. (2022) utilized a structural FAVAR model to estimate the energy rebound effects resulting from enhanced energy efficiency and discovered that the economy-wide rebound effects range from 78 to 101%.
For the research on the effect of PV installation on residential electricity demand, there still exists debate. Some studies found that the use of PV power generation does not necessarily bring about a decline in electricity consumption, but may lead to a rebound in electricity consumption due to the decrease in unit electricity prices. For example, Qiu et al. (2019) showed that when solar power generation increases by 1 kWh, the total electricity consumption increases by 0.18 kWh, with the solar rebound effect estimated at 18%. Deng and Newton (2017) grouped users with different feed-in tariffs (FIT) and found that the average rebound effect of the group with a FIT of 20 cents/kWh is approximately 16.7% during the study period. Toroghi and Oliver (2019) evaluated the rebound effect for two installation scenarios in the U.S., and found that the average rebound effect for PV customers with 20% roof coverage and 40% roof coverage are 5.8 and 2.9%, respectively. La Nauze (2019) examined the scenario of self-consumption and selling surplus electricity to the grid. They found that solar energy consumers indeed increase their electricity expenditures. For every one-dollar electricity income, the electricity expenditure would increase by 23 cents. Beppler et al. (2023) found that PV installation reduces the average monthly grid electricity consumption of households by about 400 kWh, but increases the total electricity consumption by 157 kWh. The point estimate revealed a rebound effect of 28.5%. However, some studies have found that the environmental awareness of PV users can suppress their electricity consumption behavior, leading to a decrease in electricity consumption, which is known as the negative rebound effect. For example, Li et al. (2020) found that the marginal rebound effect for college-educated producers is statistically significant and negative. The above studies did well and provided empirical evidence for the effect of PV installation on residential electricity demand in most developed countries. But there is a lack of research focusing on Chinese environments and policies, which are apparently different from the developed countries. It still remains unclear that whether RDPV in rural China will bring about a rebound in rural energy consumption demand and our study aim to fill this research gap.
For the research on the interaction between PV installations and the electricity consumption behavior of Chinese residents, Zhang et al. (2022) investigated the factors influencing residents’ intention to use household PV systems. Qiu et al. (2021) established a model based on discounted cash flow, using internal rate of return and payback period as economic indicators, and found that even without incentives, residential PV investments across China achieve break-even. Meng and Li (2022) evaluated the rebound effect of electricity consumption at the provincial level in China and revealed that the rebound effect is not related to the efficiency of electricity consumption, but is significantly affected by the intervention tariffs of local governments and the level of socio-economic development. Du et al. (2021) investigated the extent and determinants of energy demand and the energy rebound effects among urban residents in China. The results indicated that residents’ income levels, energy prices, and temperature deviations are important factors influencing residential energy consumption. Overall, the above studies on PV in China have mainly focused on impact factors analysis and investment returns, but the research on the impact of PV installations on the carbon emission reduction and electricity consumption behavior of rural residents is seriously lacking.
3 Policy, data and variables
3.1 Policy background
In June 2021, the National Development and Reform Commission (NDRC) of China issued “Notice on Matters Related to the Renewable Electricity Feed-in Tariff (FIT) Policy in 2021.” The notice indicates that the FIT for new projects in 2021 will be based on the local benchmark price for coal-fired power generation. This means that distributed PV officially entered the phase of grid parity after June 2021. Therefore, in order to exclude the impact of subsidy policy on electricity consumption behavior, we select PV users who installed PV systems after June 2021.
In this study, all PV users adopt a self-consumption model. That is, during the period of PV power generation, users prioritize using the electricity generated by the PV system. If the generated electricity is less than the power consumption, the shortfall needs to be purchased from the power grid. If the generated electricity exceeds the power consumption, the surplus electricity generation can be sold to the power grid company. In addition, Jiangsu Electric Power Company has implemented a time-of-use (TOU) tariff mechanism: it stipulates that 8:00–21:00 is the peak period for residential electricity use, and the rest of the time is the valley period. The electricity price during the peak period is 0.2 yuan/kWh higher than that during the valley period. This mechanism is intended to encourage electricity users to actively avoid peaks, which is usually called peak shaving and valley filling in the electricity industry, thereby enhancing the overall efficiency of the power system, and promoting green and low-carbon energy development.
3.2 Date source
This paper selects electricity usage data from distributed PV users in Nanjing, Jiangsu Province. Jiangsu is a major economic province in China and is relatively advanced in green development. It ranked second in terms of new installed capacity of distributed PV in 2023 in China, reaching as high as 12.2GW, of which the new installed capacity of residential photovoltaics accounted for 5.5GW. The data were obtained from the Marketing Service Center of State Grid Jiangsu Electric Power Company. To avoid the impact of the PV FIT subsidy policy implemented before June 2021, we select users who installed PV after June 2021. The installation time of these users is after the release of the policy, indicating that the behavior of these users is not affected by the PV FIT subsidy. The dataset, comprising a total of 95 PV users and 226 non-PV users, was collected over the period from January 2020 to April 2022. It spans 28 periods and encompasses a total of 8,988 samples. The dataset contains basic information such as the user’s PV installation date, installation capacity, the county they belong to, and the user’s electricity information. The electricity-related information includes rural residents’ household electricity consumption (HEC) from the power grid (divided into peak-time and valley-time electricity consumption according to the time of use), solar power generation output exported to the power grid, and PV power generation. We choose monthly data in this study, because the electricity power company has to count the electricity consumption every month to collect the electricity bill and the accuracy of monthly data is very high.
3.3 Description of variables
This study focuses on five dependent variables: , , , , and respectively. The specific definitions of these variables are detailed in Table 1. Among them, the electricity consumption purchased by households from the grid, and the electricity consumption purchased during peak and valley hours are obtained directly from the meter, while the gross household electricity consumption and household self-consumption of electricity are calculated and processed, and the specific formulas are shown in Table 1.
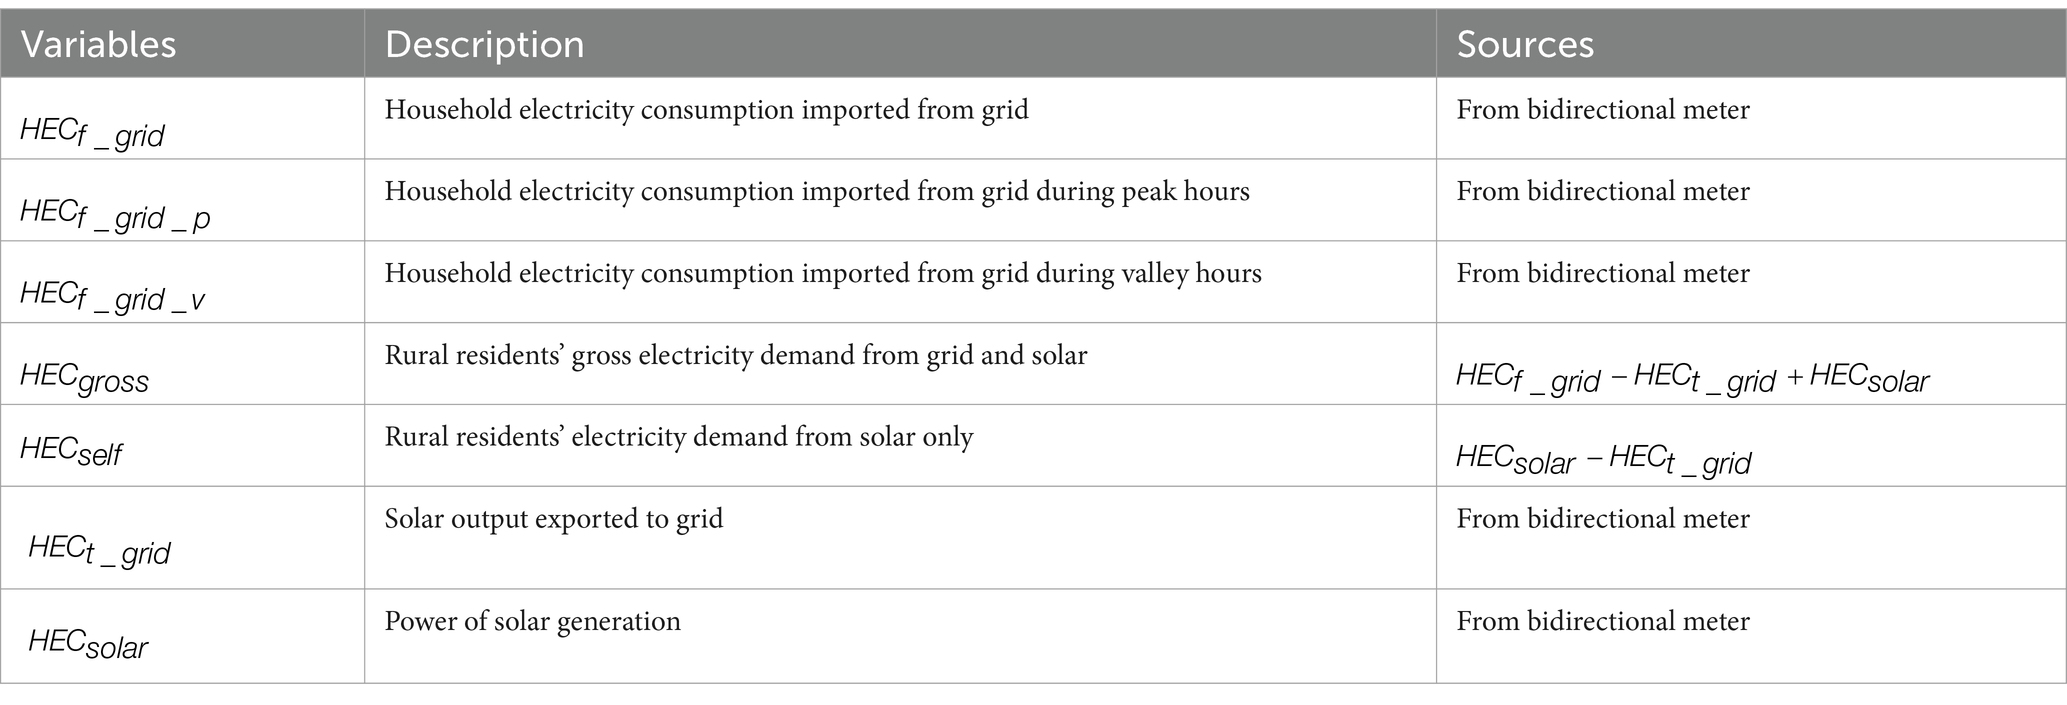
Table 1. Description of variables.
4 Research models
4.1 DID model
We employ a two-way fixed effects panel regression model. Due to the varying installation times of the selected PV users, a multi-time point DID model is used, and the basic model is shown in Equation 1.
where is a constant term. is the dummy for the treatment variable, which is equal to 1 if the sample is in treatment group after the date of the PV installation. In all other cases, the value of this dummy variable is 0. is the impact coefficient of solar installation on the household electricity consumption. represents an individual fixed effect that captures unobservable and time-invariant factors potentially impacting electricity consumption. is a time-fixed effect, which explains the time-variant factors affecting household electricity consumption. is the residual. is the outcome variable for the rural resident i at time t. There are five outcomes in this difference-in-differences model, namely , , , , and , respectively.
is a control variable, and there are many factors that affect electricity consumption, among which temperature and holidays have a significant impact (Kang and Reiner, 2022; Khan et al., 2021). Therefore, we choose temperature and holidays as the control variables. We mainly focus on rural residents in this study. One of the important characteristics of them is that they usually do not have a fixed working pattern (workday system) like urban residents. Rural residents usually go out to work for a period of time and then take a break at home for a period of time. When they go out to work, their houses are generally in a vacant state, which has a significant impact on electricity consumption. Hence, instead of using holidays as a control variable, we use the state of the houses (vacant or not) as a control variable in the model. Existing studies widely agree the principle that households are vacant if its annual electricity consumption is less than 30 kWh (Li et al., 2019), and we also adopt this principle in this study. For temperatures, we obtain the temperature data from the China Weather Station website. Referring to the existing literature (Liang et al., 2022; Qiu et al., 2022), we measure the effect of temperature through heating degree days (HDD) and cooling degree days (CDD). Rural residents need to cool down when the temperature is above the reference temperature and warm up when the temperature is below the reference temperature. The specific definitions are provided in Equations 2 and 3.
where is the average temperature of the day i, that is, the average of the day’s maximum and minimum temperatures. Therefore, the covariates include vacant, HDD and CDD. The reference temperature varies with different regions and climatic conditions around the world. In this study, the reference temperature was set at 18.3°C according to the international standard recommended by the American Society of Heating, Refrigerating and Air-Conditioning Engineers (ASHRAE). Thus, we can interpret the nonlinear relationship of temperature through spline functions of HDD and CDD.
4.2 Carbon emission model
To better investigate the carbon emissions from rural residential electricity consumption, it is necessary to account for the carbon dioxide emissions from electricity consumption. Currently, there are many methods to study the emissions related to the power system, which can be broadly divided into direct carbon emission accounting methods and indirect carbon emission accounting methods (Li et al., 2024). The emission factor method is a representative approach that is widely used worldwide at present (Hu et al., 2022). This method can reflect the carbon emissions released during fuel combustion process, that is, the carbon emissions during the power generation process. In this paper, the emission factor method is used to estimate rural residential carbon emissions. We refer to the official document released by the Ministry of Ecology and Environment of China: “Announcement on the Release of the Carbon Dioxide Emission Factor for Electricity in 2021.” It provides the average carbon dioxide emission factors for electricity at the national, regional and provincial levels, with the following formulas:
where is the carbon dioxide emissions. is the electricity consumption. is the average carbon dioxide emission factor, with different values for different regions. In this paper, the value of EF for Jiangsu provincial power grid is 0.65. Thus, the electricity consumption from the power grid by residents in the Jiangsu Province can be transformed into carbon emissions through Equation 4.
5 Empirical results
5.1 Basic regression analysis
To establish a foundational understanding of the dataset, we conduct a descriptive statistical analysis. Table 2 summarizes the descriptive statistics of the dataset, including measures of central tendency (mean, median) and dispersion (standard deviation, range). These statistics provide a detailed overview of the sample and serve as a foundation for subsequent analysis. The basic model results of Equation 1 are shown in Table 3.
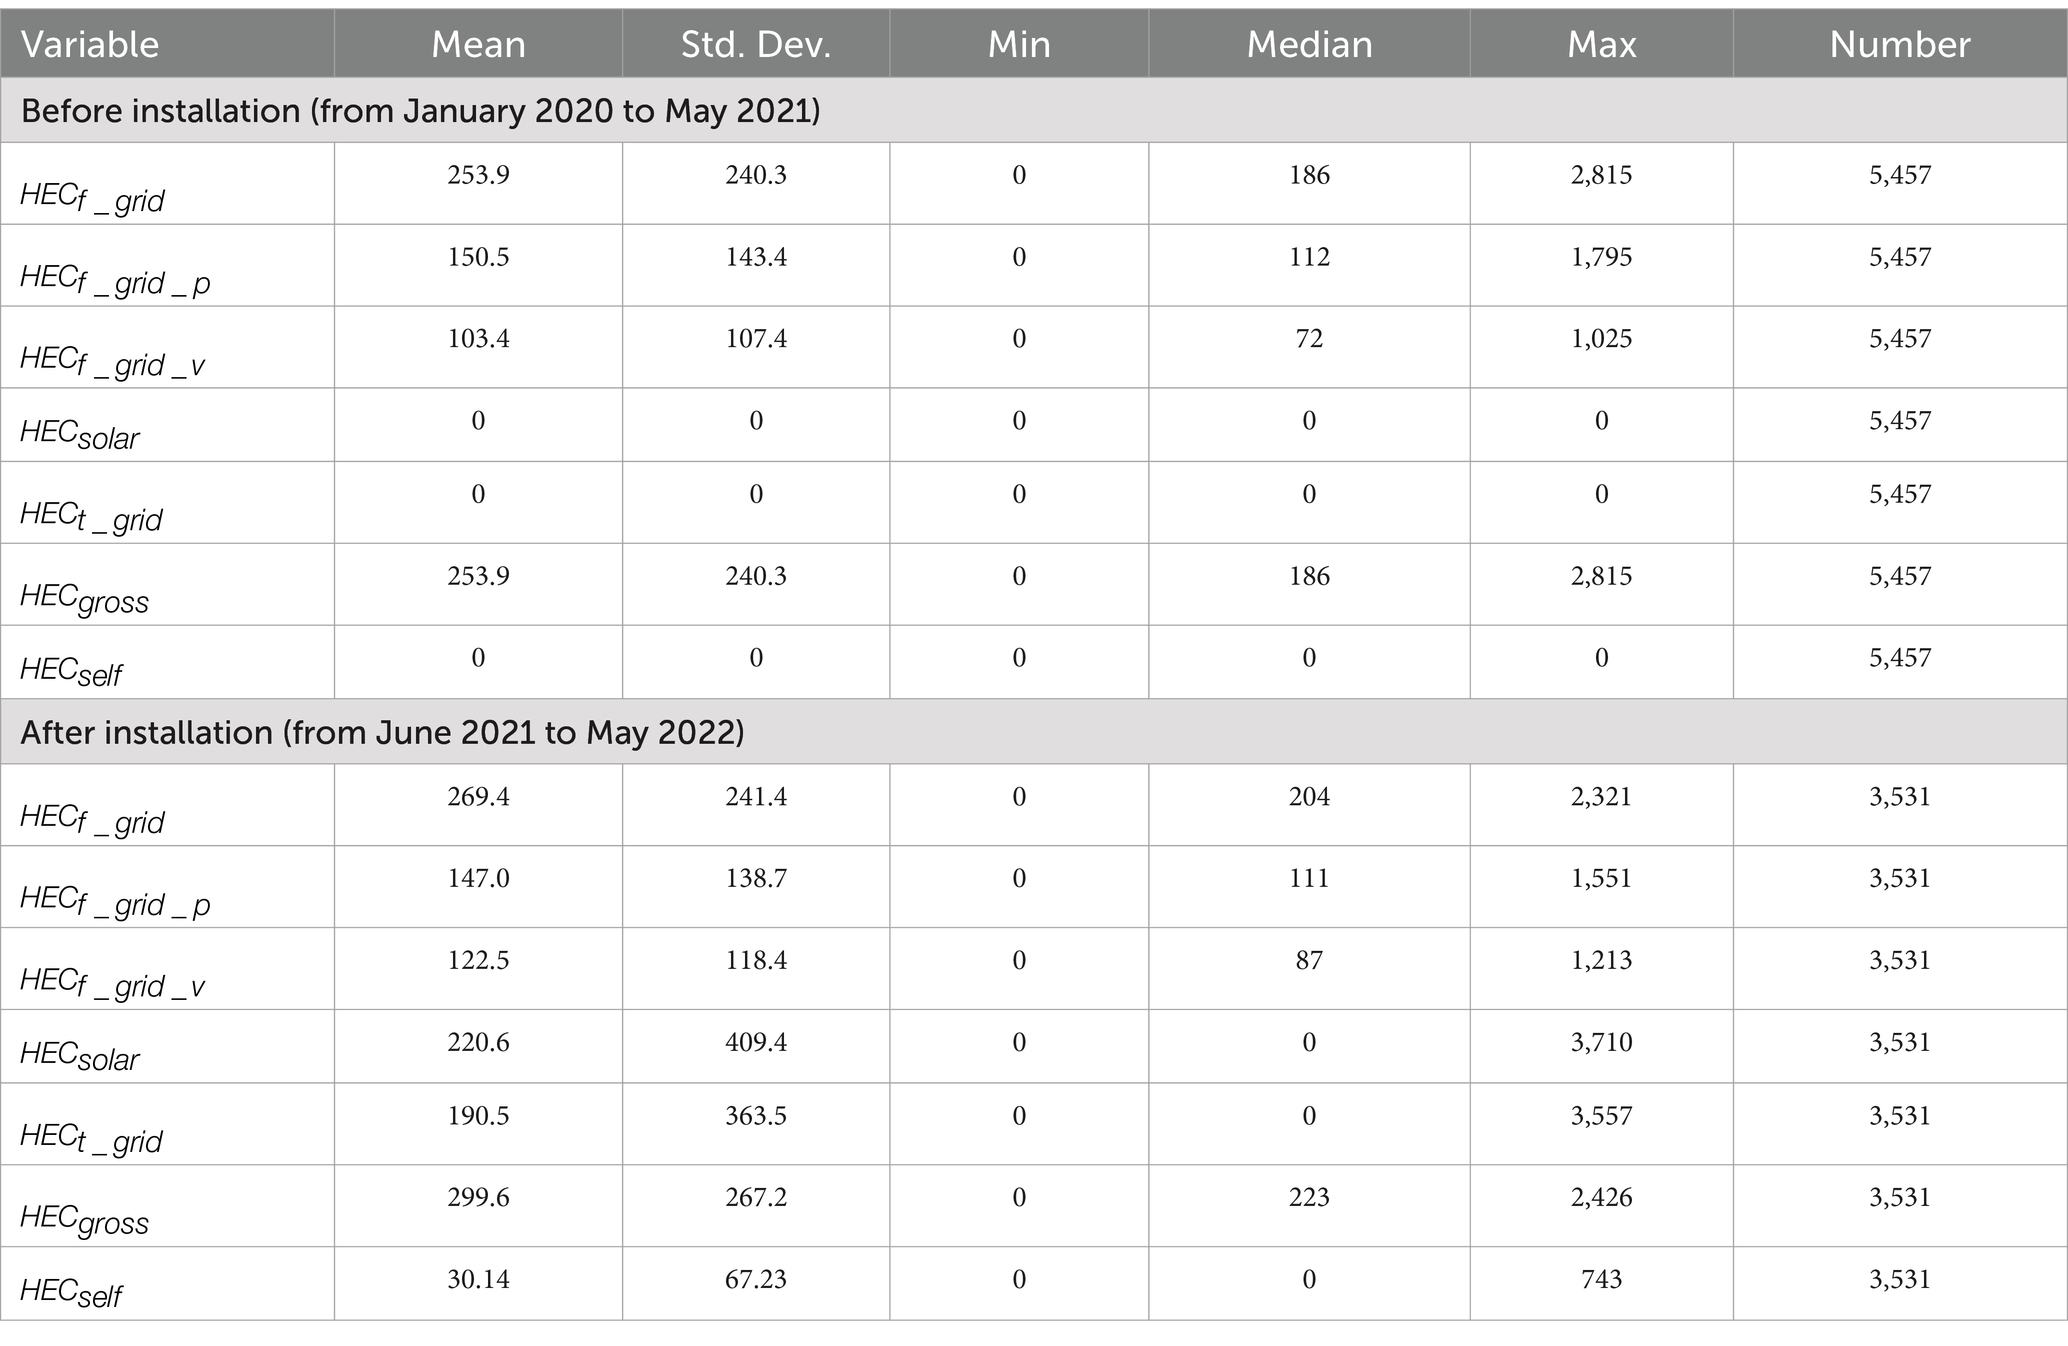
Table 2. Descriptive statistics of the dataset before and after the installation of RDPV.
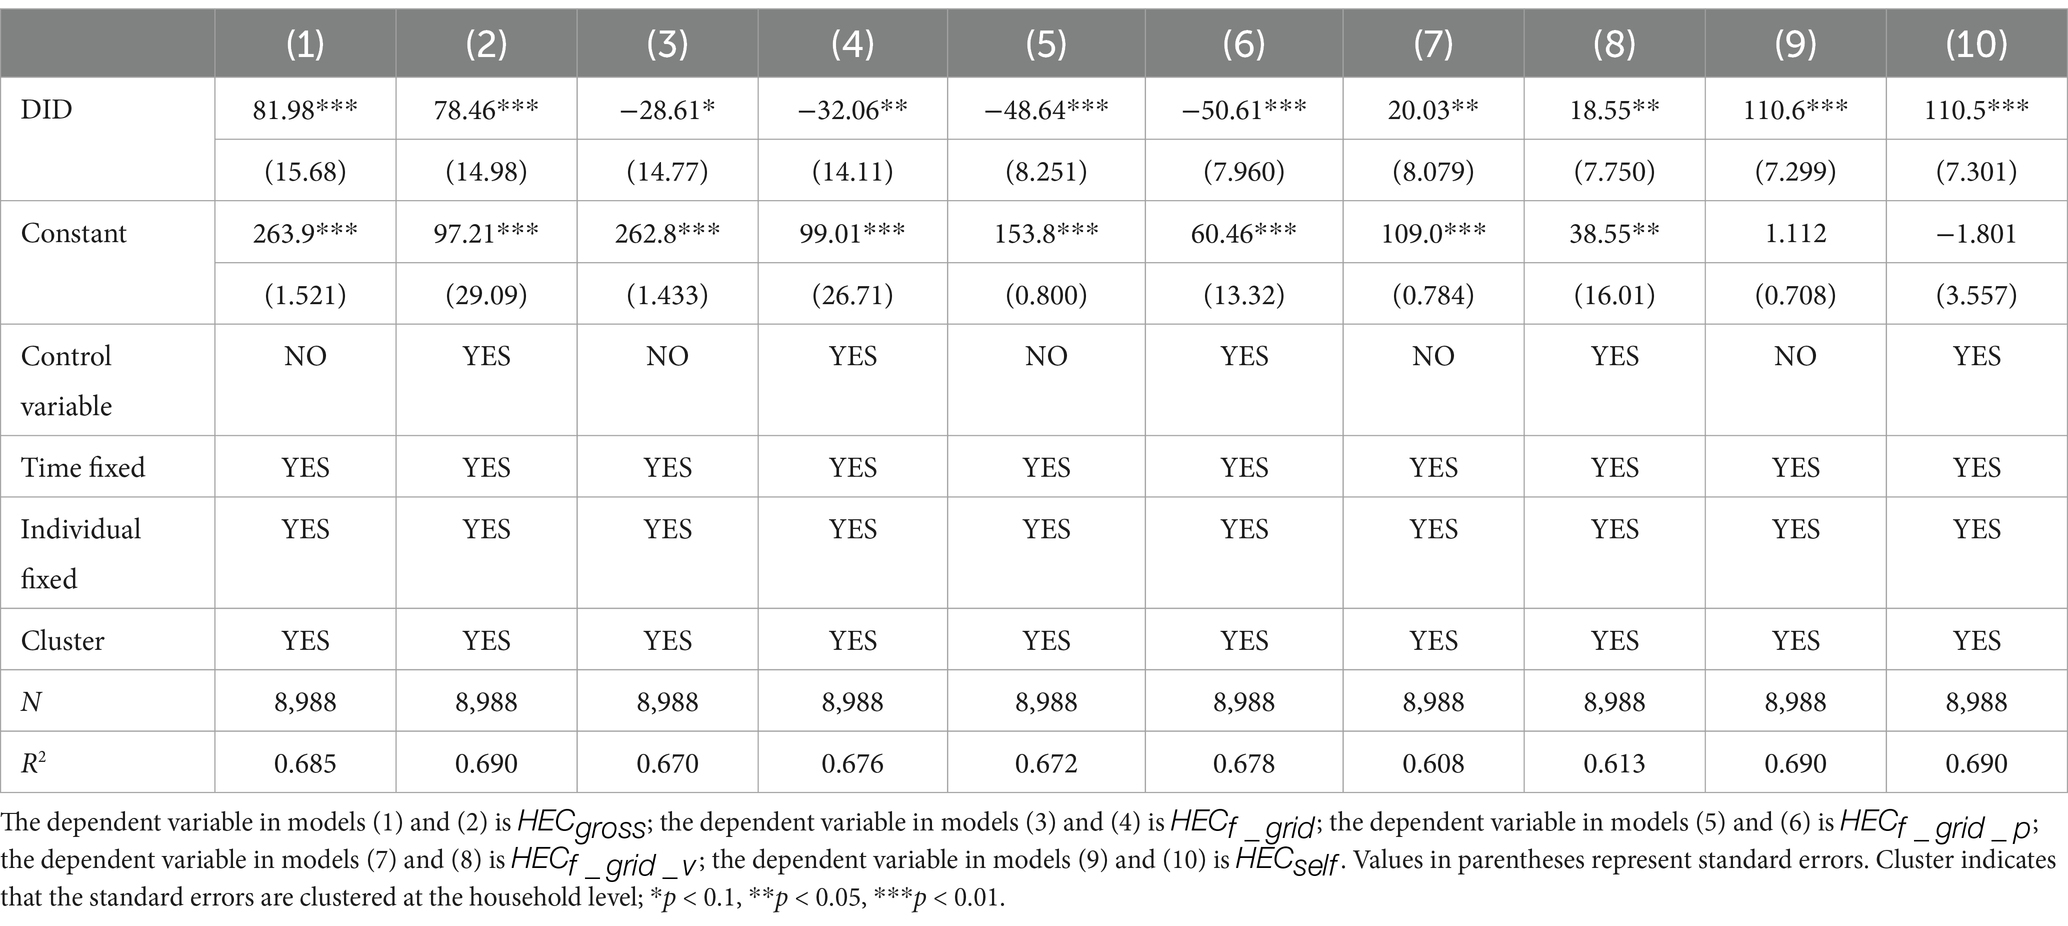
Table 3. Results of the basic model.
The odd-numbered columns are results without considering control variables. Comparing the results with even-numbered columns with added control variables, there are only minor differences in the estimates of different models, indicating the robustness of the conclusions. From model (4), it can be seen that the installation of RDPV can bring about a reduction of 32.06kWh in the total amount of electricity purchased by residents from the power grid. Through the carbon emission model, it shows that installing solar PV can reduce emissions by 20.97 per month, suggesting that the installation of RDPV indeed reduces the carbon emissions of rural residents. However, the reduced electricity consumption purchased from the power grid is much lower than total household electricity consumption, which is 299.6kWh. The model (10) shows that the installation of RDPV by rural residents brings 110.5kWh of self-consumption. Consequently, the proportion of solar power in the total household electricity consumption is calculated to be 36.9%. It is evident that the carbon reduction potential of RDPV has not been fully exploited. The main reason is the low utilization rate of PV because of the difference between the PV generation load and the electricity consumption load, and the lack of energy storage equipment among rural residents.
From model (2), we find that there is a significant rebound in the gross household electricity demand of the rural residents after the installation of PV, with an increase of 78.46 kWh in monthly electricity consumption. The reason may be the decrease in the perceived electricity price for customers after the adoption of solar PV power generation. It has been found that fluctuations in electricity prices have a significant impact on residents’ electricity usage habits (Fraija et al., 2022; Wang et al., 2021), which would lead to an increase in electricity consumption behavior among users. However, this increased electricity consumption is not essential for residents’ daily life. From model (10), we find that there are 110.5kWh solar power consumed by rural residents. However, due to a rebound in electricity consumption of 78.46 kWh, only 32.04 kWh of solar electricity is available to offset the rural residents’ electricity demand from the power grid, which is consistent with the results of model (4). Therefore, if policymakers can formulate electricity pricing policies that make users perceive the electricity price as stable, it can reduce the rebound effect of electricity consumption among PV users, thereby further increasing the carbon reduction effects brought by PV.
From model (5) and (6), we can further find the change of rural residents’ electricity demand from the power grid in different time periods after the installation of PV. The demand for electricity purchased from the power grid decreases by 50.61kWh during peak period and increases by 20.03kWh during valley period. This indicates that the installation of RDPV has a good peak-shaving effect. This is because the PV power generation time highly coincides with the peak electricity usage times of residents (8:00–21:00). Residents can use PV power to replace electricity purchased from the power grid during peak period, achieving a better peak shaving effect. While in the valley period, there is almost no PV power generation for residents to use, thus the increased electricity demand from the power grid at this period can be inferred to be caused by the rebound effect, and in fact this part of the electricity consumption can be avoided. The rebound effect cannot be directly estimated during peak hours due to the PV power generation has partly covered the growth in electricity demand from the power grid. If the rebound effect of electricity consumption by users is reduced through the pricing mechanism, the carbon emission reduction can be increased to 34.07 by considering only the reduction of the rebound effect during valley period, and the carbon emission reduction effect can be enhanced by 62.48%.
5.2 Robust analysis
5.2.1 Parallel trend test
The reasonableness of the DID model is based on the parallel trend assumption, which means the treatment and control groups have the same trend before the treatment. Otherwise, the DID model would not be applicable. This assumption requires that the differences between the control and treatment groups is constant over time before treatment. This study draws on the event study approach (Gu et al., 2021; Huang and Zhang, 2021) to test the parallel trend hypothesis. The specific model is shown in Equation 5.
The above model structure is similar to Equation 1 and the difference is that the above model has 29 dummy variables and 29 corresponding coefficients . indicates the time before the installation of PV and indicates the time after the installation of PV. represents the PV installation time. Parallel trends in the control and treatment groups can be observed through the core coefficients . Firstly, if none of the coefficients are statistically significant before the installation of the PV, then it indicates that there is no difference between the treatment and control groups in their electricity consumption behavior before the installation of the PV. Secondly, if the coefficients are statistically significantly different from 0 after the installation of the PV system, it indicates that the installation of the PV would bring about a significant impact. When the above conditions occur simultaneously, it indicates that the model passes the parallel trend test.
The parallel trend test results of and are shown in Figures 1, 2 respectively and the red dashed reference line indicates RDPV installation time. The horizontal axis “pre_x” is the month x before the installation of the PV, “current” indicates the RDPV installation time, and “post_x” is the month x after the installation of the PV system. The vertical axis shows the coefficients and confidence intervals at the 95% level, where represents the impact of installing PV on rural residential electricity consumption. Before the installation of the PV system, the coefficients of both the and fluctuate around 0 and are not statistically significant, which indicates that there is no significant difference between the control and treatment groups in terms of both gross electricity consumption and electricity consumption from the power grid before the installation of the PV system. However, after the installation of the PV system, the coefficient of the increases rapidly, while the coefficient of the decreases, and both are statistically significant. This indicates that both the gross electricity consumption and electricity consumption from the power grid of the rural residents passes the parallel trend test.
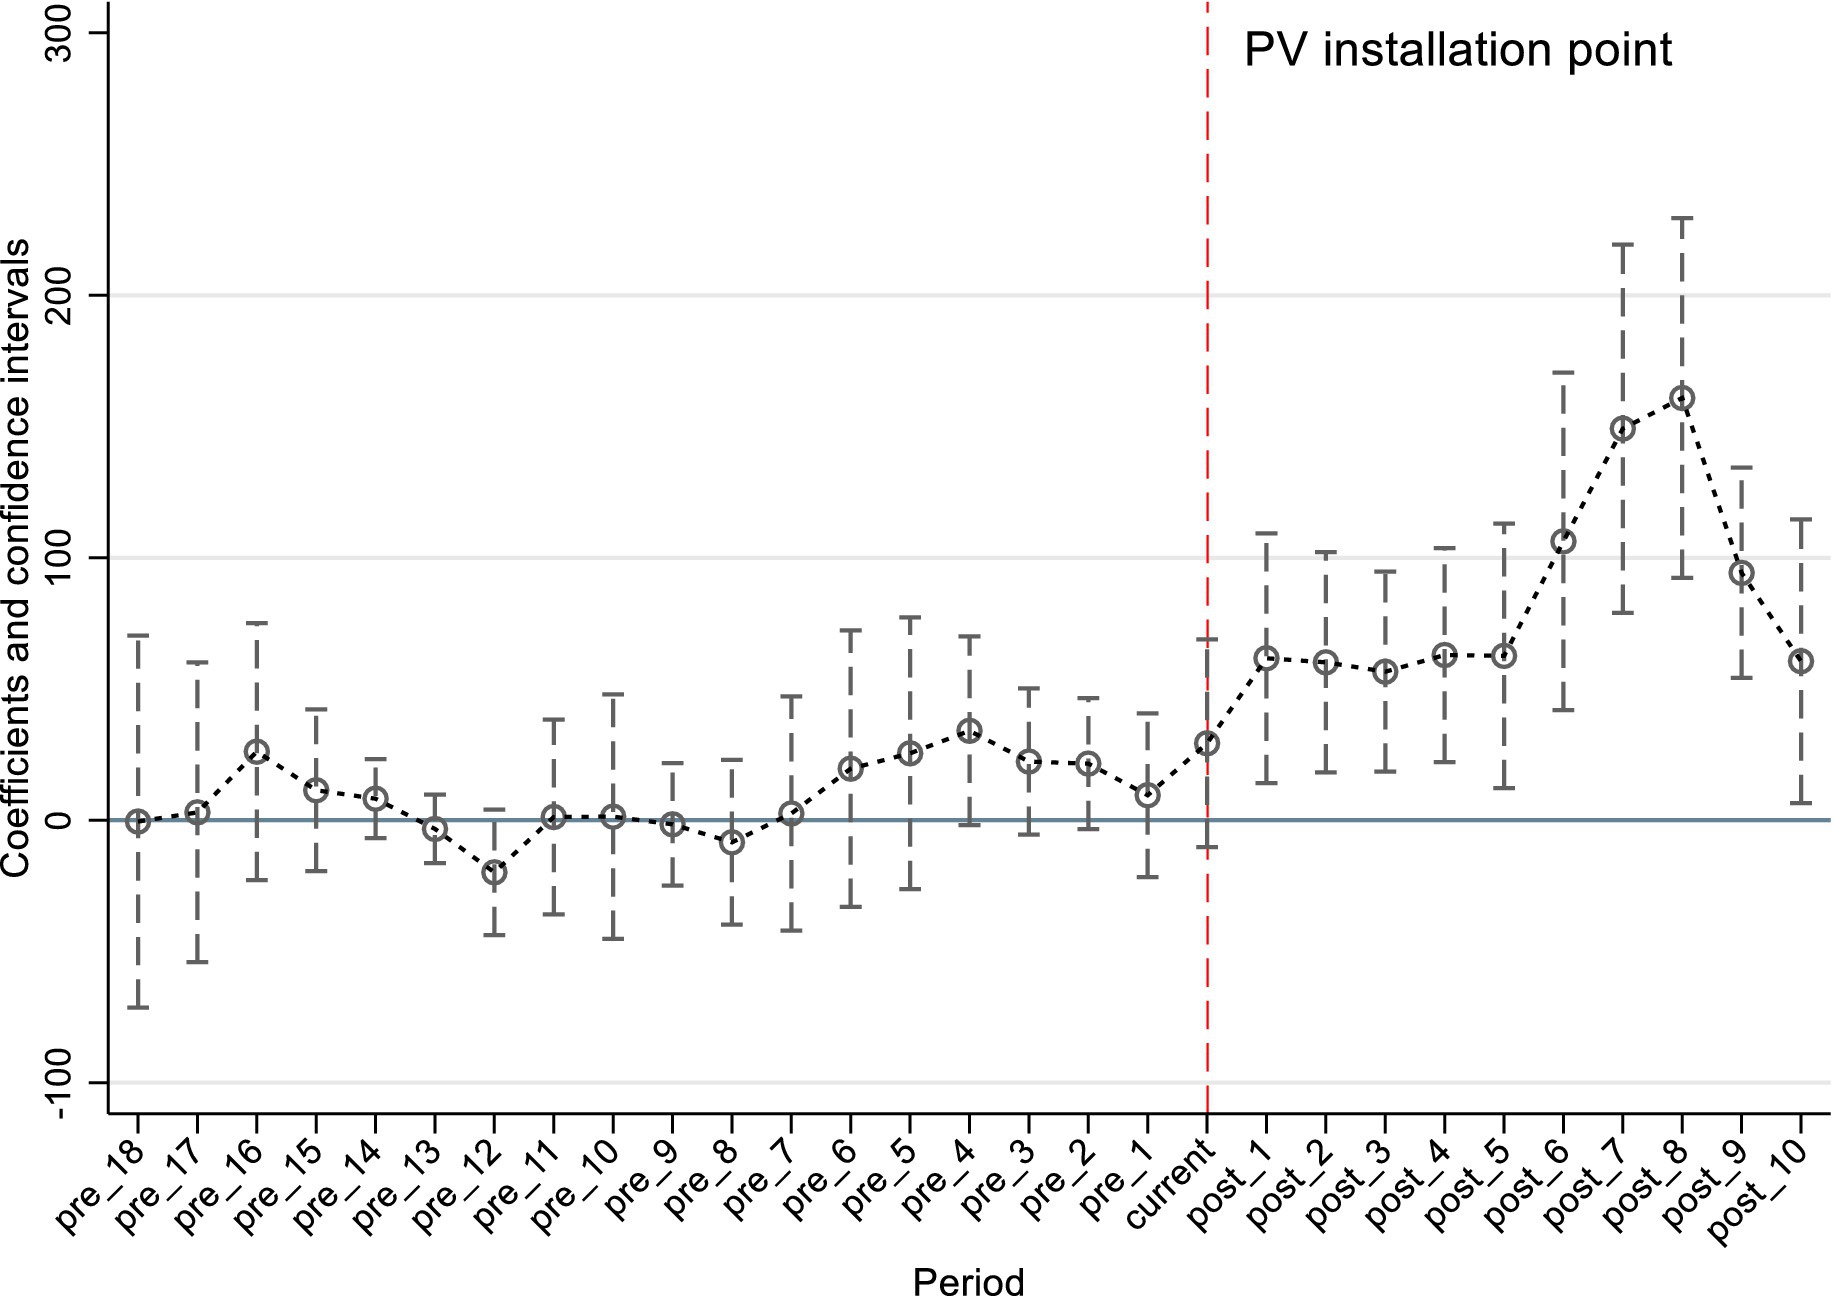
Figure 1. Parallel trend of gross electricity consumption.
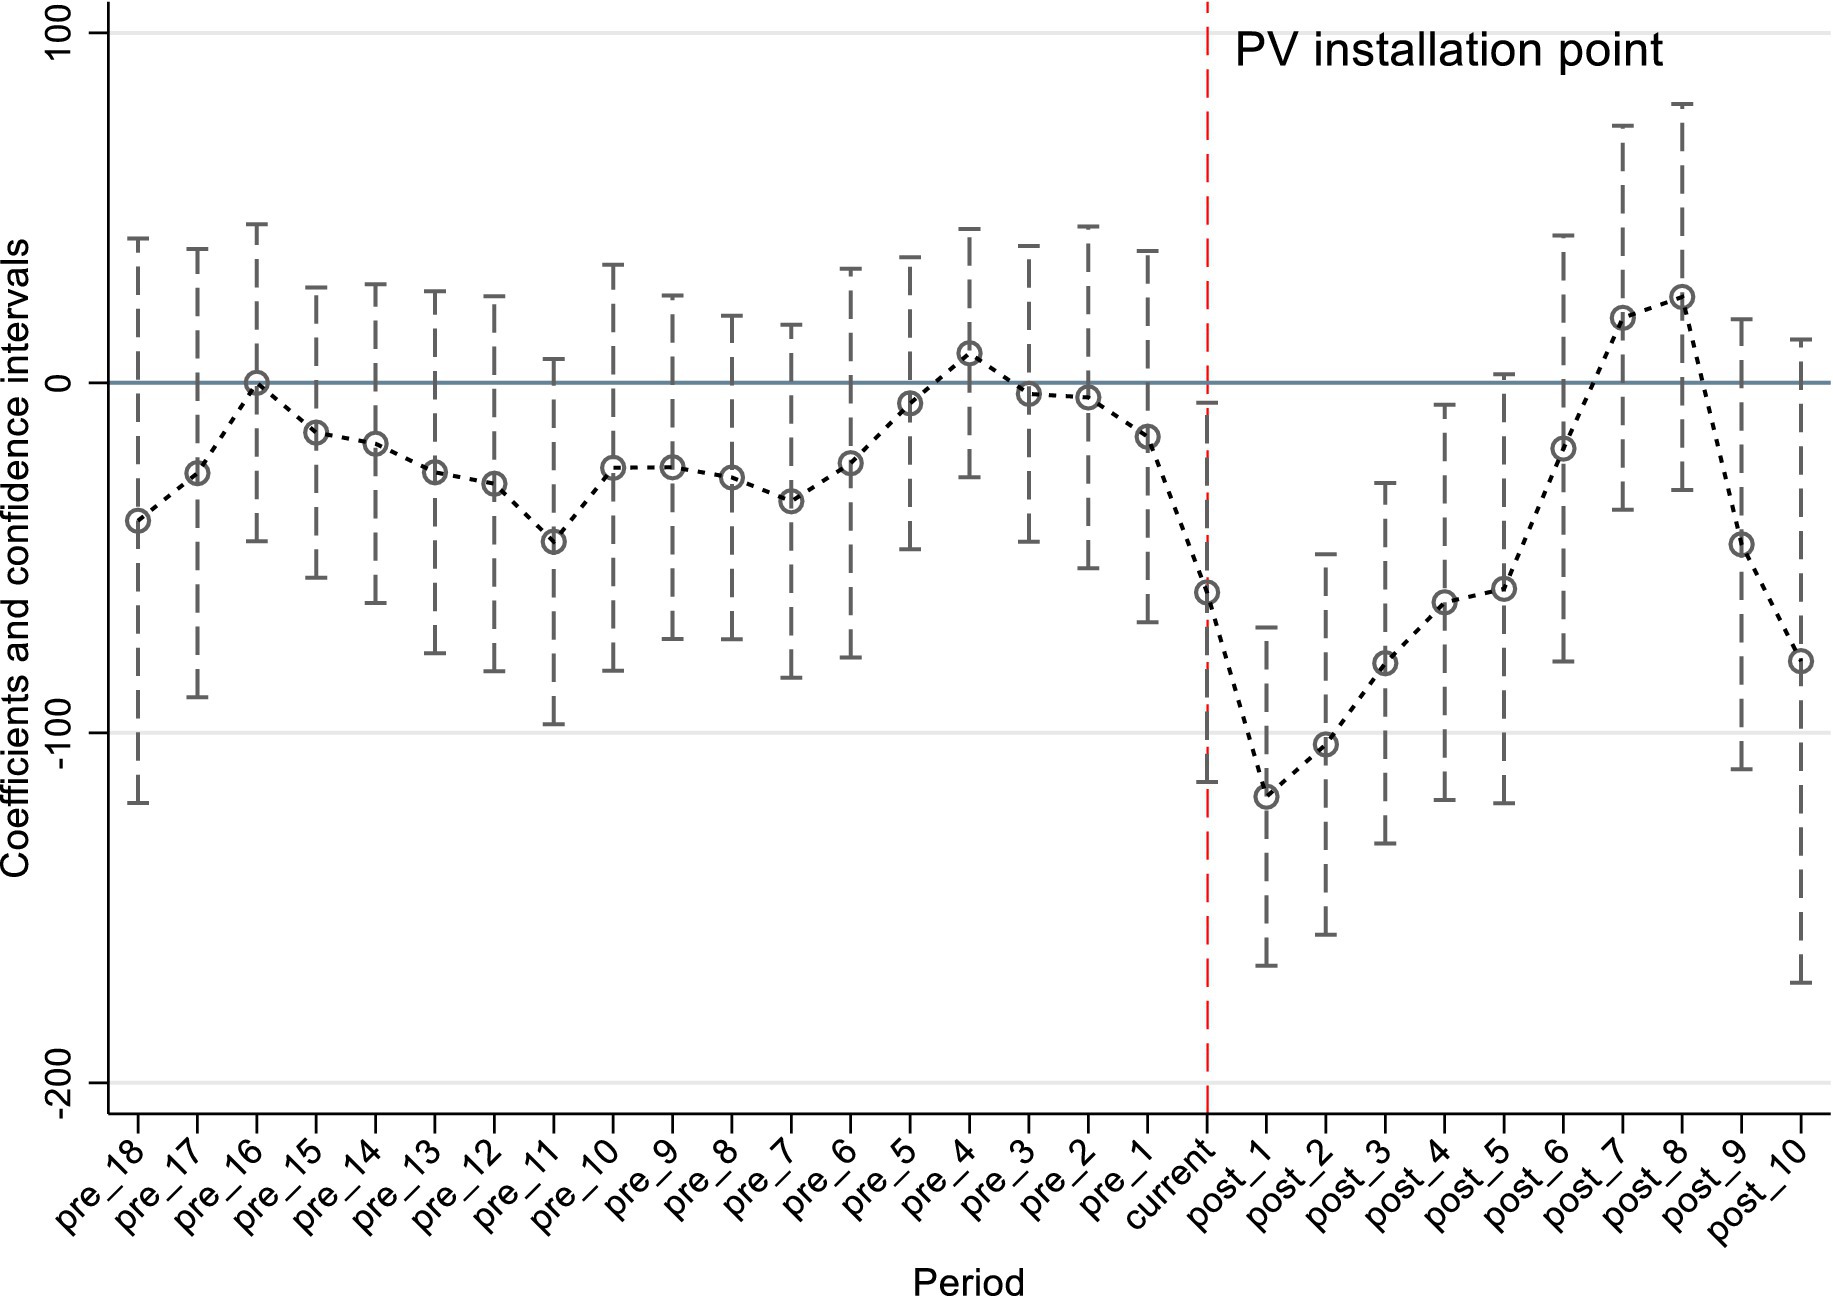
Figure 2. Parallel trend of electricity consumption imported from the power grid.
5.2.2 Placebo test
To better illustrate the reliability of the conclusions, a placebo test is applied on the model. Ideally, if the policy is exogenous and unaffected by unobservable factors, it is possible to directly obtain a consistent estimate of the coefficient through OLS estimation. However, in real-world situations, policies are influenced by various observable and unobservable factors, resulting in estimates as shown in Equation 6.
where W is the fixed effect and is the effect of unobservables factors on the independent variable. If = 0, indicating that unobservable factors have no effect on the estimation results, then is an unbiased estimate. However, it is difficult to directly verify whether is equal to zero because it is inherently unobservable. Therefore, it can only be verified whether it is zero through indirect means. Following the approach of Chetty et al. (2009), we can obtain the randomly set estimated coefficients by repeatedly randomizing all users into treatment and control groups. Then, based on the distribution of the randomly set estimated coefficients, we judge whether there is an influence from unobservable factors. We randomly generate a dummy variable that theoretically does not affect the dependent variable to replace . is zero since this variable is randomly generated. Under this condition, if the estimate is still equal to 0, it can be deduced to = 0. We set the simulation process to 1,000 times and perform the placebo test on the explanatory variables and respectively. Then we can obtain the distribution of the randomly set estimated coefficients.
In Figures 3, 4, the dashed lines indicate the actual estimated coefficients of the independent variables. The distribution curves indicate the randomly set estimated coefficients distributions. From Figures 3, 4, we can find that the actual estimated coefficients of the independent variables deviate significantly from the randomly set estimated coefficients distributions. Specifically, the randomly set estimated coefficients are normally distributed with zero as the mean, from which we can deduce that = 0 which means that the policy in our study is exogenous. It also verifies that the parameter estimates of the model are valid.
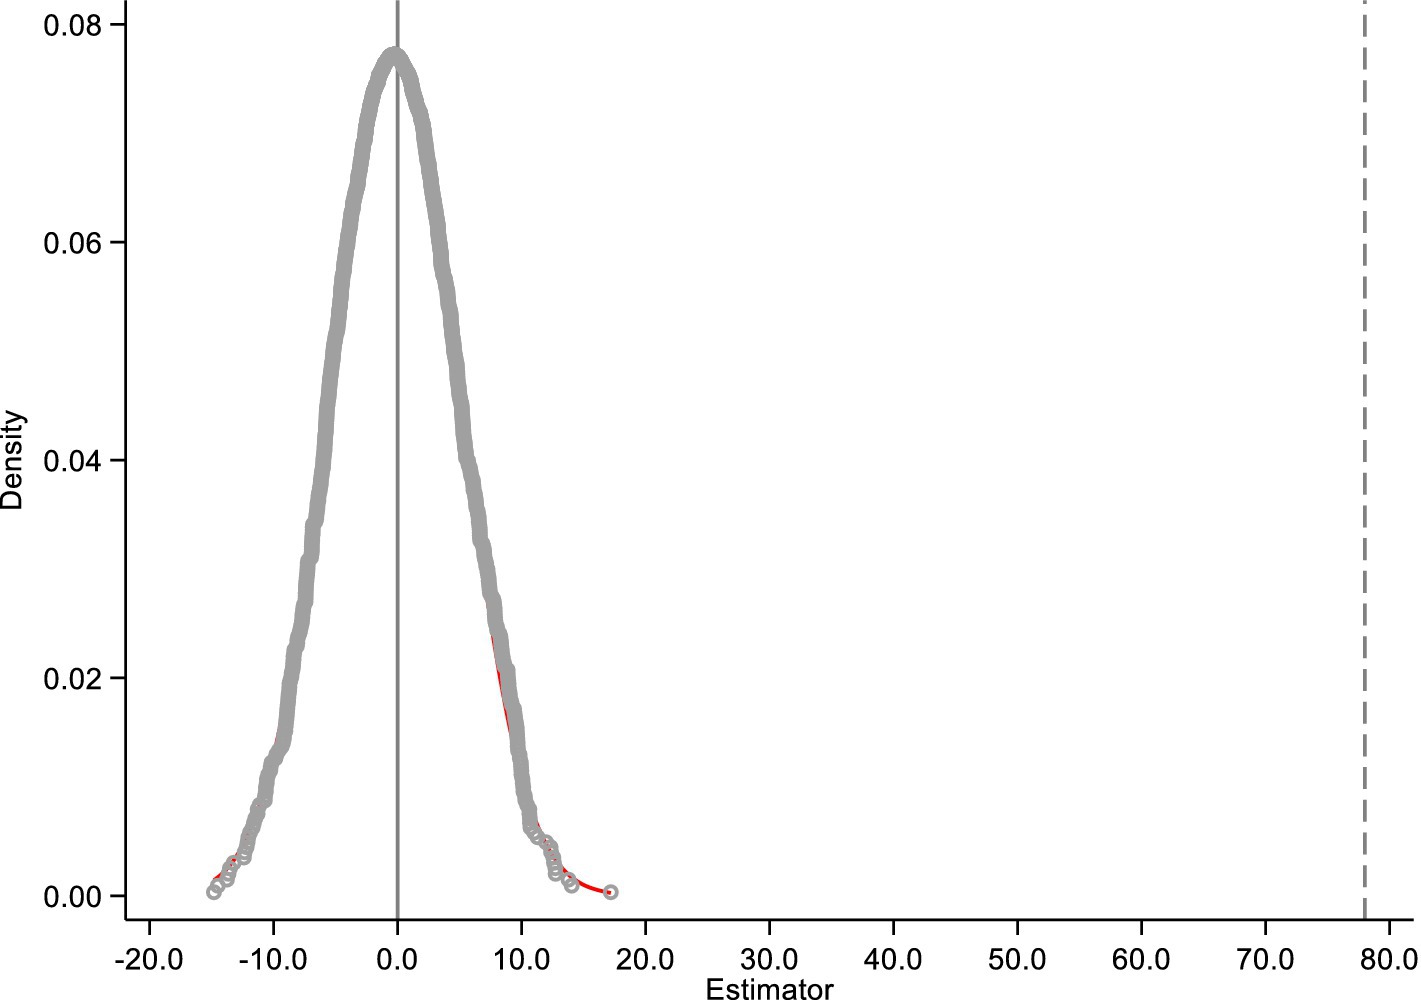
Figure 3. Placebo test result on .
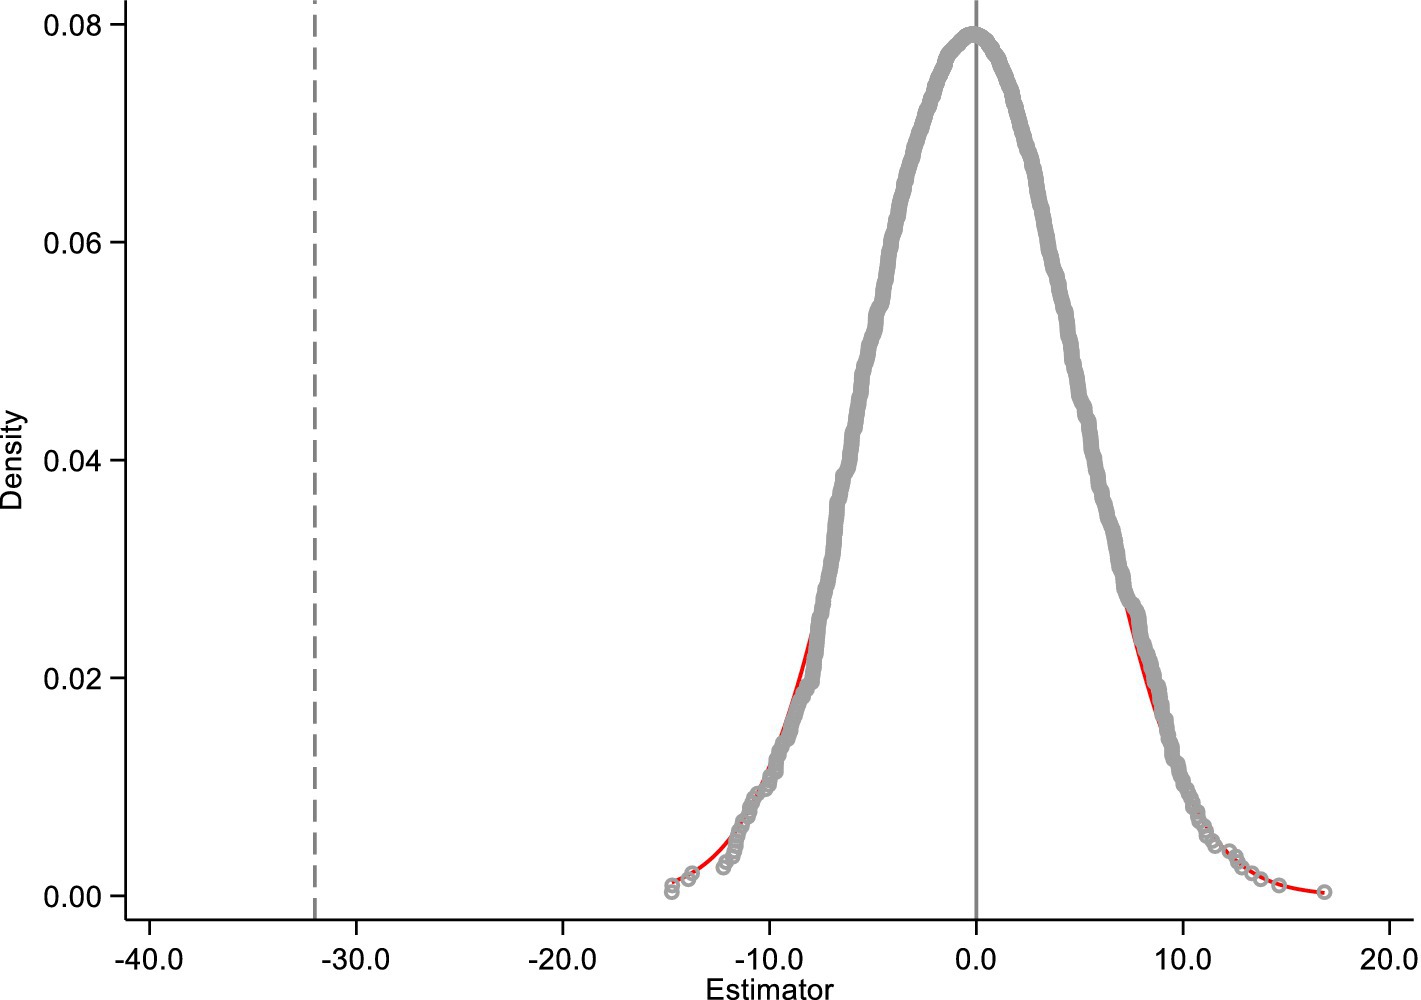
Figure 4. Placebo test result on .
5.3 Self-consumption analysis
Self-consumption in households refers to the electricity generated by the solar PV being consumed within the household. Analyzing the self-consumption of solar PV is significantly important for grid stability. With the continuous increase of distributed PV, the grid’s capacity to accommodate distributed PV power is insufficient. The improvement of self-consumption level can alleviate the impact of PV power generation uncertainty on the stability of the grid and improve the stability of the grid. We perform a marginal dynamic effects test on self-consumption to analyze the change of self-consumption level by users over time after the installation of PV. The dynamic effects of self-consumption are analyzed according to Equation 7. The coefficients of the interaction terms after the installation of PV indicate the dynamic effects from the installation of solar PV. The differences from the basic model (i.e., Equation 1) lie in the following aspects. First, the dependent variable has only one type, that is self-consumption. Second, the independent variables have 11 dummy variables. Third, the coefficients reflect the effect of installing solar PV on self-consumption in the current period (the installation period) and in the next 10 months. The results of the analysis are shown in Figure 5.
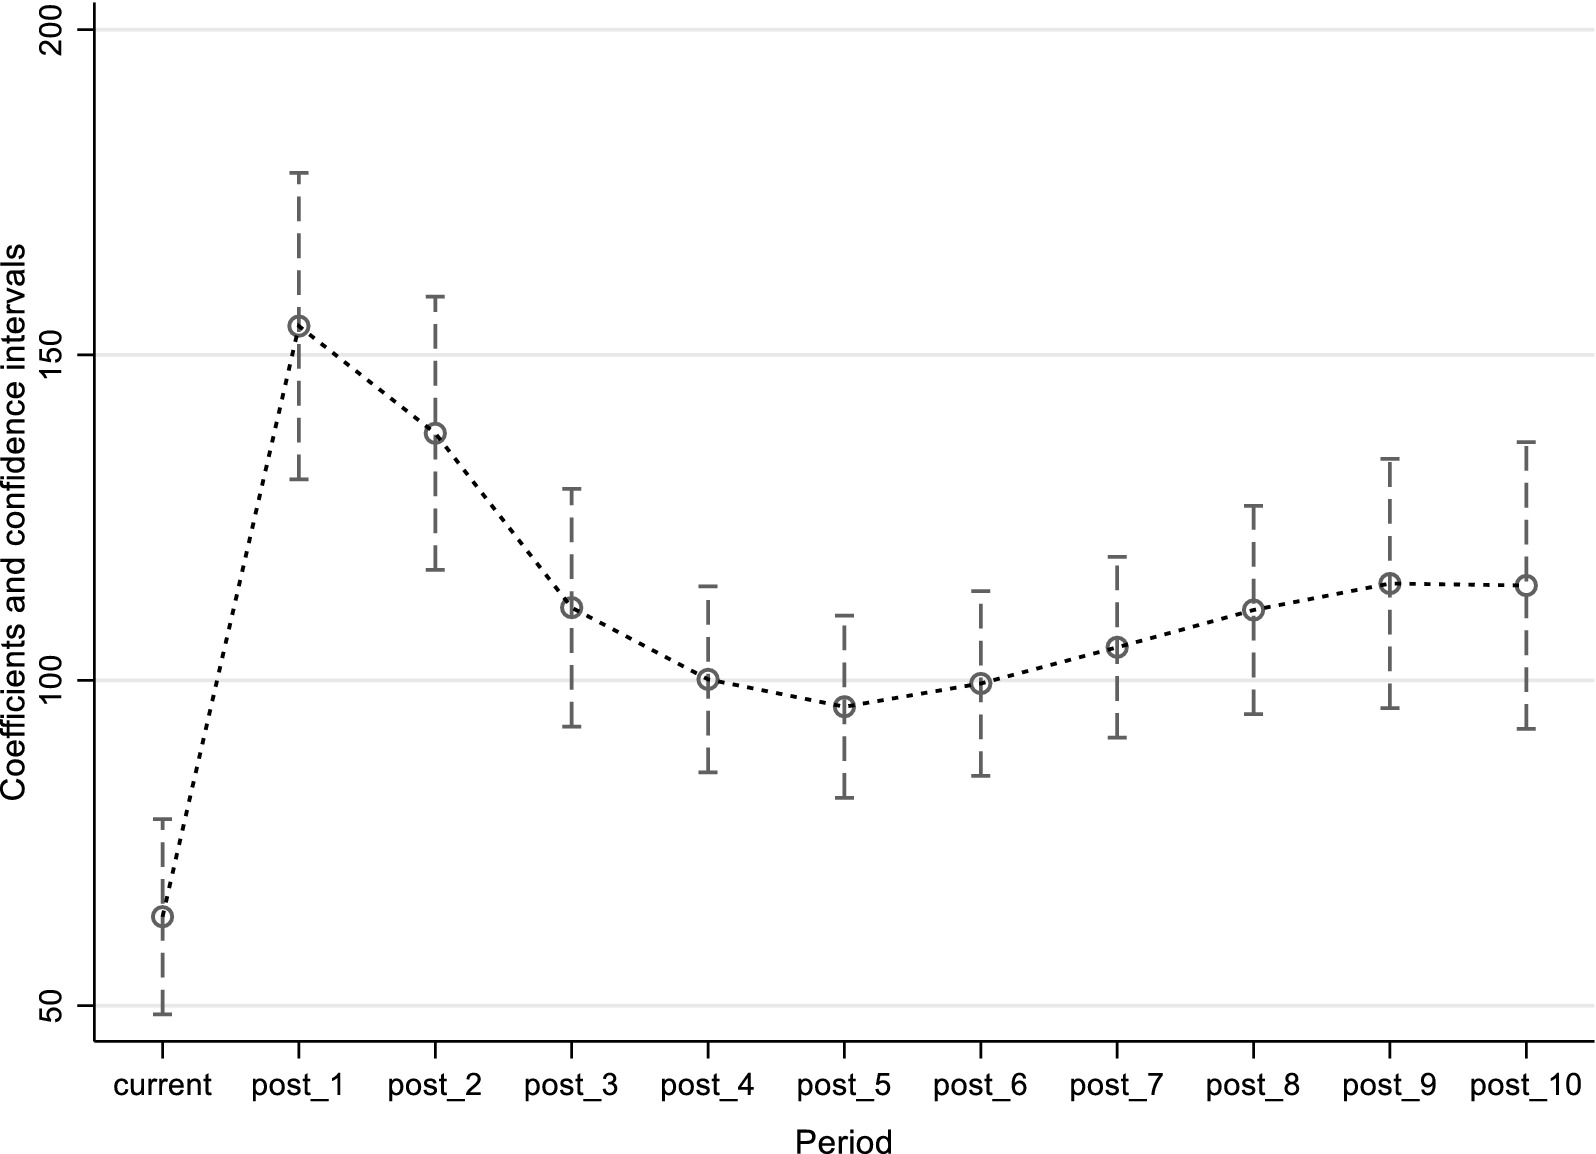
Figure 5. The self-consumption dynamics effect.
Figure 5 indicates that the installation of solar PV has a continuously significant impact on the self-consumption level by rural residents over time. After the installation of PV, there is a short-term sharp increase in self-consumed electricity, which then gradually decreases and eventually stabilizes around 115 kWh. Based on the benchmark of the average monthly total household electricity consumption of PV users, which is 299.6kWh, it can be inferred that the proportion of solar electricity in the total household electricity consumption is stable at around 38.4%. Therefore, there is still a lot of room for improvement of rooftop PV utilization rate.
5.4 Heterogeneity analysis
For rural residents, choosing the installed capacity of the PV system is an important decision when installing PV systems. Because the installed capacity of PV is closely related to their revenues and costs. In our study, the installed capacity of PV ranges from 3 kVA to 50.42 kVA. In order to analyze the differences in electricity consumption behavior before and after the installation of PV for rural residents with different installed capacities, the rural residents are divided into three categories according to their different installed capacities of PV. Specifically, the users whose installed capacity is less than 8 kVA are divided into low-installed-capacity users, the users whose installed capacity is between 8 kVA and 20 kVA are divided into medium-installed-capacity users, and the users whose installed capacity is large than 20 kVA are divided into high-installed-capacity users. Therefore, we have three types of PV users, low-installed-capacity users (<8 kVA), medium-installed-capacity users (8–20 kVA), and high-installed-capacity users (>20 kVA), respectively. Using Equation 1, we analyze , , , and for PV users with different installed capacities, and the results are shown in Figures 6, 7, respectively.
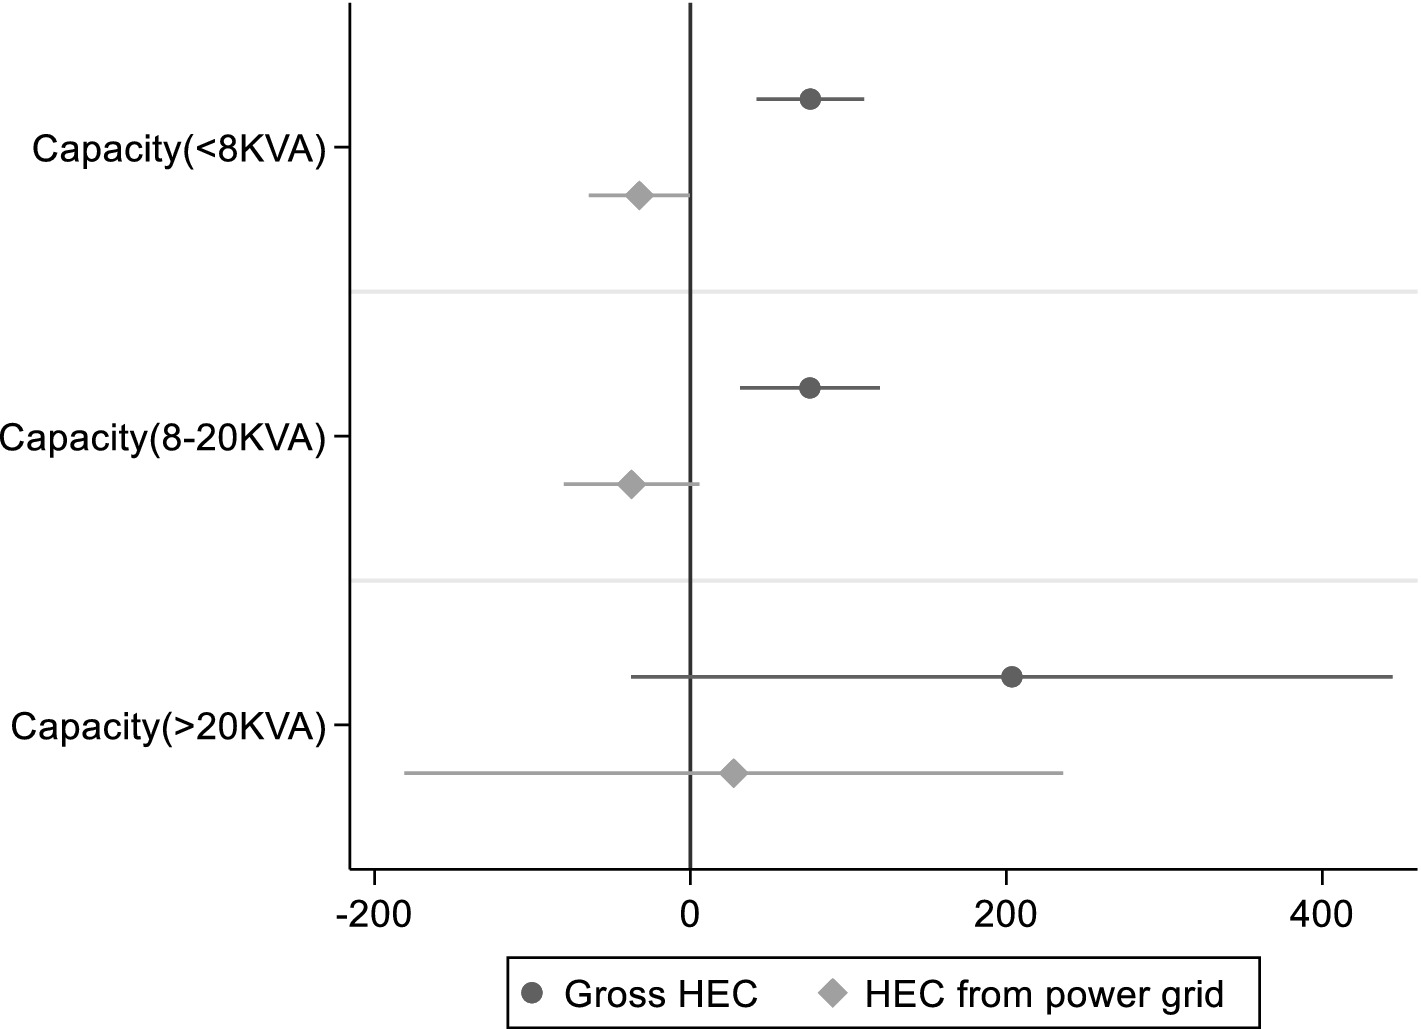
Figure 6. Analysis of and for PV users with different capacities.

Figure 7. Analysis of and for PV users with different capacities.
Figure 6 shows the differences of the rural residents’ gross HEC and HEC imported from power grid of PV users with different installed capacities. From Figure 6, we can see that the rebound effect of high-installed-capacity users is more significant. Figure 7 shows the differences of HEC of PV users with different installed capacities from power grid during peak and valley period. We can conduct further analysis about the rebound effect by using Figure 7. We find that the rebound effect of high-installed-capacity users mainly stems from the increased electricity consumption during the valley period, reflecting the PV users’ behavioral change after the installation of PV. Note that there is no PV power generation in the valley period, and the increased electricity consumption during the valley period cannot be offset by PV power generation. Therefore, the higher the increase in electricity consumption during the valley period, the greater the rebound effect. Since high-installed-capacity users have the largest increase in electricity consumption during the valley period, the rebound effect of high-installed-capacity users is greater than other two types of users. The reason is that the larger the installed PV capacity, the greater the amount of electricity generated, resulting in a lower perceived cost tariff of electricity for users. After installing PV, changes in electricity consumption behavior may result in users generating larger electricity demand even when the PV has no power generation in the valley period, which leading to the increase of the rebound effect and carbon emissions. Therefore, increasing rural residents’ knowledge about PV generation, sources of electricity consumption at different times, as well as different electricity prices at different times can mitigate the rebound effect of users to a certain extent and increase the carbon emission reduction.
6 Conclusion
RDPV is beneficial for both carbon emission reduction and energy transition. For rural residents, RDPV can bring both economic and environmental benefits. Assessing those benefits is crucial for government policy-making and the development of PVs. However, there is little research on assessing the environmental benefits and investigating the changes of rural residents’ electricity consumption behavior brought by the installation of RDPV in China. Therefore, in this paper, we analyze the effect of RDPV installation on rural residents’ carbon emission reduction and electricity consumption behavior through the DID method. We select rural residential PV users in Nanjing, Jiangsu Province as samples, and our models are subjected to a parallel trend test and a robustness test. The results show that the models pass all the tests, showing the reliability of the conclusions of this paper. After obtaining the basic regression results, we analyze the rebound effect and emission reduction effect of RDPV in China. Furthermore, we take a step further to analyze household self-consumption of PV users and the heterogeneity analysis considering the installed PV capacity. Overall, this study provides empirical evidence on carbon emission reduction and the changes of rural residents’ electricity consumption behavior brought by the installation of RDPV in China. We find that there is a rebound effect in electricity demand among Chinese rural PV users, which inevitably inhibits carbon emission reduction effects. The main conclusions of this paper are as follows:
1. The installation of RDPV can reduce the total electricity purchased from the grid by 32.06kWh/month. Specifically, from the perspective of peak period and valley period, we find that the electricity purchased from the grid decreases by 50.61kWh/month at peak period and increases by 20.03kWh/month at valley period, bringing about a reduction of carbon emissions by residents by 20.97 /month. The installation of RDPV brings 110.5kWh/month of solar energy self-consumption by residents, and the share of solar electricity in total household electricity consumption is 36.9%. Through the analysis of the dynamic effect of self-consumption, it is found that there will be a short-term sudden increase in residents’ self-consumption of electricity after the installation of PV, followed by a gradual decline, and the proportion of solar electricity in the total household electricity consumption stabilizes at about 38.4% ultimately. Therefore, we can get the insights that the promotion of RDPV installation is conducive to achieving the goals of residential carbon emission reduction and grid peak shaving and valley filling.
2. Under the existing residential electricity pricing policies in China, there is a significant rebound effect of rural residents’ total electricity demand after installing RDPV, with monthly electricity consumption increasing by 78.46 kWh. The perceived decrease in electricity prices due to PV generation may be the reason for changes in users’ electricity consumption behavior.
3. Since the PV systems do not work during the valley period, the increase of household electricity consumption imported from grid during the valley period is mainly caused by the rebound effect. Therefore, when making electricity pricing policies, it is preferable that the set of purchase and sale electricity prices can mitigate the perceived electricity price changes for PV users. This can help lower the rebound effect among PV users and enhance the carbon reduction benefits brought by PV. We find that merely reducing the rebound effect during the valley period can increase the carbon emission reduction to 34.07 /month, representing that the carbon emission reduction effectiveness can be improved by 62.48%.
4. The rebound effect of installing high-capacity PV users is significantly higher than that of low-capacity PV users. The rebound effect mainly comes from the increased electricity consumption during the valley period. The higher the installed PV capacity, the greater the amount of electricity generated, resulting in a lower perceived cost tariff of electricity for users, which brings the increase of electricity demand. It implies that rural residents’ electricity consumption behavior would be changed after the installation of RDPV, and the installed capacity of RDPV has an important influence on the change of electricity consumption behavior.
Data availability statement
The original contributions presented in the study are included in the article/supplementary material, further inquiries can be directed to the corresponding author.
Author contributions
CQ: Funding acquisition, Investigation, Project administration, Supervision, Validation, Writing – review & editing. YM: Conceptualization, Data curation, Formal analysis, Methodology, Software, Writing – original draft. CX: Visualization, Writing – review & editing.
Funding
The author(s) declare that financial support was received for the research and/or publication of this article. This work was supported by the National Natural Science Foundation of China [grant number 72302118; 72202103; 72304246].
Conflict of interest
YM was employed by State Grid Jiangsu Electric Power Co., Ltd.
The remaining authors declare that the research was conducted in the absence of any commercial or financial relationships that could be construed as a potential conflict of interest.
Generative AI statement
The authors declare that no Gen AI was used in the creation of this manuscript.
Publisher’s note
All claims expressed in this article are solely those of the authors and do not necessarily represent those of their affiliated organizations, or those of the publisher, the editors and the reviewers. Any product that may be evaluated in this article, or claim that may be made by its manufacturer, is not guaranteed or endorsed by the publisher.
References
Alcott, B., Giampietro, M., Mayumi, K., and Polimeni, J. (2012). The Jevons paradox and the myth of resource efficiency improvements. Routledge.
Bai, J., and Rub, H. (2024). Carbon emissions trading and environmental protection: international evidence. Manag. Sci. 70, 4593–4603. doi: 10.1287/mnsc.2023.03143
Belaïd, F., Bakaloglou, S., and Roubaud, D. (2018). Direct rebound effect of residential gas demand: empirical evidence from France. Energy Policy 115, 23–31. doi: 10.1016/j.enpol.2017.12.040
Beppler, R. C., Matisoff, D. C., and Oliver, M. E. (2023). Electricity consumption changes following solar adoption: testing for a solar rebound. Econ. Inq. 61, 58–81. doi: 10.1111/ecin.13031
Berner, A., Bruns, S., Moneta, A., and Stern, D. I. (2022). Do energy efficiency improvements reduce energy use? Empirical evidence on the economy-wide rebound effect in Europe and the United States. Energy Econ. 110:105939. doi: 10.1016/j.eneco.2022.105939
Brockway, P. E., Sorrell, S., Semieniuk, G., Heun, M. K., and Court, V. (2021). Energy efficiency and economy-wide rebound effects: a review of the evidence and its implications. Renew. Sustain. Energy Rev. 141:110781. doi: 10.1016/j.rser.2021.110781
Chetty, R., Looney, A., and Kroft, K. (2009). Salience and taxation: theory and evidence. Am. Econ. Rev. 99, 1145–1177. doi: 10.1257/aer.99.4.1145
Deng, G., and Newton, P. (2017). Assessing the impact of solar Pv on domestic electricity consumption: exploring the prospect of rebound effects. Energy Policy 110, 313–324. doi: 10.1016/j.enpol.2017.08.035
Du, K., Shao, S., and Yan, Z. (2021). Urban residential energy demand and rebound effect in China: a stochastic energy demand frontier approach. Energy J. 42, 175–194. doi: 10.5547/01956574.42.4.kdu
Fraija, A., Agbossou, K., Henao, N., Kelouwani, S., Fournier, M., and Hosseini, S. S. (2022). A discount-based time-of-use electricity pricing strategy for demand response with minimum information using reinforcement learning. IEEE Access 10, 54018–54028. doi: 10.1109/ACCESS.2022.3175839
Gu, Y., Jiang, C., Zhang, J., and Zou, B. (2021). Subways and road congestion. Am. Econ. J. Appl. Econ. 13, 83–115. doi: 10.1257/app.20190024
He, Q., Luan, X., Wang, J., Liu, Y., and Yang, S. (2024). Rooftop Pv development suitability and carbon benefits: an Anhui Province case study. Sustain. For. 16:5604. doi: 10.3390/su16135604
Hu, X., Zhang, X., Dong, L., Li, H., He, Z., and Chen, H. (2022). Carbon emission factors identification and measurement model construction for railway construction projects. Int. J. Environ. Res. Public Health 19:11379. doi: 10.3390/ijerph191811379
Huang, W., and Zhang, C. (2021). The power of social pensions: evidence from China’s new rural pension scheme. Am. Econ. J. Appl. Econ. 13, 179–205. doi: 10.1257/app.20170789
Kang, J., and Reiner, D. M. (2022). What is the effect of weather on household electricity consumption? Empirical evidence from Ireland. Energy Econ. 111:106023. doi: 10.1016/j.eneco.2022.106023
Khan, P. W., Kim, Y., Byun, Y.-C., and Lee, S.-J. (2021). Influencing factors evaluation of machine learning-based energy consumption prediction. Energies 14:7167. doi: 10.3390/en14217167
La Nauze, A. (2019). Power from the people: rooftop solar and a downward-sloping supply of electricity. J. Assoc. Environ. Resour. Econ. 6, 1135–1168. doi: 10.1086/705535
Lange, S., Kern, F., Peuckert, J., and Santarius, T. (2021). The Jevons paradox unravelled: a multi-level typology of rebound effects and mechanisms. Energy Res. Soc. Sci. 74:101982. doi: 10.1016/j.erss.2021.101982
Li, J., Guo, M., and Lo, K. (2019). Estimating housing vacancy rates in rural China using power consumption data. Sustain. For. 11:5722. doi: 10.3390/su11205722
Li, X., Lim, M. K., Ni, D., Zhong, B., Xiao, Z., and Hao, H. (2020). Sustainability or continuous damage: a behavior study of prosumers’ electricity consumption after installing household distributed energy resources. J. Clean. Prod. 264:121471. doi: 10.1016/j.jclepro.2020.121471
Li, Y., Yang, X., Du, E., Liu, Y., Zhang, S., Yang, C., et al. (2024). A review on carbon emission accounting approaches for the electricity power industry. Appl. Energy 359:122681. doi: 10.1016/j.apenergy.2024.122681
Liang, J., Qiu, Y. L., and Xing, B. (2022). Impacts of the co-adoption of electric vehicles and solar panel systems: empirical evidence of changes in electricity demand and consumer behaviors from household smart meter data. Energy Econ. 112:106170. doi: 10.1016/j.eneco.2022.106170
Meng, M., and Li, X. (2022). Evaluating the direct rebound effect of electricity consumption: an empirical analysis of the provincial level in China. Energy 239:122135. doi: 10.1016/j.energy.2021.122135
Miao, L., and Zhen, W. (2023). Estimating long-term and short-term Co2 rebound effects of China’s urban residential sector: evidence from a dynamic econometric approach. Econ. Res. 36, 1–23. doi: 10.1080/1331677X.2022.2142817
Qiu, Y., Kahn, M. E., and Xing, B. (2019). Quantifying the rebound effects of residential solar panel adoption. J. Environ. Econ. Manag. 96, 310–341. doi: 10.1016/j.jeem.2019.06.003
Qiu, S., Wang, K., Lin, B., and Lin, P. (2021). Economic analysis of residential solar photovoltaic systems in China. J. Clean. Prod. 282:125297. doi: 10.1016/j.jclepro.2020.125297
Qiu, Y. L., Xing, B., Patwardhan, A., Hultman, N., and Zhang, H. (2022). Heterogeneous changes in electricity consumption patterns of residential distributed solar consumers due to battery storage adoption. Iscience 25:104352. doi: 10.1016/j.isci.2022.104352
Reimers, H., Jacksohn, A., Appenfeller, D., Lasarov, W., Hüttel, A., Rehdanz, K., et al. (2021). Indirect rebound effects on the consumer level: a state-of-the-art literature review. Cleaner Respons. Consum. 3:100032. doi: 10.1016/j.clrc.2021.100032
Toroghi, S. H., and Oliver, M. E. (2019). Framework for estimation of the direct rebound effect for residential photovoltaic systems. Appl. Energy 251:113391. doi: 10.1016/j.apenergy.2019.113391
Wang, B., Yuan, Z., Liu, X., Sun, Y., Zhang, B., and Wang, Z. (2021). Electricity price and habits: which would affect household electricity consumption? Energ. Buildings 240:110888. doi: 10.1016/j.enbuild.2021.110888
Yang, S., Duan, Z., and Jiang, X. (2023). Spatial dynamics and influencing factors of carbon rebound effect in tourism transport: evidence from the Yangtze-river delta urban agglomeration. J. Environ. Manag. 344:118431. doi: 10.1016/j.jenvman.2023.118431
Yin, Y., Gulzar, F., Mamadiyarov, Z., Aizhan, A., Yadav, R. S., and Chen, C. (2024). An analysis of the rebound impact of energy consumption and the factors that influence it in China’s agricultural productivity. Energ. Strat. Rev. 56:101585. doi: 10.1016/j.esr.2024.101585
Zhang, Z., Chen, M., Zhong, T., Zhu, R., Qian, Z., Zhang, F., et al. (2023). Carbon mitigation potential afforded by rooftop photovoltaic in China. Nat. Commun. 14:2347. doi: 10.1038/s41467-023-38079-3
Zhang, W.-H., Chou, L.-C., and Chen, M. (2022). Consumer perception and use intention for household distributed photovoltaic systems. Sustain. Energy Technol. Assess. 51:101895. doi: 10.1016/j.seta.2021.101895
Zhang, H., Wu, K., Qiu, Y., Chan, G., Wang, S., Zhou, D., et al. (2020). Solar photovoltaic interventions have reduced rural poverty in China. Nat. Commun. 11:1969. doi: 10.1038/s41467-020-15826-4
Zhang, C., Yan, X., and Nie, J. (2023). Economic analysis of whole-county Pv projects in China considering environmental benefits. Sustain. Prod. Consum. 40, 516–531. doi: 10.1016/j.spc.2023.07.020
Zhang, L., Yu, J., Shi, Q., and Kong, Q. (2023). An evaluation of the economic benefits of rooftop distributed photovoltaic projects in the whole county in China. J. Clean. Prod. 432:139744. doi: 10.1016/j.jclepro.2023.139744
Keywords: rebound effect, electricity behavior, distributed photovoltaic, carbon emissions, difference-in-difference model
Citation: Qiangfei C, Meirong Y and Xintong C (2025) The impacts of roof distributed photovoltaic on rural residents’ carbon emission reduction and power consumption. Front. Sustain. Food Syst. 9:1581063. doi: 10.3389/fsufs.2025.1581063
Edited by:
Juan Lu, Nanjing Agricultural University, ChinaReviewed by:
Xin Huang, Beijing Normal University, ChinaJinxin Cui, Zhejiang Gongshang University, China
Copyright © 2025 Qiangfei, Meirong and Xintong. This is an open-access article distributed under the terms of the Creative Commons Attribution License (CC BY). The use, distribution or reproduction in other forums is permitted, provided the original author(s) and the copyright owner(s) are credited and that the original publication in this journal is cited, in accordance with accepted academic practice. No use, distribution or reproduction is permitted which does not comply with these terms.
*Correspondence: Yang Meirong, MTUxOTU5MDIzNTVAMTYzLmNvbQ==