 Raj Kumar Mishra1
 Mahesh Kumar Tiwari2*
 Ankit Dasgotra3,4Ankit Sharma5Akhil Gupta1Mukut Kumar Meena1Ravi Kumar1Pavan Kumar Sharma6
- 1Fire Research Laboratory, Department of Mechanical and Industrial Engineering, IIT Roorkee, Roorkee, Uttarakhand, India
- 2Centre for Excellence, Occupational Health, Safety, Fire and Environment (C-OHSFE), GD Goenka University, Gurgaon, Haryana, India
- 3Sustainability Cluster, University of Petroleum and Energy Studies (UPES), Dehradun, India
- 4Alstom Transport India Limited, Bangalore, India
- 5Johns Hopkins University, Baltimore, MD, United States
- 6Reactor Safety Division, Bhabha Atomic Research Center, Mumbai, India
Cable fires are one of the primary causes of fire hazards in nuclear power plants (NPPs) and warehouse buildings. This paper presents a study on the experimental and numerical analysis of cable failure with and without fire-resistant coating. The experiments were conducted in two sets under two different average heat fluxes, ranging from 15 (13–15) kW/
1 Introduction
The power cable’s burning characteristics are a critical parameter for fire hazard assessment. In the recent past, there have been some incidents in industrial and residential areas where cables have become a major concern because of their combustible nature. Fire is one of the major sources of energy in the form of heat, but it is also a significant safety concern (Keski-Rahkonen and Mangs, 2002). With the development of new technologies, the demand for electricity is continuously increasing, necessitating the use of power cables for its transmission. As the application increases, the chances of their failure also increase; sometimes, the failure may be in the form of a breakdown of the system, that is, when the cable stops functioning as required or works less efficiently. However, sometimes, due to fire, the temperature of the cable wire becomes so high such that it becomes a source of fire itself.
As cable insulation and sheathing are typically constructed of plastic, rubber, or other combustible materials, they are easily damaged under high-temperature circumstances (Lai, 2013). For example, the initial stage of the fire at Dalian’s oil depot on 16 July 2010 caused damage to electricity supply cables and distribution rooms. Therefore, owing to the interruption of the low-voltage power supply, it was not possible to electrically shut off any of the oil tank emergency shut-off valves. The manual operation of the electric valve was slow and dangerous, which caused great difficulties in firefighting (Zhang et al., 2010; Han, 2012). Therefore, in the case of fire, some key cables connected to the firefighting and safety equipment became the weak point of the emergency system. Therefore, it is of great significance to improve the fire resistance of such key cables (James, 1998; Zhu, 2008).
Only a few studies have investigated the fundamental combustion in real cable fires. For example, Fernandez-Pello et al. (1991) studied the piloted ignition time and the flame spread rate of several commercial cables under various external radiation conditions and showed the similarity between the pyrolysis temperature of cable insulation and the ignition temperature. Tewarson and Khan (1989) tested the upward flame spread over 35 commercial electrical cables with a copper or aluminum core and found that the metal core acted as a heat sink, slowing down the flame spread.
The external heat flux is one of the most important parameters for ignition (piloted or spontaneous). To better understand the ignition criteria, most works in the literature used a constant external heat flux, as reviewed by Torero (2016). However, in most real fire scenarios, materials are ignited under a transient external heat flux rather than a constant heat flux. In pre-flashover fires, as the fire size and intensity increase, materials are more likely to be heated and eventually ignite due to the increasing heat flux. Because of its complex nature, very few studies have investigated the ignition behavior under transient heat flux (Vermesi et al., 2016; Vermesi et al., 2017; Lizhong et al., 2007; Belcher et al., 2015). Vermesi et al. (2016) and Vermesi et al. (2017) studied the piloted and spontaneous ignition processes of plastic and wood under the transient external heat flux (parabolic time-dependent curves) and revealed that the traditional ignition criteria for constant heat flux might become inappropriate. To the best of our knowledge, there is no fundamental study on the spontaneous ignition of real cables yet.
Previous researchers have studied fire behavior and smoke characteristics in tunnels using both experimental and numerical methods. Siemon et al. (2019) analyzed the influence of cable tray arrangements on mass loss rate, heat release rate, and fire spread behaviors. Using FDS, Zhou et al. (2008) conducted a full-scale fire simulation in a T-shaped cable tunnel and summarized the change rules of smoke concentration, oxygen concentration, and longitudinal temperature. Kim et al. (2008) used FDS to simulate tunnel fire with forced, transient, and longitudinal ventilation flows. Oka et al. (2013) built a model to predict the peak temperature of the ceiling jet in the inclined tunnel. The effects of external heat flux and cable spacing on cable fire characteristics were also investigated. Martinka et al. (2019) investigated the fire risk of electrical cables by considering the influence of mutual spacing between the cables and the thermal conductivity of the material beneath them.
To reduce the flammability and suppression of fire on cable wire, various fire-retardant coatings have been studied by different researchers; for example, Courty and Garo (2017) performed experiments on the external heating of electric cables and investigated their auto-ignition in a furnace composed of a stainless steel cylinder that is heated using an electric coil. Ji et al. (2013) studied the failure time of PVC-insulated cable under an infrared radiation heating furnace based on a decrease in insulation resistance in both bare and coated power cables and concluded that as the thickness increases, failure time also increases. Saxena and Sharma (2002) performed experiments on three-and-a-half-core aluminum PVC-insulated cables, both bare and coated with fire-retardant paint (FRP), and concluded that as the thickness increases, the circuit failure time also increases. Various works have already been carried out in a similar manner.
The present work focuses on the ignition of power cables subjected to radiative heat flux under continuous electric load conditions. As the outer sheath is the main combustible component of the cable, studying its pyrolysis characteristics is an important aspect. Experiments are carried out at two heat flux levels and with five different fire-resistant coating thicknesses for each heat flux value. The burning time of PVC-insulated power cables was recorded under different coating thicknesses, and the variations in failure time of power cables were analyzed. The results of this paper can be further used to enhance fire safety during the installation of power cables in power plants. Due to the burning of the cable, nearby cables stop functioning and catch fire, creating an extremely hazardous fire environment.
2 Experimental methodolgy
2.1 Power cable
In the present work, a 1.1-kV, 4-core, XLPE-insulated, armored, PVC-sheathed cable with an aluminum conductor is used, as shown in Figure 1. The outer diameter of the cable is 26.2 mm, and its current rating is 70 A.
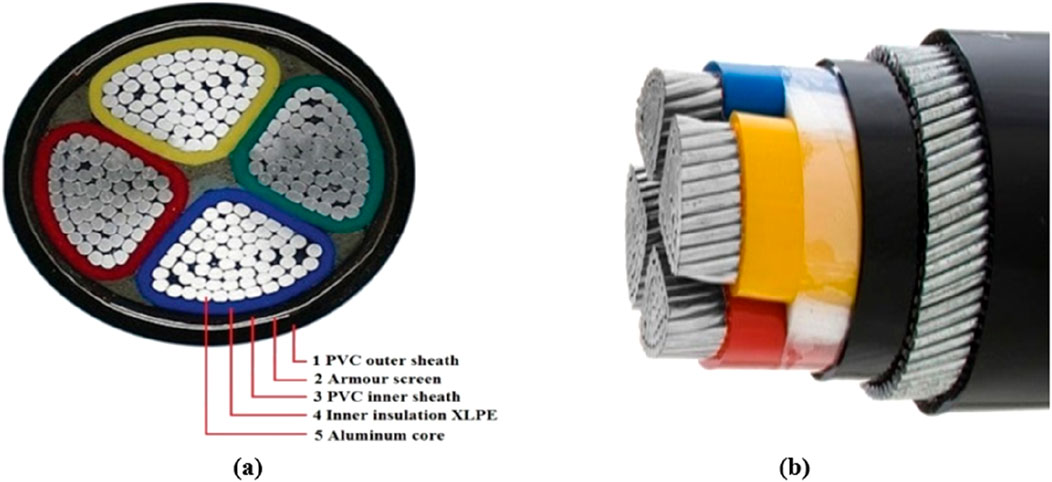
Figure 1. (a) Cross-sectional view of the power cable. (b) Different layers of the power cable used in an experiment.
A PVC-insulated XLPE (cross-linked polyethylene, which has a softening temperature of approximately 135°C–150°C, higher than that of PVC and PE) cable measuring 1.2 m in length, with bare ends (100 mm stripped from each end), is used, resulting in an actual experimental length of the specimen of 1,000 mm. Two holes are drilled into the cable—one reaching the insulation and the other extending to the core of the cable. K-type thermocouples (highly accurate and precise) are inserted into these holes to measure the temperatures of the insulation and core of the cable. Additionally, two more thermocouples are used: one for measuring the surface temperature and the other for the flame temperature.
2.2 Fire-retardant paint preparation
FRP works as a shield for the outer sheath under extreme fire conditions. A single coat of paint can achieve a thickness of 90–100 microns and dries within 20–24 h after application on the cable. It also reduces flame spread, resulting in a lower temperature increase along the length of the cable. For preparing the FRP solution, the flame-retardant agent (10 g) and fire-retardant paint (10 mL) were mixed very well, and some epoxy thinner was added to reduce the setting time of FRP and increase the ease of coating on the cable.
After the FRP solution dried, the sample was tested on a physical property measurement system (PPMS). The average thermal conductivity and specific heat capacity of the FRP solution were 1.633 W/m-K and 1,690.581 J/Kg-K, respectively. The density of the FRP solution sample, with a mass of 0.00149 g and a volume of 1.195 × 1 × 0.98 mm3, was 1,272.308 kg/m3. The coating thickness on the cable was measured using a CALTECH coating thickness gauge, which has a measurement range of 0–12000 µm and an accuracy of 1.5% or 2%.
2.3 Test set-up
The layout of the experimental set-up is shown in Figure 2. A step-up transformer and a variac, connected with copper wires, are used to supply the rated current to the cable. In the case of cable fire, the term failure is defined based on two primary criteria: first, electrical failure, i.e., when the short circuit occurs; second, mechanical failure, i.e., cable failure, when the cable surface starts smoldering/igniting and flaming. The present work considered both failure modes, electrical and mechanical failure.
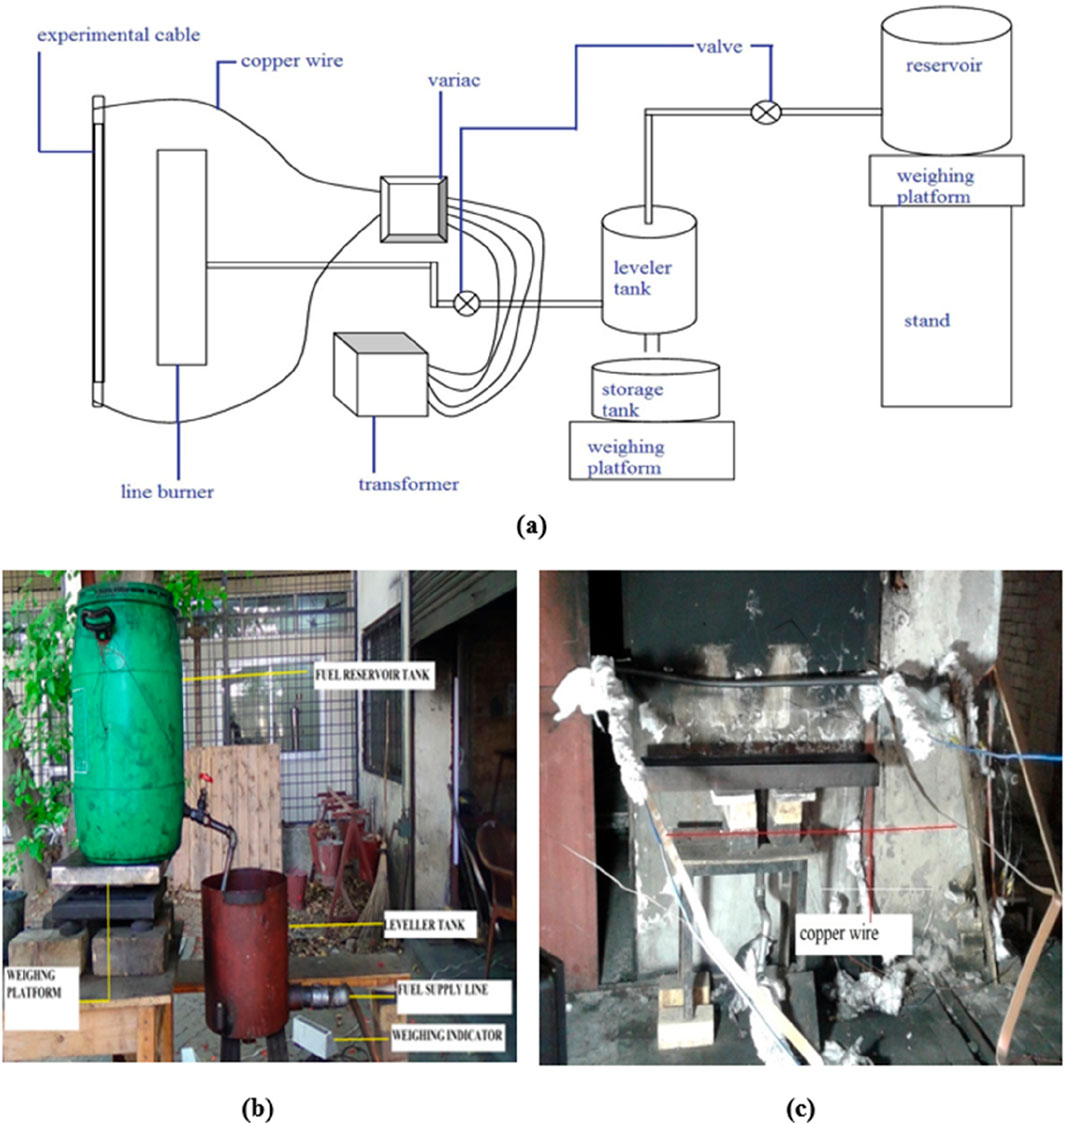
Figure 2. Schematic diagram of the experimental set-up. (a) Line diagram; (b) continuous fuel supply arrangement; and (c) cable failure test arrangement.
Different heat fluxes (15 kW/m2 and 20 kW/m2) can be achieved by varying the distance between the burner and the cable. For a heat flux of 15 kW/
The experiment is divided into three phases: the current phase, the pre-burning phase, and the burning phase. In the current phase, the current is supplied to the cable at its rated value and maintained for a duration of 20–25 min so that the temperature of the cable becomes steady. The cable temperature increases slowly, and after a certain time, it becomes steady.
The second phase comprises fuel ignition for the fire’s cable failure test. The fuel is supplied from the fuel reservoir tank. The fuel level in the pan (dimensions: 100
The last phase is the burning phase; in this phase, the cable starts to burn because of the temperature during the second phase. The cable itself becomes a source of ignition, which is considered one of the criteria for cable failure. Table 1 summaries the experiments with respect to coating thickness, average heat flux, and other fixed parameters.
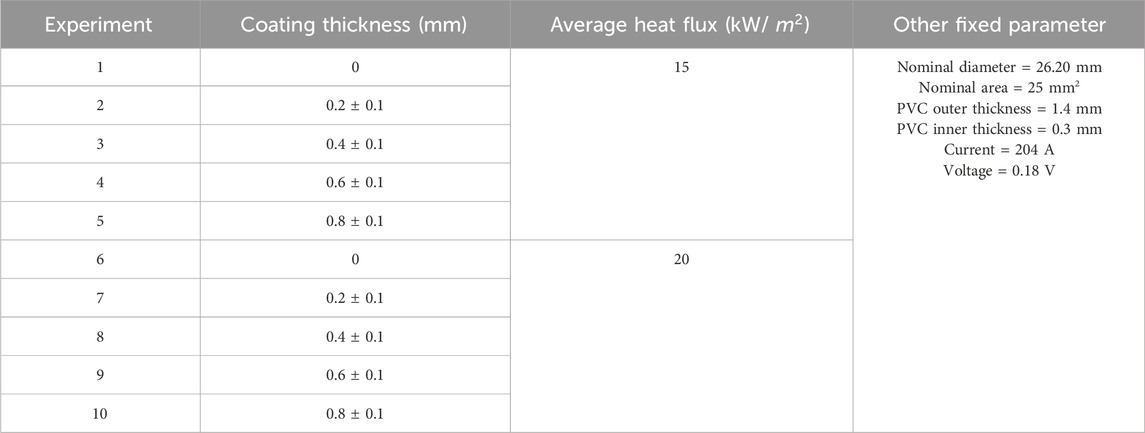
Table 1. Summary of the experiments.
3 Numerical methodology
3.1 Material and meshing geometry
The geometry of the cable cross-section is very complex due to the number of individual components. Electric cables have a 3D symmetrical cylindrical geometry. In this work, the cable has four cores, an outer jacket diameter of 26.2 mm, an outer sheath thickness of 1.4 mm, and a total length of 1,000 mm. It also features a concentric cylindrical armor with a thickness of 1 mm and a concentric cylindrical inner sheath, also 1-mm thick. The cylindrical conductors have a cross-sectional area of 16 mm2, i.e., corresponding to a radius of 2.225 mm, and concentric cylindrical insulation has a thickness of 0.74 mm. Cable 3D model and mesh geometry representation is shown in Figure 3.
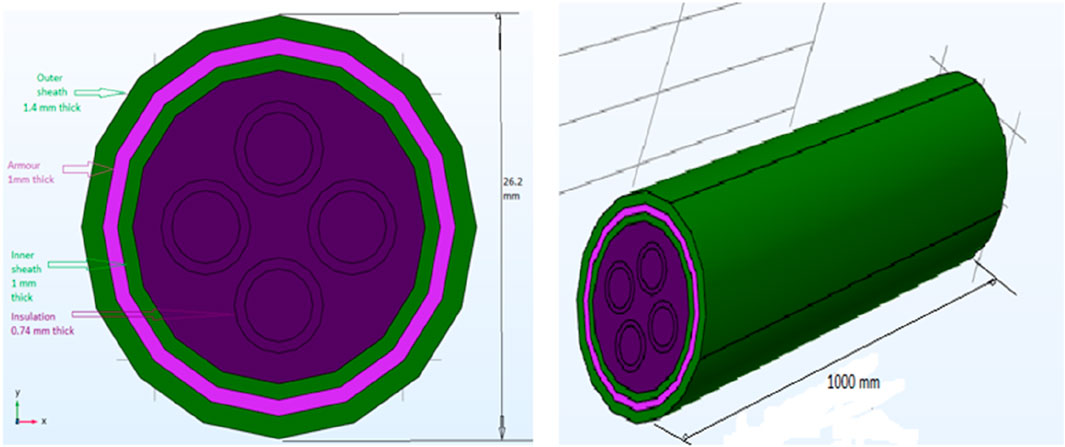
Figure 3. Cable model and mesh geometry.
The outer and inner sheath material considered is PVC with 40% plasticizer, and the material used for the core is aluminum. Moreover, galvanized steel (BS 460B) and high-density polyethylene (HDPE) were utilized for the armor and internal insulation, respectively. For COMSOL simulation, certain cable properties were referenced directly from the COMSOL software library to ensure accurate modeling. To maintain consistency between the simulation and experimental conditions, the materials used in the cable fire simulation were selected to match the specifications of those used in the physical experiments. This alignment was essential to ensure that the simulated behavior closely mirrored the real-world performance observed during testing. The physical properties of the FRP solution—thermal conductivity, density, and specific heat capacity—were determined through experimental testing and subsequently used in the COMSOL simulation. The average thermal conductivity and specific heat capacity were found to be 1.6332 W/m·K and 1,690.5815 J/kg·K, respectively. The density, calculated based on a sample mass of 0.00149 g and a volume of 1.195 × 1 × 0.98 mm3, was determined to be 1,272.3080 kg/m3.
Meshing involves dividing a given geometric structure into numerous smaller components known as cells. In COMSOL, the meshing strategy involved an unstructured mesh that allowed for greater flexibility in capturing the complexities of the geometry, with local refinement in regions of high-gradient variables to enhance accuracy. For this simulation, extremely fine free triangular cells were used to mesh the power cable geometry. The total number of mesh elements used in the cable model, consisting of various sizes and tetrahedral geometries, was approximately 1,063,432. This number varied depending on the thickness of the fire-retardant paint solution coating.
Using a large number of cells (i.e., a refined mesh) generally results in simulation outcomes that closely approximate real-world behavior. However, a significant increase in the number of cells also leads to longer computation times. Typically, extremely fine meshing is applied to small or critical geometry sections, while coarser meshing is used for larger or less critical areas to optimize performance. A mesh independence study was not conducted in this work as a refined mesh was consistently used throughout the simulation.
3.2 Governing equations and boundary conditions
In COMSOL Multiphysics, governing equations depend on the specific physics module being utilized as they are formulated to model a wide array of physical phenomena. Some of the common governing equations are as follows: (A) heat transfer: the governing equation is the heat conduction equation, described by Fourier’s law; (B) fluid dynamics: the Navier–Stokes equations govern fluid motion, describing how the velocity field of a fluid changes due to forces acting on it; (C) electrical currents: the governing equation for electrical currents in a conductive medium is described by Ohm’s law and the continuity equation; (D) structural mechanics: for solid mechanics, the governing equations are based on the equilibrium of forces, often expressed using the linear elasticity equations; and (E) chemical reaction engineering: the mass transport equations and reaction kinetics are used to model species transport and reactions, typically involving the diffusion equation. These equations are coupled in multiphysics scenarios, allowing COMSOL to simulate complex interactions between different physical phenomena.
Boundary conditions are assumed to accurately reflect the physical environment of the system; Dirichlet conditions were implemented to specify fixed temperatures at the inlets, and Neumann conditions were implemented for heat flux at the boundaries to simulate heat transfer effectively. A time-dependent solver was assumed with appropriate tolerance settings to ensure convergence, enabling us to model transient heat transfer phenomena accurately and extract meaningful results for further analysis.
In this numerical simulation, the “Heat Transfer in Solids” and “Electric Currents” physics interfaces were applied to the cable model. Based on the experimental set-up, a rated current of 210 A was supplied to the cable for 20–25 min to allow the wire temperature to reach a steady state. Although the current was continuously supplied, additional heat was applied to simulate fire conditions, and the thermal behavior of the cable was studied accordingly. During the experiments, heat fluxes of 15 kW/m2 and 20 kW/m2 were applied to the cables—with and without fire-retardant paint coatings, respectively. In the simulation, one end of the cable was set to ground (0 V) and the other to a terminal, allowing the voltage potential distribution along the cable to be observed. To replicate the experimental conditions, a steady-state current supply was applied throughout the simulation, simulating continuous operation until the cable’s complete thermal degradation.
4 Result and Discussion
4.1 Experimental results
The experimental set-up is arranged as described in Section 2.3, and the cable is attached to the copper bus bar. A series of 10 experiments were performed under heat fluxes of 15 kW/
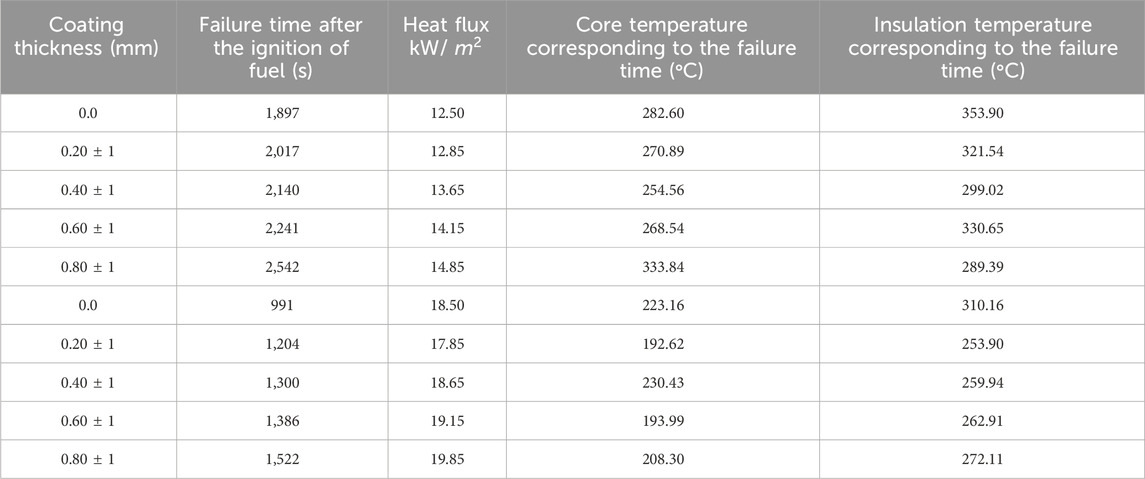
Table 2. Various experimental results.
It can be observed from the table that for a given value of heat flux, with an increase in the thickness of the coating, the ignition time is continuously increasing, which has also been demonstrated by Ji et al. (2013). It can also be observed from the temperature profile, as given below, that there is a sudden increase in the temperature profile. An increase in the ignition time of the cable is because of the flame-retardant property of the paint. It suppresses the intense heat flux directly subjected to the cable and has a flame-retardant property that restricts the fire from spreading over the surface of the cable.
According to Equations 1, 2, the cable failure time is delayed as a function of coating thickness, providing an empirical relationship between failure time and dry coating thickness. It was found that the time to failure is well correlated with the cable’s thermal mass per unit length.
The given correlation is developed using the least square method, a mathematical approach used to find the best-fitting curve through a set of obtained data points. Regression analysis widely uses this method to develop correlations between two or more variables. Using measured experimental values for the cable failure time, regression analysis is used to find the best curve for the obtained experimental data. In the present correlation,
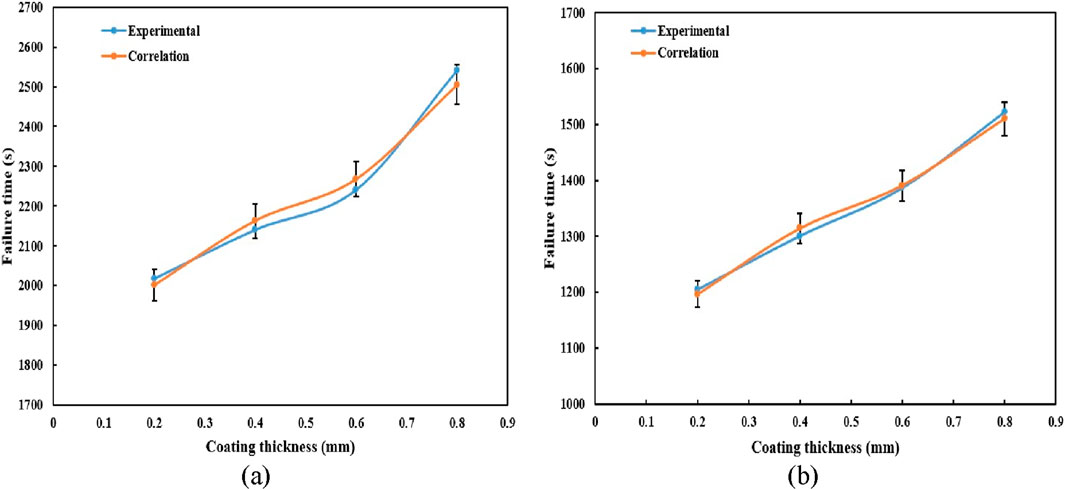
Figure 4. Comparison of experiments with correlation (a) 15 kW/
It can be observed from Figure 5 that the ignition time of the cable increases almost linearly with the coating thickness, and it is higher for the heat flux of 15 kW/
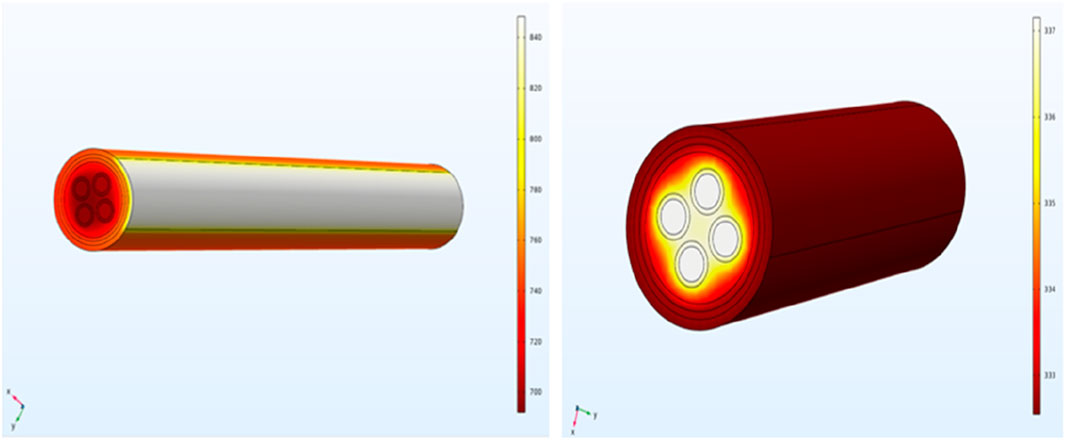
Figure 5. Simulation of the cable during different stages under 15 kW/
Thus, it can be observed that ignition time is highly dependent on the core and insulation temperatures of the cable. It almost remains constant within the range of ±20°C of a mean temperature for a given value of heat flux, irrespective of the coating thickness. As the value of heat flux increases, the ignition temperature of the heating cable decreases because of the thermal impact of the heat flux, as mentioned earlier.
4.2 Numerical investigation for heat flux without coating
In this case, the cable has no fire-retardant coating attached to it. In the experimental set-up, a gap is maintained between the cable and heat flux sensor, so the measured heat flux value is less than 15 kW/
Four different stages of timing are considered in this numerical investigation, corresponding to those in the experimental study. The first stage is the time required to reach a steady-state condition. The second stage is the ignition time of the wire, i.e., the failure time after the ignition of the fuel. Cable failure occurs due to a short circuit caused by insulation damage, which results from exposure to external fire from the fuel-line burner in the experiment. The third stage begins after the short circuit, when internal fire develops within the cable; this leads to rapid temperature increase across the different cable layers until the cable is completely burned—referred to as the complete burning stage. The final stage is the cooling phase, during which the cable temperature gradually decreases after combustion.
The average heat flux has been taken as 8 kW/
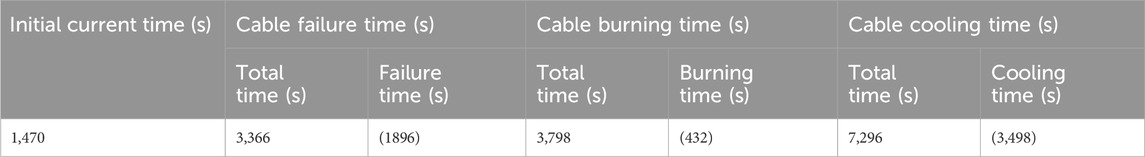
Table 3. Timing of different stages of simulation-1 in seconds.
Heat flux is applied to only one-fourth part of the cable’s outer sheath according to the experiment set-up because, during the experiment, the fire burner is placed below the cable at some distance; thus, the cable is affected by one-fourth part of the cable, and due to this distance, the heat flux value will be less than 15 kW/
In the first stage, a constant rated current of 210 A is supplied to the cable for 1,470 s, i.e., until a steady-state condition is reached. Then, in the second stage, a constant rated current of 210 A is supplied, and simultaneously, an average heat flux is also applied to the cable model for 1896 s; due to the high current supply and continuous heat flux, there is a short circuit in the cable, i.e., ignition of the cable. Due to this short circuit, there is a sudden increase in the temperature of the cable model. This stage is referred to as study-3 of the cable model, which runs for a short time (432 s), i.e., complete cable burning. After these three stages, the final stage of the cable, i.e., the cooling stage, begins; during this stage, initially, there is a fast rate of cooling of the cable, but over time, the rate of cooling decreases, and the time taken to achieve the initial stage temperature of the cable is almost 3,498 s. In the cooling process of the cable, only the convection cooling effect is considered; the radiation effect is neglected.
The simulated temperature profiles of different layers of cable from the initial to the final stage are provided in Section 4.3.
4.3 Comparison of experimental and numerical results
4.3.1 Results validation for a heat flux of 15 kW/m2
Figures 6a–e show the time–temperature curve of the cable surfaces at different depths. It can be observed from the figure that the peak temperatures are similar during heating at certain time. However, inner insulation temperature is slightly higher than core and outer surface temperatures.
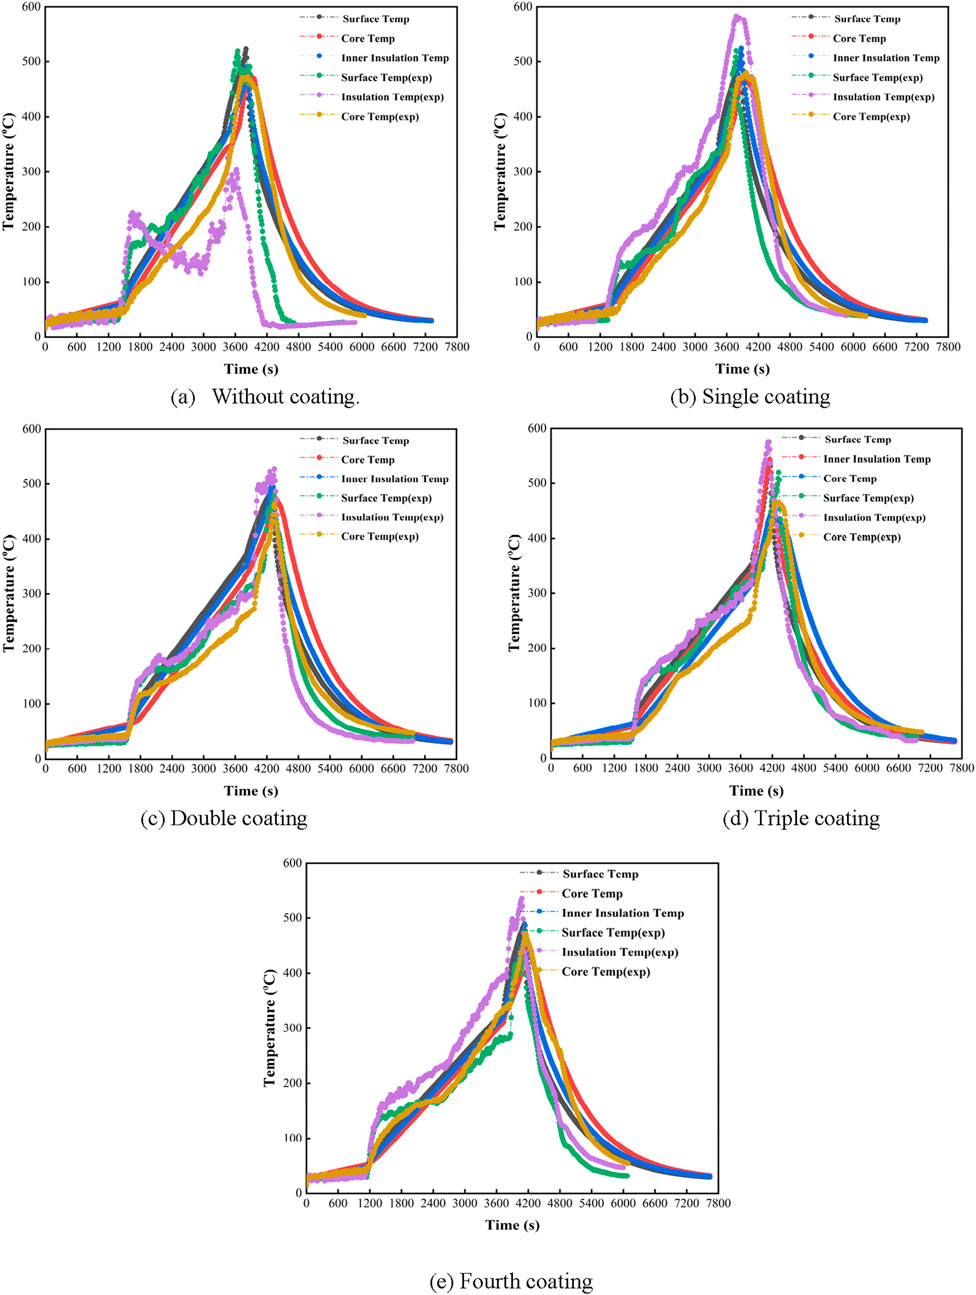
Figure 6. Combined numerical and experimental result of the cable for a heat flux of 15 kW/
4.3.2 Validation of results for a heat flux of 20 kW/m2
Figure 7a-e show the combined numerical and experimental result of cable for heat flux. As mentioned earlier, the applied heat flux was transient, which increased with time close to a parabolic function. Once heated, the outer PVC sheath swelled and shrank in multiple stages. Before the ignition, the swelling behavior was found to follow the same trends as the mass loss rate. Table 4 summaries the numerical results concerning the coating thickness, failure time after fuel ignition, heat flux, and core and insulation temperatures corresponding to the failure time.
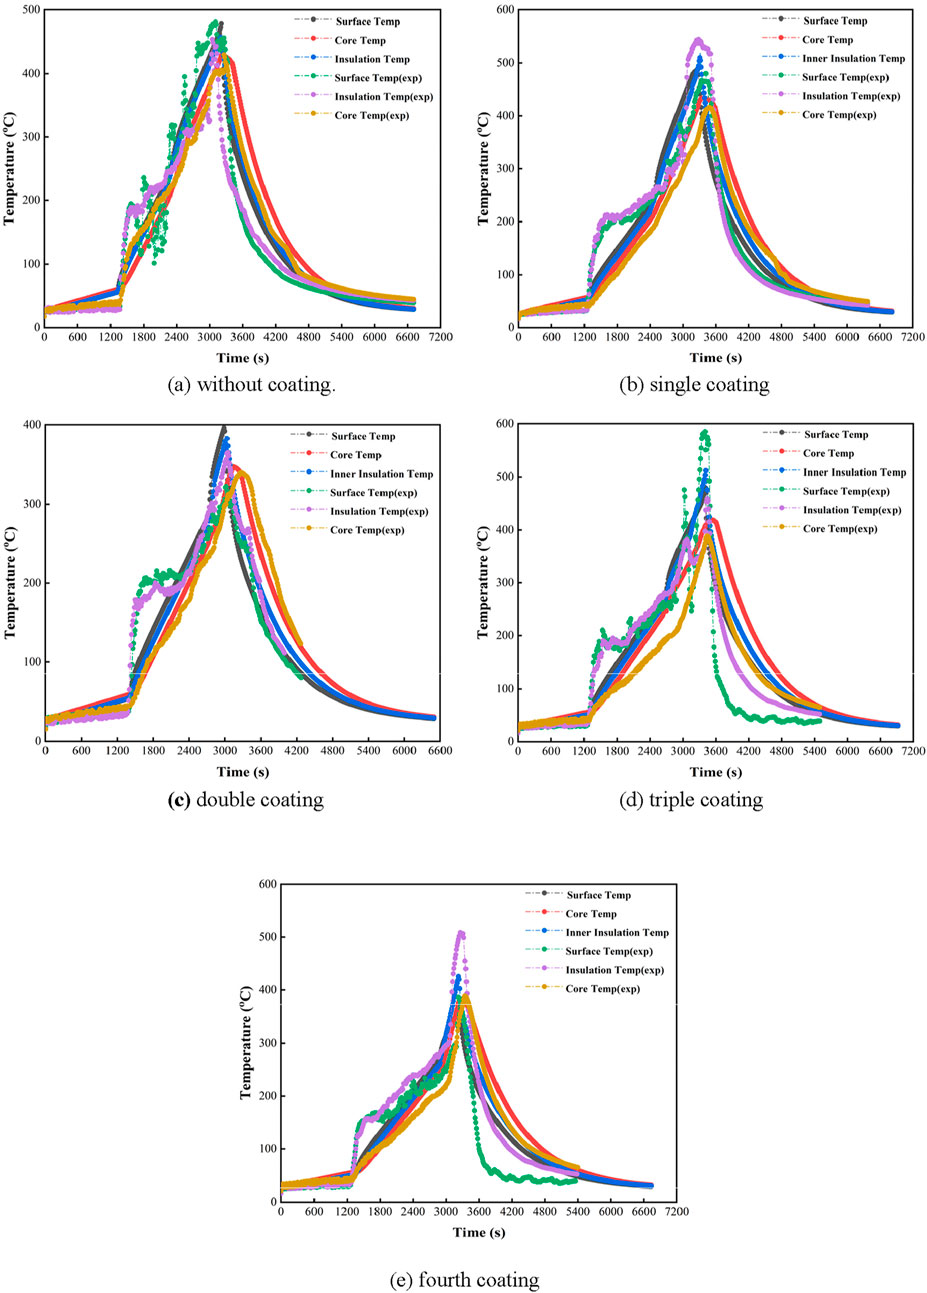
Figure 7. Combined numerical and experimental result of the cable for a heat flux of 20 kW/
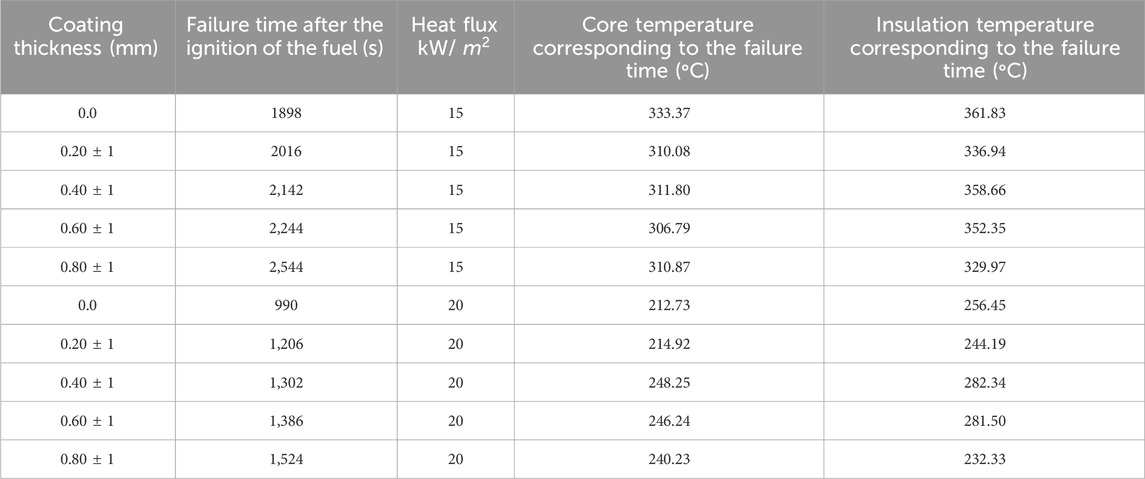
Table 4. Various numerical results.
Absolute percentage deviation is calculated for the core of the cable for both cases of the heat flux, i.e. 15 kW/
4.4 Temperature reduction ratio
The temperature reduction ratio (TRR) is a ratio of the difference between the steady-state temperature of the cable surface without coating and the paint-coated outer cable surface temperature divided by the steady-state temperature of the cable surface without coating, i.e., the bare temperature of the cable at the failure time of the cable.
From Table 5, one can notice that the critical thickness corresponding to the heat flux of 15 kW/
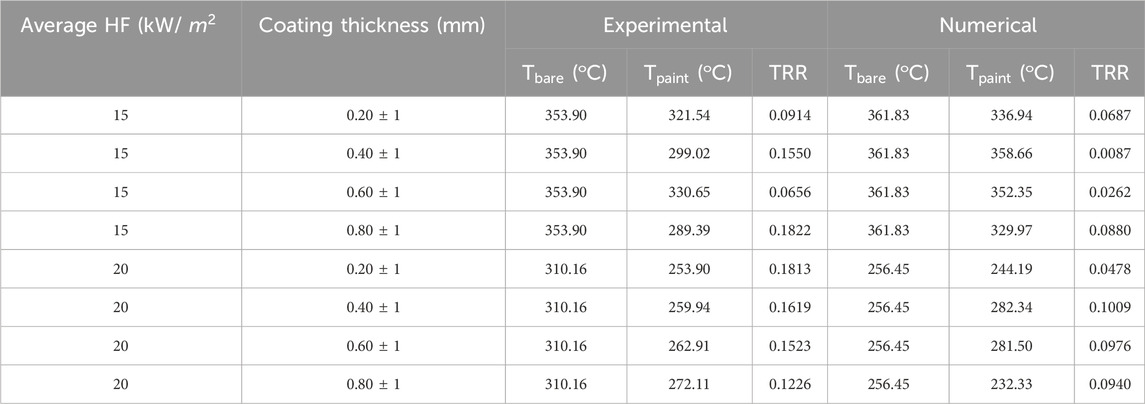
Table 5. TRR value for experimental and numerical data.
Similarly, for a heat flux of 20 kW/
5 Conclusion
In this paper, a comprehensive analysis was conducted on a series of 10 experiments, each designed to explore the impact of fire-resistant coating thickness on the performance of power cables under varying heat flux conditions. This is a critical consideration in industries where fire safety is paramount, such as in power cable manufacturing, electrical infrastructure, and fire safety research. The power cable’s core temperature and outer sheath temperature were measured at the time of cable failure. Therefore, the following key points were noted after the successful completion of this study:
• The ignition time of the cable is greater for coated cables than for bare wires and increases almost linearly with respect to coating thickness.
• The ignition time of the cable is highly dependent on the core and insulation temperatures of the wire for a given heat flux. It remains relatively constant within a range of ±20°C. The ignition time has a higher value at lower heat flux levels and continuously decreases as the heat flux increases due to the thermal impact of heat.
• Fire-retardant paint also changes the chemical properties of the cable. Previously, after the ignition of the cable, the insulation would melt and drip off; however, after the application of fire-retardant paint, its properties change, becoming hard instead of melting. As a result, it either adheres to the cable in the form of solid particles or falls off in layers, making it less hazardous than bare wire.
• Correlation is fitted to a narrow range for the two experimental heat flux values, i.e., 15 kW/
The results can be useful for professionals working with power cables in real-world applications; understanding the relationship between coating thickness and fire resistance can help inform material specification decisions for cable installations in high-risk areas. Moreover, the study provides benchmark data that can support future research on fire-resistant materials, guiding the development of more effective protective coatings.
Data availability statement
The raw data supporting the conclusions of this article will be made available by the authors, without undue reservation.
Author contributions
RM: Conceptualization, Methodology, Project administration, Writing – original draft. MT: Writing – original draft, Writing – review and editing. AD: Data curation, Software, Validation, Writing – review and editing. AS: Conceptualization, Data curation, Formal Analysis, Investigation, Writing – review and editing. AG: Methodology, Project administration, Supervision, Visualization, Writing – original draft. MM: Data curation, Formal Analysis, Software, Validation, Writing – review and editing. RK: Funding acquisition, Project administration, Resources, Supervision, Writing – review and editing. PS: Conceptualization, Methodology, Supervision, Validation, Writing – review and editing.
Funding
The author(s) declare that financial support was received for the research and/or publication of this article. The work is supported by the Bhabha Atomic Research Center (BARC), Mumbai, India, under grant number DAE-973-MID to the Department of Mechanical and Industrial Engineering, IIT Roorkee, India.
Conflict of interest
Author AD was employed by Alstom Transport India Limited.
The remaining authors declare that the research was conducted in the absence of any commercial or financial relationships that could be construed as a potential conflict of interest.
Generative AI statement
The author(s) declare that no Generative AI was used in the creation of this manuscript.
Publisher’s note
All claims expressed in this article are solely those of the authors and do not necessarily represent those of their affiliated organizations, or those of the publisher, the editors and the reviewers. Any product that may be evaluated in this article, or claim that may be made by its manufacturer, is not guaranteed or endorsed by the publisher.
References
Belcher, C. M., Hadden, R. M., Rein, G., Morgan, J. V., Artemieva, N., and Goldin, T. (2015). An experimental assessment of the ignition of forest fuels by the thermal pulse generated by the Cretaceous–Palaeogene impact at chicxulub. J. Geol. Soc. 172, 175–185. doi:10.1144/jgs2014-082
Courty, L., and Garo, J. P. (2017). External heating of electrical cables and auto-ignition investigation. J. Hazard Mater 321, 528–536. doi:10.1016/j.jhazmat.2016.09.042
Fernandez-Pello, A., Hasegawa, H. K., Staggs, K., Lipska-quinn, A. E., and Alvares, N. J. (1991). A study of the fire performance of electrical cables. IAFSS, 237–247. Available online at: https://www.taylorfrancis.com/chapters/edit/10.4324/9780203973493-19/study-fire-performance-electrical-cables-fernandez%E2%80%93pello-hasegawa-staggs-lipska-quinn-alvares.
Han, J. (2012). Lessons from dalian “7.16” fire explosion accident and preventive measures. Petrochem. Saf. Environ. Prot. Technol. 28, 1–6.
James, L. M. (1998). Fire protection of critical circuits-a life and property preserver. IEEE Trans. Ind. Appl. 34, 689–696. doi:10.1109/28.703959
Ji, W., Zhong-Jun, S., and Chen, Z. (2013). The protective effect of a fire-retardant coating on the insulation failure of PVC cable. Eng. Fail. Anal. 34, 1–9. doi:10.1016/j.engfailanal.2013.07.010
Keski-Rahkonen, O., and Mangs, J. (2002). Electrical ignition sources in nuclear power plants: statistical, modelling and experimental studies. Nucl. Eng. Des. 213, 209–221. doi:10.1016/s0029-5493(01)00510-6
Kim, E., Woycheese, J. P., and Dembsey, N. A. (2008). Fire dynamics simulator simulation for tunnel fire scenarios with forced, transient, longitudinal ventilation flows. Fire Technol. 44, 137–166.
Lai, S. H. (2013). Current situation and application of cable fire retardant coating. Fire Tech. Prod. Inf. 06, 48–49.
Lizhong, Y., Zaifu, G., Yupeng, Z., and Weicheng, F. (2007). The influence of different external heating ways on pyrolysis and spontaneous ignition of some woods. J. Anal. Appl. Pyrolysis 78, 40–45. doi:10.1016/j.jaap.2006.04.001
Martinka, J., Rantuch, P., Sulova, J., and Martinka, F. (2019). Assessing the fire risk of electrical cables using a cone calorimeter. J. Therm. Anal. Calorimet 135 (6), 3069–3083. doi:10.1007/s10973-018-7556-5
Oka, Y., Kakae, N., Imazeki, O., and Inagaki, K. (2013). Temperature property of ceiling jet in an inclined tunnel. Procedia Eng. 62, 234–241. doi:10.1016/j.proeng.2013.08.060
Saxena, N. K., and Sharma, S. K. (2002). Fire retardant smoke suppressant coating for PVC sheathed electric cable. J. Sci. and Industrial Res. 61, 805–809.
Siemon, M., Riese, O., Forell, B., Kronung, D., and Klein-Hessling, W. (2019). Experimental and numerical analysis of the influence of cable tray arrangements on the resulting mass loss rate and fire spreading. Fire Mater. 43, 497–513. doi:10.1002/fam.2689
Tewarson, A., and Khan, M. M. (1989). Flame propagation for polymers in cylindrical configuration and vertical orientation. Symp. Int. Combust. 22, 1231–1240. doi:10.1016/S0082-0784(89)80134-1
Torero, J. (2016). “Flaming ignition of solid fuels,” in SFPE handbook of fire protection engineering. M. J. Hurley, D. T. Gottuk, J. R. Hall, K. Harada, and E. D. Kuligowski (Springer), 633–661. doi:10.1007/978-1-4939-2565-0
Vermesi, I., DiDomizio, M. J., Richter, F., Weckman, E. J., and Rein, G. (2017). Pyrolysis and spontaneous ignition of wood under transient irradiation: experiments and a-priori predictions. Fire Saf. J. 91, 218–225. doi:10.1016/j.firesaf.2017.03.081
Vermesi, I., Roenner, N., Pironi, P., Hadden, R. M., and Rein, G. (2016). Pyrolysis and ignition of a polymer by transient irradiation. Combust. Flame 163, 31–41. doi:10.1016/j.combustflame.2015.08.006
Zhang, X. Q., Ma, H., and Zhi, H. Q. (2010). Thought about dalian “7.16” fire—Discussion about problem of “Code for Design of Oil Depot” and modification suggestion. Fire Sci. Technol. 29, 783–785.
Zhou, B., Jiang, J., and Bai, Y. (2008). Cable tunnel fire research based fire dynamics simulator. China Public Secur. Acad. Ed. 7, 502–505.
Keywords: power cable, fire-retardant coating, heat flux, critical thermal stress, temperature gradient
Citation: Mishra RK, Tiwari MK, Dasgotra A, Sharma A, Gupta A, Meena MK, Kumar R and Sharma PK (2025) A comparative study of cable fire dynamics: bench-scale experiments and numerical simulations with and without fire-retardant coating. Front. Therm. Eng. 5:1560746. doi: 10.3389/fther.2025.1560746
Received: 14 January 2025; Accepted: 14 July 2025;
Published: 13 August 2025.
Edited by:
Wei Wu, City University of Hong Kong, Hong Kong, SAR ChinaReviewed by:
Hakeem Niyas, Rajiv Gandhi Institute of Petroleum Technology, IndiaGiuseppe Rotondo, University of Naples Federico II, Italy
Copyright © 2025 Mishra, Tiwari, Dasgotra, Sharma, Gupta, Meena, Kumar and Sharma. This is an open-access article distributed under the terms of the Creative Commons Attribution License (CC BY). The use, distribution or reproduction in other forums is permitted, provided the original author(s) and the copyright owner(s) are credited and that the original publication in this journal is cited, in accordance with accepted academic practice. No use, distribution or reproduction is permitted which does not comply with these terms.
*Correspondence: Mahesh Kumar Tiwari, bWFoZXNoLnRpd2FyaTAzNUBnbWFpbC5jb20=