 Mohamed A. A. Mahmoud
 Thorsten Tybussek4
 Helene M. Loos
 Maria Wagenstaller
 Andrea Buettner
- 1Chair of Aroma and Smell Research, Department of Chemistry and Pharmacy, Emil Fischer Center, Friedrich-Alexander-Universität Erlangen-Nürnberg, Erlangen, Germany
- 2Sensory Analytics Department, Fraunhofer Institute for Process Engineering and Packaging IVV, Freising, Germany
- 3Agricultural Biochemistry Department, Faculty of Agriculture, Ain Shams University, Cairo, Egypt
- 4Department of Retention of Food Quality, Fraunhofer Institute for Process Engineering and Packaging IVV, Freising, Germany
Although the microbiota is considered to be the primary source of off-flavors in farmed fish, there is a lack of information about the possible contribution of feeds to fish malodor. For this reason, the current study was designed to perform comprehensive sensory and chemo-analytical characterization of fish feed constituents that can impact the quality of farmed fish, and to determine whether feeds cause malodor accumulation in fish. To this aim, odorants in four commercial fish feeds were extracted using solvent assisted flavor evaporation (SAFE) and characterized by comparative aroma extract dilution analysis (cAEDA) and multi-dimensional gas chromatography-mass spectrometry/olfactometry (MD-GC-MS/O). The odorants in the fish feed samples were correlated with their respective sensory and fatty acid profiles. The cAEDA studies revealed the presence of 81 odorants of which 55 compounds were common to all the samples. Most of these odorants are identified here for the first time in fish feeds, and include skatole, indole, (E,Z,Z)-2,4,7-tridecatrienal, 4-ethyloctanoic acid, and cresols. Additionally, geosmin and 3-isopropyl-2-methoxypyrazine, known for their contribution to fish taint, and other cyanobacterial by-products, dimethyldisulfide and dimethyltrisulfide, were identified in feed samples. The results suggest that fish feed may contribute to fish malodor. Most of these off-flavors were linked to lipid source (fish oil or plant/lard alternatives), unsaturated fatty acids contents, and protein type (plant-based or fishmeal-based sources) in the feed.
Introduction
In recent years aquaculture has been growing at an annual rate of 3.2%. This is mostly attributed to developments in fish feed manufacture, namely the biggest cost factor, and the use of more productive aquaculture systems (FAO, 2016).
The main aims of fish feed manufacturers are: (I) to lower production costs, (II) to increase feed conversion rates by the fish, and (III) to decrease feed waste (Olsen, 2011). The attainment of these aims, however, does not necessarily guarantee that fish with high palatability are produced.
Lipids and proteins are the major ingredients of fish feed (Olsen, 2011; Shen et al., 2018). Odor-active compounds are known to originate from these constituents during the fish feed manufacturing process. These compounds might affect the final quality and consumer acceptability of fish. For example, lipid sources rich in polyunsaturated fatty acids (PUFA) can result in elevated levels of PUFA-derived volatile aldehydes during feed processing that may result in off-flavor formation in fish fed on these feeds (Turchini et al., 2007). Additionally, several pyrazines, having a wide range of odors from roasted-like to distinctive earthy, can arise due to the thermal treatment during feed pellet formation (Mjøs and Solvang, 2006; Mahmoud and Buettner, 2017).
In many cases, the raw material itself already contains elevated levels of off-flavors even before undergoing the feed processing procedure. For example, using pig lard to entirely or partially replace fish oil in feed formulae can lead to accumulation of fecal-like and sweat-like smelling compounds skatole and androstenone in fish after feed consumption (Zhou et al., 2015; Mahmoud and Buettner, 2016). Moreover, compounds with blood-like and metallic odors are increased by using blood as a raw material for feed production (Aladetohun and Sogbesan, 2013; Nilsson et al., 2014). All this evidence means that fish feeds must be considered as potential sources of malodors in fish. Indeed, odorants originating from the feed can directly accumulate in fish after consumption (Howgate, 2004). On the other hand, odorants from unconsumed feed can disperse in the water and later accumulate in fish via respiration or through the skin, potentially even after further modification via reactions taking place in the aqueous medium (Howgate, 2004; Podduturi et al., 2017).
The volatile composition of fish feeds has been investigated in several studies. However, feeds have only been discussed as a potential source of off-odors in a few reports (Turchini et al., 2004; Giogios et al., 2009; Grigorakis et al., 2009; Alexi et al., 2016; Podduturi et al., 2017). None of these studies used methods that distinguish between odor-active and odorless compounds such as gas chromatography-olfactometry (GC–O). Furthermore, they did not correlate the odor contents with the sensory profiles of the feeds. However, Podduturi et al. (2017) performed a study on fish feeds and suspected that terpenes from fish feed might cause malodors in cultured fish. In their experiment, they tentatively identified and semi-quantified terpenes in fish meat and compared the results with those from the relevant water and feeds using dynamic headspace gas chromatography-mass spectrometry (DHS–GC–MS). Whenever the concentration of an identified terpene was above its published odor threshold it was considered to cause fish malodors. The authors confirmed that fish feeds were the primary source of terpenes in fish meat. However, they stated that their work was incomplete, as they relied on published odor threshold data and most of the identified terpenes had no recorded threshold values in the literature. This limitation can easily be overcome by using odor intensity measuring methods such as aroma extract dilution analysis (AEDA) followed by quantification using stable isotope dilution analysis (SIDA) and aroma reconstitution experiments (Buettner and Schieberle, 2001; Grosch, 2001; Mahmoud and Buettner, 2017).
Our previous studies reported the aquaculture water odor composition and the potential link between the quality of the water and the respective fish aroma (Mahmoud and Buettner, 2016, 2017). A series of odorants were reported for the first time in cultured fish including, amongst others, 3-methylindole (skatole; odor quality: fecal), 5α-androst-16-en-3-one (androstenone; odor quality: sweat-like), 4-ethyloctanoic acid (odor quality: goat-like), and rotundone (odor quality: black pepper). These odorants were identified using established analytical methods, namely one- and two-dimensional gas chromatography-mass spectrometry/olfactometry (1D- and 2D-HRGC-MS/O) and sensory analysis. Several suggestions were put forward to explain the sources of these compounds. However, further studies are required to resolve the origins and formation or accumulation pathways of such potent odorants in aquaculture. Only then targeted avoidance strategies can be elaborated to reduce the accumulation of malodors in fish, hence to improve its sensory quality.
One step in this direction is to study the correlation between the lipid and fatty acid contents of different fish feeds and their aroma profiles and odorant compositions to determine whether they cause malodor accumulation. Accordingly, the current study aimed to perform comprehensive sensory and chemo-analytical characterization of active constituents that can impact fish quality in aquaculture.
Materials and Methods
Chemicals
Reference compounds and suppliers were as follows: dichloromethane (Merck, Darmstadt, Germany), 3-methylbutanoic acid ≥ 99%, dimethyl trisulfide (DMTS) ≥ 98%, 2-ethyl-3,5-dimethylpyrazine ≥ 95%, 2-ethyl-3,6-dimethylpyrazine ≥ 95%, 2,3,5-trimethylpyrazine ≥ 99%, hexanal ≥ 98%, 1-octen-3-one ≥ 50%, octanal ≥ 99%, 3-hydroxy-4,5-dimethyl-2(5H)-furanone (sotolone) ≥ 97 %, (E)-2-nonenal ≥ 97%, 3-isobutyl-2-methoxypyrazine ≥ 97%, (Z)-2-nonenal ≥ 95%, 2-methylisoborneol (MIB) ≥ 95%, 4-ethyloctanoic acid ≥ 98%, 3-methylindole (skatole) ≥ 98%, γ-decalactone ≥ 98%, γ-nonalactone ≥ 98%, β-ionone ≥97%, 5α-androst-16-en-3-one (androstenone), geosmin ≥ 98%, decanoic acid ≥ 98%, hexanoic acid ≥ 99.5%, decanal ≥ 92%, nonanoic acid ≥ 97%, (E,E)-2,4-decadienal ≥ 85%, 1,2-benzopyranone (coumarin) ≥ 99%, dodecanoic acid ≥ 98%, hexadecan-1-ol ≥ 99, hexadecanoic acid 99%, hexadecanoic acid ethyl ester >99%, 2-methylhexanoic acid ≥ 99%, (E,E)-2,4-decadienal ≥ 85%, 8-heptadecene ≥ 96.0%, hexadecanoic acid ethyl ester >99%, caryophyllene 80%, 2-phenoxyethanol 99%, phenylacetic acid 99%, α-terpineol 96%, (E,Z)-2,6-nonadienal 95%, (E,E)-2,6-nonadienal 95%, γ-terpinene 97%, D-limonene 97%, 3-(methylthio)-propanal (methional) 96%, heptanal >92%, 3-isopropyl-2-methoxypyrazine 97% (IPMP), (Z)-4-heptenal 98% (Aldrich, Steinheim, Germany), butane-2,3-dione ≥ 99%, nonanal ≥ 95%, butanoic acid ≥ 99.5%, indole 98.5%, 2-ethylhexan-1-ol >99%, 1-octen-3-ol 98%, pentanoic acid 99%, dimethyl disulfide (DMDS) ≥ 98% (Fluka, Steinheim, Germany), (Z)-3-hexenal ≥ 50%, γ-dodecalactone ≥ 97%, 4-ethylvanillin 88%, (SAFC, Steinheim, Germany), 4-hydroxy-3-methoxybenzaldehyde (vanillin) ≥ 99% (ABCR, Karlsruhe, Germany), (E)-4,5-epoxy-(E)-2-decenal ≥ 97%, γ-(Z)-6-dodecenolactone, (Z)-1,5-octadien-3-one 99% (aromaLAB AG, Munich, Germany), (E,Z,Z)-2,4,7-tridecatrienal (kindly provided by Nestle, Switzerland), rotundone (kindly provided by Symrise, Germany).
Samples
Four commercial fish feeds (coded by with us with the labeled S-1, S-2, S-3, and S-4) were provided to us by local aquaculture farmers and were chosen because they are the most commonly used feeds for salmonid fish not only in Bavaria State, Germany, but also worldwide. One more selection criterion was that all four feeds are produced using extrusion technology. They were directly taken from sealed packages. The samples were directly transported to our institute and stored in a well-ventilated room at 21°C. The pellets were powdered in a lab scale grinder prior to further analysis, except for the sensory test where samples were investigated as a whole.
Sensory Analysis
Sensory analyses were done in a well-lit and ventilated sensory room. The tests were carried out at room temperature. Samples were coded with a random three-digit number before presenting them in covered glass vessels. 13 trained panelists (10 females, and 3 males, mean age: 31 years, range: 24 to 55 years), with no known illness at the time of the experiment, participated in the sensory sessions. They were recruited from the Fraunhofer IVV sensory expert panel (Freising, Germany). All panelists were experienced in GC-O analysis.
The assessment was done in one session consisting of three parts. In the first part, the panelists were asked to orthonasally evaluate all samples individually and to establish a list of sensory attributes which described the samples best. In the second part, they jointly defined the characteristic qualities. Finally, each panelist scored the intensities of attributes on a scale from 0 (no perception) to 10 (strong perception). Additionally, they were asked to evaluate the overall odor intensities on the same scale.
Lipid Analysis
Lipid Extraction
Lipids were extracted at room temperature from 111 ± 11 mg of powdered samples using 20 mL of n-hexane in the presence of 12 ± 2 mg of internal standard (heptadecanoic acid; 17:0). The mixtures were then shaken for one and a half hour. One mL of each solution was collected in 2 mL GC vials, and the n-hexane was evaporated using a gentle stream of N2. For esterification, 1 mL of tert-butylmethylether and 300 μL of 0.2 M methanolic trimethylsulfoniumhydroxide solution were added to the vials before they were sealed and heated at 100°C for 20 min.
Gas Chromatography With Flame Ionization Detector (GC-FID)
The measurements were performed using an Agilent 7890A gas chromatograph (Agilent Technologies, USA) equipped with a split-/splitless injector and flame ionization detector (FID). Separation was performed using ZB-FFAP column (15 m × 0.25 mm, 0.25 μm; Phenomenex, USA). 1 μL of the sample was injected at 250°C with a split ratio of 1:20, and the carrier gas flow was 11.29 mL min−1.
The initial column temperature was 160°C and was held for 1.5 min. Then, the temperature was raised to 250°C with a rate of 37°C min−1 and held for 2.5 min. The temperature of FID was set to 260°C. OpenLab C.01.02 with integrated Maestro 1.1 software (Gerstel, Germany) was applied for data acquisition and processing.
Odorant Analysis
Odorant Enrichment
Odorants were extracted at room temperature from 5 ± 0.2 g of powdered samples using 20 mL of dichloromethane (DCM). After 30 min of stirring the mixture, DCM phases were separately collected and dried over anhydrous Na2SO4 and distilled using solvent assisted flavor evaporation (SAFE) according to Engel et al. (1999). Finally, the volume was reduced to approximately 100 μL via Vigreux distillation at 50°C (Bemelmans, 1979).
One-Dimensional High-Resolution Gas Chromatography/Olfactometry Coupled With Flame Ionization Detection or Mass Spectrometry (HRGC-FID/O and HRGC-MS/O)
The analyses were performed by means of a helium GC (Thermo Finnigan, Dreieich, Germany) using DB-FFAP (30 m × 0.32 mm fused silica capillary, 0.25 μm; Agilent J&W GC Columns, USA) and DB-5 (30 m × 0.32 mm fused silica capillary, 0.25 μm; Agilent J&W GC Columns, USA). The injection volume was 2 μL and the carrier gas flow was 2.2 mL min−1. The initial temperature for both columns was 40°C and was held for 2 min. Then, the temperature was raised at 8°C min−1 till 250°C and held for 10 min (DB-5), or to 245°C and held for 8 min (DB-FFAP). The temperature of both sniffing port and FID was set to 270°C. The GC effluent was split 1:1 between the sniffing port and the detector (FID or MS; DSQ, Thermo Finnigan, Dreieich, Germany). The linear retention index (RI) of each compound was calculated according to (Den Dool and Kratz, 1963). Mass spectra were obtained in the electron impact (EI) mode using the following conditions: 70 eV ionization energy, mass range 35 to 249 m/z, scan rate 500 amu/s and a source temperature of 200°C. Three experts were recruited from the sensory panel of Fraunhofer IVV to perform the GC-O analyses. They had experience in recognizing the odor-active compounds in matrices similar to fish feed, i.e., aquaculture water and fish samples from our previous studies.
Two-Dimensional High-Resolution Gas Chromatography-Mass Spectrometry/Olfactometry (2D-HRGC-MS/O)
The 2D-HRGC-MS/O system consisted of two CP 3800 GCs (Varian, Darmstadt, Germany) coupled with a Saturn 2200 MS (Varian, Darmstadt, Germany). Separation of the volatile substances was performed using the same capillaries as in HRGC-O. The initial temperature (40°C) was held for 2 min, then raised at 6°C min−1 to 240°C and held for 5 min in the first oven (DB-FFAP), and at 10°C min−1 to 250°C and held for 5 min in the second one (DB-5). The flow rate of the helium carrier gas was 2.5 mL min−1. At the end of the capillary, the effluent was split to an olfactory detection port (ODP; Gerstel, Mühlheim, Germany) and an FID (first oven), or to an ODP and an MS (second oven). The FID and the sniffing port were held at 300°C and 270°C, respectively. MS conditions were the same as in the DSQ system.
The identification of odorants was based on the following parameters: retention indices on two columns of different polarity (DB-FFAP and DB-5) and the respective mass spectra obtained in EI mode. Mass spectrometric data obtained for the target compounds were compared with those of the Fraunhofer IVV-internal library and finally confirmed by the respective chemical reference standards in each case. The automated mass spectral deconvolution and identification system software (AMDIS, 32) was used to analyze the full scan mode data. Using AMDIS helped in overcoming sample complexity and matrix interference.
Comparative Aroma Extract Dilution Analysis (cAEDA)
The flavor dilution factors (FD) of the main odorants were determined as described by Buettner and Schieberle (2001) and Grosch (2001). The concentrated odor distillates (FD = 1; 100 μL) were diluted stepwise (1:2; v/v) using DCM, and 2 μL of the dilutions corresponding to FD 3 to 2187 were applied for GC-O analysis on FFAP column. The FD factor for odorants represent the last dilution in which each of the substances was still perceived.
Ethics Statement
The sensory experiment was conducted in agreement with the Declaration of Helsinki. The Ethical Committee of Friedrich-Alexander Universität Erlangen-Nürnberg's Medical Faculty stated that no ethics approval was required as an expert panel carried out the evaluation.
Statistical Analysis
The results obtained from sensory analyses were tested for outliers (Gruber test) and normal distribution (Jarque-Bera test) using XLSTAT 2017® (Addinsoft, Paris, France). Then, they were averaged and plotted in spider-web diagrams using Excel 2016®. One-way analysis of variance (ANOVA) followed by Tukey test (a p-value < 0.05 was considered significant) was carried out. For the principal component analysis (PCA), the data (intensity ratings of sensory attributes, FD factors of odorants, total fat, and fatty acid content) were standardized using the z-score; then a correlation test (Pearson correlation) was conducted between the intensity ratings of sensory attributes and the other variables. Both the sensory data and its significantly correlated chemical variables were selected for running the PCA using XLSTAT 2017® (Addinsoft, Paris, France).
Results and Discussion
Sensory Evaluation
Ten attributes were chosen to describe the smell of the four fish feed samples S-1, S-2, S-3, and S-4. These were the attributes musty, earthy, metallic, green/ grassy, geranium-like, mushroom-like, fecal, muddy, fishy, and cooked potato-like. Based on the intensity ratings, the samples were found to be statistically different (p < 0.05). The fishy odor impression was dominant in the feeds S-1, S-2, and S-4 with intensities of 7.1, 5.7, and 7.6 respectively, while it was the second highest attribute in S-3, with an intensity score of 2.7 (Figure 1). The fishy smell was therefore one of the leading contributors to the overall aroma of these samples. In the case of S-3, however, the odor attribute with the highest intensity was cooked potato-like. Regarding the four different feeds, the highest rated smell attributes in S-1 were fecal, mushroom-like, musty, and muddy, whereas the metallic and earthy impressions were ranked highest in S-2, cooked potato-like was rated highest in S-3, while green/grassy, geranium-like, and fishy attributes were rated highest in S-4.
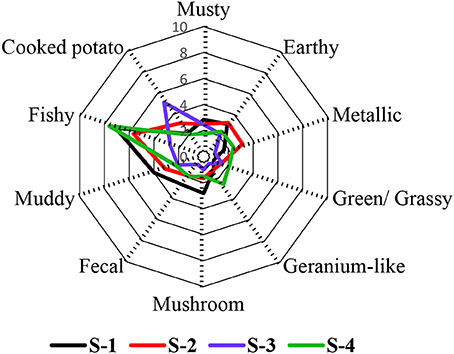
Figure 1. Odor sensory profile analysis of four commercial fish feeds. The data are displayed as mean values of the ortho-nasal sensory evaluation of three independent replicates (13 panelists).
The overall odor intensity (ODI) of S-1 was rated as very strong, similar to S-4 (ODI = 7.8 and 6.6 respectively; p > 0.05). S-2 and S-3 had lower ODI scores (5.1 and 5.3 respectively; p > 0.05). Accordingly, the ODI of S-1 was rated significantly more intense than the ODI of S-2 and S-3 (p < 0.01; Figure 2).
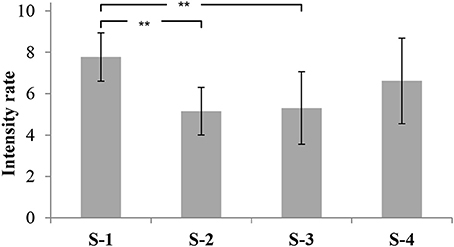
Figure 2. Overall odor intensities of four commercial fish feeds. The data are displayed as mean values of the ortho-nasal sensory evaluation (13 panelists) of three independent replicates with their corresponding standard deviation and significance (** p < 0.01).
Total Lipid and Fatty Acids
Based on the amount of total fat (TF), S-1 and S-2 had the highest values (25.3 ± 2.8 and 23.3 ± 0.3; g/100 g, respectively; see Figure 3A). On the other hand, S-4 showed the lowest value (11.8 ± 0.7; g/100 g) and S-3 scored in between (18.9 ± 1.3; g/100 g). Significant differences were found between the total fat contents of the samples, except for S-1 and S-2.
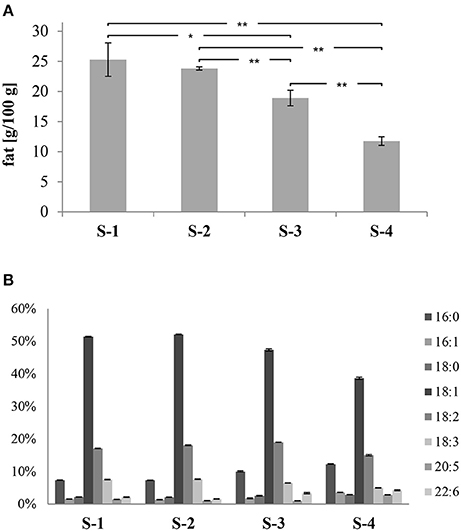
Figure 3. (A) Total fat content of samples (g/100 g); (B) percentages of the individual fatty acids of samples, shown as relative amounts of total fat. The data are displayed as mean values of three independent replicates with their corresponding standard deviation and significance (**p < 0.01 and * p < 0.05).
Based on the fatty acid (FA) contents, significant differences were found among samples, except between S-1 and S-2. In Figure 3B, the most common saturated fatty acids (SFA), monounsaturated fatty acids (MUFA), and polyunsaturated fatty acids (PUFA) are shown as relative amounts of TF (total fat). The S-4 feed scored the highest ΣSFA values (15%) followed by S-3 (12%), whereas S-1 and S-2 had equal values of 9%. Palmitic acid (16:0) was the most abundant SFA in all the samples. On the other hand, the S-4 feed had the lowest percentage of ΣEMUFA (43%), whereas higher percentages were found in S-3 (49%), and S-1 and S-2 (53% for both samples). Oleic (18:1n – 9) acid was the dominant MUFA in all the samples. Regarding the PUFA, eicosapentaenoic acid (20:5n – 3; EPA) and docosahexaenoic acid (22:6n – 3; DHA) are typical for fish feed. The highest value of the sum of these two PUFA was in S-4 (7%), then S-3 (4%), and finally both S-1 and S-2 had equal percentages of 3% (Figure 3).
Grigorakis et al. (2009) reported that fish oil-based formulas showed higher percentages of ΣSFA and EPA-DHA than plant oil-based formulas (30% higher ΣSFA and 67% higher EPA-DHA compared to the feeds with soy oil based-formula; 54% higher ΣSFA and 75% higher EPA-DHA compared to the rapeseed oil based-formula). Comparable results were reported by Baron et al. (2013). Thus, with increasing amounts of fish oil, the percentage of ΣSFA and EPA-DHA also increases. Consequently, the amount of the fish oil added to the samples was presumably in the following descending order: S-4, S-3, then S-1 and S-2 with similar amounts of fish oil.
Aroma Compounds
A total of 81 compounds were olfactorily detected (Table 1). One of these compounds could not be identified due to its low concentration and hence lack of detection in MS analysis. AEDA was then performed to screen for the odorants detectable in the step-wise dilutions of the original distillate. 78, 72, 74, and 67 compounds were perceived in samples of S-1, S-2, S-3, and S-4 respectively. 55 compounds were common to the four samples, while 9 compounds were common to S-1, S-2, and S-3, 5 compounds to S-1, S-3, and S-4, 4 compounds to S-1, S-2, and S-4, 2 compounds to S-1 and S-2, 2 compounds to S-1 and S-3, 1 compound to S-2, S-3, and S-4, 1 compound to S-2 and S-3, and finally 1 compound was common to S-3 and S-4 (Figure 4).
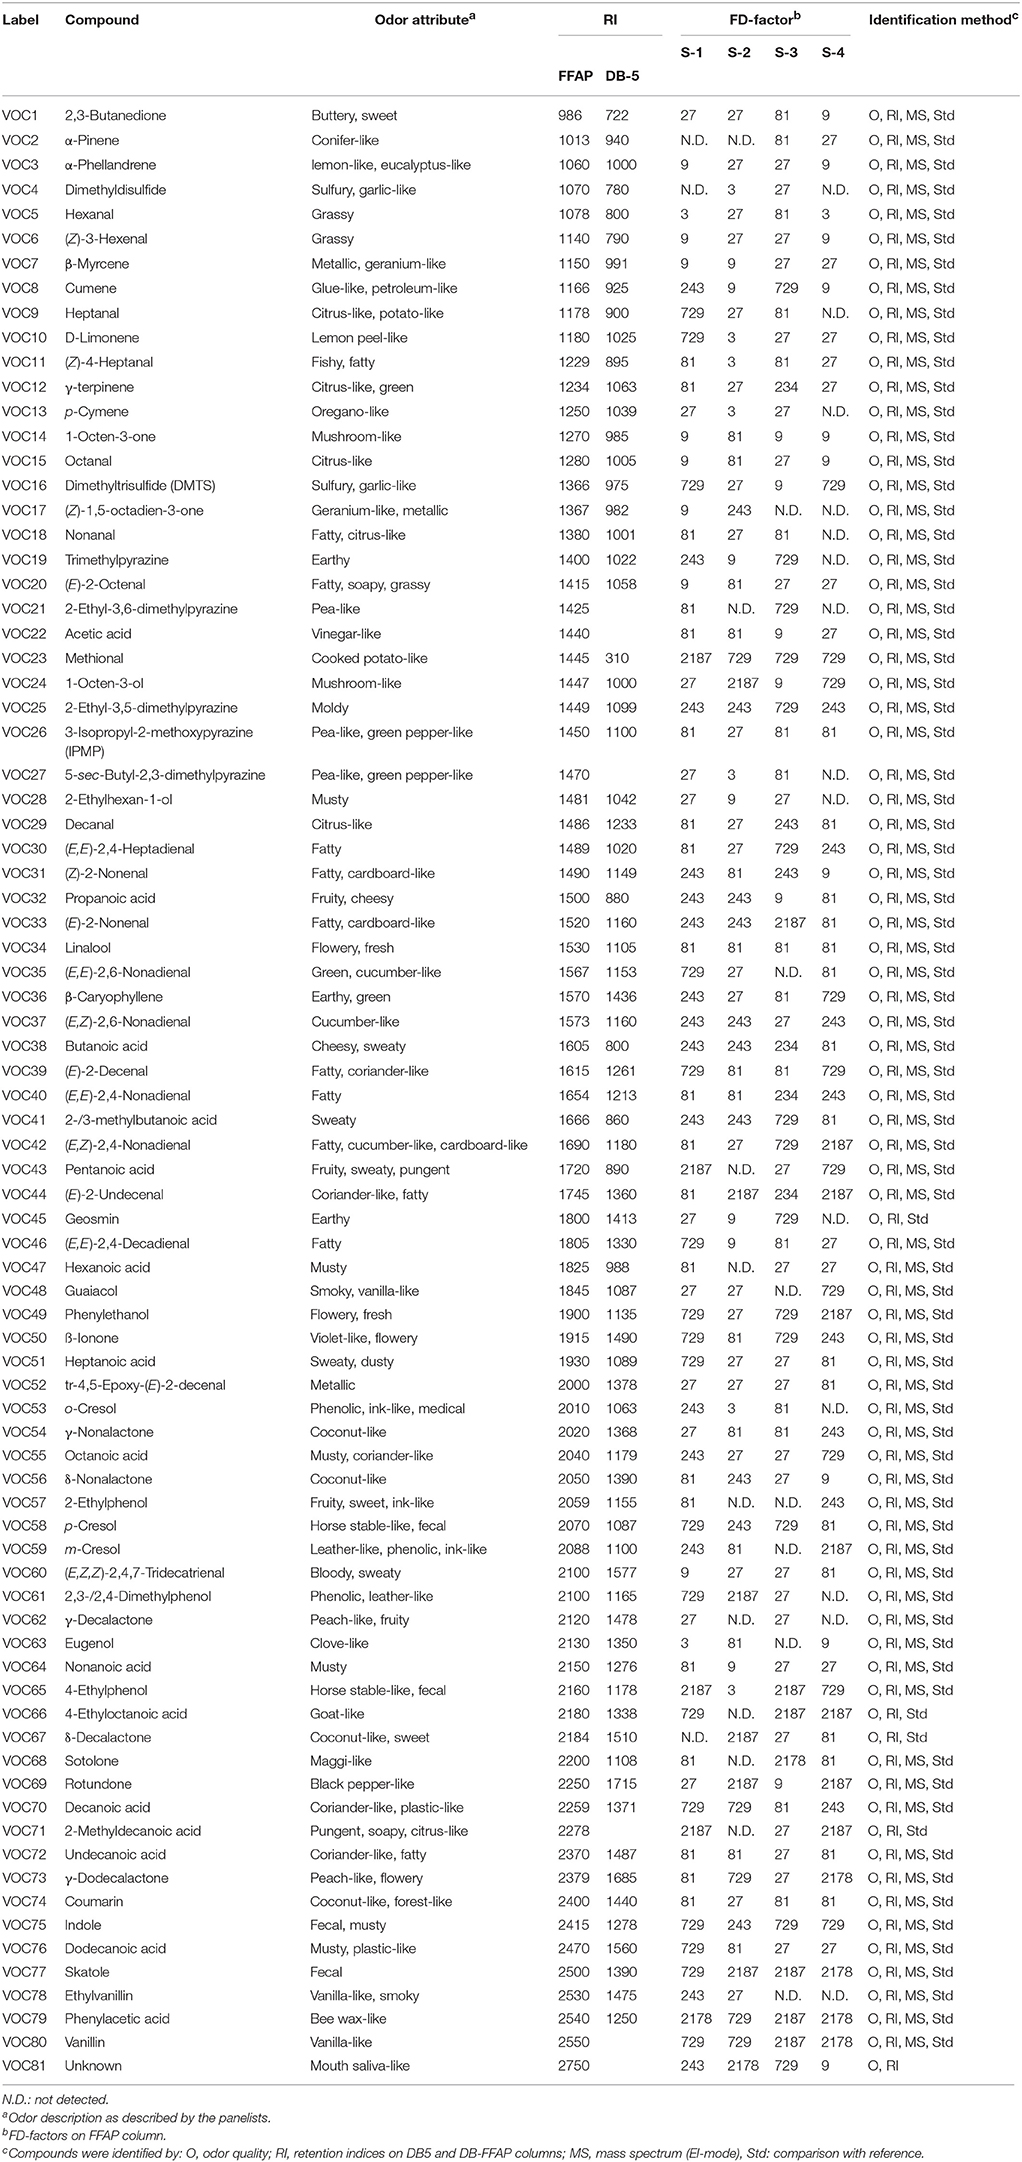
Table 1. Potent aroma compounds identified by GC–O/MS.
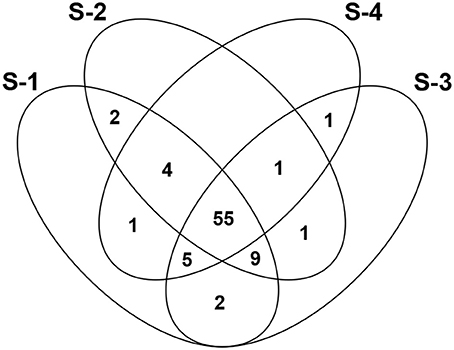
Figure 4. Venn diagram showing aroma compounds common to the samples.
The major group of odor-active compounds was the aldehydes, which was mainly composed of fatty acid derived saturated and unsaturated compounds (17 identified aldehydes). The aldehydes with the highest dilution factors were vanillin (vanilla-like; FD = 729, 729, 2187, and 2178 in S-1, S-2, S-3, and S-4 respectively), (E)-2-undecenal (coriander-like, fatty; FD = 81, 2187, 234, and 2187 in S-1, S-2, S-3, and S-4 respectively), (E,Z)-2,4-nonadienal (fatty, cucumber-like, cardboard-like; FD = 81, 27, 729, and 2187 in S-1, S-2, S-3, and S-4respectively), (E)-2-nonenal (fatty, cardboard-like; FD = 243, 243, 2187, and 81 in S-1, S-2, S-3, and S-4 respectively), and (E)-2-decenal (fatty, coriander-like; FD = 729, 81, 81, and 729 in S-1, S-2, S-3, and S-4 respectively). (E,Z,Z)-2,4,7-Tridecatrienal showed lower FD values compared to the other aldehydes, though it has a very distinctive blood-like smell. This compound may increase in concentration when bloodmeal is used in the fish feed formula.
The high intensities of aldehydes in the four fish feed samples are in line with these having been reported as the main aroma compounds in aquaculture water, fish meat, fish oils, and meals (Selli et al., 2006, 2009; Mahmoud and Buettner, 2016, 2017; Salum et al., 2017), which might indicate that feeds are one of the primary enrichment sources of aldehydes in fish.
Amongst the 15 acids that were successfully identified, the most potent ones were phenylacetic acid (honey, bee wax-like; FD = 2178, 729, 2187, and 2178 in S-1, S-2, S-3, and S-4 respectively), 4-ethyloctanoic acid (goat-like; FD = 729, N.D., 2187, and 2187 in S-1, S-2, S-3, and S-4 respectively), 2-methyldecanoic acid (pungent, soapy, citrus-like; FD = 2187, N.D., 27, and 2187 in S-1, S-2, S-3, and S-4 respectively), and pentanoic acid (sweaty, pungent; FD = 2187, N.D., 27, and 729 in S-1, S-2, S-3, and S-4 respectively). As clearly indicated, most of them were associated with negative smell impressions by the panelists. Our previous studies have reported 4-ethyloctanoic acid in aquaculture water and related fish (Mahmoud and Buettner, 2016, 2017). At that time we could not disclose the source of such compounds under aquaculture conditions and proposed an exogenous accumulation scenario. Identification of this compound in feed samples could support its exogenous origin.
From the group of terpenes and terpene-related odorants, several compounds were detected with various intensities and smell characteristics: rotundone (black pepper-like; FD = 27, 2187, 9, and 2187 in S-1, S-2, S-3, and S-4 respectively), β-ionone (violet-like, flowery; FD = 729, 81, 729, and 243 in S-1, S-2, S-3, and S-4 respectively), β-caryophyllene (earthy, green; FD = 243, 27, 81, and 729 in S-1, S-2, S-3, and S-4 respectively), and cumene (glue-like, petroleum-like; FD = 243, 9, 729, and 9 in S-1, S-2, S-3, and S-4 respectively). Geosmin, the major cause of off-flavor in aquaculture was also detected (earthy; FD = 27, 9, 729, and N.D. in S-1, S-2, S-3, and S-4 respectively). The accumulation of malodor terpenes from feeds in fish was first proposed by Podduturi et al. (2017). The authors reported seven terpenes in their feed samples, including p-cymene, limonene, and α-pinene, which were also identified here. However, to the best of our knowledge, the other terpenes and terpene-related compounds identified in our study have not previously been reported in fish feed samples; this includes geosmin which might originate from fish oil. A reason for geosmin being present in fish oil might be that it had been extracted from fish that had previously accumulated geosmin during farming. The other terpenes might derive from plant raw materials used in feeds (Podduturi et al., 2017). The accumulation of terpenes in fish has previously been discussed in numerous reports (Selli et al., 2006, 2009; Selli and Cayhan, 2009; Cayhan and Selli, 2010; Podduturi et al., 2017).
Nine phenolic derivatives, cresols and indoles, were detected with very distinctive smells ranging from phenolic to fecal. The most potent smelling substances were skatole (fecal; FD = 729, 2187, 2187, and 2187 in S-1, S-2, S-3, and S-4 respectively) and 4-ethylphenol (horse stable-like, fecal; FD = 2187, 3, 2187, and 729 in S-1, S-2, S-3, and S-4 respectively). Part of these compounds is reported here for the first time as odor-active substances in fish feeds, including skatole, indole, and the cresols. Nevertheless, these compounds have previously been reported in aquaculture water and the related farmed fish (Farmer et al., 1995; Mahmoud and Buettner, 2016, 2017). The possible reasons for the presence of such compounds are the partial or total replacement of fish oil with lard and/or the usage of leftovers from slaughter material as raw material for feed (Zhou et al., 2015; Gerlach et al., 2016).
Five pyrazines were detected with moderate intensities. The most potent of these were: 2-ethyl-3,5-dimethylpyrazine (moldy; FD = 243, 243, 729, and 243 in S-1, S-2, S-3, and S-4 respectively) and trimethylpyrazine (earthy; FD = 243, 9, 729, and N.D. in S-1, S-2, S-3, and S-4 respectively). In our previous study, we also reported pyrazines in cultured fish and discussed that some of these pyrazines might result from a Maillard reaction occurring during feed processing (Mahmoud and Buettner, 2017). However, at that time, we could not prove this theory as no feed samples were analyzed. Our current study now confirms that fish feed could indeed be the source of such pyrazines. From these pyrazines, 3-isopropyl-2-methoxypyrazine is reported as a cyanobacterial by-product in aquaculture water; however it was identified in feed samples. Other cyanobacterial metabolites are dimethyldisulfide and dimethyltrisulfide (Ma et al., 2013). Still, these sulfur compounds were identified in feed samples. We believe that these odorants become enriched from the raw materials fish oil and/or fishmeal, meaning that these ingredients might have been prepared from fish that previously contained 3-isopropyl-2-methoxypyrazine, dimethyldisulfide, and dimethyltrisulfide. Nevertheless, the odor intensities of these compounds were relatively low and might be irrelevant in terms of the overall aroma impact. This needs to be confirmed by further studies.
Finally, several lactones, ketones, and alcohols were identified with smells varying from fruity and coconut-like (e.g., γ-nona- and γ-decalactone) to mushroom-like (e.g., 1-octen-3-one and−3–ol). Most of these compounds have hitherto not been reported in fish feed samples, but all these constituents have been reported in various cultured fish species (Selli et al., 2006; Selli and Cayhan, 2009; Mahmoud and Buettner, 2016, 2017).
Although all four fish feeds contained most of the compounds, there was also considerable variation among the samples. For instance, 2,3-/2,4-dimethylphenol revealed very high dilution factors in S-1 and S-2 (729 and 2187 respectively), whereas a low FD factor or even no smell detection was found in S-3 and S-4 (FD = 27 and ≤ 3 respectively). Another interesting example is 4-ethyloctanoic acid: this substance was detected with high dilution factors in S-1, S-3, and S-4, whereas it was absent in S-2. Supported by future quantitative experiments, such variations might shed light on the influence of diverse types of feed on the quantitative occurrence of specific odorants in fish and on potential off-flavor formation.
Geometric Projection of Data Using PCA
Principle component analysis was used to understand the variations among the samples. We used only the chemical variables that were significantly correlated with intensity ratings of sensory attributes for the PCA. These variables were 18 odorants and 4 fatty acids, all of which are named in Figure 5. Two principal components explained 91.07% of the variation. The first principal component (PC1) successfully differentiated between sample S-4 and the other samples. The second principal component (PC2) distinguished between S-3 and the other samples. This is reflected by the positioning of samples S-3 and S-4 on the chart, with each of them being in separate quadrants (S-4 in quadrant – PC1/ – PC2 and S-3 in quadrant – PC1/ + PC2). Weaker differences were observed between S-1 and S-2, being grouped in the quadrant + PC1/ – PC2. In other words, S-4 and S-3 showed differences in composition between each other, but also compared to the rest of the samples. On the other hand, S-1 and S-2 were ranked with similar compositions, but differed from both S-4 and S-3. The overall findings are discussed in more detail below.
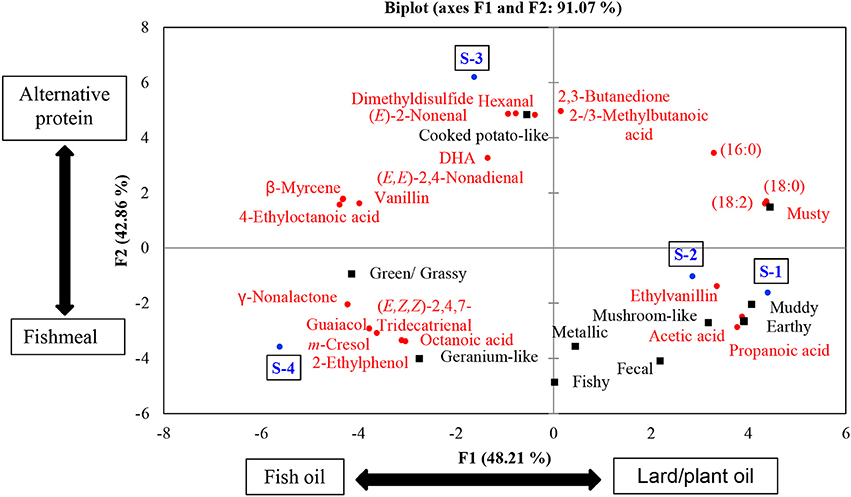
Figure 5. PCA bi-plot of odorants and fatty acid analyses showing two principal components that explain 91.07% of the variation. The blue color represents samples, the black color represents sensory attributes, and the red color represents chemical variables.
S-1 and S-2 exhibited no significant differences in their FA profile and TF content and had similar odorant profiles. Additionally, their TIC showed the same major peaks (see Figure 6). These findings correlate with their joint placement within the same PC quadrant. S-3 and S-4 on the other hand were significantly different in terms of their FA and TF contents.
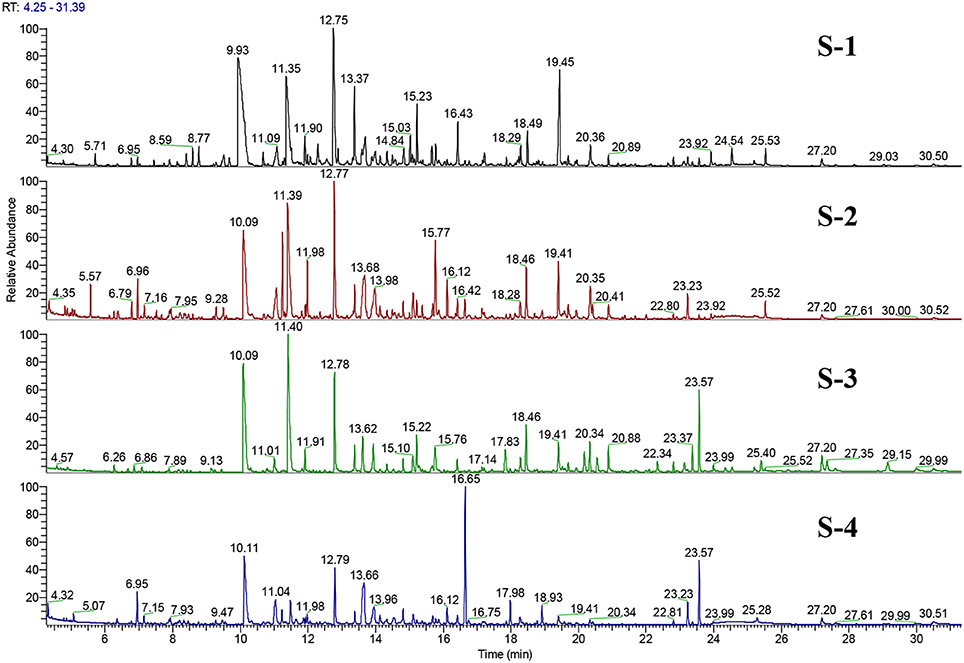
Figure 6. Total ion chromatogram (TIC) of GC-O/MS (EI-mode) representing separation of the volatile fraction of the four feed extracts. Both S-1 and S-2 exhibit the same major peaks, but in some cases with different intensities.
Regarding the ODI scores and TF contents, S-1 had the highest values. Furthermore, S-1 had lower EPA and DHA contents than the S-3 and S-4 samples. At first sight this might indicate that the TF content is related to the odor intensity of the fish feed. However, S-2 had a similar TF content and ΣPUFA to S-1; accordingly, its ODI score was significantly lower than that of S-1. This means, in our opinion, that the ODI in S-1 is not only attributed to the lipid but also to the protein source. The study of Baron et al. (2013) on the FA profile of fish feeds having different formulas (fishmeal−fish oil, plant protein−fish oil, and plant protein−different plant oils) supports this assumption. No major differences in FA content were found between the fish oil-based formulas that contained different protein sources (plant protein or fishmeal). On the other hand, plant protein-based formulas that were produced from different oil sources (fish oil or plant oils) showed significant differences in the FA profile of the feed. Given that S-1 and S-2 exhibited similar TF and FA contents, the change in ODI score might be related to the higher fishmeal content in S-1. It is known that fishmeal has a more distinctive smell than plant protein, as reflected in feeds that contain higher amounts of fishmeal (Giogios et al., 2009; Baron et al., 2013).
A similar pattern was observed when S-3 was compared to S-4. However, this time S-4 can be expected to contain more fishmeal than S-3 as might be indicated by the positioning of S-4 and S-3 in the PCA grouping. In this context, S-4 contained the lowest level of TF. However, the ODI was comparable to the S-1 sample. Given that S-4 contained the highest levels of EPA and DHA, it is likely that the fishmeal and fish oil levels were higher in this product than in the other feeds. To conclude, we assume that PC1 differs mainly with regard to the lipid sources used in the formula (lard/plant oil in + PC1 and fish oil – PC1), and PC2 is divergent with regard to the protein sources used in the formula (fish meal in – PC2 and alternative protein sources in + PC2).
Conclusion
The current study investigated whether fish feeds can be a potential source of off-odors in aquaculture water and fish. Comparative evaluation of the most commonly used fish feeds in Bavaria was performed based on their aroma profiles and lipid contents. Our findings confirmed the potential impact of fish feeds on off-odor accumulation in cultured fish. We showed that compounds such as skatole, 4-ethyloctanoic acid, indole, and cresols may originate from fish feeds. It is also suggested that feeds might be the primary source of fatty acid-derived volatile aldehydes that have previously reported in aquaculture water and fish. These odorants are not linked to the total fat content of the feeds, but rather to the amount of unsaturated fatty acids contained in the formula. The protein type (plant-based or fishmeal-based sources), in addition to the lipid content, is another factor that might play a significant role in odor formation. There might be a correlation between the protein type and the total aroma intensity of the samples. Based on our findings, feeds can now also be suspected as being the potential sources of compounds that have previously been thought of as being exclusively accumulated from cyanobacteria, for example geosmin and 3-isopropyl-2-methoxypyrazine. These findings call for further investigations on the complex mechanisms of off-flavor formation in aquacultural systems and fish with the aim of improving the quality of aquaculture products.
Author Contributions
Each author participated sufficiently in the work, intellectually or practically, to take public responsibility for the content of this article, including the conception, design, and conduct of the experiment and data analysis and interpretation. AB, MM, and TT participated in the design of the study. MM and TT were responsible for sampling. MM carried out the chemo-sensory analysis and helped TT with lipid analysis. AB, MM, TT, HL, and MW conceived the study. MM was responsible for data analysis and wrote the paper. All authors contributed to the manuscript and approved the final version.
Funding
MM was supported by a Ph.D. scholarship funded by the Egyptian Ministry of Higher Education (MoHE) and the German Academic Exchange Service (DAAD) within the 6th call (2014-2015) of the German-Egyptian Research Long Term Scholarship Program (GERLS; section 441, No. 91526983).
Conflict of Interest Statement
The authors declare that the research was conducted in the absence of any commercial or financial relationships that could be construed as a potential conflict of interest.
Acknowledgments
We would like to thank the sensory panelists of the Fraunhofer IVV. We also thank Anna Martin, Department of Food Process Development, Fraunhofer IVV, and Dr. Mahmoud Magdy, Genetics Department, Faculty of Agriculture, Ain Shams University, for their valuable comments on the manuscript.
References
Aladetohun, N., and Sogbesan, O. (2013). Utilization of blood meal as a protein ingredient from animal waste product in the diet of Oreochromis niloticus. Int. J. Fish. Aquacult. 5, 234–237. doi: 10.5897/IJFA10.031
Alexi, N., Fountoulaki, E., and Grigorakis, K. (2016). Quality of reared gilthead sea bream (Sparus aurata) during ice storage, as affected by dietary fish oil substitution; an instrumental and sensory designation approach. Aquacult. Res. 48, 1–12. doi: 10.1111/are.13208
Baron, C. P., Svendsen, G. H., Lund, I., Jokumsen, A., Nielsen, H. H., and Jacobsen, C. (2013). Organic plant ingredients in the diet of rainbow trout (Oncorhynchus mykiss): impact on fish muscle composition and oxidative stability. Eur. J. Lipid Sci. Technol. 115, 1367–1377. doi: 10.1002/ejlt.201300157
Bemelmans, J. M. H. (1979). Review of Isolation and Concentration Techniques. In: Progress in Flavour Research. London: Applied Science Publisher.
Buettner, A., and Schieberle, P. (2001). “Application of a comparative aroma extract dilution analysis to monitor changes in orange juice aroma compounds during processing,” in Gas Chromatography-Olfactometry, eds J. V. Leland, P. Schieberle, A. Buettner, and T. E. Acree (Washington, DC: American Chemical Society), 33–45.
Cayhan, G. G., and Selli, S. (2010). Characterization of the key aroma compounds in cooked grey mullet (Mugil cephalus) by application of aroma extract dilution analysis. J. Agric. Food Chem. 59, 654–659. doi: 10.1021/jf103471h
Den Dool, H. V., and Kratz, P. D. (1963). A generalization of the retention index system including linear temperature programmed gas—liquid partition chromatography. J. Chromatogr. A. 11, 463–471. doi: 10.1016/S0021-9673(01)80947-X
Engel, W., Bahr, W., and Schieberle, P. (1999). Solvent assisted flavour evaporation–a new and versatile technique for the careful and direct isolation of aroma compounds from complex food matrices. Eur. Food Res. Technol. 209, 237–241. doi: 10.1007/s002170050486
Farmer, L. J., McConnell, J. M., Hagan, T. D. J., and Harper, D. B. (1995). Flavour and off-flavour in wild and farmed Atlantic salmon from locations around Northern Ireland. Water Sci. Technol. 31, 259–264. doi: 10.2166/wst.1995.0444
Gerlach, C., Leppert, J., Santiuste, A. C., Pfeiffer, A., Boeker, P., and Wüst, M. (2016). Comparative aroma extract dilution analysis (cAEDA) of fat from tainted boars, castrated male pigs, and female pigs. J. Agric. Food Chem. 66, 2403–2409. doi: 10.1021/acs.jafc.6b04747
Giogios, I., Grigorakis, K., Nengas, I., Papasolomontos, S., Papaioannou, N., and Alexis, M. N. (2009). Fatty acid composition and volatile compounds of selected marine oils and meals. J. Sci. Food Agric. 89, 88–100. doi: 10.1002/jsfa.3414
Grigorakis, K., Fountoulaki, E., Giogios, I., and Alexis, M. N. (2009). Volatile compounds and organoleptic qualities of gilthead sea bream (Sparus aurata) fed commercial diets containing different lipid sources. Aquaculture 290, 116–121. doi: 10.1016/j.aquaculture.2009.02.006
Grosch, W. (2001). Evaluation of the key odorants of foods by dilution experiments, aroma models and omission. Chem. Senses 26, 533–545. doi: 10.1093/chemse/26.5.533
Howgate, P. (2004). Tainting of farmed fish by geosmin and 2-methyl-iso-borneol: a review of sensory aspects and of uptake/depuration. Aquaculture 234, 155–181. doi: 10.1016/j.aquaculture.2003.09.032
Ma, Z., Niu, Y., Xie, P., Chen, J., Tao, M., and Deng, X. (2013). Off-flavor compounds from decaying cyanobacterial blooms of Lake Taihu. J. Environ. Sci. 25, 495–501. doi: 10.1016/S1001-0742(12)60101-6
Mahmoud, M. A., and Buettner, A. (2016). Characterisation of aroma-active and off-odour compounds in German rainbow trout (Oncorhynchus mykiss). Part I: case of aquaculture water from earthen-ponds farming. Food Chem. 210, 623–630. doi: 10.1016/j.foodchem.2016.05.030
Mahmoud, M. A. A., and Buettner, A. (2017). Characterisation of aroma-active and off-odour compounds in German rainbow trout (Oncorhynchus mykiss). Part II: case of fish meat and skin from earthen-ponds farming. Food Chem. 232, 841–849. doi: 10.1016/j.foodchem.2016.09.172
Mjøs, S. A., and Solvang, M. (2006). Patterns in volatile components over heated fish powders. Food Res. Int. 39, 190–202. doi: 10.1016/j.foodres.2005.07.006
Nilsson, S., Sjöberg, J., Amundin, M., Hartmann, C., Buettner, A., and Laska, M. (2014). Behavioral responses to mammalian blood odor and a blood odor component in four species of large carnivores. PLoS ONE 9:e112694. doi: 10.1371/journal.pone.0112694
Olsen, Y. (2011). Resources for fish feed in future mariculture. Aquacult. Environ. Interact. 1, 187–200. doi: 10.3354/aei00019
Podduturi, R., Petersen, M. A., Mahmud, S., Rahman, M. M., and Jørgensen, N. O. (2017). Potential contribution of fish feed and phytoplankton to the content of volatile terpenes in cultured pangasius (Pangasianodon hypophthalmus) and tilapia (Oreochromis niloticus). J. Agric. Food Chem. 65, 3730–3736. doi: 10.1021/acs.jafc.7b00497
Salum, P., Guclu, G., and Selli, S. (2017). Comparative evaluation of key aroma-active compounds inraw and cooked red mullet (Mullus barbatus) by aroma extract dilution analysis. J. Agric. Food Chem. 65, 8402–8408. doi: 10.1021/acs.jafc.7b02756
Selli, S., and Cayhan, G. G. (2009). Analysis of volatile compounds of wild gilthead sea bream (Sparus aurata) by simultaneous distillation–extraction (SDE) and GC–MS. Microchem. J. 93, 232–235. doi: 10.1016/j.microc.2009.07.010
Selli, S., Prost, C., and Serot, T. (2009). Odour-active and off-odour components in rainbow trout (Oncorhynchus mykiss) extracts obtained by microwave assisted distillation–solvent extraction. Food Chem. 114, 317–322. doi: 10.1016/j.foodchem.2008.09.038
Selli, S., Rannou, C., Prost, C., Robin, J., and Serot, T. (2006). Characterization of aroma-active compounds in rainbow trout (Oncorhynchus mykiss) eliciting an off-odor. J. Agric. Food Chem. 54, 9496–9502. doi: 10.1021/jf0619582
Shen, G., Huang, Y., Dong, J., Wang, X., Cheng, K. K., Feng, J., et al. (2018). Metabolic effect of dietary taurine supplementation on Nile tilapia (Oreochromis nilotictus) evaluated by NMR-based metabolomics. J. Agric. Food Chem. 66, 368–377. doi: 10.1021/acs.jafc.7b03182
Turchini, G. M., Mentasti, T., Caprino, F., Panseri, S., Moretti, V. M., and Valfrè, F. (2004). Effects of dietary lipid sources on flavour volatile compounds of brown trout (Salmo trutta L.) fillet. J. Appl. Ichthyol. 20, 71–75. doi: 10.1046/j.0175-8659.2003.00522.x
Turchini, G. M., Moretti, V. M., Mentasti, T., Orban, E., and Valfre, F. (2007). Effects of dietary lipid source on fillet chemical composition, flavour volatile compounds and sensory characteristics in the freshwater fish tench (Tinca tinca L.). Food Chem. 102, 1144–1155. doi: 10.1016/j.foodchem.2006.07.003
Zhou, L., Han, D., Zhu, X., Yang, Y., Jin, J., and Xie, S. (2015). Effects of total replacement of fish oil by pork lard or rapeseed oil and recovery by a fish oil finishing diet on growth, health and fish quality of gibel carp (Carassius auratus gibelio). Aquac. Res. 47, 2961–2975. doi: 10.1111/are.12748
Keywords: fish feed, aquaculture, SAFE, cAEDA, GC-O, off-flavor
Citation: Mahmoud MAA, Tybussek T, Loos HM, Wagenstaller M and Buettner A (2018) Odorants in Fish Feeds: A Potential Source of Malodors in Aquaculture. Front. Chem. 6:241. doi: 10.3389/fchem.2018.00241
Received: 22 March 2018; Accepted: 06 June 2018;
Published: 25 June 2018.
Edited by:
Eduardo Dellacassa, University of the Republic, UruguayReviewed by:
Marco Iammarino, Istituto Zooprofilattico Sperimentale di Puglia e Basilicata (IZSPB), ItalyHock Eng Khoo, Putra Malaysia University, Malaysia
Jane K. Parker, University of Reading, United Kingdom
Copyright © 2018 Mahmoud, Tybussek, Loos, Wagenstaller and Buettner. This is an open-access article distributed under the terms of the Creative Commons Attribution License (CC BY). The use, distribution or reproduction in other forums is permitted, provided the original author(s) and the copyright owner are credited and that the original publication in this journal is cited, in accordance with accepted academic practice. No use, distribution or reproduction is permitted which does not comply with these terms.
*Correspondence: Andrea Buettner, YW5kcmVhLmJ1ZXR0bmVyQGl2di5mcmF1bmhvZmVyLmRl; YW5kcmVhLmJ1ZXR0bmVyQGZhdS5kZQ==