 Xiangyun Ma1
 Da Chen
 Qifeng Li
- 1School of Precision Instrument and Opto-electronics Engineering, Tianjin University, Tianjin, China
- 2State Key Laboratory of Precision Measurement Technology and Instruments, Tianjin University, Tianjin, China
Raman spectroscopy has been widely used for quantitative analysis in biomedical and pharmaceutical applications. However, the signal-to-noise ratio (SNR) of Raman spectra is always poor due to weak Raman scattering. The noise in Raman spectral dataset will limit the accuracy of quantitative analysis. Because of high correlations in the spectral signatures, Raman spectra have the low-rank property, which can be used as a constraint to improve Raman spectral SNR. In this paper, a simple and feasible Raman spectroscopic analysis method by Low-Rank Estimation (LRE) is proposed. The Frank-Wolfe (FW) algorithm is applied in the LRE method to seek the optimal solution. The proposed method is used for the quantitative analysis of pharmaceutical mixtures. The accuracy and robustness of Partial Least Squares (PLS) and Support Vector Machine (SVM) chemometric models can be improved by the LRE method.
Intruduction
Raman spectroscopy is one of the vibrational spectroscopic techniques that has been commonly applied in quantitative analysis (Strachan et al., 2004; Numata and Tanaka, 2011; Ai et al., 2018). Being non-invasive and marker-free, it has been proved to be an effective tool in the field of physics, chemistry, and biology (Graf et al., 2007; Neugebauer et al., 2010; Ryu et al., 2012; Tan et al., 2017). Coupled with chemometrics methods, it has the advantages of high sensitivity and resolution in biomedical and pharmaceutical quantitative analysis.
The quantitative analysis based on Raman spectra at low signal-to-noise ratio (SNR) levels is still problematic (Li, 2008; Chen et al., 2014). Generally, a Raman spectrum can be divided into two parts: the signal containing desired information and the noise containing unwanted information. Basically, the latter may include photon-shot noise, sample-generated noise, instrument-generated noise, computationally generated noise, and externally generated noise (Pelletier, 2003). Due to the inherently weak property of Raman scattering, the noise will lead to a deterioration in SNR of Raman spectra, affecting the accuracy of quantitative analysis. For instance, data of online monitoring in limited integration time always tend to be inaccurate (Han et al., 2017; Virtanen et al., 2017).
Some approaches of preprocessing Raman spectra to minimize this problem have been proposed (Clupek et al., 2007; Ma et al., 2017), such as first and second derivatives (Johansson et al., 2010), polynomials fitting (Vickers et al., 2001), Fourier transform (Pelletier, 2003), and wavelet transform (Chen et al., 2011; Li et al., 2013). Among these approaches, wavelet transform can extract peak information and remove background noise, which has been the most widely used preprocessing method (Du et al., 2006). However, the processing of Raman spectra can be further optimized to improve the accuracy of pharmaceutical quantitative analysis.
In this paper, we introduce a simple and feasible Raman spectroscopic analysis method based on Low-Rank Estimation (LRE). Our experiments are implemented based on the Partial Least Squares (PLS) and Support Vector Machine (SVM) chemometric models. The aim of this experimental design is to enhance the quality of pharmaceutical quantitative analysis by significantly improving the accuracy and robustness of the chemometric models used.
Materials and Methods
Pharmaceutical substances (norfloxacin, penicillin potassium, and sulfamerazine) were purchased from Dalian Meilun Biotechnology Co., Ltd (China) and used without further purification. These substances were well blended in different proportions, pulverized, and compressed into three-component tablets. Other physical properties of these tablets (such as density, height, and diameter) were kept completely consistent. Mixed solutions were also prepared with methanol and ethanol in 100 different proportions. Raman spectral data were recorded by using a Renishaw inVia Raman spectrometer (Gloucestershire, U.K.). This system consisted of a 785-nm diode laser (~40 mW) and a 1,200 l/mm grating. In this work, the integration times of Raman spectra were 0.1–0.5 s.
PLS and SVM regression methods were used to model and predict pharmaceutical concentration of the samples based on their Raman spectra. Eighty-five samples were selected as the training set and the remaining 15 samples as the testing set, based on Kennard-Stone (KS) algorithm. The parameters of PLS and SVM models were tuned based on grid search algorithm. The optimal parameters were obtained by k-folder cross-validation.
The accuracy and robustness of above-mentioned chemometric models were further improved by conventional Wavelet Transform (WT) method and Low-Rank Estimation (LRE) method, respectively. In the WT method, the signals were split into different frequency components to remove simultaneously low-frequency background and high-frequency noise components. The Symlet wavelet filter (sym11, scale = 7) was optimally selected to provide the sharpest peaks associated with the analytes of interest. The LRE method was originally developed by our group in three-dimension to speed up Raman spectral imaging (Li et al., 2018). In this study, we used the LRE method in two-dimension to process the observed Raman spectral data matrix. In this method, the alternating least squares (ALS) algorithm is used to estimate the largest singular value of the matrix (Kroonenberg and Leeuw, 1980; Halko et al., 2011). The matrix estimation has two sets of parameters. Each set is estimated in turn by solving a least-squares problem and holding the other set fixed. After both sets have been estimated once, the procedure is repeated until convergence.
The Frank-Wolfe (FW) algorithm is applied in the LRE method to seek the optimal solution. Recently, the FW algorithm has been popularly used in machine learning due to its characteristics of simple implementation and modest memory requirement (Jaggi, 2013; Guo et al., 2017). The steps of the LRE method are detailed in Table 1.
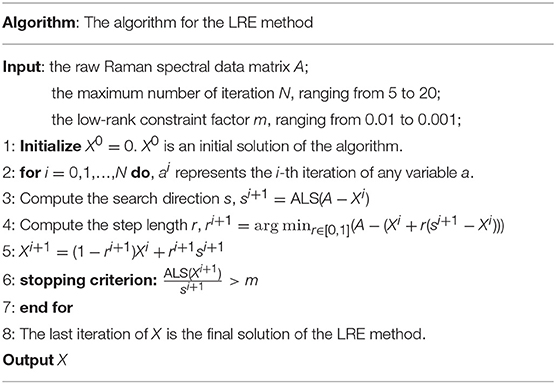
Table 1. The detail steps of the LRE method.
Through being processed by the LRE method, the low-rank training and testing sets can be obtained from the raw training and testing data matrices, respectively. In general, an abundant data matrix can enhance the effect of the LRE method. When a number of testing spectral data is small, the training spectral data can be added to the raw testing data matrix as a supplement. The added spectral data are only used to strengthen the impact of the LRE method. The conventional regression models are applied to the low-rank training and testing sets to perform quantitative Raman analysis.
Results and Discussion
Noise-free Raman spectral dataset is a low-rank matrix. In Figure 1, the red line shows the ranks of Raman spectral data matrix in an integration time of 1 s, suggesting that the Raman spectra have low-rank property when the noise is low. The low-rank property comes from high correlations among spectral signatures. Each spectral signature can be represented by a linear combination of a small number of pure spectral endmembers, which is known as linear spectral mixing model (Iordache et al., 2011; Golbabaee and Vandergheynst, 2012). The blue and green plots show singular values of the matrix in a shorter integration time, which implies that the ranks of Raman spectra increase with decreasing integration time owing to a greater proportion of the noise. The low-rank property can be used as a constraint to improve the accuracy of pharmaceutical quantitative analysis (Yi et al., 2017).
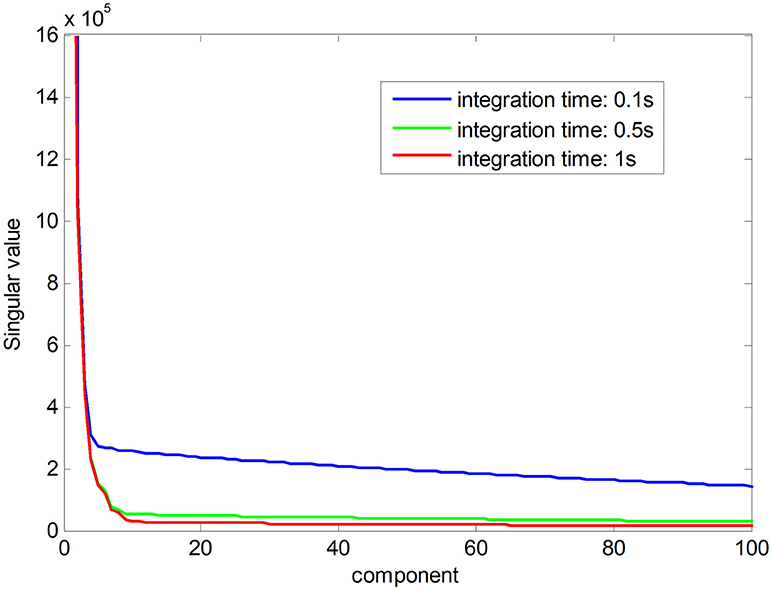
Figure 1. The ranks of the Raman spectra in different integration time.
Raw Raman spectra recorded for three pure pharmaceutical substances are shown in Figure 2A. Thirty Raman spectra obtained from three-component tablets with different proportions are shown in Figure 2B. It is clear that each pharmaceutical component has its own special characteristic peaks. However, their respective Raman bands are overlapped. Particularly, Raman signals of lower-concentration component are almost swamped and covered by those of higher- concentration one, which represents a common problem in practice for biomedical and pharmaceutical quantitative analysis. For clarity, the Raman spectra in Figure 2B were collected in an integration time of 5 s, which have a high SNR. In our experiments, the integration times of Raman spectra are in the range of 0.1–0.5 s, which is over 10 times shorter than that shown in Figure 2. Under this condition, the spectral signals are weaker and have poor SNR.
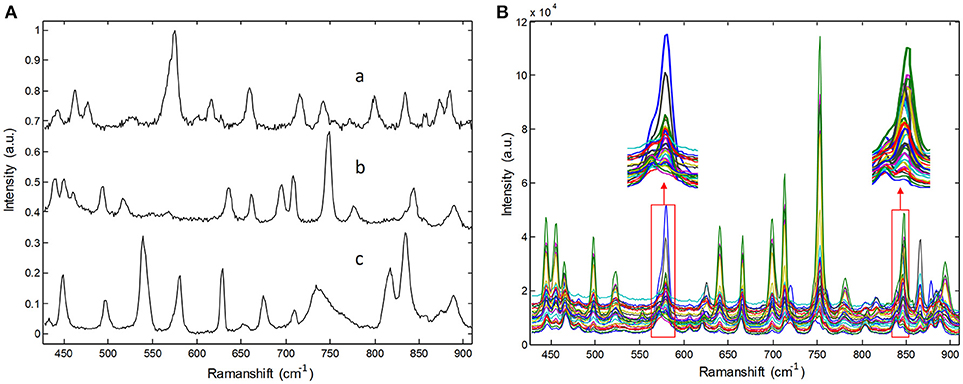
Figure 2. Raman spectra of (A) pure pharmaceuticals substances: (a) penicillin potassium, (b) norfloxacin, and (c) sulfamerazine, (B) their three component tablets containing different proportions in the integration time of 5s.
The comparisons of predicted and actual values for norfloxacin are illustrated in Figure 3, which indicates the advantage of the LRE method for pharmaceutical quantitative analysis. The coefficient of determination (R2) and root mean square error (RMSE) of the chemometric models used for quantitative analysis of three pharmaceutical components are listed in Table 2. The unsatisfactory results of the raw spectral data show that the pre-treatment of Raman spectra is necessary. In this study, the LRE method and conventional wavelet transform (WT) method are applied to improve the accuracy of quantitative analysis. As shown in Figure 3, both the conventional WT and LRE methods can improve the predicted results. However, it is clear that the LRE method has a better performance than the conventional WT method in enhancing the prediction accuracy for pharmaceutical quantitative analysis.
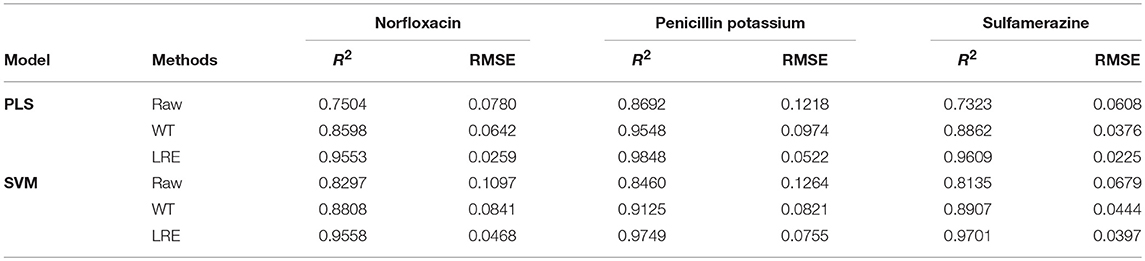
Table 2. R2 and RMSE values of the chemometric models for three pharmaceutical components.
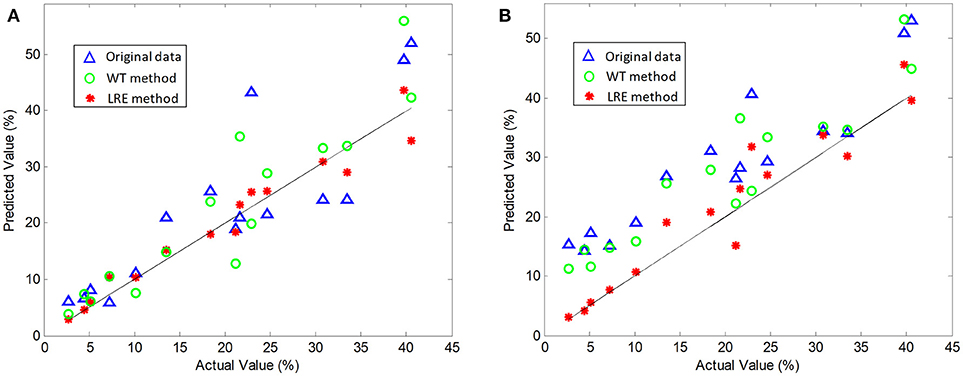
Figure 3. Actual vs. predicted values of norfloxacin based on the PLS (A) and SVM (B) model, where the black solid line are diagonals. Raw Raman spectra are collected in an integration time of 0.2 s.
As shown in Table 2, the raw Raman spectra are all collected in an integration time of 0.2 s. The LRE method is significantly better than the conventional WT method in terms of R2 and RMSE for all components. Quantitation limit (QL) for each pharmaceutical substance is calculated. By definition in ICH guideline (ICH Harmonised Tripartite Guideline, 2005), QL is the lowest concentration of an analyte that can be quantitatively determined with suitable precision and accuracy. It is most often determined as 10 times the standard deviation of the noise from the blank. The LRE method can be used reliably with more than a 15-fold improvement of the practicalQL. Through being processed by the LRE method, QL values for norfloxacin, penicillin potassium, and sulfamerazine are 0.17, 0.13, and 0.19%, respectively. These results reveal that the LRE method can simultaneously improve the performance of quantitative analysis for pharmaceutical multi-component mixtures.
Table 3 lists R2 and RMSE values of the chemometric models used for quantitative analysis of norfloxacin in different integration times. The integration times of raw Raman spectra are 0.1, 0.2, and 0.5 s. Raman spectrum's SNR is always proportional to integration time. For evaluating spectral quality, the SNR is defined as the ratio of the peak value of the signal to the root mean square of the noise. For integration times of 0.1, 0.2, and 0.5 s, the average SNR of Raman spectra are 2.47, 3.66, and 6.21, respectively. R2 and RMSE values of the chemometric models for methanol in different integration times are listed Table 4. The average SNR of the Raman spectra in the integration times of 0.1, 0.2, and 0.5 s are 2.13, 3.34, and 5.89, respectively.
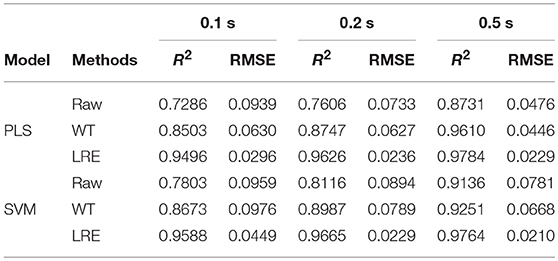
Table 3. R2 and RMSE values of the chemometric models for norfloxacin in different integration times.
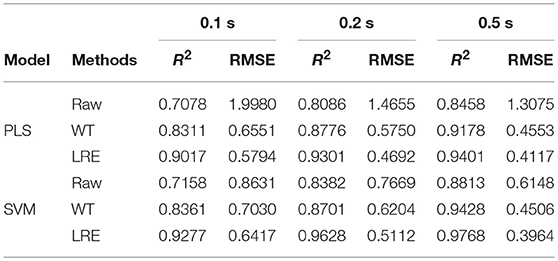
Table 4. R2 and RMSE values of the chemometric models for methanol in different integration times.
As shown in Tables 3, 4, the accuracy of the quantitative analysis raises with increasing SNR. According to R2 and RMSE values, it can be proved that the LRE method has a better performance than the conventional WT method. The degree of improvement is higher for low-SNR Raman spectra, which indicates that the LRE method has good noise immunity.
In summary, all predicted results of the Raman spectra preprocessed by the LRE method are in good agreement with corresponding actual values. This method can be applied to improve the accuracy of quantitative analysis based on both PLS and SVM models. It is unrelated to the selection of chemometric models. The LRE method is not restricted by the state of a sample, meaning that it is applicable to both solid and liquid samples. Therefore, it can be regarded as an efficient tool with satisfactory prediction accuracy for pharmaceutical quantitative analysis, especially in the case of low-SNR spectra.
Conclusion
The LRE method has been successfully applied in Raman spectroscopy for pharmaceutical quantitative analysis. It is a simply and feasibly method that can improve the accuracy and robustness of PLS and SVM chemometric models. Our data show that the LRE method has advantages in improving R2 and RMSE for quantitative analysis of pharmaceutical multi-component mixtures, especially in the case of low-SNR spectra. The LRE method will promote the development of Raman spectroscopy in biomedical and pharmaceutical quantitative analysis.
Author Contributions
XM participated in the lab work, supervising lab work, interpretation of data, drafting the manuscript, performing the statistical analysis. XS participated in the lab work, interpretation of data, drafting the manuscript, performing the statistical analysis. HW design of the work, interpretation of data. YW supervised the research, performing the statistical analysis. DC supervised the research, final approval of the version to be published. QL participated in the lab work, supervising lab work, final approval of the version to be published.
Funding
National Key Research and Development Program of China (2017YFC0803603).
Conflict of Interest Statement
The authors declare that the research was conducted in the absence of any commercial or financial relationships that could be construed as a potential conflict of interest.
References
Ai, Y. J., Liang, P., Wu, Y. X., Dong, Q. M., Li, J. B., Bai, Y., et al. (2018). Rapid qualitative and quantitative determination of food colorants by both Raman spectra and Surface-enhanced Raman Scattering (SERS). Food Chem. 241, 427–433. doi: 10.1016/j.foodchem.2017.09.019
Chen, D., Chen, Z., and Grant, E. (2011). Adaptive wavelet transform suppresses background and noise for quantitative analysis by Raman spectrometry. Anal. Bioanal. Chem. 400, 625–634. doi: 10.1007/s00216-011-4761-5
Chen, S., Lin, X., Yuen, C., Padmanabhan, S., Beuerman, R. W., and Liu, Q. (2014). Recovery of Raman spectra with low signal-to-noise ratio using Wiener estimation. Opt. Express 22, 12102–12114. doi: 10.1364/OE.22.012102
Clupek, M., Matejka, P., and Volka, K. (2007). Noise reduction in Raman spectra: finite impulse response filtrationversusSavitzky-Golay smoothing. J. Raman Spectrosc. 38, 1174–1179. doi: 10.1002/jrs.1747
Du, P., Kibbe, W. A., and Lin, S. M. (2006). Improved peak detection in mass spectrum by incorporating continuous wavelet transform-based pattern matching. Bioinformatics 22, 2059–2065. doi: 10.1093/bioinformatics/btl355
Golbabaee, M., and Vandergheynst, P. (2012). “Hyperspectral image compressed sensing via low-rank and joint-sparse matrix recovery,” in 2012 IEEE International Conference on Acoustics, Speech and Signal Processing (ICASSP) (Kyoto), 2741–2744. doi: 10.1109/ICASSP.2012.6288484
Graf, D., Molitor, F., Ensslin, K., Stampfer, C., Jungen, A., Hierold, C., et al. (2007). Spatially resolved Raman spectroscopy of single- and few-layer graphene. Nano Lett. 7, 238–242. doi: 10.1021/nl061702a
Guo, X., Yao, Q., and Kwok, J. T. (2017). “Efficient sparse low-rank tensor completion using the Frank-Wolfe algorithm,” in The AAAI Conference on Artificial Intelligence (San Francisco, CA).
Halko, N., Martinsson, P. G., and Tropp, J. A. (2011). Finding structure with randomness: probabilistic algorithms for constructing approximate matrix decompositions. SIAM Review 53, 217–288. doi: 10.1137/090771806
Han, X., Huang, Z.-X., Chen, X.-D., Li, Q.-F., Xu, K.-X., and Chen, D. (2017). On-line multi-component analysis of gases for mud logging industry using data driven Raman spectroscopy. Fuel 207, 146–153. doi: 10.1016/j.fuel.2017.06.045
ICH Harmonised Tripartite Guideline (2005). “Validation of analytical procedures: Text and methodology Q2(R1), ” in International Conference on Harmonisation of Technical Requirements for Registration of Pharmaceuticals for Human Use (Yokohama).
Iordache, M.-D., Bioucas-Dias, J. M., and Plaza, A. (2011). Sparse unmixing of hyperspectral data. IEEE Trans. Geosci. Remote Sens. 49, 2014–2039. doi: 10.1109/TGRS.2010.2098413
Jaggi, M. (2013). “Revisiting Frank-Wolfe: Projection-free sparse convex optimization,” in ICML 2013 - Proceedings of the International Conference on Machine Learning, Vol. 28. (Atlanta, GA), 427–435.
Johansson, J., Claybourn, M., and Folestad, S. (2010). Raman Spectroscopy: A Strategic Tool in the Process Analytical Technology Toolbox. Berlin; Heidelberg: Springer, 241–262.
Kroonenberg, P. M., and Leeuw, J. D. (1980). Principal component analysis of three-mode data by means of alternating least squares algorithms. Psychometrika 45, 69–97. doi: 10.1007/BF02293599
Li, G. (2008). “Noise removal of Raman spectra using interval thresholding method,” in 2008 Second International Symposium on Intelligent Information Technology Application (Shanghai), 535–539. doi: 10.1109/iita.2008.573
Li, Q., Ma, X., Wang, H., Wang, Y., Zheng, X., and Chen, D. (2018). Speeding up Raman spectral imaging by the three-dimensional low rank estimation method. Opt. Express 26, 525–530. doi: 10.1364/OE.26.000525
Li, S., Nyagilo, J. O., Dave, D. P., and Gao, J. X. (2013). Continuous wavelet transform based partial least squares regression for quantitative analysis of Raman spectrum. IEEE Trans. Nanobiosci. 12, 214–221. doi: 10.1109/TNB.2013.2278288
Ma, X., Wang, H., Wang, Y., Chen, D., Chen, W., and Li, Q. (2017). Improving the resolution and the throughput of spectrometers by a digital projection slit. Opt. Express 25, 23045–23050. doi: 10.1364/OE.25.023045
Neugebauer, U., Clement, J. H., Bocklitz, T., Krafft, C., and Popp, J. (2010). Identification and differentiation of single cells from peripheral blood by Raman spectroscopic imaging. J. Biophotonics 3, 579–587. doi: 10.1002/jbio.201000020
Numata, Y., and Tanaka, H. (2011). Quantitative analysis of quercetin using Raman spectroscopy. Food Chem. 126, 751–755. doi: 10.1016/j.foodchem.2010.11.059
Pelletier, M. (2003). Quantitative analysis using Raman spectrometry. Appl. Spectrosc. 57, 20A–42A. doi: 10.1366/000370203321165133
Ryu, S.-K., Zhao, Q., Hecker, M., Son, H.-Y., Byun, K.-Y., Im, J., et al. (2012). Micro-Raman spectroscopy and analysis of near-surface stresses in silicon around through-silicon vias for three-dimensional interconnects. J. Appl. Phys. 111, 063513. doi: 10.1063/1.3696980
Strachan, C. J., Pratiwi, D., Gordon, K. C., and Rades, T. (2004). Quantitative analysis of polymorphic mixtures of carbamazepine by Raman spectroscopy and principal components analysis. J. Raman Spectrosc. 35, 347–352. doi: 10.1002/jrs.1140
Tan, Z., Lou, T. T., Huang, Z. X., Zong, J., Xu, K. X., Li, Q. F., et al. (2017). Single-drop raman imaging exposes the trace contaminants in milk. J. Agric. Food Chem. 65, 6274–6281. doi: 10.1021/acs.jafc.7b01814
Vickers, T. J., Wambles, R. E., and Mann, C. K. (2001). Curve fitting and linearity: data processing in Raman spectroscopy. Appl. Spectrosc. 55, 389–393. doi: 10.1366/0003702011952127
Virtanen, T., Reinikainen, S.-P., Kögler, M., Mänttäri, M., Viitala, T., and Kallioinen, M. (2017). Real-time fouling monitoring with Raman spectroscopy. J. Memb. Sci. 525, 312–319. doi: 10.1016/j.memsci.2016.12.005
Keywords: Raman spectroscopy, quantitative analysis, pharmaceuticals, low-rank estimation, chemometric model
Citation: Ma X, Sun X, Wang H, Wang Y, Chen D and Li Q (2018) Raman Spectroscopy for Pharmaceutical Quantitative Analysis by Low-Rank Estimation. Front. Chem. 6:400. doi: 10.3389/fchem.2018.00400
Received: 28 February 2018; Accepted: 20 August 2018;
Published: 10 September 2018.
Edited by:
Hoang Vu Dang, Hanoi University of Pharmacy, VietnamReviewed by:
Andreas Borgschulte, Swiss Federal Laboratories for Materials Science and Technology, SwitzerlandPellegrino Musto, Consiglio Nazionale Delle Ricerche (CNR), Italy
Copyright © 2018 Ma, Sun, Wang, Wang, Chen and Li. This is an open-access article distributed under the terms of the Creative Commons Attribution License (CC BY). The use, distribution or reproduction in other forums is permitted, provided the original author(s) and the copyright owner(s) are credited and that the original publication in this journal is cited, in accordance with accepted academic practice. No use, distribution or reproduction is permitted which does not comply with these terms.
*Correspondence: Qifeng Li, THFmbGlAdGp1LmVkdS5jbg==