 J. Noé Díaz de León1*
 Jassiel R. Rodríguez1
 Joel Rojas1Yasmin Esqueda-Barrón1
 Luis Cardenas2
 Chowdari Ramesh Kumar1Gabriel Alonso-Nuñez1Sergio Fuentes-Moyado1
- 1Centro de Nanociencias y Nanotecnología, Universidad Nacional Autónoma de México, Ensenada, Mexico
- 2Institut de Recherches sur la Catalyse et l'Environnement de Lyon - IRCELYON - UMR 5256, CNRS-UCB Lyon 1, Université de Lyon, Lyon, France
The aim of this work is focused on the study of a series of non-traditional catalytic nanomaterials to transform greenhouse CO2 gas into added-value products. We found encouraging results of CO2 hydrogenation activity over sodium titanates with different morphologies. The yield to methanol increases with the increase in the Na incorporated in the nanostructures confirming the proposed mechanism. Samples were prepared at different times of hydrothermal treatment (HTT) with NaOH solutions, and these materials were labeled as Ti-nR-x with x as the hours on the HTT. HRTEM initially showed sphere-shaped nanoparticles in the TiO2 commercial nanopowder, increasing the HTT resulted in morphological changes in which the structures passed from nanosheets and finally to nanorods after 30 h. The X-ray diffraction and Raman spectroscopy results indicated the formation of sodium titanates such as Na2Ti3O7 with short Ti-O bonds and that Na begins to be incorporated into the distorted TiO6 crystalline structure after 5 h of HTT (until 12 wt%). The crystalline and shape transformation resulted in a significant modification on the textural properties passing from 51 m2.g−1 to 150 m2.g−1 and from a pore volume of 0.12 cm3.g−1 to 1.03 cm3.g−1 for Ti-ref and Ti-nR-30 respectively. We also observed differences in the electronic properties as the bandgap presented a blue shift from 3.16 eV on the TiO2 reference nano-powder to 3.44 eV for the Ti-nR-30 calcined sample. This fact coincides with the presence of a more electron-rich state of the Ti4+ and the formation of negative charge layer induced by the presence of Na+ interlayer cations detected by XPS analysis, at the same this helped us to explain the catalytic activity results.
Introduction
Titanium dioxide is a versatile and unique material due to its optoelectronic and photochemical properties (Al-Mamun et al., 2019). Its refractive index, dielectric constant, its semiconductor bandgap have attracted widespread attention (Maheu et al., 2018). To date, many kinds of novel TiO2-based nano-architectures, such as nanoparticles (Dong et al., 2016), -fibers (Choi et al., 2013; Shin et al., 2016), -spheres (Cai et al., 2015; Paszkiewicz et al., 2016), -tubes (Cheng et al., 2013; Marien et al., 2016), and –rods (Bian et al., 2015; Kathirvel et al., 2016; Saber, 2016), have been prepared to modulate its electronic and catalytic properties. For instance, the photo-conversion efficiency for water splitting was duplicated, replacing the TiO2 nanocrystals by TiO2 nanowires (Khan and Sultana, 2003). On this matter, the hydrothermal method has demonstrated to be a direct way to synthesize TiO2 (Burungale et al., 2016; Erdogan et al., 2016; Zhang et al., 2016) and Al2O3 (Neelakanta Reddy et al., 2015) nanostructures. The hydrothermal method is often used to tailor the crystalline properties, including crystal polymorph, particle size, and shape (Kukovecz et al., 2016). One dimensional (1D) nanostructures are known for their capacity to influence the time, the temperature, the solvent, or the acid-basic conditions, all of them involved in the material synthesis (Zhang et al., 2015).
Nevertheless, the growth mechanism of nanostructures at the nanoscale as a function of those parameters is still unclear. The sequence of events for the formation of titanates in the shape of nanofibers, nanotubes, nanowires, and nanobelts have been widely proposed (Wu et al., 2006). Although, several authors coincided in the observation of lamellar structures prior the formation of 1D nanostructures and claimed that structures are formed by rolling up around the [010] direction of a single-layer nanosheet (Yao et al., 2003; Zhang et al., 2003; Wang et al., 2004). Besides, getting different morphologies was also achieved using surfactants (Sun et al., 2011) and acid promotors (Shen et al., 2008) to produce different crystal phases like anatase, rutile, and mixtures of both polymorphs. Likewise, the precursors also play a fundamental role in the nucleation, growth, and final shape of TiO2 nanoparticles. In this sense, it has been proposed that self-splitting of solid titanate form complex TiO2 nanostructures (Shen et al., 2008). Recently, we have prepared Al-doped Na-TiO2 nanorods varying the Al2O3/TiO2 ratio to be used as potential CO2 hydrogenation catalysts (Guzmán-Cruz et al., 2019). These results confirmed that the CO2 molecule could be activated over metal oxides as reported for other pure oxide systems such as Al2O3 (Pan et al., 2011), Ga2O3 (Ye et al., 2012), In2O3 (Ye et al., 2013), or TiO2 (Ji and Luo, 2016). We proposed that the surface mechanism for the activation of CO2 molecule occurs over two adjacent metal active sites (Me*, Al or Ti) and the presence of Na+ near to the neighboring of one of them, results in an active site that could interact directly with carbon from the CO2. Forming the -COOH followed by the stabilization of -CHO intermediate and creating a stable cyclic ring on catalyst surface.
We further analyze in this work, the growth mechanism, and the effect of Na content on the 1D titania nanorods (Ti-nR) and its application as potential CO2 hydrogenation catalysts. The samples were widely studied using N2 adsorption/desorption isotherms, X-ray diffraction (XRD), UV-vis diffuse reflectance spectroscopy (DRS), X-ray photoelectron spectroscopy (XPS) and high-resolution transmission electron microscopy (HRTEM).
Experimental
Chemicals
Titanium oxide (TiO2, 99.9%, nanopowder dp = 21 nm), sodium hydroxide (NaOH, 99%), and 2-propanol (C3H8O, 99%) were purchased from Sigma-Aldrich. Millipore water (18 MΩ•cm) was used as a dissolvent. All chemicals were used as received without further purification.
Sodium Titanates 1D Nanorods Preparation
The 1D titanates nanostructures were prepared by the hydrothermal method. In brief, 0.25 g of commercial TiO2 nanopowder was dispersed in 80 mL of 10 M NaOH aqueous solution during 40 min under stirring. The resultant suspension was placed into an autoclave reactor (125 mL) and thermally treated at 140°C during different aging times. The samples were labeled considering the hydrothermal treatment time (HTT) as Ti-nR-(x), where x = 0, 1, 5, 10, 15, and 30 h. Commercial TiO2 nanopowder was used as a reference labeled as TiO2-ref. Next, the obtained samples Ti-nR-(x) were filtered and washed with water for several times. Then samples were dried at 85°C for 1 h and finally calcined at 500°C during 4 h.
Catalysts Characterization
The growth evolution during the formation of sodium titanates 1D nanorods was investigated by HRTEM using a JEOL 2010F microscope. The phase identification and structural analysis of the samples at different aging times of hydrothermal treatment were studied by X-ray diffraction (XRD) using a Phillips X'Pert Diffractometer, with Cu Kα (λ = 1.5405 Å) as a radiation source, at 45 kV and 40 mA. Diffraction patterns were obtained in a 2θ range from 20 to 70 (Bragg-Brentano geometry); where crystalline phases were identified with database JCPDS–ICDD 2003. Also, the presence of crystalline phases was corroborated by Raman Spectroscopy using a Horiba Xplora system interfaced with an Olympus BX41 optical microscope and a laser source of 532 nm. The evolution of absorption edge energy of the catalysts was studied using UV-Visible spectroscopy using an AVANTES Ava-spec 2048 UV–visible spectrophotometer equipped with an AvaLight-DHS light source. The absorption edge energies were obtained according to the Kubelka-Munk function, as described by Barton et al. (1999). Surface analysis of nanostructured materials was carried out by XPS using a commercial instrument Axis Ultra DLD (KRATOS). Energy positions calibration of the peak maxima was done using the binding energy (BE) of C1s peak centered at 284.6 eV. Each core level state of Ti 2p was decomposed by Doniach-Sunjic asymmetric line shapes, with an overall FWHM of 1.5 eV. The pore structure of the catalysts was investigated by N2 adsorption at −196°C using a Tristar II 3020 Micromeritics equipment. The surface area of the samples was determined from the Brunauer–Emmett–Teller (BET) equation and the pore volume from the total amount adsorbed at a relative pressure near unity. The pore size distribution was analyzed using the Barrett–Joyner–Halenda (BJH) method.
Activity Measurements
All the synthesized catalysts were evaluated for the CO2 hydrogenation in a microflow reactor in the temperature range of 300–340°C and under atmospheric pressures. In a typical experiment, 0.1 g of the catalyst sample was loaded into the reactor and heated up to the desired temperature with a ramp of 5°C min−1. Once the temperature was attained, a gas mixture of H2 and CO2 (3:1) was passed through the reactor with flow of 40 mL min−1 (space velocity ~15,000 h−1), and the outlet of the reactor was connected to an online GC-TCD-FID Agilent SP1 equipped with a series of seven columns, generally used in special refinery gas application. CO2 hydrogenation experiments were carried out at three different temperatures viz. 340°, 300°, 320°, and 340°C for 5 h, and the products were analyzed every 30 min. Under steady-state conditions we considered at least 6 stabilized samples to obtain an average conversion () value. The where obtained as indicated in Equation 1:
Where is the initial concentration at RT and is the concentration after reaction at temperature T°C.
Considering that our conversions resulted below 10%, we could assume differential conditions and therefore the reaction rates at different temperatures could be calculated using the next equation:
Where is the molar flow of CO2, and mcat is the catalysts mass used in the specific catalytic activity test. The yield was obtained using the ratio / where is the concentration of products in the reactor effluent.
Results
Morphological Effect of Na Into the Nanostructures by HRTEM
Figure 1 presents the characteristic nanoparticles for the TiO2-ref with an average particle size of 21 ± 1 nm. In Figure 1 is also possible to see the inverse fast Fourier transform (IFFT) used in the calculation of interplanar distances (ds) included as an inset. The values for the ds resulted in 3.4 Ȧ, this value is closed to that reported (3.51Ȧ) for the plane (1 0 0) of anatase according to the 01-084-1286 file of ICCD 2003. Other zones with no observable planes are present in the sample suggesting that the reference material is composed of Anatase and another crystallographic phase. This will be further confirmed with the XRD analysis.
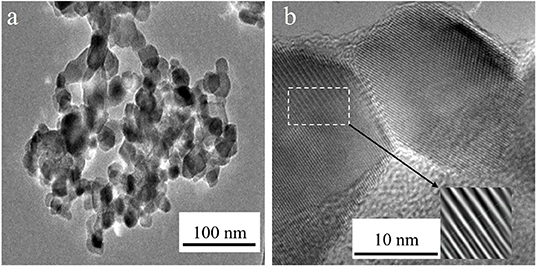
Figure 1. (a) Typical TEM micrograph obtained for the Ti-ref and (b) HRTEM micrograph for the nanoparticles in the Ti-ref and an IFFT image as an inset.
The typical micrographs acquired for the Ti-nR-0, Ti-nR-1, and Ti-nR-5 are shown in Figure 2.
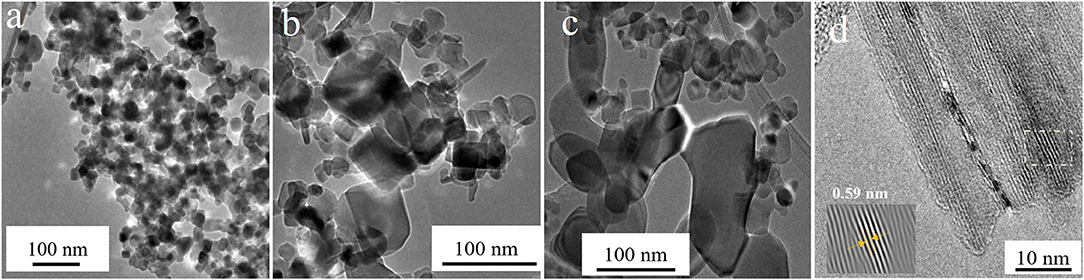
Figure 2. TEM micrographs correspondent to (a) Ti-nR-0, (b) Ti-nR-1, and (c) Ti-nR-5. (d) HRTEM micrograph for a nanosheet in Ti-nR-5 sample and a IFFT as an inset.
Initially, the nanoparticles that were treated with the alkaline solution for 40 min, but without hydrothermal treatment did not present any morphological changes as shown in Figure 2a. For the Ti-nR-1, the presence of the original nanoparticles is also observed along with some layered nanosheets of various sizes (Figure 2b). In the case of Ti-nR-5, the presence of raw nanoparticles was barely observed, and large titania layered nanosheets became predominant all over the sample (see Figure 2c). The chemical attack from the alkaline treatment induces the peeling of these observed layers from the nanoparticles, and the time of hydrothermal treatment determines the formation of this new morphology. As described in other reports, the formation of layered nanosheets might be the initial step in the route to the formation of all layered materials, as the TiO2 nanotubes (Bavykin et al., 2004) or the multiwalled carbon nanotubes (Viculis et al., 2003) after splitting.
Nevertheless, the exact sequence of events is still unclear, and several mechanisms for the subsequent formation of 1D nanostructures have been proposed (Viculis et al., 2003; Bavykin et al., 2004; Das et al., 2008; Lee et al., 2014). In general, is suggested that the NaOH begins disturbing the initial crystalline structure of the titania nanoparticles, then the basic unit of the structure (octahedral units) rise hydroxyl bridges with Ti ions and finally growing in a preferential direction the sheets are formed (Wang et al., 2004). Indeed, as seen in Figure 2d, the single nanosheet exhibit planes in one direction, the interplanar distances observed of around 0.59 nm are related to the (−2 0 1) plane of the sodium titanates, following the 00-013-0589 file of ICCD 2003. This result may suggest that the intercalation occurs not only between TiO2 octahedral units but also including the Na ions. The XRD analysis will provide us further information about the resulting crystalline structure on samples after the thermal treatment.
The Figure 3 shows some HRTEM micrographs for the calcined Ti-nR-10 and Ti-nR-30 samples. In Figure 3a is possible to observe a nanosheet that seems to begin to be separated into well-defined sections. With the increase in HTT, the sheets lose wholeness, and the rods segregate from each other, and finally after 30 h (see Figure 3b), the 1D nanorods are clearly defined, and nanosheets or nanoparticles are no longer observed.
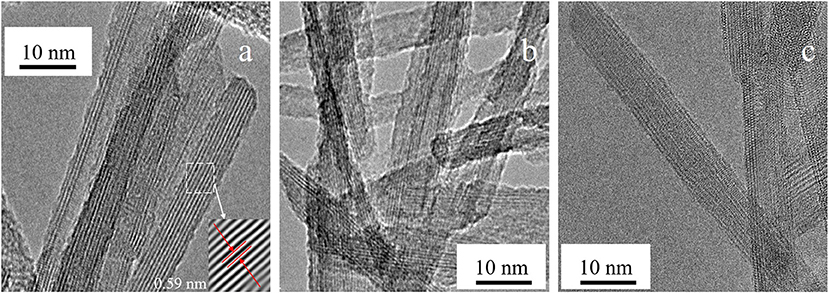
Figure 3. HRTEM for the (a) Ti-nR-10, (b) Ti-nR-15, and (c) Ti-nR-30.
X-ray Diffraction
The X-ray diffraction patterns for the calcined Ti-nR-x series are provided as Supplementary Information 1. The TiO2-ref sample exhibited 75% of anatase and 25% of rutile crystalline phases according to the Rietveld analysis, following the files 01-084-1286 and 01-078-1508–0551 of database ICCD 2003. The simulated scan patterns for the anatase and rutile phases are presented along with the patterns for the Ti-nR-0 and Ti-nR-1 samples in Figure S1A. These two samples presented the same diffraction peaks and intensities as the TiO2-ref samples; the Rietveld analysis confirmed this statement since it only showed slight differences in their composition. This fact revealed that the sodium titanates are not formed at low hydrothermal treatment time. The diffraction patterns for the samples with longer HTT are shown in Figure S1B. It is possible to observe that the patterns exhibit peaks with low intensity compared with the reference and samples in Figure S1A. All samples presented diffractions at ca. 10.5°, 24.7°, 29.3°, 33.2°, 44°, 48°, and 67° 2θ degrees. These peaks are consistent with the formation of sodium titanates, such as Na2Ti3O7 and Na2Ti3O13 (Wang et al., 2015). Although the peaks at 29.3° and 48° were attributed to the formation of small quantities of the rutile phase. The diffractions at 10.5°, 24.7°, and 44° 2θ degrees corresponding to the crystalline diffractions of Na2Ti3O7, while peaks at 33.2° and 67° 2θ degrees are related to the Na2Ti3O13 phase. We can see that the peaks of the respective titanates increase with the HTT, especially the Na2Ti3O13 phase. Average crystallite sizes of calcined materials are listed in Table 1, calculated using the Scherrer's equation. The results showed an almost linear behavior of crystallite size with an increase in the HTT.
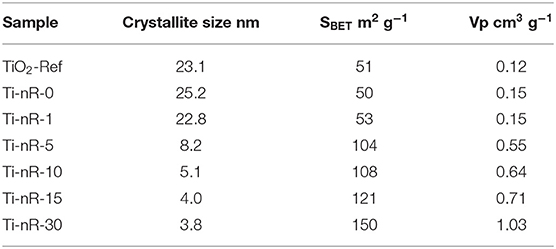
Table 1. Crystal size estimation and textural properties for the Ti-nR-x series.
Textural Properties
The Ti-nR-x catalysts were analyzed by nitrogen physisorption technique. The isotherm and pore size distributions plots are provided in the supplementary information as Figure S2. The textural properties of the Ti-nR-x series are included in Table 1. As observed, a clear variation in the surface area was detected depending on the HTT. The reference sample presented only 51 m2.g−1 and a low pore volume of 0.12 cm3.g−1. As expected, Ti-nR-0 and Ti-nR-1 samples displayed almost the same textural properties as the reference sample. When the chemical attack of NaOH begins to be significant over the TiO2 nanoparticles, and the formation of sodium titanates are observed, the surface area increased almost two times (104 m2.g−1). Sample with 10, 15, and 30 hours of hydrothermal treatment exhibited 108, 121, and 150 m2.g−1, respectively. Although the difference in surface area between Ti-nR-10 and Ti-nR-15 samples is only 4%, the Ti-nR-30 presented an increase near to 30% with respect to the same sample (Ti-nR-10). These changes described are related to the progressive formation of the new nanostructures with more area than the solid nanoparticles in the raw material. The pore volume also presented the same trend as the surface area shifting from 0.12 to 1.03 cm3 g−1 in TiO2-ref and Ti-nR-30 samples, respectively. The isotherms plot and pore size distributions are provided as Supplementary Information.
Diffuse Reflectance UV-vis Spectroscopy
The UV–vis diffuse reflectance absorption spectra for the Ti-nR-x series are shown in Figure 4. An evident variation on the absorption edge was observed due to the different HTT. In the TiO2-ref sample, at least two absorptions can be observed: a strong band centered at 262 nm and a small absorption shoulder with its maximum c.a. 292 nm. The first one is usually related to Ti4+ in tetrahedrally coordinated sites (TiO4), and the second one is assigned to Ti atoms in octahedral coordination (TiO6) (Capel-Sanchez et al., 2000). As shown in Figure 4, the intensity of the absorption band related to the Ti octahedrally coordinated atoms decreases considerably with the increase in the HTT. Here it is worth to mention that in principle, the hydrothermal treatment to the TiO2 nanopowder (TiO2-ref) drive into the formation of sodium titanates as the XRD results exhibited. Then, the formation of Na4TiO4, which is an ionic solid formed by isolated TiO4 tetrahedrons (Doeff et al., 2014), could be inducing the observed blue shift in the optical absorption band edge. Nevertheless, as the XRD results indicated, Na2Ti3O7 and Na2Ti3O13 crystalline structures were formed, and both consist of TiO6 octahedrons connected through edges or corners to form layered structures where the Na ions stay between layers (Doeff et al., 2014). Then the observed shift is a combination of the decrease in the quantity of TiO6 octahedra connected each other and the intercalation and corresponding increase in the insulator character. Then we will assume that our material is a combination of different titanates namely few Na4TiO4, Na2Ti3O7, and Na2Ti3O13.
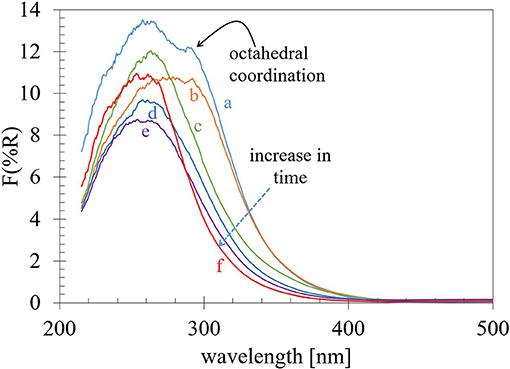
Figure 4. UV–vis diffuse reflectance absorption spectra for the (a) TiO2-ref, (b) Ti-nR-1, and (c) Ti-nR-5, (d) Ti-nR-10, (e) Ti-nR-15, (f) Ti-nR-30 samples.
The evaluation of the edge energy (Eg) bandgap usually is obtained from the UV–vis diffuse reflectance absorption spectroscopy. In the literature, there are several reports of Eg values for titania, but as the values are obtained according to the type of transition band considered, directly or indirectly and depending on absorbance or reflectance data, the Eg values can strongly differ from one author to the other (López and Gómez, 2012). The most accepted method, for determining the band-gap energy values of semiconductors is by plotting a function of reflectance absorption such as the Kubelka–Munk equation (Equation 1) given by F(R) without considering electronic transitions or [F(R).hv]1/n with n as 2 for an indirect allowed transition or for a direct allowed transition, vs. the photon energy and extrapolating the linear part of the rising curve to zero (Barton et al., 1999; Reddy et al., 2002; López and Gómez, 2012).
Plotting different functions of UV-vis diffuse reflectance, it is possible to obtain Eg values, which highly differ from each other until 0.4 eV. The obtained values were collected in Table 2. For comparison with our results, the widely reported intrinsic bandgap absorption for pure TiO2 anatase is in the range between 3.15 and 3.2 eV (Yu et al., 2009; Ji and Luo, 2016; Maheu et al., 2018). Also, the XRD-Rietveld analysis results revealed that our TiO2-ref nanopowder is 75% anatase and 25% rutile. Therefore, our Eg values considering n = 2 for an indirectly allowed transition in the KM transformation leads to similar values to those reported in the literature for this solid. Then the values obtained for the Ti-nR-x series will be further discussed considering only the indirect allowed transition (n = 2) (Figure 5). An increase in the Eg values with the hydrothermal treatment was observed from 3.16 eV in the TiO2-ref sample to 3.19, 3.23, 3.29, 3.35, and 3.44 eV for Ti-nR-1, Ti-nR-5, Ti-nR-10, Ti-nR-15, and Ti-nR-30 samples respectively. As mentioned, this increase in the insulator character is due to the presence of the Na in the TiO2 matrix.
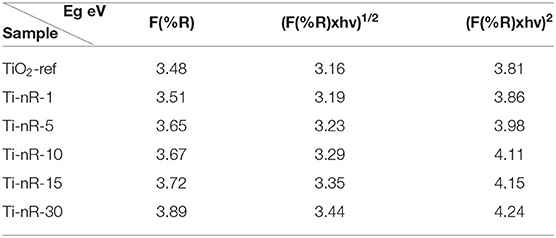
Table 2. Edge energy for the Ti-nR-x series obtained from different treatments of the UV-vis diffuse reflectance data.
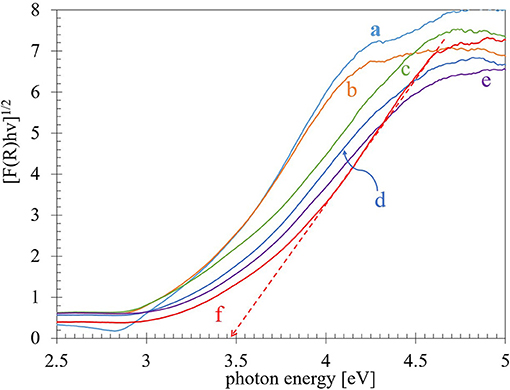
Figure 5. Kubelka-Munk function plotted versus photon energy for each sample (a) TiO2-ref, (b) Ti-nR-1, and (c) Ti-nR-5, (d) Ti-nR-10, (e) Ti-nR-15, (f) Ti-nR-30 samples.
Raman Spectroscopy
Figure 6 shows the Raman spectroscopy analysis obtained for the Ti-nR-x series. The Raman spectra obtained for the commercial TiO2 reference and the Ti-nR-1 exhibited the same six active modes related to the TiO2 anatase crystalline phase with space group I41/amd (Ma et al., 1998). The anatase phase typically exhibited a tetragonal structure with vibration modes in 144 cm−1 (Eg), 197 cm−1 (Eg), 399 cm−1 (B1g), 513 cm−1 (A1g), 519 cm−1 (B1g), and 639 cm−1 (Eg) (Balachandran and Eror, 1982; Qian et al., 2005). Changes in the vibrational modes of mentioned TiO2 crystalline structure were observed after 5 h of hydrothermal treatment, in good agreement with the XRD results presented in section X-ray diffraction (vide supra). The chemical attack of NaOH during the synthesis procedure derived in the formation of sodium titanates (Na2Ti3O7) which is reflected in a significant loss of symmetry.
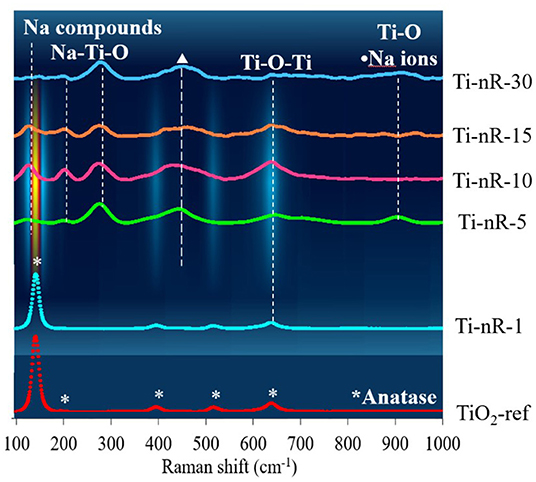
Figure 6. Raman spectra of Ti-nR-x series as a function of the hydrothermal treatment time.
The Raman spectra for the Ti-nR-5, Ti-nR-10, Ti-nR-15, and Ti-nR-30 catalysts exhibited low intensity and wider bands c.a. 130, 204, 278, 445–462, 637–646, and 902–910 cm−1. From those mentioned Raman active modes, the bands at 123 cm−1 thas been assigned to (Ag) αNa2, the band in 201 cm−1 to (Bg) τO1-Ti3-O2, meanwhile the band at 277 cm−1 to τO5-Ti2-O6 with stretching mode related to Na-O-Ti, and finally the bands in 449 and 643 cm−1 to σO5-Ti1-O4 in Ti-O-Ti stretching and edge shared TiO6 vibrational modes (Zhang et al., 2010; Silva et al., 2018). All vibrational modes of the Ti-nR-x series are listed in Table S1 provided as supplementary information. The phase transformation observed for samples with thermal treatment times ≥5 h confirmed the intercalation of Na into the layers of TiO6 octahedral species. Even when the nanoparticles formed could make the surface more predominant and increase the surface-volume ratio, the intensity of the spectra was very low, suggesting that phonon confinement, and structural defects were not observed due to the presence of intercalated Na (Ilie et al., 2017).
Inductively Coupled Plasma (ICP)
ICP measurements (Table S2) confirmed the variation in the Na with the hydrothermal treatment time. The atomic weight composition for the titanates (Na2Ti3O7) phase is related to a sodium stoichiometric bulk concentration of around 15. wt % while for the Ti is near to 47 wt %. Therefore, following the results enlisted in Table S2 from material Ti-nR-5, the composition seems to be stabilized on average at 11.9 wt % Na and 43.8 wt % for Ti. These values confirmed the formation of sodium titanates as exhibited by XRD and Raman spectroscopy results.
X-ray Photoelectron Spectroscopy
XPS analysis was used in order to establish the influence of the hydrothermal reaction time with the presence of Na on the surface. The surface atomic quantification provided the increase of the Na/Ti ratio as a function of the hydrothermal treatment time (HTT), as seen in Figure 7A. XPS chemical surface quantification revealed that after 10 H, Na incorporation is attained. In this context, at least two interpretations appear possible. By one hand, after 10 hours under HTT a hysteresis loop on the surface may be established so that the adsorption sites are lost. On the other hand, the hydrothermal process stabilizes after around ten hours and does not allow incorporate more Na into the nanoparticles.
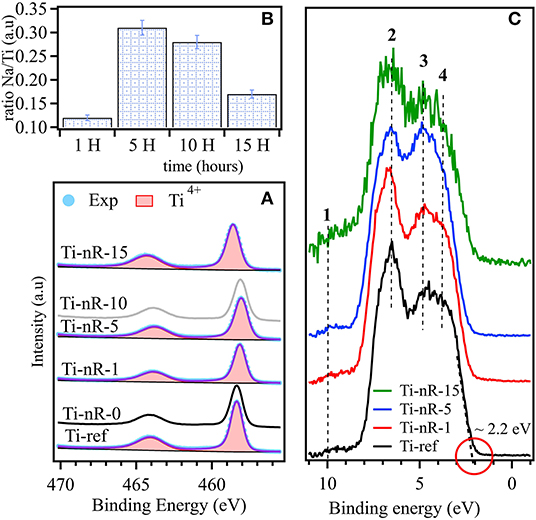
Figure 7. (A) Na/Ti XPS chemical surface ratio, (B) XPS spectra of Ti 2p for Ti-ref, Ti-nR-0, Ti-nR-1, Ti-nR-5, Ti-nR-10 and Ti-nR-15. (C) XPS valence band corresponding to Ti-ref, Ti-nR-1, Ti-nR-5, and Ti-nR-15.
Figure 7B shows the XPS spectra of the Ti 2p core level obtained from Ti-ref, Tin-R-0, TinR-1, TinR-5, TinR-10, and TinR-15. The Ti 2p state was fitted using a Doniach Sunjic line-shape. The choice of this function is based on strong electron-hole interaction responsible for the asymmetric character of this state. XPS analysis on Ti 2p core level (Figure 7B) revealed the presence of Ti4+ for all the samples, Ti 2p3/2 is located at ~458.3 eV this position is consistent with anatase and rutile phases (Georgakopoulos et al., 2019). Trivalent Ti3+ is an unstable phase at the surface of TiO2 then is difficult to observe by XPS. Therefore, a valence band (VB) analysis was carried out in order to get insight into occupied electronic states.
Figure 7C exhibits the XPS-VB obtained from Ti-ref, TinR-1, TinR-5, and TinR-15. For all spectra, the baseline was corrected using a Tougaard background function. The VB maximum (EVBmax) was obtained at ~2.2 eV for all the samples following the method developed by Maheu et al. (2018). At low binding energy it was detected four significant contributions labeled from 1 to 4, as proposed by Fleming on TiO2/Si(100) (Fleming et al., 2007). The electronic state labeled in Figure 7C as 1 is located at ~11 eV this state is normally associated with OH groups (Sanjinés et al., 1994). The other three states (2, 3, and 4) could be interpreted using molecular orbital approximations (Goodenough, 1971). Highlighting the work of Asahi et al. (2000), the electronic states 2 and 3 could be associated with the hybridized bonding orbitals meanwhile the contribution 4 is related to O 2p orbitals located at ~1 eV below the energy of maximum value of VB (EVBmax) this contribution arises from the hybridized non-bonding orbitals. The position of occupied states in the VB may not be sensitive to HTT or Na insertion. Therefore, the energy variations in the bandgap are coming from the unoccupied states. Our UV-vis results in section Diffuse reflectance UV-vis spectroscopy, gave us light about this matter since the spectra for the Ti-ref and Ti-nR-0 presented octahedral and tetrahedral coordination. Then, after the hydrothermal treatment, it seems that the octahedral coordination contribution was drastically reduced, remaining only, which appears to be the tetrahedral coordination. Nevertheless, this phenomenon seems to be only an apparent effect provided by Na intercalated ions. In any case, the shift observed is further related to a change in coordination and not to the presence of Ti3+ species under the experimental conditions of XPS analysis (non-reducing environment).
CO2 Catalytic Hydrogenation
The CO2 hydrogenation activity measurements were performed in the temperature range of 300–340°C over Ti-nR-x catalysts, and the results are presented in Figure 8. The differential reactions rates of the catalytic hydrogenation of CO2 to produce CO, CH4, CH3OH, and C2-C4 hydrocarbons are presented in Table S3. Under the experimental conditions used in this work, we observed all the products listed before. Among them, the production of methanol would be preferred because of its industrial interest (László et al., 2019).
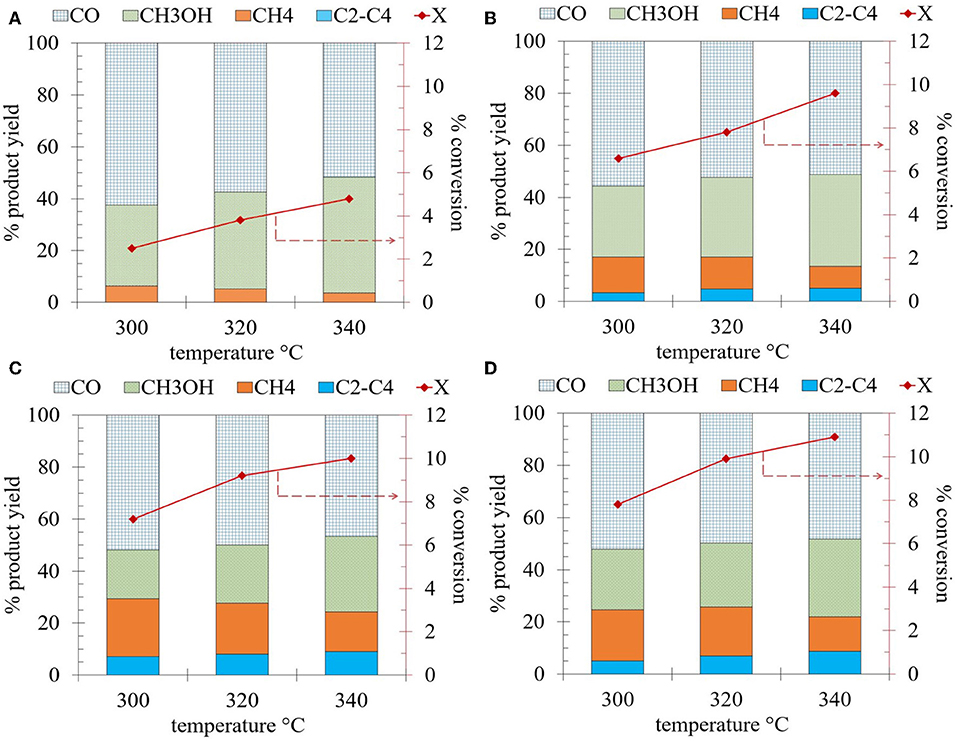
Figure 8. Conversion of CO2 and yield of products over the Ti-nR-x series catalysts: (A) Ti-nR-5, (B) Ti-nR-10, (C) Ti-nR-15, and (D) Ti-nR-30.
Initially, and for comparison, the Ti-ref sample was also tested, and its activity is provided in the supplementary information as Figure S3. The Ti-ref (raw material) exhibited about 6% of CO2 conversion at 300°C and as expected the conversion increased to around 8 and 9% with an increase in temperature of 320°C and 340°C, respectively. In the case of the yield, the main product, irrespective of the reaction temperature, resulted in carbon monoxide as reported for similar materials (János et al., 2019). However, the CO selectivity decreased from 68.5 to 61.3% with an increase in the reaction temperature from 300–340°C as well the C2-C4 product yield decreased from 18.2 to 4.5%. Both changes favored at the same time a drastic increase in the yield to methanol from 2.1 to 25% in the same range of temperatures.
In the case of the Ti-nR-5 catalyst, lower CO2 conversion was observed (max. of 4.8% at 340°C) in comparison to the Ti-ref sample (Figure 8A). However, the yield toward methanol considerably increased to 44.7%. The yield toward CO and CH4 resulted in 51.7% and 3.6%, respectively, and no C2-C4 hydrocarbons were observed for this catalyst at 340°C. The lower conversions for the Ti-nR-5 sample might be due to the incorporation of the Na ions into the nanostructures, which resulted in a wide variation in its structural, morphological, and electronic properties in comparison to the raw TiO2 nano-powder material. While, in the case of Ti-nR-10, Ti-nR-15, and Ti-nR-30 catalysts (increase in HTT time, Figures 8B–D), at all the reaction temperatures slightly high CO2 conversions were observed in comparison to the Ti-ref sample and the highest conversion was achieved at 340°C. The conversion of CO2 could be correlated to the hydrothermal treatment time. As seen, with the increase in the HTT larger is the CO2 conversion, which reaches a maximum of 10.9% in the case of Ti-nR-30 catalyst. The conversions observed are in the range of other reported values for similar materials (Wang et al., 2017; Guzmán-Cruz et al., 2019). Although the yield to methanol decreased with increase in the HTT time. The methanol yield was near to 35% in the case of the Ti-nR-10 catalyst and remains constant (about 29-30%) for the Ti-nR-15 and Ti-nR-30 catalysts. We can conclude from this results that the best catalytic performance in the CO2 hydrogenation is provided by Ti-nR-30 catalyst because the conversion resulted near to 11% at 340°C and at the same time showing an excellent yield toward methanol (30%).
Discussion
The electronic properties, the high surface area, and its cation exchange capacity become the 1D titanates nanostructures of paramount importance in the catalysis field. There is the possibility to use it for a wide variety of applications such as supports for Au single atoms and clusters as well for other metals, for the photocatalytic transformation of CH4 and CO2 hydrogenation among several others (János et al., 2019). In this work, we systematically analyze the genesis, formation mechanism, and the general physicochemical and catalytic properties of 1D sodium titanates. For example, we observe that increasing the time of thermal hydrotreatment of the commercial titania nano-powder several changes occur in its morphology, in its crystalline structure, and its textural and electronic properties. The mechanism of nanostructures formation by hydrothermal treatment with NaOH of TiO2 nanoparticles is delamination first to form nanosheets of titanates, and then a reassemble by peeling and scrolling goes forward in nanotubes (Lee et al., 2014).
Nevertheless, we observed that the structural changes and shaping are hydrothermal treatment time-dependent. Indeed, we detected the formation of the nanosheets in short times (Ti-nR-5), as displayed in Figures 2b–d. Afterward, the scission of nanosheets conducted directly to the 1D type nanorods after 30 h (Ti-nR-30). We did not observe the formation of any scrolled structure or tube, as mentioned by literature, at least not until the maximum time of hydrothermal synthesis (30 h).
The nanosheets found in TEM analysis indicated that the crystalline phase in it is different from that observed in the precursor sample. The intercalation of Na ions between the unitary cells of TiO2 derived in the increase in the interplanar distances. Although, the Na content does not increase linearly with the thermal treatment time as we observed via ICP measurements and confirmed by XPS analysis. The chemical attack of NaOH to the structures rather induce the scission of the nanosheets, keeping low the Ti/Na ratios (Table S2), confirming that low Ti/Na ratios could be related to titanates structures (Wu et al., 2018; Liu et al., 2019), same that was confirmed with the XRD and Raman analyses, as exhibited in Figure S1 and Figure 7, respectively. In the case of the surface area, the increase was almost linear after 5 h of thermal treatment time passing from 51 m2g−1 in the reference sample to 150 m2g−1 in the case of the Ti-nR-30 sample (see Table 1). However, this increase in the general textural properties is not only related to the morphological shape transformation but also the formation of interconnected networks of the 1D nanorods (Díaz de León et al., 2014; Guzmán-Cruz et al., 2019).
Several authors reported that Ti3+ and oxygen vacancy are related to defect sites in titanates making it generally more active in applications that need electron donor behavior (Wang et al., 2011), in this sense, we carried out the XPS analysis to confirmed the absence of Ti3+ in all samples. The XPS analysis revealed the presence of one Ti 2p3/2 species at 458.6 eV; this position is consistent with Ti4+ in anatase and rutile phases but not with the Ti3+. We observed slight variations on the Ti 2p3/2 position to lower binding energies with the increase in the HTT. This observation could be related to the presence of a more electron-rich state of the Ti4+ and the formation of a negative charge layer induced by the presence of Na+ interlayer cations (Meroni et al., 2017).
Related materials have been tested for the CO2 thermal hydrogenation (Guzmán-Cruz et al., 2019; János et al., 2019; László et al., 2019) exploring the reverse water gas shift reaction as a first approximation of reaction mechanism. In it, the CO2 dissociates in CO and O over the more metallic sites. In this case, the CO, recently formed, desorbs from the catalytic site and the O form water with another molecular H2 available in the proximity. Nevertheless, our experimental results not only reported the formation of CO but also the production of methane and methanol on the Ti-nR-x series. Then the mechanism for the hydrogenation of CO2 molecule over the Ti-nR-x catalyst could be adopted from that one reported recently for similar materials such as AlTi-nR-x (Guzmán-Cruz et al., 2019), and ZnO–ZrO2 catalysts (Wang et al., 2017). In those works, it was reported that the H2 reduction ambient removes first the surface hydroxyl groups and lattice oxygens forming water. Afterward, the CO2 interacts with the free electrons of the more electron-rich state of the Ti4+ induced by the presence of Na+ forming -COOH on catalysts surface. Further hydrogenation of this formates completes the plausible mechanism.
Conclusions
In this work, TiO2-sodium titanates nanorods (Ti-nR-x) have been successfully prepared by means of the hydrothermal method at various intervals of time. The general characterization results revealed the transformation and growth mechanism of the sodium titanates 1D nanorods. We observed the evolution of the crystalline phases and the incorporation of sodium ions into the tetrahedral unit cell to form the 2D nanosheets. This Na intercalation promotes the subsequent formation of the 1D nanorods by its scission. Electronically, the shift to lower binding energies was provided by a more electron-rich state of the Ti4+ species. The results of the optical characterization showed that the energy gap increases with the aging time of the samples confirming the intercalation of the Na ions resulting in the observed decrease in the conductor character. The catalytic activity measurements revealed an almost linear function with the hydrothermal treatment time of synthesis. The intercalation of the Na+ ions seems to provide an excellent electronic ambient in which the H2 and CO2 molecules might be activated on adjacent metal active sites (Ti*) produced under experimental conditions through water removal from the surface. We conclude that such 1D type sodium titanates with nanorods shape are suitable for the intended CO2 hydrogenation to decrease the greenhouse effect and produce value-added products, it is also clear that its properties could be of great interest in other fields as photocatalysis, sensors, dye-sensitized solar cells among several others.
Data Availability Statement
The datasets generated for this study are available on request to the corresponding author.
Author Contributions
JD: original writing, review, and editing. JRR and JR: synthesis and general characterization. YE-B: Raman analysis and discussion. LC: XPS analysis, writing, and discussion. CR: writing and discussion. GA-N: discussion. SF-M: conceptualization and supervision.
Funding
To SENER-CONACyT 117373, DGAPA-PAPIIT IA101018, and DGAPA-PAPIME PE100318.
Conflict of Interest
The authors declare that the research was conducted in the absence of any commercial or financial relationships that could be construed as a potential conflict of interest.
Acknowledgments
To F. Ruiz, E. Smolentseva, E. Aparicio, and D. Dominguez who contributed with their expert technical assistance.
Supplementary Material
The Supplementary Material for this article can be found online at: https://www.frontiersin.org/articles/10.3389/fchem.2019.00750/full#supplementary-material
References
Al-Mamun, M. R., Kader, S., Islam, M. S., and Khan, M. Z. H. (2019). Photocatalytic activity improvement and application of UV-TiO2 photocatalysis in textile wastewater treatment: a review. J. Environ. Chem. Eng. 7:103248. doi: 10.1016/j.jece.2019.103248
Asahi, R., Taga, Y., and Mannstadt, W. (2000). Electronic and optical properties of anatase. Phys. Rev. 61, 7459–7465. doi: 10.1103/PhysRevB.61.7459
Balachandran, U., and Eror, N. G. (1982). Raman spectra of titanium dioxide. J. Solid State Chem. 42, 276–282. doi: 10.1016/0022-4596(82)90006-8
Barton, D. G., Max, S., Ryan Wilson, D., Stuart Soled, L., and Enrique, I. (1999). Structure and electronic properties of solid acids based on tungsten oxide nanostructures. J. Phys. Chem. 103, 630–640. doi: 10.1021/jp983555d
Bavykin, D. V., Valentin, P. N., Alexei, L. A., and Frank, W. C. (2004). The effect of hydrothermal conditions on the mesoporous structure of TiO2 nanotubes. J. Mater. Chem. 14, 3370–3377. doi: 10.1039/b406378c
Bian, H., Ma, S., Sun, A., Xu, X., Yang, G., Gao, J., et al. (2015). Characterization and acetone gas sensing properties of electrospun TiO2 nanorods. Superlat. Microstruct. 81, 107–113. doi: 10.1016/j.spmi.2015.01.022
Burungale, V. V., Satale, V. V., More, A. J., Sharma, K. K., Kamble, A. S., and Kim, J. H. (2016). Studies on effect of temperature on synthesis of hierarchical TiO2 nanostructures by surfactant free single step hydrothermal route and its photoelectrochemical characterizations. J. Colloid Interface Sci. 470, 108–116. doi: 10.1016/j.jcis.2016.02.026
Cai, Y., En Wang, H., Jin, J., Zhuan Huang, S., Yu, Y., Yu, L., et al. (2015). Hierarchically structured porous TiO2 spheres constructed by interconnected nanorods as high performance anodes for lithium ion batteries. Chem. Eng. J. 281, 844–851. doi: 10.1016/j.cej.2015.06.122
Capel-Sanchez, M. C., Campos-Martin, J. M., Fierro, J. L. G., De Frutos, M. P., and Padilla Polo, A. (2000). Effective alkene epoxidation with dilute hydrogen peroxide on amorphous silica-supported titanium catalysts. Chem. Commun. 10, 855–856. doi: 10.1039/b000929f
Cheng, X., Liu, H., Chen, Q., Li, J., and Yu, X. (2013). Comparative study of photocatalytic performance on different TiO 2 nano-tubes arrays. J. Alloys Compounds 566, 120–124. doi: 10.1016/j.jallcom.2013.02.150
Choi, K., Ho Lee, S., Young Park, J., Young Choi, D., Ho, H., In Hwa Lee, C., et al. (2013). Fabrication and characterization of hollow TiO2 fibers by microemulsion electrospinning for photocatalytic reactions. Mater. Lett. 112, 113–116. doi: 10.1016/j.matlet.2013.08.101
Das, K., Panda, K. S., and Chaudhuri, S. (2008). Solvent-controlled synthesis of TiO2 1D nanostructures: growth mechanism and characterization. J. Crystal Growth 310, 3792–3799. doi: 10.1016/j.jcrysgro.2008.05.039
Díaz de León, J. N., Petranovskii, V., De Los Reyes, J. A., Alonso-Nuñez, G., Zepeda, A. T., Fuentes, S., et al. (2014). One dimensional (1D) γ-alumina nanorod linked networks: synthesis, characterization and application. Appl. Catal. 472, 1–10. doi: 10.1016/j.apcata.2013.12.005
Doeff, M. M., Cabana, J., and Shirpour, M. (2014). Titanate anodes for sodium ion batteries. J. Inorganic Organomet. Polym. Mater. 24, 5–14. doi: 10.1007/s10904-013-9977-8
Dong, R., Na, C., Wang, X., Zhang, H., Li, Z., Chen, Z., et al. (2016). Sequential growth of rutile TiO2 nanorods and anatase TiO2 nanoparticles on TiO2/SiO2 template spheres. Mater. Chem. Phys. 174, 81–90. doi: 10.1016/j.matchemphys.2016.02.054
Erdogan, N., Ozturk, A., and Park, J. (2016). Hydrothermal synthesis of 3D TiO 2 nanostructures using nitric acid: characterization and evolution mechanism. Ceram. Int. 42, 5985–5994. doi: 10.1016/j.ceramint.2015.12.148
Fleming, L., Fulton, C. C., Lucovsky, G., Rowe, J. E., Ulrich, M. D., and Lüning, J. (2007). Local bonding analysis of the valence and conduction band features of articles you may be interested. J. Appl. Phys. 102:33707. doi: 10.1063/1.2764004
Georgakopoulos, T., Todorova, N., Karapati, S., Pomoni, K., and Trapalis, C. (2019). Photoconductivity studies on surface modified TiO2 nanoparticles. Mater. Sci. Semiconduct. Proce. 99, 175–181. doi: 10.1016/j.mssp.2019.04.027
Goodenough, J. B. (1971). Metallic oxides. Prog. Solid State Chem. 5, 145–399. doi: 10.1016/0079-6786(71)90018-5
Guzmán-Cruz, M. A., Ramesh-Kumar, C., Acosta-Alejandro, M., Frías-Márquez, D. M., Domiguez, D., and Díaz de León (2019). Synthesis of aluminium doped Na-titanate nanorods and its application as potential CO2 hydrogenation catalysts. Catal. Lett. 0123456789. doi: 10.1007/s10562-019-02902-8
Ilie, A. G., Scarisoareanu, M., Morjan, I., Dutu, E., Badiceanu, M., and Mihailescu, I. (2017). Principal component analysis of raman spectra for TiO 2 nanoparticle characterization. Appl. Surface Sci. 417, 93–103. doi: 10.1016/j.apsusc.2017.01.193
János, K., Kukovecz, Á., and Kónya, Z. (2019). Beyond nanoparticles: the role of sub-nanosized metal species in heterogeneous catalysis. Catal. Lett. 149, 1441–1454. doi: 10.1007/s10562-019-02734-6
Ji, Y., and Luo, Y. (2016). New mechanism for photocatalytic reduction of CO2 on the anatase TiO2(101) surface: the essential role of oxygen vacancy. J. Am. Chem. Soc. 138, 15896–15902. doi: 10.1021/jacs.6b05695
Kathirvel, S., Su, C., Jen Shiao, Y., Fen Lin, Y., Ren Chen, B., and Ren Li, W. (2016). Solvothermal synthesis of TiO2 nanorods to enhance photovoltaic performance of dye-sensitized solar cells. Solar Energy 132, 310–320. doi: 10.1016/j.solener.2016.03.025
Khan, S. U. M., and Sultana, T. (2003). Photoresponse of N-TiO2 thin film and nanowire electrodes. Solar Energy Mater. Solar Cells 76, 211–221. doi: 10.1016/S0927-0248(02)00394-X
Kukovecz, Á., Kordás, K., Kiss, J., and Kónya, Z. (2016). Atomic scale characterization and surface chemistry of metal modified titanate nanotubes and nanowires. Surface Sci. Rep. 71, 473–546. doi: 10.1016/j.surfrep.2016.06.001
László, B., Baán, K., Ferencz, Z., Galbács, G., Oszkó, A., Kónya, Z., et al. (2019). Gold size effect in the thermal-induced reaction of CO2 and H2 on Titania- and Titanate nanotube-supported gold catalysts. J. Nanosci. Nanotechnol. 19, 470–477. doi: 10.1166/jnn.2019.15772
Lee, K., Mazare, A., and Schmuki, P. (2014). One-dimensional titanium dioxide nanomaterials: nanotubes. Chem. Rev. 114, 9385–9454. doi: 10.1021/cr500061m
Liu, L. Y., Ding, Y., Zhou, B., Ning Jia, N., Wang, K., Hua Zhang, Z., et al. (2019). Na2Ti7O15 nanowires with an oriented tunnel structure and high mechanical stability: a potential anode of sodium-ion batteries and gas sensing materials. Appl. Sci. 9:1673. doi: 10.3390/app9081673
López, R., and Gómez, R. (2012). Band-gap energy estimation from diffuse reflectance measurements on sol-gel and commercial TiO2: a comparative study. J. Sol-Gel Sci. Tech. 61, 1–7. doi: 10.1007/s10971-011-2582-9
Ma, W., Lu, Z., and Zhang, M. (1998). Investigation of structural transformations in nanophase titanium dioxide by raman spectroscopy. Appl. Phys. 66, 621–627. doi: 10.1007/s003390050723
Maheu, C., Cardenas, L., Puzenat, E., Afanasiev, P., and Geantet, C. (2018). UPS and UV spectroscopies combined to position the energy levels of TiO2 anatase and rutile nanopowders. Phys. Chem. Chem. Phys. 20, 25629–25637. doi: 10.1039/C8CP04614J
Marien, C. B. D., Cottineau, T., Robert, D., and Drogui, P. (2016). TiO2 nanotube arrays: influence of tube length on the photocatalytic degradation of paraquat. Appl. Catal. 194, 1–6. doi: 10.1016/j.apcatb.2016.04.040
Meroni, D., Lo Presti, L., Di Liberto, G., Ceotto, M., Acres, R. G., Prince, K. C., et al. (2017). A close look at the structure of the TiO 2 -APTES interface in hybrid nanomaterials and its degradation pathway: an experimental and theoretical study. J. Phys. Chem. 121, 430–440. doi: 10.1021/acs.jpcc.6b10720
Neelakanta Reddy, I., Sridhara, N., Bera, P., Anandan, C., Kumar Sharma, A., and Dey, A. (2015). Nanostructured alumina films by E-beam evaporation. Ceram. Int. 41, 10537–10546. doi: 10.1016/j.ceramint.2015.04.147
Pan, Y. X., Mei, D., Jun Liu, C., and Ge, Q. (2011). Hydrogen adsorption on Ga2O3 surface: a combined experimental and computational study. J. Phys. Chem. 115, 10140–10146. doi: 10.1021/jp2014226
Paszkiewicz, M., Łuczak, J., Lisowski, W., Patyk, P., and Zaleska-Medynska, A. (2016). The ILs-assisted solvothermal synthesis of TiO 2 spheres: the effect of ionic liquids on morphology and photoactivity of TiO2. Appl. Catal. 184, 223–237. doi: 10.1016/j.apcatb.2015.11.019
Qian, L., Zu Ling, D., Sheng, Y. Y, and Zhen Sheng, J. (2005). Raman study of titania nanotube by soft chemical process. J. Mol. Struct. 749, 103–7. doi: 10.1016/j.molstruc.2005.04.002
Reddy, M. K., Sunkara Manorama, V., and Ramachandra Reddy, A. (2002). Bandgap studies on anatase titanium dioxide nanoparticles. Mater. Chem. Phys. 78, 239–245. doi: 10.1016/S0254-0584(02)00343-7
Saber, O. (2016). New trend for synthesizing of magnetic nanorods with titanomaghemite structure. J. Magnet. Magnet. Mater. 410, 10–17. doi: 10.1016/j.jmmm.2016.03.010
Sanjinés, R., Tang, H., Berger, H., Gozzo, F., Margaritondo, G., and Lévy, F. (1994). Cite As. J. Appl. Phys. 75, 2945–2951. doi: 10.1063/1.356190
Shen, L., Bao, N., Zheng, Y., Gupta, A., An, T., and Yanagisawa, K. (2008). Hydrothermal splitting of titanate fibers to single-crystalline TiO2 nanostructures with controllable crystalline phase, morphology, microstructure, and photocatalytic activity. J. Phys. Chem. 112, 8809–8818. doi: 10.1021/jp711369e
Shin, H. U., Lolla, D., Nikolov, Z., and Chase, G. G. (2016). Pd-Au nanoparticles supported by TiO2 fibers for catalytic NO decomposition by CO. J. Indust. Eng. Chem. 33, 91–98. doi: 10.1016/j.jiec.2015.09.020
Silva, F. L., Azevedo Araújo Filho, A., Bezerra da Silva, M., Balzuweit, K., Louis Bantignies, J., Wagner Santos Caetano, E., et al. (2018). Polarized raman, FTIR, and DFT study of Na2Ti3O7 microcrystals. J. Raman Spectrosc. 49, 538–548. doi: 10.1002/jrs.5316
Sun, Z., Ho Kim, J., Zhao, Y., Bijarbooneh, F., Malgras, V., Lee, Y., et al. (2011). Rational design of 3D dendritic TiO2 nanostructures with favorable architectures. J. Am. Chem. Soc. 133, 19314–19317. doi: 10.1021/ja208468d
Viculis, L. H., Mack, J., and Kaner, R. B. (2003). A chemical route to carbon nanoscrolls. Science 299:1361. doi: 10.1126/science.1078842
Wang, G., Wang, H., Ling, Y., Tang, Y., Yang, X., Fitzmorris, R. C., et al. (2011). Hydrogen-treated TiO2 nanowire arrays for photoelectrochemical water splitting. Nano Lett. 11, 3026–3033. doi: 10.1021/nl201766h
Wang, J., Li, G., Li, Z., Tang, C., Feng, Z., An, H., et al. (2017). A highly selective and stable ZnO-ZrO2 solid solution catalyst for CO2 hydrogenation to methanol. Sci. Adv. 3, 1–11. doi: 10.1126/sciadv.1701290
Wang, W., Varghese, O. K., Paulose, M., and Grimes, C. A. (2004). A study on the growth and structure of titania nanotubes. J. Mater. Res. 19, 417–422. doi: 10.1557/jmr.2004.19.2.417
Wang, X., Li, Y., Gao, Y., Wang, Z., and Chen, L. (2015). Additive-free sodium titanate nanotube array as advanced electrode for sodium ion batteries. Nano Energy 13, 687–692. doi: 10.1016/j.nanoen.2015.03.029
Wu, C., Hua, W., Zhang, Z., Zhong, B., Yang, Z., Feng, G., et al. (2018). Design and synthesis of layered Na 2 Ti 3 O 7 and tunnel Na 2 Ti 6 O 13 hybrid structures with enhanced electrochemical behavior for sodium-ion batteries. Adv. Sci. 5:1800519. doi: 10.1002/advs.201800519
Wu, D., Liu, J., Zhao, X., Li, A., Chen, Y., and Ming, N. (2006). Sequence of events for the formation of titanate nanotubes, nanofibers, nanowires, and nanobelts. Chem. Mater. 18, 547–553. doi: 10.1021/cm0519075
Yao, B. D., Chan, Y. F., Zhang, X. Y., Zhang, W. F., Yang, Z. Y., and Wang, N. (2003). Formation mechanism of TiO2 nanotubes. Appl. Phys. Lett. 82, 281–283. doi: 10.1063/1.1537518
Ye, J., Liu, C., and Ge, Q. (2012). DFT study of CO2 adsorption and hydrogenation on the in2O3 surface. J. Phys. Chem. 116, 7817–7825. doi: 10.1021/jp3004773
Ye, J., Liu, C., Mei, D., and Ge, Q. (2013). Active oxygen vacancy site for methanol synthesis from CO2 hydrogenation on In2O3, a DFT study. ACS Catal. 3, 1296–1306. doi: 10.1021/cs400132a
Yu, J., Xiang, Q., and Zhou, M. (2009). Preparation, characterization and visible-light-driven photocatalytic activity of Fe-doped titania nanorods and first-principles study for electronic structures. Appl. Catal. 90, 595–602. doi: 10.1016/j.apcatb.2009.04.021
Zhang, S., Peng, L. M., Chen, Q., Du, G. H., Dawson, G., and Zhou, W. Z. (2003). Formation mechanism of H2Ti3O7 nanotubes. Phys. Rev. Lett. 91, 2–5. doi: 10.1103/PhysRevLett.91.256103
Zhang, X., Li, D., Wan, J., and Yu, X. (2016). Hydrothermal synthesis of TiO2 nanosheets photoelectrocatalyst on Ti mesh for degradation of norfloxacin: influence of pickling agents. Mater. Sci. Semiconduct. Proc. 43, 47–54. doi: 10.1016/j.mssp.2015.11.020
Zhang, Y., Jiang, Z., Huang, J., Lim, L. Y., Li, W., Deng, J., et al. (2015). Titanate and Titania nanostructured materials for environmental and energy applications: a review. RSC Adv. 5, 79479–79510. doi: 10.1039/C5RA11298B
Keywords: CO2, titanates, TiO2, hydrogenation, greenhouse, global warming
Citation: Díaz de León JN, Rodríguez JR, Rojas J, Esqueda-Barrón Y, Cardenas L, Ramesh Kumar C, Alonso-Nuñez G and Fuentes-Moyado S (2019) New Insight on the Formation of Sodium Titanates 1D Nanostructures and Its Application on CO2 Hydrogenation. Front. Chem. 7:750. doi: 10.3389/fchem.2019.00750
Received: 27 August 2019; Accepted: 21 October 2019;
Published: 08 November 2019.
Edited by:
Salete S. Balula, Chemistry and Technology Network (REQUIMTE), PortugalReviewed by:
Zoltán Kónya, University of Szeged, HungaryZhongchang Wang, International Iberian Nanotechnology Laboratory (INL), Portugal
Copyright © 2019 Díaz de León, Rodríguez, Rojas, Esqueda-Barrón, Cardenas, Ramesh Kumar, Alonso-Nuñez and Fuentes-Moyado. This is an open-access article distributed under the terms of the Creative Commons Attribution License (CC BY). The use, distribution or reproduction in other forums is permitted, provided the original author(s) and the copyright owner(s) are credited and that the original publication in this journal is cited, in accordance with accepted academic practice. No use, distribution or reproduction is permitted which does not comply with these terms.
*Correspondence: J. Noé Díaz de León, bm9lamRAY255bi51bmFtLm14