 Jihyeun Lee
 Surendra Kumar
 Sang-Yoon Lee
 Sung Jean Park1
 Mi-hyun Kim
- 1Department of Pharmacy, Gachon Institute of Pharmaceutical Science, College of Pharmacy, Gachon University, Incheon, South Korea
- 2Gachon Advanced Institute for Health Science and Technology, Graduate School and Neuroscience Research Institute, Gachon University, Incheon, South Korea
S100A9 is a potential therapeutic target for various disease including prostate cancer, colorectal cancer, and Alzheimer's disease. However, the sparsity of atomic level data, such as protein-protein interaction of S100A9 with RAGE, TLR4/MD2, or CD147 (EMMPRIN) hinders the rational drug design of S100A9 inhibitors. Herein we first report predictive models of S100A9 inhibitory effect by applying machine learning classifiers on 2D-molecular descriptors. The models were optimized through feature selectors as well as classifiers to produce the top eight random forest models with robust predictability and high cost-effectiveness. Notably, optimal feature sets were obtained after the reduction of 2,798 features into dozens of features with the chopping of fingerprint bits. Moreover, the high efficiency of compact feature sets allowed us to further screen a large-scale dataset (over 6,000,000 compounds) within a week. Through a consensus vote of the top models, 46 hits (hit rate = 0.000713%) were identified as potential S100A9 inhibitors. We expect that our models will facilitate the drug discovery process by providing high predictive power as well as cost-reduction ability and give insights into designing novel drugs targeting S100A9.
Introduction
Drug R&D is currently facing a productivity crisis to overcome low productivity as well as high risk/high return in the context of economics (Scannell et al., 2012; Mullard, 2014; Mignani et al., 2016; Bendtsen et al., 2017). In order to develop an efficient and cost-effective R&D process (Bendtsen et al., 2017), computing and simulations have decreased the traditional resource demand for drug R&D (Kapetanovic, 2008; Bendtsen et al., 2017). In particular, an early stage of drug discovery involves virtual screening (VS) to identify therapeutic targets or hit compounds (Walters et al., 1998; Bajorath, 2002; Oprea and Matter, 2004; Shoichet, 2004). Successful VS depends on the predictive power of predictors and the quality of the virtual library and dataset used. When the 3D-structure of a molecular target is available, structure-based virtual screening (SBVS) is considered prior to ligand-based virtual screening (LBVS) or SBVS/LBVS in combination due to an easy understanding of the predictive (atomic level) model and empirical evidence on bioactive conformation as well as the activity resulting from interaction between a target and a compound (Lavecchia and Di Giovanni, 2013; Sliwoski et al., 2014; Gadhe et al., 2015; Lavecchia, 2015; Jang et al., 2018; Lee et al., 2018; Yadav et al., 2018). Recently, the conceptual advance of drug targeting from “single target” to “protein-protein interactions (PPI),” it is unsatisfactory to obtain atomic level confidence of a novel druggable target with only partial structural information. It is therefore very difficult for researchers to propose a druggable binding site of a new molecular target for drug design without the background science or evidence. Therefore, when promising drug targets have insufficient information or when multiple targets need to be considered together, LBVS is commonly used, where the known active small molecules are used as screening templates. With improvement in the volume, quality, velocity, and accessibility of molecular data, versatile machine learning (ML) algorithms like support vector machine (SVM) (Cortes and Vapnik, 1995), Naïve Bayes (NB) (Domingos and Pazzani, 1997), decision tree (DT) (Breiman, 2017), and ensemble methods, such as random forest (RF) (Breiman, 2001) have contributed to the improvement of LBVS predictors (Geppert et al., 2010; Lo et al., 2018). With these advances, we can expect a diversity of training data like the heterogeneous property of activity index (or assay methods) and structural diversity beyond the congenericity of active compounds. In the case of classification models, selection methods for molecular descriptors (selectors) as well as classification algorithms (classifiers) decide the predictive power and coverage of models (Melville et al., 2009). Therefore, it is natural that multiple trials on various combinations of learning methods and feature sets coupled with raw dataset can facilitate the best performance of classifiers (Stahura and Bajorath, 2005; Domingos, 2012).
The S100 protein family is one of the challengeable drug target candidates (Donato, 2001; Ryckman et al., 2003). They are low molecular weight (ca. 100 amino acids) proteins with high similarity within the subfamily, and comprise two metal-binding EF-hands and a hinge. Due to their biophysical properties, they tend to form protein complexes (e.g., heterodimer like S100A8/S100A9, homodimer like S100B/S100B Donato, 1999), ligand-protein complex like S100A/RAGE complex (Yatime et al., 2016) rather than remaining as a single protein in a cell. Therefore, in the spite of many biological and pathological studies on several S100A9-mediated diseases, such as prostate cancer (Hermani et al., 2005), colorectal cancer (Kim et al., 2009), Alzheimer's disease (Horvath et al., 2015), and other neurodegenerative disorders (Gruden et al., 2017; Iashchishyn et al., 2018), atomic level knowledge is limited for SBVS or structure-based drug design of S100A9 inhibitors. Notably, the characterization of S100A9 complex has been updated, such as the hydrophobic binding of V-RAGE domain into S100A9 homodimer (Chang et al., 2016), V-RAGE domain into S100A9/S100A12 heterodimer (Katte and Yu, 2018) following the first X-ray report (Itou et al., 2002). However, the small molecule, CHAPS of the reports is a detergent (for protein stabilization or solubilizing) rather than a drug inducing functional change of S100A9. In addition, the SPR measurement of Q-compounds recently produces the question, whether the inhibition of Q-compounds is non-specific or specific (Björk et al., 2009; Yoshioka et al., 2016; Pelletier et al., 2018). Therefore, a ligand-based model can is required to compensate current insufficient characterization for targeting S100A9. For the purpose, maximum collection of the available data and selection of the most relevant features should be considered. Very delightfully, competitive inhibitors binding to S100A9 in the presence of the target receptors, such as RAGE, TLR4/MD2, and EMMPRIN (CD147) were reported in three patents (Fritzson et al., 2014; Wellmar et al., 2015, 2016). However, the patents proposed neither a druggable binding site nor different interaction mode between the target receptors. In other words, despite the presence of the inhibitors, no reliable predictive model has been reported to identify novel S100A9 inhibitors.
Based on the S100A9 competitive inhibitors of the patents, we present herein, the first predictive models using multi-scaffolds of competitive inhibitors (binding to the complex of S100A9 with rhRAGE/Fc, TLR4/MD2, or rhCD147/Fc) as a training set. For the purpose, highly efficient feature sets was considered in this study. Even though the input data matrix consisting of a low number of rows (data points/compounds) and a large number of columns (features) is never special in 2D/3D-QSAR or classification models built from limited and insufficient biological data (Guyon and Elisseeff, 2003; Muegge and Oloff, 2006), data processing (filtering, suitability, scaling) and feature selection were considered to remove irrelevant and redundant data (Liu, 2004; Yu and Liu, 2004). Adding a few other features to a sufficient number of features often leads to an exponential increase in prediction time and expense (Koller and Sahami, 1996; Liu and Yu, 2005), and whenever a large screening library is generated, feature generation of the library can be a practical burden. Further, because more irrelevant features hinder classifiers from identifying a correct classifying function (Dash and Liu, 1997), the feature optimization process is essential to increase the learning accuracy of the classifier and to escape the curse of dimensionality that emerge in a consequence of high dimensionality (Bellman, 1966). In addition, versatile machine learning models were built resulting from 5 × 4 × 3 trials: (1) five IC50 thresholds between activeness and inactiveness, (2) four feature selectors, and (3) three classifiers, thereby resulting in comprehensive validation of 60 models. The overall workflow depicted in Figure 1 was designed to select the optimal classification models with the best predictive ability and efficiency. In particular, we tried to gain a golden triangle between cost-effectiveness, speed, and accuracy. For this purpose, compact feature selection was critical for more than six million library screening showing the original data matrix of six million compounds (rows) × ca. 3,000 features (columns).
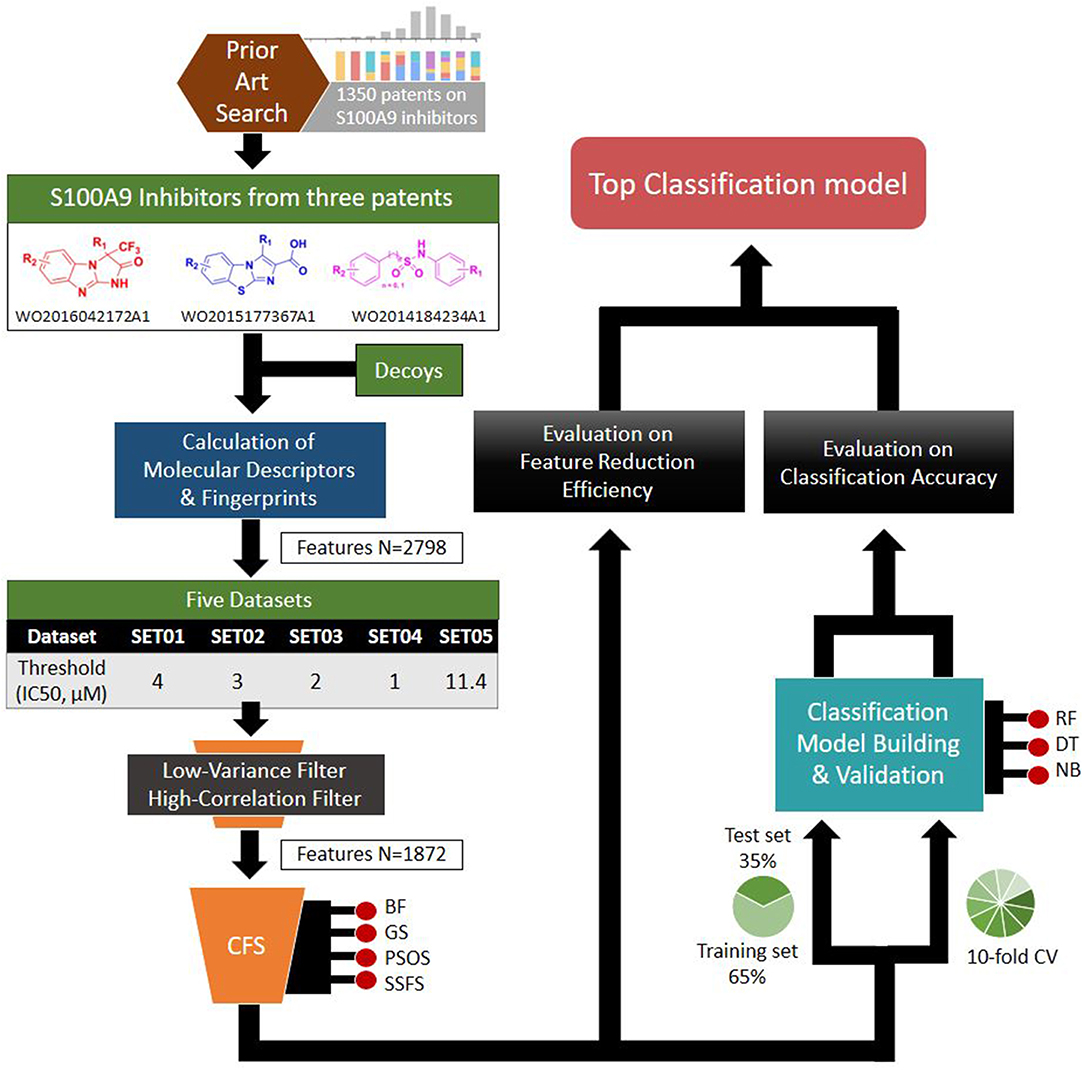
Figure 1. Workflow depicting the process of the top classification model development.
Algorithms and Methods
Datasets
Through patent searching, S100 inhibitors and their respective IC50 values were collected from three different patents. In the patents, even though the inhibitory effect on every complex (the binding complex of S100A9 with hRAGE/Fc, TLR4/MD2, or hCD147/Fc) was measured through the change of resonance units (RU) in surface plasmon resonance (SPR) (Fritzson et al., 2014), IC50 was calculated through the AlphaScreen assay of several concentrations in only biotinylated hS100A9 complex with rhRAGE-Fc (Fritzson et al., 2014; Wellmar et al., 2015, 2016). Therefore, the predicted inhibitory effect of our model means competitive inhibition of S100A9-RAGE in this study. The assay method for IC50 was identical in the three patents. The total number of molecules collected was 266: 115 compounds from WO2011184234A1, 97 compounds from WO2011177367A1, and 54 compounds from WO2012042172A1. The three distinct scaffolds led to the structural diversity of the dataset which was confirmed through the principal component analysis (PCA) of patent molecules (Figure 2). To investigate a more reasonable decision boundary between the activity and inactivity of the inhibitory effect on S100A9, five datasets (SET01, SET02, SET03, SET04, and SET05) were generated with different thresholds of activity (respectively 4, 3, 2, 1, and 11.4 μM of IC50). Insufficient numbers of inactive molecules were compensated by decoys from the DUD-E database (Mysinger et al., 2012), in order to obtain the same size for each dataset (N = 402), with a ratio of 66.17% (N = 266) patent molecules and 33.83% (N = 136) inactive decoy molecules (see Table S1 and Datasheet 1 in Supplementary Materials for SMILES information of the dataset). The activity property was converted to a binominal value according to the threshold of each set for a dichotomous classification. In particular, the activity threshold of 11.4 μM in SET05 is the highest IC50 value among patent molecules, thus making every patent molecule active, and every decoy molecule inactive in SET05.
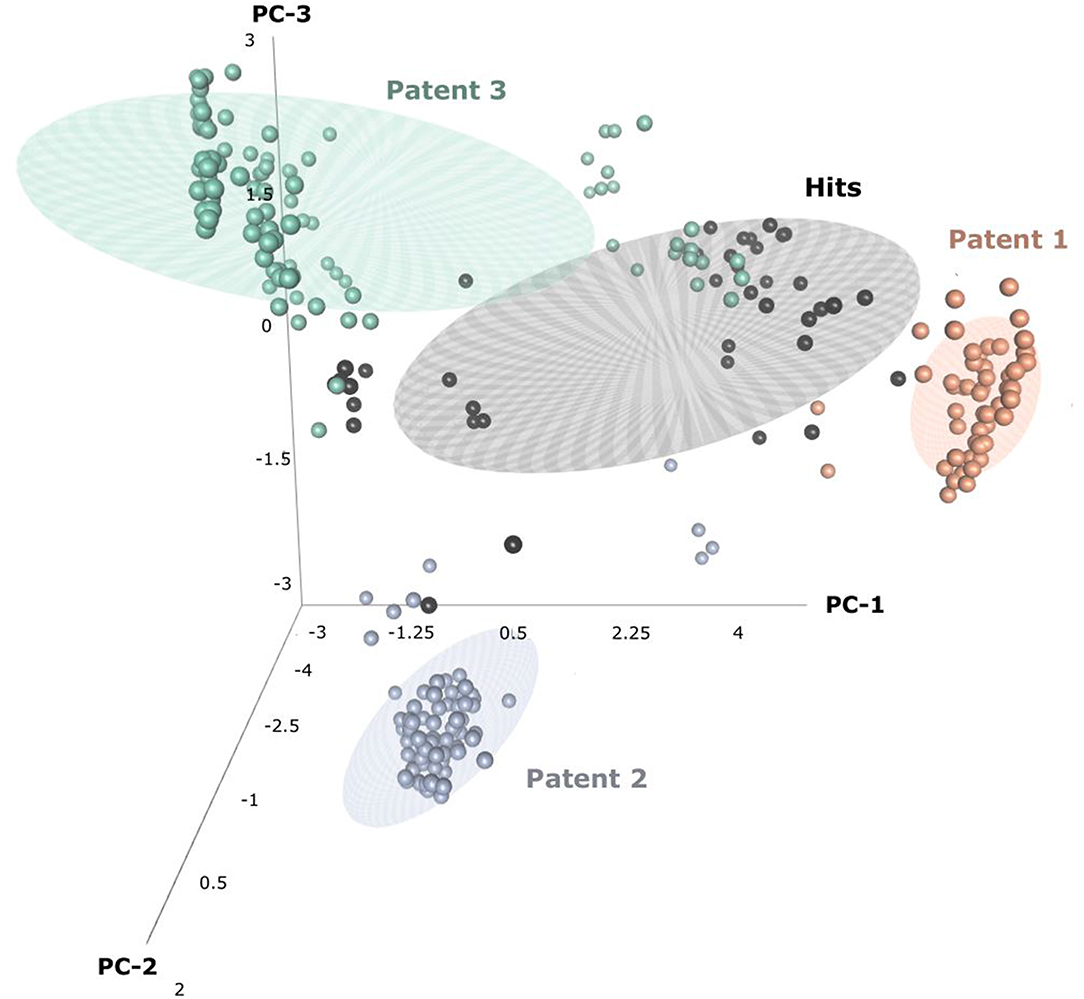
Figure 2. Three-dimensional principal component analysis(PCA) of hits and patent molecules. Patent 1, Patent 2, and Patent 3 refers to WO2015177367A1, WO2014184234A1, and WO2016042172A1.
Descriptor and Fingerprint Calculation
Useful descriptors provide a better understanding of the molecules, and are widely used to construct models to predict certain molecular properties (Glover and Kochenberger, 2006). In our study, 2,798 features were generated using PaDEL-Descriptor ver. 2.21 (PaDEL-Descriptor, Pharmaceutical Data Exploration Laboratory) (Yap, 2011). All kinds of 1D and 2D descriptors were calculated to produce 1,444 features. The remaining features are from three kinds of fingerprints: MACCSFP, 166 bits; PubChemFP, 881 bits; SubstructureFP, 307 bits.
Dimensionality Reduction
To avoid the curse of dimensionality and to enhance the efficiency of the overall predicting process, we applied several strategies to greatly reduce the number of features. Notably, each bit of fingerprint was considered as a single feature in our study; thus, the optimal feature set comprises hybrid fingerprints and descriptors after the feature reduction process. By removing irrelevant bits from the original intact fingerprint, a hybrid fingerprint can achieve increased prediction accuracy as well as reduced computational cost (Williams, 2006; Nisius and Bajorath, 2009, 2010; Singla et al., 2013; Smieja and Warszycki, 2016; Warszycki et al., 2017).
Low-Variance Filter and High-Correlation Filter
In our pre-processing step, we applied two steps of filtering: the low-variance filter and the high-correlation filter. First, to avoid redundancy, features with low variance were removed after normalization. Among 2,797 features, 724 columns with zero variance were removed (Table 1) to obtain a small feature set without reducing the prediction performance. Second, the correlation between two random variables was ranked to obtain Kendall's Tau-a coefficient matrix. Features with strong dependency (τ > 0.9) were removed to ensure maximum dissimilarity between features (Ding and Peng, 2005). Here, 201 columns were removed, leaving 1,872 independent features that were de-normalized for further processing (Table 1).
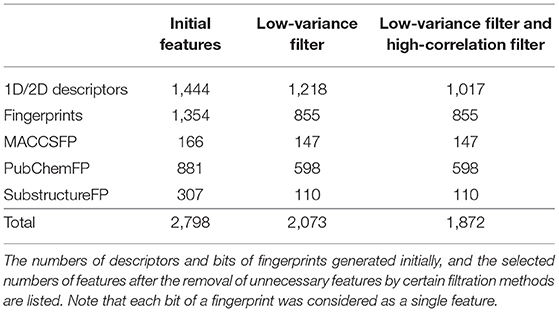
Table 1. The number of features.
Correlation-Based Feature Subset Selection
In addition to the correlation filter, we used a correlation-based feature subset selection method (Hall, 1999) to obtain a compact number of features. Merit, composed of Pearson's correlation formula, is used to evaluate the correlation-based feature selection (CFS) algorithm. To determine subsets containing features that are highly correlated with the class but are uncorrelated with each other, the following merit is calculated along a search:
where Merits is the heuristic merit of subset S containing k features, is the average correlation with the class, and is the average inter-correlation. The subset with the highest merit is selected to obtain features with high predictive ability and low redundancy. Various search algorithms are applicable for improving the efficiency of feature selection (FS) methods. Herein we applied four different search algorithms: best first, genetic search, particle swarm optimization search, and subset size forward selection. To assess the effectiveness of the FS methods, two measurable indexes were selected: the rate of feature reduction and the merit of the best subset found. All calculations were performed in Weka software packages (Weka Environment for Knowledge Analysis ver. 3.6, The University of Waikato, Hamilton, New Zealand) (Hall et al., 2009).
Best First (BF)
Best first search is one of general algorithms for exploiting heuristic information to reduce search times. The general strategy assesses the merit of every candidate feature set exposed during the search, and then continues exploration along the direction of the highest merit (Kohavi and John, 1997). In our study, the search was terminated when an improved node was not found in the last 5 expansions. Also, backtracking was applied to reduce the size of the search space and to allow the algorithm to move toward a more promising subset (Freuder, 1988). Because the running times for the backward search starting from the full set of features could render the approach infeasible, especially if there are many features, forward selection was applied here to achieve cost-effectiveness.
Genetic Search (GS)
The genetic algorithm was first introduced by John Holland (Holland, 1992), and David Goldberg presented an application in 1989 (Goldberg, 1989) that triggered a wide variety of modifications and developments to genetic algorithms (Glover and Kochenberger, 2006). Genetic algorithms derive their name from the fact that they are inspired by the mechanism of natural selection, where the fittest individuals survive to the following generations (Man et al., 1996). Although the search method using genetic theory may result in higher computational costs than other methods, such as best first, it remains popular, because it is relatively insensitive to noise and is well-suited for problems where little knowledge is provided (Vafaie and De Jong, 1992). In this study, the total number of generations was 20, with 20 feature subsets in each generation. The probability of crossover and the mutation rate were set to 0.6 and 0.33, respectively.
Particle Swarm Optimization Search (PSO)
Particle swarm optimization (PSO), suggested by Kennedy and Eberhart in 1995 (Eberhart and Kennedy, 1995), is based on social-psychological principles. Because only a few lines of code and primitive mathematical operators are required, this method has been proved to be highly efficient for application to numerous areas (Shi, 2001). Herein we utilized the geometric particle swarm optimization (GPSO) (Moraglio et al., 2007), where a convex combination was applied to update the positions of particles. In GPSO, three convex weights w1, w2, and w3 are employed, where w1, w2, w3 > 0 and w1+w2+w3 = 1. The function of GPSO can be defined as:
where ĝ is the global optimum and is the local optimum. Each convex weight represents the inertia weight (w1), social weight (w2), and individual weight (w3), which were set to 0.33, 0.33, and 0.34, respectively in our study. The number of particles in the search space and the number of populations in each generation were both set to 20.
Subset Size Forward Selection (SSFS)
Subset size forward selection (SSFS) is an extension of linear forward selection. Through this method, a compact feature set can be obtained from large-scale features with a relatively small number of instances (Gutlein et al., 2009). The optimal size was determined through 5-fold cross-validation with fixed-set linear forward selection, resulting in a reduced error compared to searching in a single training and test set. The number of top-ranked features forming a search space was set to 50.
Machine Learning Classifiers
After selecting the optimal feature sets, three different classifiers (decision tee, random forest, and naïve Bayes) were applied to develop and determine the best classification model for S100 inhibitors. All ML processes and calculations were performed using the KNIME software.
Decision Tree (DT)
The decision tree classifier is a simple and widely comprehensive method that can be constructed relatively quickly compared to other well-known classifiers (Kotsiantis et al., 2007). The scalable parallelizable induction of decision trees (SPRINT) (Shafer et al., 1996), a modified form of the well-known C4.5 (Quinlan, 2014), was applied in this study so that the model can take a large-scale database as an input. The Gini index was measured to determine the root node, which is the best feature that divides the dataset. To avoid overfitting problems, we applied both pre-pruning and post-pruning strategies. For post-pruning process, minimum descriptor length (MDL) pruning was applied here (Rissanen, 1978).
Random Forest (RF)
Random forest (Breiman, 2001) was developed by introducing bootstrap aggregating to decision tree. Trees are built with randomly sampled features to form a forest, and the most voted tree is selected as the optimal classifier. This ensemble learning method can handle high-dimensional data with numerous features. In addition, it is less susceptible to noise and builds a robust model, often outperforming other classifiers (Verikas et al., 2011; Khuri et al., 2017). In this study, features were evaluated based on the information gain ratio to obtain the best splits.
Naïve Bayes
Along with decision trees, naïve Bayes is one of the most popular machine learning methods for classification models. Unlike the canonical Bayesian method, naïve Bayes assumes that all features are independent of each other. Although this “naïve” assumption rarely fits in practice, it has been verified to perform reasonably well in various situations, without the requirement of independence between features (Domingos and Pazzani, 1997). This occurs because the strong false assumption may lead to reduced overfitting (Domingos, 2012). Another advantage of this method is its simplicity and low computational cost (Kotsiantis et al., 2007), which allows one to search in very large databases with high efficiency.
Parameter Optimization
To achieve the best performance, several parameters were optimized prior to the development of predictive models. For each optimization, 10-fold cross-validation was performed with the training set (65% of the original dataset), where the optimal parameters exhibiting the largest area under the curve (AUC) of receiver operating characteristics (ROC) curves were exported to construct the model. The optimized parameters and AUC values are listed in Table 2.
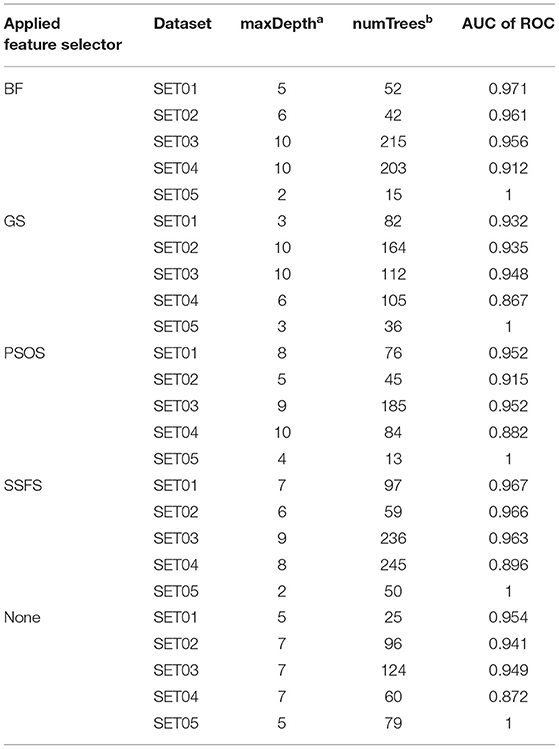
Table 2. The optimized parameters for random forest models and the AUC of ROC values of test set prediction.
Model Validation
To assess the prediction performance of the models, two validation methods were employed: (i) evaluation by test set (35% of the original dataset) and (ii) 10-fold cross-validation of the training set. The AUC of ROC curve and the Matthews correlation coefficient (MCC) were calculated to obtain the top models among every combination of feature selectors and ML classifiers. The MCC value can be defined as:
where TP, TN, FP, and FN refers to true positive, true negative, false positive, and false negative.
In silico Screening of the eMolecules Database
Over past decade, large drug discovery companies have been actively applying high-throughput screening (HTS) to search potent hit molecules (Stahura and Bajorath, 2004; Reddy et al., 2007). However, HTS often demands prior validation and preparation time as well as great expense and facilities. To aid or complement HTS, the VS method should have the ability to select only a small number of potent molecules from a huge database. Thus, the top models that we have chosen previously were further evaluated by in silico screening of a large-scale dataset (N = 6,447,184) from the eMolecules database (http://www.emolecules.com/).
Screening Library
eMolecules provides almost eight million unique compound structures along with the information of vendors of the respective molecules assembled from more than 150 suppliers and manufacturers (Williams, 2008). Many studies have successfully discovered potential hits by screening molecules from this database (Bisignano et al., 2015; Lenselink et al., 2016; Shehata et al., 2016). In our study, 6,447,184 molecules were collected for screening, and split into 33 subsets in order to reduce computing (memory) burdens (Table 3). Features of each subset molecules could be generated based on the optimal features of the top models. First, the upper class of necessary descriptors were calculated, because only the upper class of descriptors can be selected rather than each single feature in PaDEL-Descriptor. Then, using KNIME software, the features needed were chosen to generate the exact same kind of feature set, which was used in top model building.
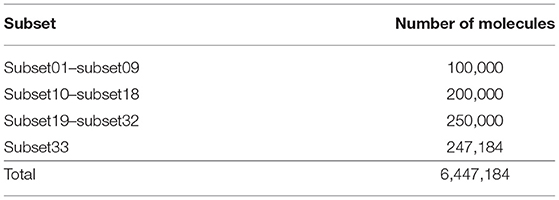
Table 3. The number of molecules from eMolecules database in each subset.
Prediction and Identification of Hits
Each subset with each respective feature set was then used as an input to the random forest predictor, which was built through the learning of patent molecules. Then, the predictor was used to assign possibility as S100A9 inhibitors among the screened molecules. Only molecules with a higher probability than 0.9 of being active than were selected. Overlapped molecules from the consensus of eight top models were collected to obtain the final hits.
Prediction of ADME Properties
Since poor pharmacokinetic profiles and high potential of toxicity are one of the main reasons of failure in drug development, it is crucial to consider such absorption, distribution, metabolism, excretion (ADME) properties in advance to encourage further assays and clinical trials of final hits. Thus, we predicted several drug-likeness and ADME properties of hit molecules using the QikProp module of Maestro 11.4 (Schrodinger Release 2017-4: QikProp, Schrödinger, LLC, New York, NY, 2017). QikProp computes pharmaceutically relevant properties of molecules to help eliminate those with unsatisfactory ADMET profiles. Here, we generated computational properties to ensure the drug-likeness of hits, including molecular weight (MW), LogP, hydrogen bond donor, hydrogen bond acceptor, number of N and O, polar surface area (PSA), and violation of Lipinski's rule of five as well as Jorgensen's rule of three. Also, the apparent Caco-2 cell permeability and MDCK cell permeability was also calculated to investigate intestinal absorption and oral absorption abilities.
Results and Discussion
Reasonable Compression of Features for Predictive Models
In order to compare the performances before and after FS, we could consider predictive power and cost-effectiveness. The efficiency of each feature selection method was evaluated by calculating two measurements: the rate of feature reduction, and the merit.
Feature Reduction
Feature reduction can play an important role in model building due to its ability to greatly reduce computational burden and to increase classification accuracy. Herein the cost-reducing effect of each FS method was evaluated through feature reduction ability. After two serial filtrations which removed 926 features from 2,798 original features, we applied CFS with four different search methods to further obtain a compact and optimal feature sets. The reduction ability of each FS method was evaluated and compared to determine optimal approaches. The selected number of features after each FS method is presented in Table 4. The rates of feature reduction are also shown in Figure 3, which are the number of excluded features divided by the number of features before CFS.
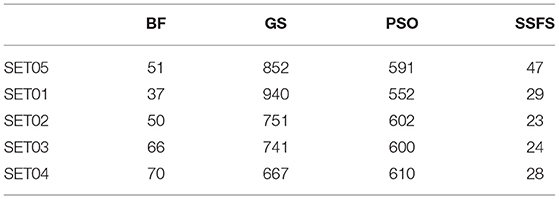
Table 4. The number of selected features after each FS method.
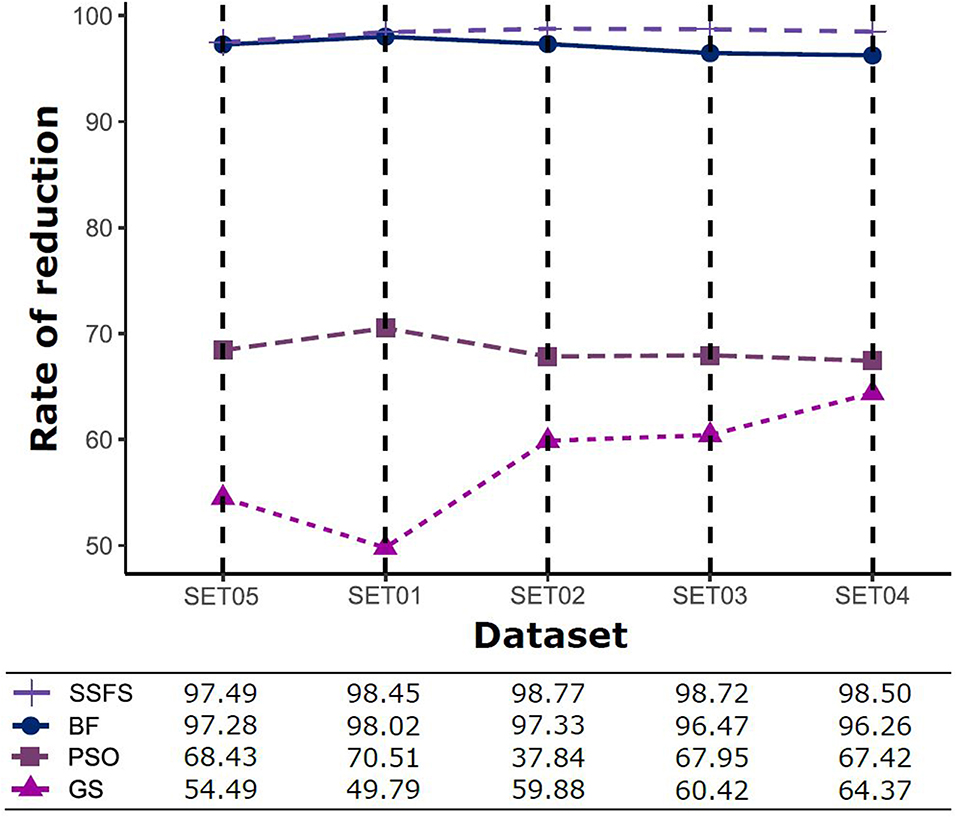
Figure 3. The rates of feature reduction. The reduction rate is the ratio between the number of features removed after FS method and the original number of features before FS method.
As shown in Table 4 and Figure 3, BF and SSFS excluded most of the features with over 96% removal in all five datasets. However, a relatively high number of features remained after GS or PSO, and especially, GS showed the least consistency between subsets (49.786%~64.37%). When comparing between BF and SSFS, the actual number of features is less through SSFS than BF, yet the rates of reduction are similar. In SET03, the number of features remaining after SSFS was 36.36% (N = 24) of that after BF (N = 66). Thus, SSFS is expected to achieve the greatest effectiveness regarding cost reduction, and since the number of features selected is also small enough in BF, it is also expected to have a high efficiency similar to SSFS. The composition of each feature set is shown in Figure 4. See Table S2 in Supplementary Materials for detailed information of the selected features. Due to the large number of original features, autocorrelation (e.g., ATS, AATS, ATSC), Pubchem fingerprint (e.g., PubchemFPxxx), and atom type electrotopological state (e.g., SpMax1_Bhm) could also show the highest relative frequency ratio among 63 descriptor types of 2,798 original features. In addition, with the three type descriptors, burden modified eigenvalues, molecular linear free energy relation, path count, MACCS fingerprint, and substructure fingerprint were commonly chosen through four FS methods. Because fragmented fingerprints and burden modified eigenvalues have relatively large number of original features (96–489 features), molecular linear free energy relation (with 6 features) and path count (with 22 features) are more impact per feature than other descriptors but the descriptors could not exist in every subset (5 subsets × 4 FS method).
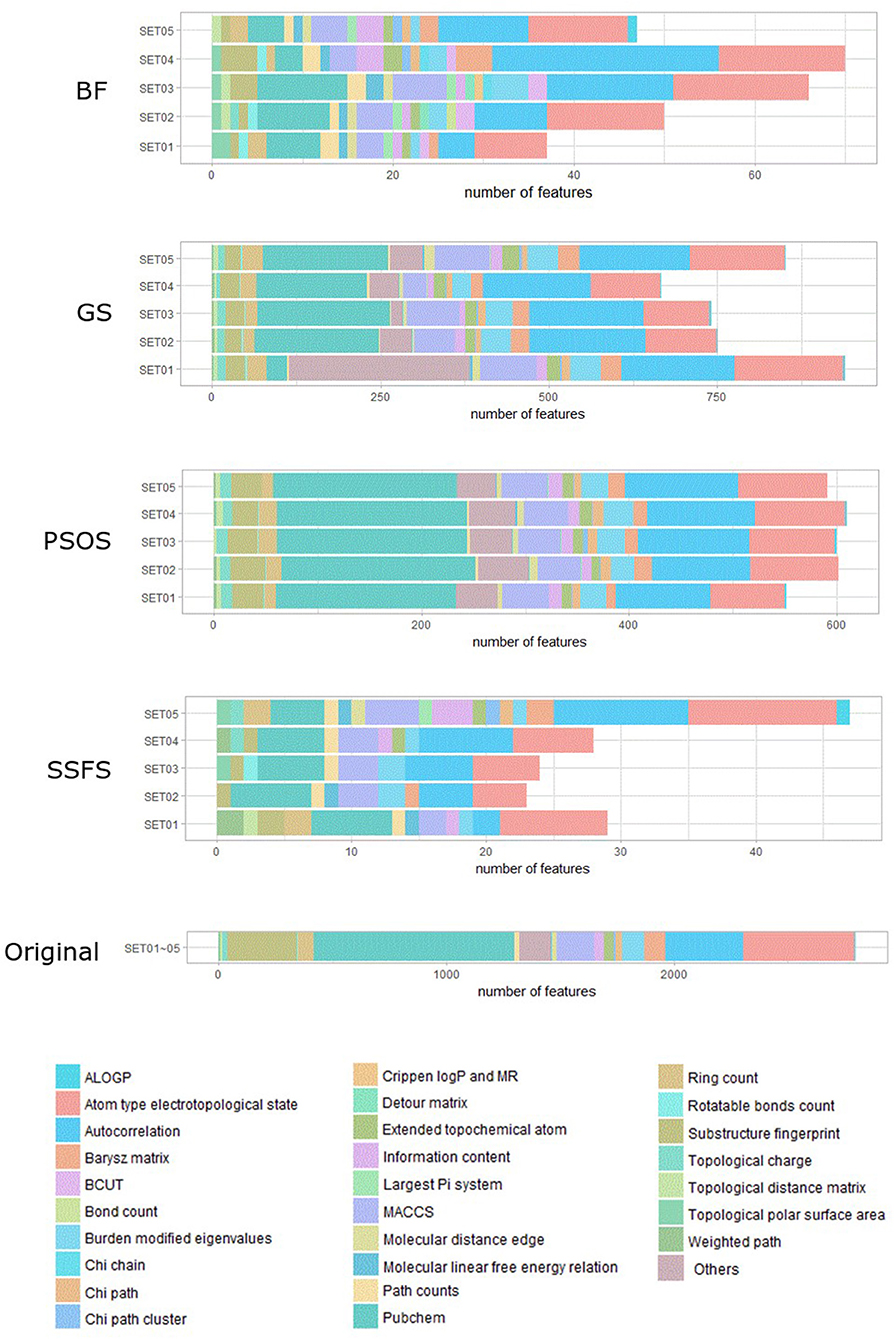
Figure 4. The composition of each feature set. The number of each kind of descriptor and fingerprint bit after each FS method is shown here. SET0N refers to the different IC50 threshold (SET01:4 μM; SET02:3 μM; SET03:2 μM; SET04:1 μM; SET05:11.4 μM). Note that the maximum value of horizontal axis of the graph differs between each FS method.
Merit
The predictive performance of a model strongly depends on the usefulness of the features. After feature selection, the remaining features may not fully represent the original features. Therefore, the merit of a feature set is measured as shown in Figure 5 to determine which FS method produce the best discriminative ability for model building. Despite this ability, the merit value itself does not consider the size of the dataset and a standard of a “high enough” merit value cannot be defined. Only a comparison between methods with the same dataset is valid and therefore, as described later, we further examined the effects on classification accuracy. A general observation is that the merit improved with an increase in the activity threshold. When every compound from a same resource is classified into the same class, it seems that the merit value tends to be enhanced, as shown in Figure 5, where the merit was the highest in SET05 among all datasets. The merits of BF and SSFS were higher than those of GS and PSO in every dataset, although they decreased rapidly (0.917–0.395 and 0.903–0.31, respectively) as the range of activity narrowed. GS and PSO selected feature sets with relatively poor merits, lower than 0.3 in every dataset, and almost near to zero in SET04. The results indicate that BF and SSFS achieve efficiency as well as enhance the predictive ability of the model, whereas GS and PSO barely improve the prediction ability.
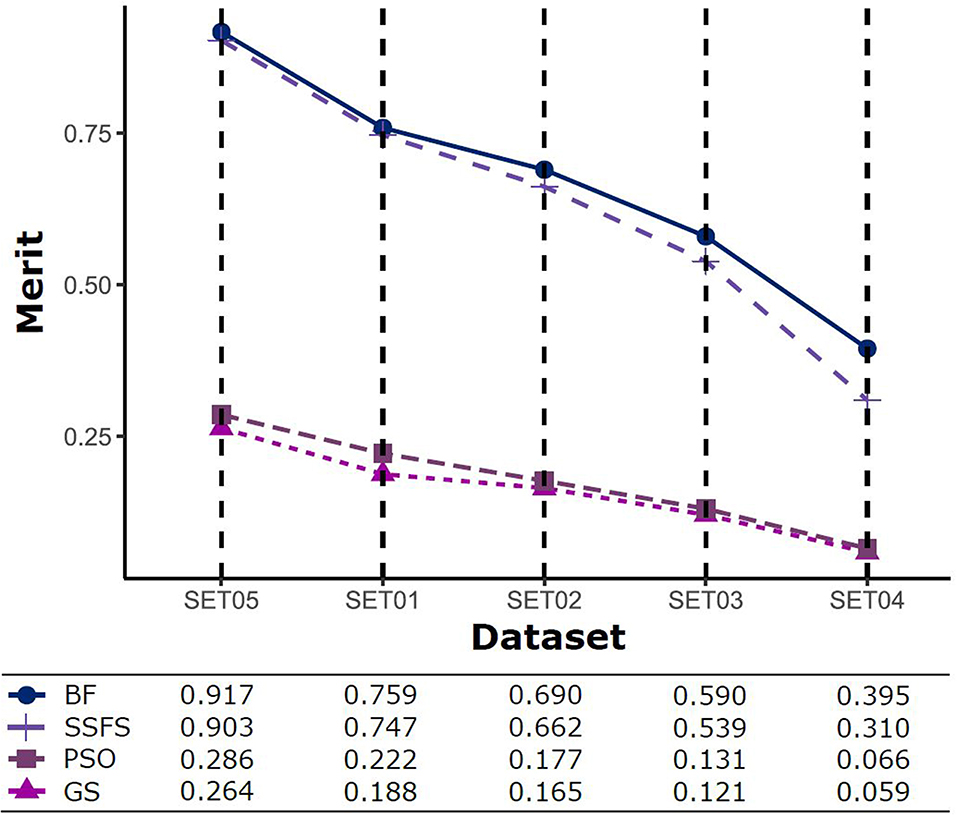
Figure 5. The merits of feature sets after feature selection method in each dataset with different IC50 threshold.
Evaluation of Classification Performance
To assess the performance of the classification models, two validation approaches, external validation using the test set (35% of initial dataset) and internal 10-fold cross-validation, were used to acquire the AUC of ROC curve and MCC. Effectiveness of 5 × 3 × 4 models: (1) five type activity thresholds between activeness and inactiveness, (2) three FS methods (selectors), and (3) four ML methods (classifiers) were evaluated. The 60 models were also compared with the models without a CFS process as control groups to evaluate the effectiveness of FS on the classification performance. Mean values of measurements in each dataset were calculated to better focus on the comparison between FS methods. The control group, where FS was not treated, is labeled as “none.” Every dataset used in all models contain identical molecules but differently assigned activity.
AUC of ROC
The AUC values of ROC curve of each model are illustrated in Figure 6. Generally, AUC declined as the IC50 threshold narrowed. Nevertheless, the RF models produced the highest AUC values in all combinations of activity thresholds and the FS methods in both external test set validation and 10-fold cross-validation. On the other hand, the AUC values were dramatically reduced as the activity threshold narrowed in NB or DT models, especially when built without feature selection process. This indicates that RF models have the most robust predictive ability among classifiers, showing a constantly high AUC ranging from 0.859 to 1 and from 0.839 to 1 in test set validation and cross-validation, respectively. Regarding FS methods, BF or SSFS exhibited relatively higher AUC than PSO or GS, as well as none (without CFS methodology). In addition, they produced the highest AUC when built with the RF classifier. The NB models appears to get the largest benefit from BF and SSFS methods, achieving substantial increase compared to the model without CFS process. However, GS or PSO methods could not greatly enhance the AUC values of NB models, producing only a slight increase compared to the model built without them, especially when the activity threshold was low. This suggests that RF models built with BF or SSFS feature selection methods have strong possibility to be the optimal model and exhibit the greatest robustness.
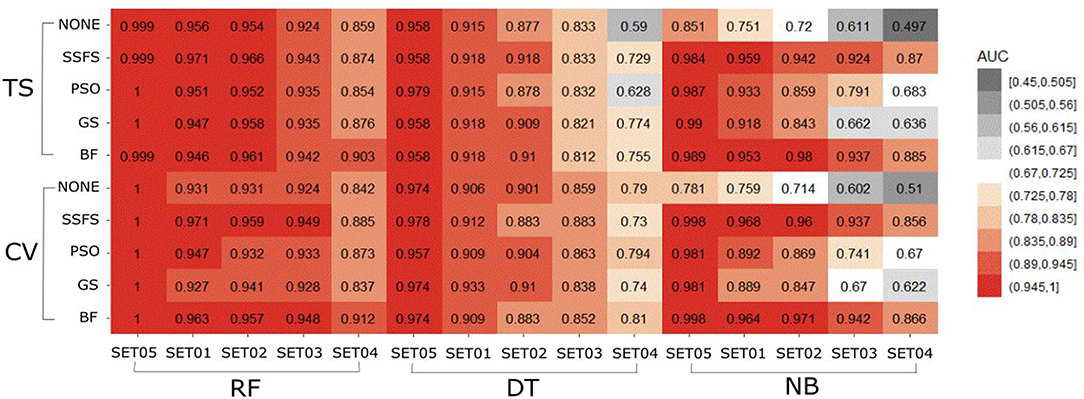
Figure 6. Heat-map depicting the AUC of ROC curve of the classification models.
MCC
In general, the MCC values exhibited similar tendencies to the AUC (Figure 7). Here also, RF achieved the highest MCC for every combination except for the cross-validation result of models applying GS or no feature selector with SET04. The overall MCC values of RF classifier with other datasets except for SET04 were reasonably high, ranging from 0.693 to 0.984 in external test set validation, and from 0.721 to 0.994 in 10-fold cross-validation. Among FS methods, BF and SSFS also achieved the best performance for all combinations. In particular, they exhibited enhanced MCC values when combined with the RF classifier. On the other hand, the NB classifier with the GS or PSO feature selector exhibited considerably lower values compared to other methods, and a rapid decline could be seen as the IC50 threshold narrowed. Even when combined with BF or SSFS, the NB models resulted in relatively low MCC compared to the RF or DT models.
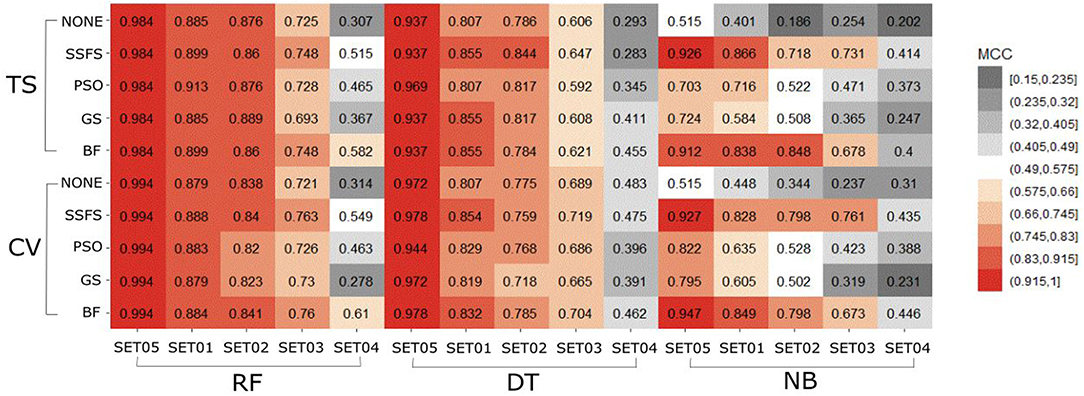
Figure 7. Heat-map depicting the MCC of the classification models.
In summary, “RF classifier + BF selector” or “RF classifier + SSFS selector” under their optimal hyperparameters presented the best predictive ability. Obviously, RF was more distinguished than other classifiers with a robust performance in all IC50 thresholds. BF and SSFS enhanced the classification performance, obtaining higher AUC and MCC values than other selectors. It is thus observed that the IC50 activity threshold has non-negligible influences on prediction performance. As the threshold narrowed, the accuracy and MCC values declined without any exception, implying the toughness of distinguishing between patent molecules with low IC50 values. Nevertheless, models built with low activity threshold may lead to the discovery of highly potent molecules selectively. Among all IC50 thresholds (SET01 to SET05), 1 μM (SET04) was excluded to generate the Top models: four IC50 activity thresholds (11.4, 4, 3, and 2 μM) and two feature selectors (BF and SSFS) under the optimal RF classifier. Through the consensus vote of the top 8 models, potential S100A9 inhibitors could be obtained.
Quality, Cost, and Effectiveness of Screening Hits
Ligand-based virtual screening was performed using a large-scale dataset (N = 6,447,184) derived from the eMolecules database. We finally obtained 46 potential S100A9 inhibitors through unanimous votes from top models (hit rate = 0.000713%). The 2D structures of hits are presented in Table S3. Notably, the prediction probabilities of selected hits were similarly high compared with patent molecules, ranging from 0.902 to 1 with little differential between models (Figure 8). In order to qualify the hit compounds, their structure novelty also was evaluated. For this purpose, the Tanimoto similarity between each hit compound and the nearest neighbor was presented (Table 5).
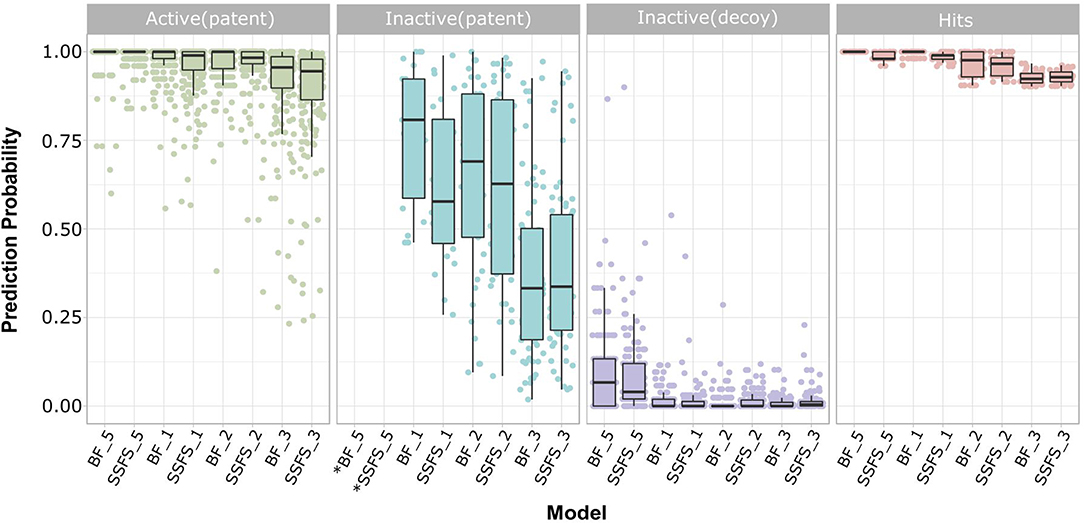
Figure 8. Prediction probability of top 8 models on patent molecules, decoy molecules, and hits. Each label of horizontal axis represents each top random forest model. The FS method and the dataset (SET0N) used in the model is indicated as “FS method_N”. For example, SSFS_3 refers to the random forest model built with the feature set chosen by SSFS with dataset SET03. *Note that every patent molecules were considered as active in BF_5 and SSFS_5.
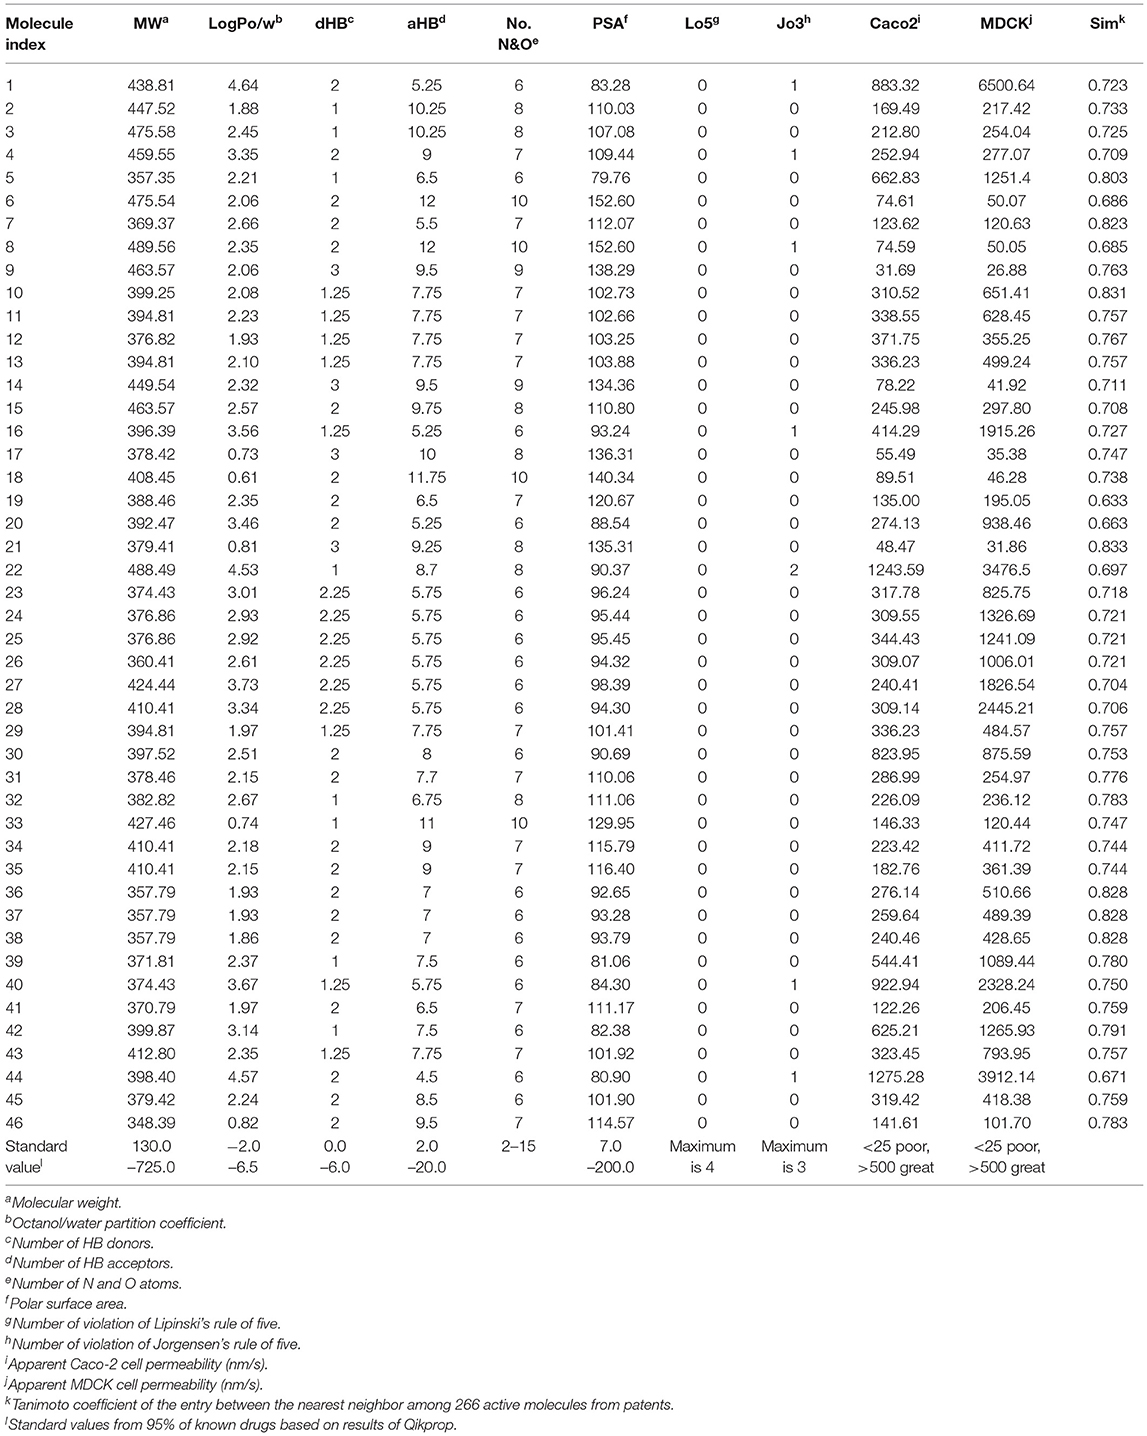
Table 5. Drug-likeness, ADME parameters prediction for 46 hits using QikProp and their Tanimoto similarity between the nearest neighbor.
In the view of structural novelty, our virtual screening could certainly guarantee similarity, such as the level of recent generative model-based de novo design (Popova et al., 2018). Our hits not only retain the structural diversity of active molecules, but also exhibit differentiation from patents, thereby suggesting our models' ability to elicit novel S100A9 inhibitors (Figure 2). Furthermore, our model is economical in the view of cost. The overall screening process including feature generation of the 6 M size library took ca. 161 h under 1 CPU and 8 GB memory condition for being to show 40 times faster than the screening using S100A9 docking models in the same computing resource. It proved strong cost-reduction ability and efficiency enough to apply to the real-world drug R&D.
In sequence, binding mode of the hit compounds was compared with known S100A9 inhibitors, 266 dataset under in-house docking model. For the docking simulations, homodimer of the mutant S100A9 (C3S) was gain from PDB 5I8N code (Chang et al., 2016). The S100A9 inhibitors were docked to S100A9-RAGE V dining domain to share the common region surrounded by Glu52 (at the hinge between H2 and H3), Arg85 (at H4), and Trp88 (at H4) in Figures S1–S3. 46 hit compounds also presented similar binding modes: (1) pi-pi or pi-cation interaction with residues at H4 (e.g., Trp88, Arg85) or (2) hydrogen bonding with hinge (e.g., Glu52 or Asn55) in Figures S4, S5 to add promising evidence of the hit compounds. Finally, since poor pharmacokinetic profiles and high potential toxicity are likely to fail in clinical trials, it is also crucial to predict such properties in advance to encourage further in vivo validation of hit molecules. We calculated the molecular parameters regarding drug-likeness and ADME properties to ensure that the hit compounds are suitable for further drug development processes (Table 5). Hopefully, all predicted values of 46 molecules are within the acceptable range. Neither Lipinski's rule of five nor Jorgensen's rule of three was violated by almost all hits. Even though we did not implement any physicochemical predictor into our model, the physicochemical property of the dataset could be transferred into screening hits through a structure-property relationship. If our model can be linked with a powerful inverse design model, we can expect our model can also provide powerful predictability with a physicochemical property range.
Conclusion
In summary, through extensive validation of 60 models built from multi-scaffold ligand information, we optimized the machine learning classifier as well as the feature selector to obtain highly predictive classification models for identifying S100A9 inhibitors. Unlike many other reports employing only several kinds of descriptors or a whole bits of fingerprint, we combined various kinds of descriptors with a hybrid fingerprint to generate a compact and effective feature set. Ultimately, this high efficiency allowed us to further obtain 47 hits from over six million compounds through the consensus vote of models within a week, indicating the high cost-reduction ability of the models. In addition, our study is the first example of reasonable classification models for S100A9 inhibitors. Regarding the clinical importance of S100A9, as well as the difficulty of generating models for its unique characteristics, we expect that our study will further aid in developing the first S100A9 agents and guide new paths of curing diverse diseases, including Alzheimer's disease and other neurodegenerative diseases.
Data Availability Statement
The raw data supporting the conclusions of this manuscript will be made available by the authors, without undue reservation, to any qualified researcher.
Author Contributions
MK and S-YL conceived and designed the study at their grant based research projects. Under the designed study, SK and JL built their models, validated them and acquired in-silico hits through their models. MK and JL wrote the manuscript. MK and SP revised the manuscript. All the authors read and approved the final manuscript.
Funding
This study was supported by the Basic Science Research Program of the National Research Foundation of Korea (NRF) funded by the Ministry of Education, Science, and Technology (No. 2017R1E1A1A01076642), by a grant of the Korea Health Technology R&D Project through the Korea Health Industry Development Institute (KHIDI), funded by the Ministry for Health and Welfare, Korea (HI14C1135).
Conflict of Interest
The authors declare that the research was conducted in the absence of any commercial or financial relationships that could be construed as a potential conflict of interest.
Supplementary Material
The Supplementary Material for this article can be found online at: https://www.frontiersin.org/articles/10.3389/fchem.2019.00779/full#supplementary-material
DataSheet 1. The 2D-structure of Dataset in Table S1.
References
Bajorath, J. (2002). Integration of virtual and high-throughput screening. Nat. Rev. Drug Discov. 1:882. doi: 10.1038/nrd941
Bendtsen, C., Degasperi, A., Ahlberg, E., and Carlsson, L. (2017). Improving machine learning in early drug discovery. Ann. Math. Artif. Intell. 81, 155–166. doi: 10.1007/s10472-017-9541-2
Bisignano, P., Burford, N. T., Shang, Y., Marlow, B., Livingston, K. E., Fenton, A. M., et al. (2015). Ligand-based discovery of a new scaffold for allosteric modulation of the μ-opioid receptor. J. Chem. Inf. Model. 55, 1836–1843. doi: 10.1021/acs.jcim.5b00388
Björk, P., Björk, A., Vogl, T., Stenström, M., Liberg, D., Olsson, A., et al. (2009). Identification of human S100A9 as a novel target for treatment of autoimmune disease via binding to quinoline-3-carboxamides. PLoS Biol. 7:e1000097. doi: 10.1371/journal.pbio.1000097
Chang, C. C., Khan, I., Tsai, K. L., Li, H., Yang, L. W., Chou, R. H., et al. (2016). Blocking the interaction between S100A9 and RAGE V domain using CHAPS molecule: a novel route to drug development against cell proliferation. Biochim. Biophys. Acta 1864:1558. doi: 10.1016/j.bbapap.2016.08.008
Cortes, C., and Vapnik, V. (1995). Support-vector networks. Mach. Learn. 20, 273–297. doi: 10.1007/BF00994018
Dash, M., and Liu, H. (1997). Feature selection for classification. Intell. Data Anal. 1, 131–156. doi: 10.3233/IDA-1997-1302
Ding, C., and Peng, H. (2005). Minimum redundancy feature selection from microarray gene expression data. J. Bioinform. Comput. Biol. 3, 185–205. doi: 10.1142/S0219720005001004
Domingos, P., and Pazzani, M. (1997). On the optimality of the simple Bayesian classifier under zero-one loss. Mach. Learn. 29, 103–130. doi: 10.1023/A:1007413511361
Domingos, P. M. (2012). A few useful things to know about machine learning. Commun. ACM 55, 78–87. doi: 10.1145/2347736.2347755
Donato, R. (1999). Functional roles of S100 proteins, calcium-binding proteins of the EF-hand type. Biochim. Biophys. Acta 1450, 191–231. doi: 10.1016/S0167-4889(99)00058-0
Donato, R. (2001). S100: a multigenic family of calcium-modulated proteins of the EF-hand type with intracellular and extracellular functional roles. Int. J. Biochem. Cell Biol. 33, 637–668. doi: 10.1016/S1357-2725(01)00046-2
Eberhart, R., and Kennedy, J. (1995). “A new optimizer using particle swarm theory,” in MHS'95. Proceedings of the Sixth International Symposium on Micro Machine and Human Science (Nagoya: IEEE), 39–43.
Freuder, E. C. (1988). “Backtrack-free and backtrack-bounded search,” in Search in Artificial Intelligence, eds L. Kanal and V. Kumar (New York, NY: Springer), 343–369. doi: 10.1007/978-1-4613-8788-6_10
Fritzson, I., Liberg, D., East, S., Mackinnon, C., and Prevost, N. (2014). N-(heteroaryl)-Sulfonamide Derivatives Useful as S100-Inhibitors. U.S. Patent No 9,873,687,2018.
Gadhe, C. G., Lee, E., and Kim, M.-H. (2015). Finding new scaffolds of JAK3 inhibitors in public database: 3D-QSAR models & shape-based screening. Arch. Pharm. Res. 38, 2008–2019. doi: 10.1007/s12272-015-0607-6
Geppert, H., Vogt, M., and Bajorath, J. (2010). Current trends in ligand-based virtual screening: molecular representations, data mining methods, new application areas, and performance evaluation. J. Chem. Inf. Model. 50, 205–216. doi: 10.1021/ci900419k
Goldberg, D. E. (1989). Genetic Algorithms in Search, Optimization and Machine Learning. Boston, MA: Addison-Wesley Longman Publishing Co., Inc.
Gruden, M. A., Davydova, T. V., Kudrin, V. S., Wang, C., Narkevich, V. B., Morozova-Roche, L. A., et al. (2017). S100A9 protein aggregates boost hippocampal glutamate modifying monoaminergic neurochemistry: a glutamate antibody sensitive outcome on Alzheimer-like memory decline. ACS Chem. Neurosci. 9, 568–577. doi: 10.1021/acschemneuro.7b00379
Gutlein, M., Frank, E., Hall, M., and Karwath, A. (2009). “Large-scale attribute selection using wrappers,” in 2009 IEEE Symposium on Computational Intelligence and Data Mining (Nashville, TN: IEEE), 332–339. doi: 10.1109/CIDM.2009.4938668
Guyon, I., and Elisseeff, A. (2003). An introduction to variable and feature selection. J. Mach. Learn. Res. 3, 1157–1182. doi: 10.1162/153244303322753616
Hall, M., Frank, E., Holmes, G., Pfahringer, B., Reutemann, P., and Witten, I. H. (2009). The WEKA data mining software: an update. ACM SIGKDD Explor. Newsl. 11, 10–18. doi: 10.1145/1656274.1656278
Hall, M. A. (1999). Correlation-Based Feature Selection for Machine Learning (Ph.D. thesis). The University of Waikato. Hamilton, New Zealand.
Hermani, A., Hess, J., De Servi, B., Medunjanin, S., Grobholz, R., Trojan, L., et al. (2005). Calcium-binding proteins S100A8 and S100A9 as novel diagnostic markers in human prostate cancer. Clin. Cancer Res. 11, 5146–5152. doi: 10.1158/1078-0432.CCR-05-0352
Holland, J. H. (1992). Adaptation in Natural and Artificial Systems: An Introductory Analysis With Applications to Biology, Control, and Artificial Intelligence. Cambridge, MA: MIT Press.
Horvath, I., Jia, X., Johansson, P., Wang, C., Moskalenko, R., Steinau, A., et al. (2015). Pro-inflammatory S100A9 protein as a robust biomarker differentiating early stages of cognitive impairment in Alzheimer's disease. ACS Chem. Neurosci. 7, 34–39. doi: 10.1021/acschemneuro.5b00265
Iashchishyn, I. A., Gruden, M. A., Moskalenko, R. A., Davydova, T. V., Wang, C., Sewell, R. D., et al. (2018). Intranasally administered S100A9 amyloids induced cellular stress, amyloid seeding, and behavioral impairment in aged mice. ACS Chem. Neurosci. 9, 1338–1348. doi: 10.1021/acschemneuro.7b00512
Itou, H., Yao, M., Fujita, I., Watanabe, N., Suzuki, M., Nishihira, J., et al. (2002). The crystal structure of human MRP14 (S100A9), a Ca2+-dependent regulator protein in inflammatory process. J. Mol. Biol. 316:265. doi: 10.1006/jmbi.2001.5340
Jang, C., Yadav, D. K., Subedi, L., Venkatesan, R., Venkanna, A., Afzal, S., et al. (2018). Identification of novel acetylcholinesterase inhibitors designed by pharmacophore-based virtual screening, molecular docking and bioassay. Sci. Rep. 8:14921. doi: 10.1038/s41598-018-33354-6
Kapetanovic, I. (2008). Computer-aided drug discovery and development (CADDD): in silico-chemico-biological approach. Chem. Biol. Interact. 171, 165–176. doi: 10.1016/j.cbi.2006.12.006
Katte, R., and Yu, C. (2018). Blocking the interaction between S100A9 protein and RAGE V domain using S100A12 protein. PLoS ONE 13:e0198767. doi: 10.1371/journal.pone.0198767
Khuri, N., Zur, A. A., Wittwer, M. B., Lin, L., Yee, S. W., Sali, A., et al. (2017). Computational discovery and experimental validation of inhibitors of the human intestinal transporter OATP2B1. J. Chem. Inf. Model. 57, 1402–1413. doi: 10.1021/acs.jcim.6b00720
Kim, H.-J., Kang, H. J., Lee, H., Lee, S.-T., Yu, M.-H., Kim, H., et al. (2009). Identification of S100A8 and S100A9 as serological markers for colorectal cancer. J. Proteome Res. 8, 1368–1379. doi: 10.1021/pr8007573
Kohavi, R., and John, G. H. (1997). Wrappers for feature subset selection. Artif. Intell. 97, 273–324. doi: 10.1016/S0004-3702(97)00043-X
Koller, D., and Sahami, M. (1996). Toward Optimal Feature Selection. Stanford, CA: Stanford InfoLab.
Kotsiantis, S. B., Zaharakis, I., and Pintelas, P. (2007). Supervised machine learning: A review of classification techniques. Emerg. Artif. Intell. Appl. Comput. Eng. 160, 3–24. doi: 10.1007/s10462-007-9052-3
Lavecchia, A. (2015). Machine-learning approaches in drug discovery: methods and applications. Drug Discov. Today 20, 318–331. doi: 10.1016/j.drudis.2014.10.012
Lavecchia, A., and Di Giovanni, C. (2013). Virtual screening strategies in drug discovery: a critical review. Curr. Med. Chem. 20, 2839–2860. doi: 10.2174/09298673113209990001
Lee, J., Cho, S., and Kim, M.-H. (2018). Discovery of CNS-like D3R-selective antagonists using 3D pharmacophore guided virtual screening. Molecules 23:2452. doi: 10.3390/molecules23102452
Lenselink, E. B., Beuming, T., van Veen, C., Massink, A., Sherman, W., van Vlijmen, H. W., et al. (2016). In search of novel ligands using a structure-based approach: a case study on the adenosine A 2A receptor. J. Comput. Aided Mol. Des. 30, 863–874. doi: 10.1007/s10822-016-9963-7
Liu, H., and Yu, L. (2005). Toward integrating feature selection algorithms for classification and clustering. IEEE Trans. Knowl. Data Eng. 17, 491–502. doi: 10.1109/TKDE.2005.66
Liu, Y. (2004). A comparative study on feature selection methods for drug discovery. J. Chem. Inf. Comput. Sci. 44, 1823–1828. doi: 10.1021/ci049875d
Lo, Y.-C., Rensi, S. E., Torng, W., and Altman, R. B. (2018). Machine learning in chemoinformatics and drug discovery. Drug Discov. Today 23, 1538–1546. doi: 10.1016/j.drudis.2018.05.010
Man, K.-F., Tang, K.-S., and Kwong, S. (1996). Genetic algorithms: concepts and applications [in engineering design]. IEEE Trans. Ind. Electron. 43, 519–534. doi: 10.1109/41.538609
Melville, J. L., Burke, E. K., and Hirst, J. D. (2009). Machine learning in virtual screening. Comb. Chem. High Throughput Screen. 12, 332–343. doi: 10.2174/138620709788167980
Mignani, S., Huber, S., Tomas, H., Rodrigues, J., and Majoral, J.-P. (2016). Why and how have drug discovery strategies in pharma changed? What are the new mindsets? Drug Discov. Today 21, 239–249. doi: 10.1016/j.drudis.2015.09.007
Moraglio, A., Di Chio, C., and Poli, R. (2007). “Geometric particle swarm optimisation,” in European Conference on Genetic Programming (Springer), 125–136. doi: 10.1007/978-3-540-71605-1_12
Muegge, I., and Oloff, S. (2006). Advances in virtual screening. Drug Discov. Today 3, 405–411. doi: 10.1016/j.ddtec.2006.12.002
Mullard, A. (2014). New drugs cost US $2.6 billion to develop. Nat. Rev. Drug Discov. 13:877. doi: 10.1038/nrd4507
Mysinger, M. M., Carchia, M., Irwin, J. J., and Shoichet, B. K. (2012). Directory of useful decoys, enhanced (DUD-E): better ligands and decoys for better benchmarking. J. Med. Chem. 55, 6582–6594. doi: 10.1021/jm300687e
Nisius, B., and Bajorath, J. (2009). Molecular fingerprint recombination: generating hybrid fingerprints for similarity searching from different fingerprint types. ChemMedChem 4, 1859–1863. doi: 10.1002/cmdc.200900243
Nisius, B., and Bajorath, J. (2010). Reduction and recombination of fingerprints of different design increase compound recall and the structural diversity of hits. Chem. Biol. Drug Des. 75, 152–160. doi: 10.1111/j.1747-0285.2009.00930.x
Oprea, T. I., and Matter, H. (2004). Integrating virtual screening in lead discovery. Curr. Opin. Chem. Biol. 8, 349–358. doi: 10.1016/j.cbpa.2004.06.008
Pelletier, M., Simard, J. C., Girard, D., and Tessier, P. A. (2018). Quinoline-3-carboxamides such as tasquinimod are not specific inhibitors of S100A9. Blood Adv. 2:1170. doi: 10.1182/bloodadvances.2018016667
Popova, M., Isayev, O., and Tropsha, A. (2018). Deep reinforcement learning for de novo drug design. Sci. Adv. 4:eaap7885. doi: 10.1126/sciadv.aap7885
Reddy, A. S., Pati, S. P., Kumar, P. P., Pradeep, H., and Sastry, G. N. (2007). Virtual screening in drug discovery-a computational perspective. Curr. Protein Peptide Sci. 8, 329–351. doi: 10.2174/138920307781369427
Rissanen, J. (1978). Modeling by shortest data description. Automatica 14, 465–471. doi: 10.1016/0005-1098(78)90005-5
Ryckman, C., Vandal, K., Rouleau, P., Talbot, M., and Tessier, P. A. (2003). Proinflammatory activities of S100: proteins S100A8, S100A9, and S100A8/A9 induce neutrophil chemotaxis and adhesion. J. Immunol. 170, 3233–3242. doi: 10.4049/jimmunol.170.6.3233
Scannell, J. W., Blanckley, A., Boldon, H., and Warrington, B. (2012). Diagnosing the decline in pharmaceutical R&D efficiency. Nat. Rev. Drug Discov. 11:191. doi: 10.1038/nrd3681
Shafer, J., Agrawal, R., and Mehta, M. (1996). “SPRINT: a scalable parallel classifier for data mining,” in VLDB (Citeseer), 544–555.
Shehata, M. A., Nøhr, A. C., Lissa, D., Bisig, C., Isberg, V., Andersen, K. B., et al. (2016). Novel agonist bioisosteres and common structure-activity relationships for the orphan G protein-coupled receptor GPR139. Sci. Rep. 6:36681. doi: 10.1038/srep36681
Shi, Y. (2001). “Particle swarm optimization: developments, applications and resources,” in Proceedings of the 2001 Congress on Evolutionary Computation (IEEE Cat. No. 01TH8546) (Seoul: IEEE), 81–86.
Shoichet, B. K. (2004). Virtual screening of chemical libraries. Nature 432:862. doi: 10.1038/nature03197
Singla, D., Tewari, R., Kumar, A., and Raghava, G. P. (2013). Designing of inhibitors against drug tolerant Mycobacterium tuberculosis (H37Rv). Chem. Cent. J. 7:49. doi: 10.1186/1752-153X-7-49
Sliwoski, G., Kothiwale, S., Meiler, J., and Lowe, E. W. (2014). Computational methods in drug discovery. Pharmacol. Rev. 66, 334–395. doi: 10.1124/pr.112.007336
Smieja, M., and Warszycki, D. (2016). Average information content maximization—a new approach for fingerprint hybridization and reduction. PLoS ONE 11:e0146666. doi: 10.1371/journal.pone.0146666
Stahura, F. L., and Bajorath, J. (2004). Virtual screening methods that complement HTS. Comb. Chem. High Throughput Screen. 7, 259–269. doi: 10.2174/1386207043328706
Stahura, F. L., and Bajorath, J. (2005). New methodologies for ligand-based virtual screening. Curr. Pharm. Des. 11, 1189–1202. doi: 10.2174/1381612053507549
Vafaie, H., and De Jong, K. (1992). “Genetic algorithms as a tool for feature selection in machine learning,” in Proceedings Fourth International Conference on Tools with Artificial Intelligence TAI'92 (Arlington, VA: IEEE), 200–203.
Verikas, A., Gelzinis, A., and Bacauskiene, M. (2011). Mining data with random forests: a survey and results of new tests. Pattern Recognit. 44, 330–349. doi: 10.1016/j.patcog.2010.08.011
Walters, W. P., Stahl, M. T., and Murcko, M. A. (1998). Virtual screening—an overview. Drug Discov. Today 3, 160–178. doi: 10.1016/S1359-6446(97)01163-X
Warszycki, D., Smieja, M., and Kafel, R. (2017). Practical application of the average information content maximization (AIC-MAX) algorithm: selection of the most important structural features for serotonin receptor ligands. Mol. Divers. 21, 407–412. doi: 10.1007/s11030-017-9729-8
Wellmar, U., East, S., Bainbridge, M., Mackinnon, C., Carr, J., and Hargrave, J. (2016). Imidazo [2, 1-b] thiazole and 5, 6-Dihydroimidazo [2, 1-b] thiazole Derivatives Useful as S100-Inhibitors. U.S. Patent Application No 15/545,573, 2018.
Wellmar, U., Liberg, D., Ekblad, M., Bainbridge, M., East, S., Hargrave, J., et al. (2015). Compounds Useful as S100-Inhibitors. U.S. Patent No 9,771,372,2017.
Williams, A. J. (2008). Public chemical compound databases. Curr. Opin. Drug Discov. Dev. 11:393. Available online at: https://www.researchgate.net/publication/5424985_Public_chemical_compound_databases
Williams, C. (2006). Reverse fingerprinting, similarity searching by group fusion and fingerprint bit importance. Mol. Divers. 10, 311–332. doi: 10.1007/s11030-006-9039-z
Yadav, D. K., Sharma, P., Misra, S., Singh, H., Mancera, R. L., Kim, K., et al. (2018). Studies of the benzopyran class of selective COX-2 inhibitors using 3D-QSAR and molecular docking. Arch. Pharm. Res. 41, 1178–1189. doi: 10.1007/s12272-017-0945-7
Yap, C. W. (2011). PaDEL-descriptor: an open source software to calculate molecular descriptors and fingerprints. J. Comput. Chem. 32, 1466–1474. doi: 10.1002/jcc.21707
Yatime, L., Betzer, C., Jensen, R. K., Mortensen, S., Jensen, P. H., and Andersen, G. R. (2016). The structure of the RAGE: S100A6 complex reveals a unique mode of homodimerization for S100 proteins. Structure 24, 2043–2052. doi: 10.1016/j.str.2016.09.011
Yoshioka, Y., Mizutani, T., Mizuta, S., Miyamoto, A., Murata, S., Ano, T., et al. (2016). Neutrophils and the S100A9 protein critically regulate granuloma formation. Blood Adv. 1:184. doi: 10.1182/bloodadvances.2016000497
Keywords: S100, machine learning, random forest, ligand-based virtual screening, feature selection, classification, consensus vote, Alzheimer's disease
Citation: Lee J, Kumar S, Lee S-Y, Park SJ and Kim M (2019) Development of Predictive Models for Identifying Potential S100A9 Inhibitors Based on Machine Learning Methods. Front. Chem. 7:779. doi: 10.3389/fchem.2019.00779
Received: 10 February 2019; Accepted: 29 October 2019;
Published: 25 November 2019.
Edited by:
John C. Cancilla, Scintillon Institute, United StatesReviewed by:
Carles Curutchet, University of Barcelona, SpainThomas Vogl, Universitätsklinikum Münster, Germany
Copyright © 2019 Lee, Kumar, Lee, Park and Kim. This is an open-access article distributed under the terms of the Creative Commons Attribution License (CC BY). The use, distribution or reproduction in other forums is permitted, provided the original author(s) and the copyright owner(s) are credited and that the original publication in this journal is cited, in accordance with accepted academic practice. No use, distribution or reproduction is permitted which does not comply with these terms.
*Correspondence: Mi-hyun Kim, a21oMDUxNUBnYWNob24uYWMua3I=
†These authors have contributed equally to this work and share first authorship