 Sergio Augusto Barcellos Lins1,2*
 Stefano Ridolfi3Giovanni Ettore Gigante1Roberto Cesareo4
 Monica Albini5
 Cristina Riccucci5
 Gabriella di Carlo5
 Andrea Fabbri2
 Paolo Branchini2
 Luca Tortora2,6
- 1Department of Basic and Applied Sciences for Engineering, Sapienza University of Rome, Rome, Italy
- 2Surface Analysis Laboratory, Istituto Nazionale di Fisica Nucleare Sezione di Roma Tre, Rome, Italy
- 3Ars Mensurae srl, Rome, Italy
- 4Istituto di Matematica e Fisica, Università degli Studi di Sassari, Sassari, Italy
- 5Institute for the Study of Nanostructured Materials, National Research Council, Rome, Italy
- 6Department of Sciences, Roma Tre University, Rome, Italy
When investigating gilded artifacts or works of art, the determination of the gilding thickness plays a significant role in establishing restoration protocols or conservation strategies. Unfortunately, this is done by cross-sectioning the object, a destructive approach not always feasible. A non-destructive alternative, based on the differential attenuation of fluorescence radiation from the sample, has been developed in the past years, but due to the intrinsic random nature of X-rays, the study of single or few spots of an objects surface may yield biased information. Furthermore, considering the effects of both porosity and sample inhomogeneities is a practice commonly overlooked, which may introduce systematic errors. In order to overcome these matters, here we propose the extrapolation of the differential-attenuation method from single-spot X-ray fluorescence (XRF) measurements to macro-XRF (MA-XRF) scanning. In this work, an innovative algorithm was developed for evaluating the large amount of data coming from MA-XRF datasets and evaluate the thickness of a given overlapping layer over an area. This approach was adopted to study a gilded copper-based buckle from the sixteenth to seventeenth century found in Rome. The gilded object under investigation was also studied by other analytical techniques including scanning electron microscopy coupled with energy dispersive spectroscopy (SEM-EDS). Previous results obtained from SEM-EDS were used to confront the data obtained with the proposed methodology and validate it. MA-XRF elemental distribution maps were fundamental in identifying and choosing sampling areas to calculate the thickness of the gilding layer, avoiding lead islands present in the sample that could negatively influence the results. Albeit the large relative standard deviation, the mean thickness values fell within those found in literature and those obtained from previous studies with SEM-EDS. Surface fissure has been found to deeply affect the results obtained, an aspect that is often disregarded.
Introduction
The practice of gilding dates back from antiquity and is still performed until today by means of different techniques, as electrochemical deposition instead of the toxic mercury fire-gilding (Anheuser, 1997). With the course of time, a wide array of gilding methods has been developed and those most widespread in antiquity were the application of a gold foil (or leaf) to a prepared substrate, mercury gilding, or depletion (Lechtman et al., 1982; Ingo et al., 2013; Pessanha et al., 2019b). The method chosen also depends on the type of substrate used, which varies from leather, plaster and wood to metals (Cesareo, 2003; Eveno et al., 2014; Tortora et al., 2014; Biocca et al., 2016; Shabunya-Klyachkovskaya et al., 2017; Iorio et al., 2019). In the case of fire-gilding, a mixture made of mercury and gold (amalgam) is applied to a clean metallic substrate and fired in temperatures around 300°C to volatilize the mercury. The surface is then finished with the use of burnishers and the resulted thickness can range from 1 μm to about 10 μm or more (Anheuser, 1997; Ingo et al., 2013).
Due to the variety of gilding methods used in the past and their intrinsic variations (amalgam composition and thickness), the investigation of archaeological gilded objects has raised interest in the community, aiming to investigate the methodology and materials used and the conservation state of these objects (Abdelhamid et al., 2010; Ingo et al., 2016, 2018; Graziani et al., 2020). The most straightforward way of studying a gilded objects' characteristics and gilding method is by analyzing a cross-section of the object. This approach yields direct information of the thickness of the gold layer and the binding mechanism between gold layer and substrate. Scanning electron microscopy coupled with energy dispersive spectroscopy (SEM-EDS) goes even further, giving a direct information on the chemical composition of the substrate and the gilding layer (Ingo et al., 2016). Nevertheless, the study of cross-sections requires sampling and is a destructive method, being rarely feasible when it comes to valuable artifacts (Nørgaard, 2017).
The focus on non-destructive techniques has always been a priority in cultural heritage science, and X-rays fluorescence (XRF) is commonly used as a standard approach (Guerra, 2000; Bottaini et al., 2017). This technique can provide information on the chemical composition of a sample surface and even the thickness of an existing overlapping layer—giving the conditions are optimal (van Espen, and Lemberge, 2000; Giurlani et al., 2019). Nonetheless, archaeological artifacts are known to be extremely inhomogeneous and the analysis of only few spots of the sample's surface may lead to misleading conclusions (Cesareo et al., 2010; Brunetti et al., 2016). Extrapolating the one-dimensionality of XRF technique to another dimension, i.e., scanning [or capturing in full field (Romano et al., 2014)] a surface instead of analyzing few spots, is a practice that is now becoming widespread in cultural heritage science and is generally known as macro-XRF scanning (MA-XRF) (Dik et al., 2008). This approach increases significantly the understanding of the sample, by generating bi-dimensional maps of elemental distribution and providing a large XRF dataset to work with.
Measuring the thickness of a given surface layer placed to protect an artifact or, as in the case of gilding, to turn it more attractive, can be performed by a method that uses the differential attenuation of fluorescence radiation coming from the internal matrix (substrate) (Cesareo et al., 2015). This method is based on the concatenated effect of two distinct processes: (a) the production of fluorescence photons in the internal matrix and (b) the differential attenuation in the surface layer. The latter can become quite complex when dealing with amalgam gilded objects, since the chemical composition of the surface layer is not constant throughout the sample and micro-fissures can be present in amounts sufficient to introduce significant errors. Moreover, the metallic substrate of archaeological artifacts can present considerable inhomogeneities in their composition, caused by either smelting, molding, or working. Inhomogeneities in the sample hinders a precise estimation of the matrix un-attenuated signal and therefore must be avoided. Furthermore, the presence of protective layers, such as mica or paraloids, must be cautiously accounted. The existence of an “extra” layer on top of the gilding layer further attenuates the photons coming from the substrate and therefore introduce systematic errors. If the protective layer is known, as in the case of paraloids, the further attenuation introduced can be calculated and Equation (5) can be adjusted accordingly (Nardes et al., 2019). Past interventions or cleaning routines applied to the objects surface can be assessed by the complete absence of soil impurities in the elemental distribution maps generated with the MA-XRF data. Therefore, a proper interpretation of these maps and the assessment of the presence or not of additional layers are crucial for selecting suitable regions where to apply the differential attenuation method.
In this context, the current research proposes the use of MA-XRF scan datasets to investigate the gilding technique employed in a Sixteenth to Seventeenth century AD buckle found during the dredging of Tiber river (Rome, Italy), by applying the differential attenuation method and calculating the gilding thickness in a totally non-invasive manner. The use of MA-XRF elemental distribution maps is crucial to select suitable regions from the sample surface where to calculate the thickness. Moreover, an algorithm capable of analyzing thousands of spectra and simulating the chemical composition of the overlapping layer, considering the presence of fissures or pores, was developed to account for the variations present in this layer. This allows a more precise calculation of the superficial layer attenuation coefficients. The method dismisses any need for cross-sectioning, sampling or even sample preparation, being completely non-destructive. Nonetheless, the buckle investigated has been previously studied by SEM-EDS (Ingo et al., 2018), where a sectioning of a small part in the rightmost portion of the object was made. Results from SEM-EDS analysis have been used to validate the proposed methodology.
Materials and Methods
A gilded Cu-based buckle dating from the Sixteenth to Seventeenth century found during the dredging of the Tiber river in Rome was analyzed by scanning electron microscopy (SEM) coupled with energy dispersive spectroscopy (EDS) and by macro X-ray fluorescence (MA-XRF) scanning. The object was cleaned with distilled water followed by ethanol rinsing. No conservation treatment was performed. SEM images were used to confront the data obtained from the differential attenuation calculations and assess the reliability and quality of the data.
To obtain the most representative data, the thickness calculations were performed in specific regions of the sample in a way to avoid great geometrical variations and matrix composition inhomogeneities. The intensity ratio of Cu-Kα and Cu-Kβ characteristic lines for an infinitely thick matrix were experimentally measured in the central portion of the sample (where no gold cover is visible), being the mean value obtained with 6 different spots.
The Differential Attenuation Method
Considering one of the two monochromatic radiations used in the differential attenuation method (for example the Kα line of one of the elements present in the internal matrix) and a generic tube-sample-detector geometry (Figure 1), the following equation is valid for the photons detected in the spectral window a (Ia):
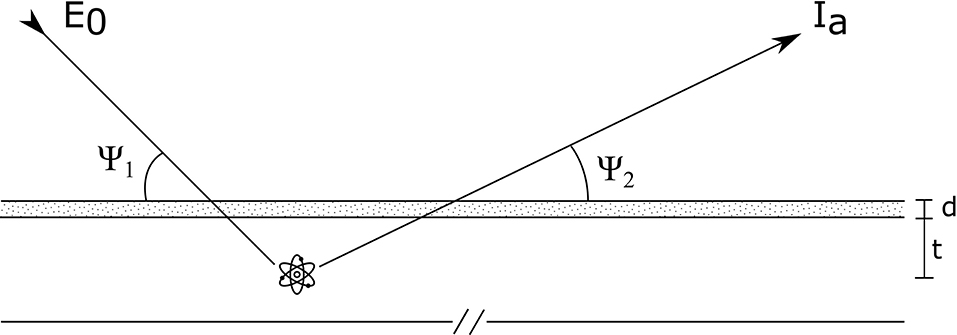
Figure 1. Representative scheme of impinging and outgoing radiations.
By integrating the equation above one obtains:
where I0 is the exciting photons beam intensity at energy E0, A is the overall term taking into account all the factors that determine the production of photons detected in the spectral window a, K is the geometrical factor, ε(Ea) is the detector efficiency, μL(E0) and μL(Ea) are the superficial layer attenuation coefficients at impinging and outgoing photon energies, respectively, d represents its thickness, μs(E0) and μs(Ea) are the attenuation coefficients of the internal matrix, Ψ1 and Ψ2 are the incident beam and output angles with the sample surface, respectively and t is the internal matrix thickness.
The ratio between two monochromatic radiations can then be written, assuming that the detector efficiency and geometrical factors are the same for both lines, as:
where
The first term (referred to as thin) is the ratio when the self-attenuation in the internal matrix is completely negligible, the second and third terms consider the contribution of this effect and the fourth term considers the differential attenuation undergone in the surface layer. Only the fourth term depends on the surface layer, while the remaining terms depend only on the internal matrix. When the exponential contributions in the third term (χ) are negligible (having t large enough that the term can be approximated to 1), the sample can be assumed infinitely thick.
When the two lines are relative to a single element, as in the case of the lines Kα and Kβ of copper, their ratio is fixed and well-known (Cesareo et al., 2009).
Neglecting the differential attenuation in the superficial layer and considering an infinitely thick approximation, the matrix ratio can be given by the following equation:
The values for infinitely thin samples can be calculated from the fundamental parameters (Cesareo et al., 2010), and therefore—if the sample composition is known—one can calculate the intensity ratio for a thick sample. This value can also be experimentally determined by directly measuring the sample exposed substrate or by creating a calibration model via Monte Carlo simulations (Pessanha et al., 2019a) when the former is not feasible.
Therefore, assuming the attenuation coefficient of the overlapping layer is known (its composition is known or experimentally determined using the acquired XRF data) and that the matrix can be considered infinitely thick, the superficial layer thickness is finally given by Equation (5) below (Cesareo et al., 2016; Nardes et al., 2019):
MA-XRF Scanning
The system used to record and process the XRF data was a custom-made portable scanner, made by the Istituto Nazionale di Fisica Nucleare (INFN)—Roma Tre Division, and a private company Ars Mensurae. This system has been employed in previous studies (Iorio et al., 2019) and comprises a movable stage—where the sample is positioned—and an exchangeable head composed of a collimated Moxtek® Ta-target X-ray tube and an AMPTEK® 123SDD detector. The spot size is of roughly 1 mm2 and the total scanned area was of 34 × 15 mm2, enough to cover the entirety of the sample. The tube operated at 37 KV and 17 μA. The dwell-time per pixel was of 7 s, resulting in roughly 60 min of acquisition time. The system was calibrated using an SRM 1115 NIST Standard reference material with the following composition expressed as mass fraction, in %: Copper 87.96, Zinc 11.73, Lead 0.013, Iron 0.13, Tin 0.10, Nickel 0.074, and Phosphorus 0.05.
SEM-EDS
Backscattered images and Field-emission (FE) SEM images were acquired with a SEM Stereoscan 360 system from Cambridge, UK, equipped with a LaB6 filament and a LEO Gemini 1530 microscope from Zeiss, Germany. The former coupled to an INCA 250 and the latter to an INCA 450 energy-dispersive X-ray spectrometers (EDS) both by Oxford Instruments Analytical, UK. The images were collected with acceleration voltages up to 20 kV.
Prior to the analysis, the sample cross-section was coated with either C or Cr. This procedure is required to avoid charging effects. Carbon was deposited with an Emitech sputter coater model K550, a K250 carbon coating attachment and a carbon cord. The carbon film deposited was ~3 nm thick. As for the chromium film, the deposition procedure was performed with a Bal-Tech SCD 500 at a 5 × 10⁻³ mbar pressure to ensure a constant thickness of about 0.5 nm.
Results and Discussion
Figure 2 reports the elemental maps distribution acquired by the MA-XRF scanning system. The elemental distribution maps show mercury correlated to gold. The simultaneous and correlated presence of both elements are an indicative that mercury and gold are mixed in the uppermost, gilded layer. Although MA-XRF information cannot be used to distinguish fire-gilding from cold-gilding, it certainly can strongly suggest the use of a mercury-gilding technique. This was also confirmed by previous SEM analysis performed by Ingo et al. (2018), which demonstrated that this gilded object was produced by fire-gilding technique.
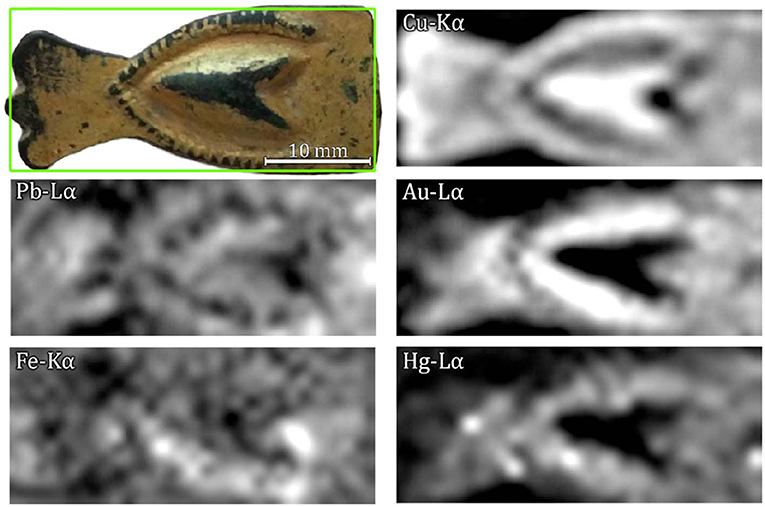
Figure 2. Analyzed sample (top left) and MA-XRF elemental distribution maps of lead Lα, iron Kα, copper Kα, gold Lα, and mercury Lα.
The elemental maps also show a rather inhomogeneous distribution of certain elements, with a higher concentration of lead in the rightmost part of the sample and of iron in the lower part.
The explanation for the latter may be three-fold: (a) the tube-sample-detector geometry—being the detector on the left-hand side of the tube—causing an overestimation of iron peaks or an increase in Cu-escape peaks (Trojek, 2011), (b) the preferential deposition of iron impurities during the burial period in the lower-concave region, or (c) a deposition of iron in both concave regions during the burial period combined with the geometrical factor. Due to the central relief in the sample, the combined effect described in (c) results in an increase in the signal from the lower concave region and a lower signal from the upper concave region. The elemental distribution map of iron is better represented in Figure 3, where a comparison between iron-Kα and iron-Kβ maps is shown. It can be observed that the signal contribution is due mostly to the Kα-line (maximum net area of 242 counts against 55 from Kβ), meaning that iron is not present as an alloying element but as an impurity deposited in the concave parts of the sample probably during the burial period. Furthermore, the characteristic low signal of alloy impurities detected by XRF would be suppressed by the gold layer deposited on the surface. Moreover, concentrations of secondary metals, such as iron and aluminum, appear frequently in corroded bronzes that have been buried for prolonged periods of time (Nørgaard, 2017).
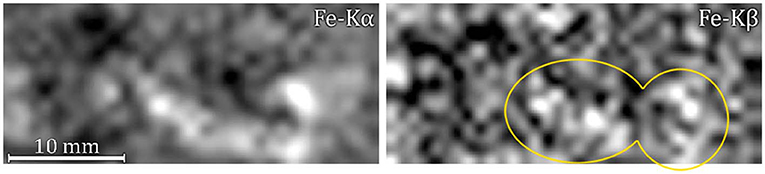
Figure 3. Elemental distribution maps of iron Kα (left) and iron Kβ (right).
For what concerns the lead presence, a lead segregation can occur if its content within the copper alloy exceeds 10 wt.% (Quaranta et al., 2014). On the other end, casting conditions, can play a significant role in the lead segregation/precipitation. In fact, lead and copper have significantly different melting temperatures and if the cooling rate is fast enough, the phase-diagram is disturbed and lead precipitates into a different phase (Callister, 2007). Moreover, both lead-Lα and -Lβ elemental distribution maps are identical and with reasonable maximum net areas of 227 and 124, respectively, being indicative that the lead signal comes indeed from underneath the gilding layer.
Since inhomogeneities and contaminations were detected in the sample, some areas of interest (AoIs) shown in Figure 4 were selected to well-define the areas where to apply the differential attenuation method. This was done in order to avoid the presence of lead islands and areas with higher iron signal for the calculation of the gilding layer thickness. The dataset is then restricted to 91 pixels out of the 310 pixels where gold was detected (Figure 4).
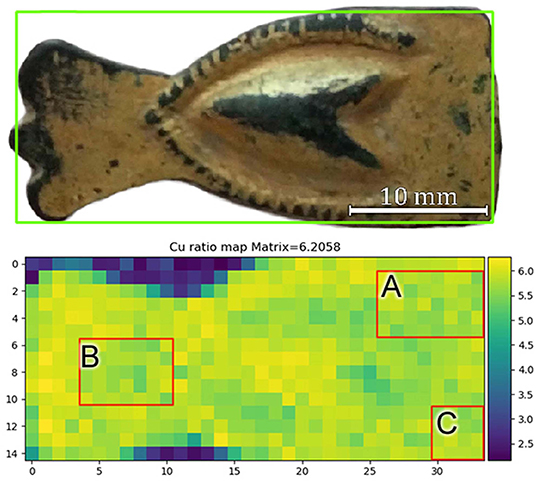
Figure 4. Selected areas for calculating the gilding layer thickness.
Amalgam-gilded artifacts can undergo corrosion (Ingo et al., 2016, 2018), as opposed to what is normally expected from golden objects. Micro-pores and fissures that remain in the finished gilded surface still allow the interaction between copper and corroding species from the environment (Ingo et al., 2018). The intermediate corrosion product layer created by this process and between the gold surface and the bulk metal can vary in thickness (Robbiola et al., 1998). In Equation (5) for the thickness calculation, the thick sample ratio [(IKα/IKβ)thick] is used acting as a calibration factor and it was determined by measuring six spots in the central portion of the artifact, where no gold was observed (Figure 2). This thick ratio supposedly represents the substrate directly in contact with the overlapping gilded layer, and the average measured value obtained was 6.206.
The amount of residual mercury present in the finished gilded layer can vary from 25 wt.% (near the ζ-phase α′-phase border in the Au-Hg phase-diagram) to 0.05 wt.% under a 600°C heating. However, a finished layer will usually retain about 8–25% of mercury (Anheuser, 1997). This amount varies according to the temperature used in the firing step, the initial mercury concentration (about 80–90 wt.%) and the thickness of the layer applied prior firing (Anheuser, 1997; Ingo et al., 2013). Gold and mercury have very close atomic numbers (92 and 93, respectively) but have a slight discrepancy in density (19.28 and 13.53 g/cm3, respectively). Variations in the mercury content present in the alloy (±10%) induce changes in the attenuation coefficients difference (2–3%) that are much less than the observed statistical uncertainty. Therefore, to estimate the attenuation coefficient for the K-lines of copper [μL variables in Equation (5)] of the gold layer, a chemical composition of 88 wt.% Au and 12 wt.% Hg was simulated and attributed to the layer (Table 1).
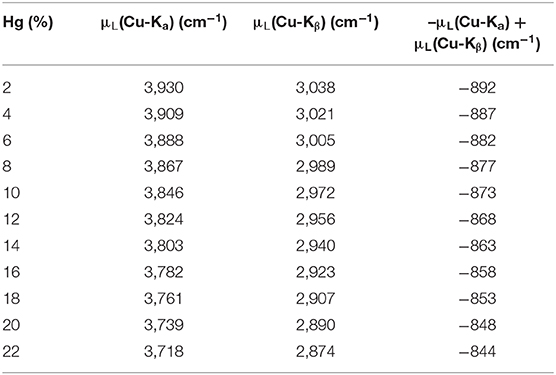
Table 1. Variations in the linear attenuation coefficients with varying quantities of mercury and gold.
As previously stated, fire-gilded objects are usually characterized by the presence of several micro-pores and fissures. In Figure 5, SEM-EDS analysis of the sample cross-sections is reported. A highly fissured bright layer on top of a darker region (corrosion product layer) can be observed in Figure 5C. The presence of fissures drastically reduces the density of the superimposing gold layer (Ager et al., 2017; Giurlani et al., 2019) and if not taken into account may lead to misleading conclusions in regard of thickness calculation. As the method used in the study proposes a non-invasive approach, the fissure percentage estimated to account for the fissure influence was calculated through a simple image analysis of top-view (backscattered) SEM images, comparing the difference between the bright (gold) and dark (copper) pixels.
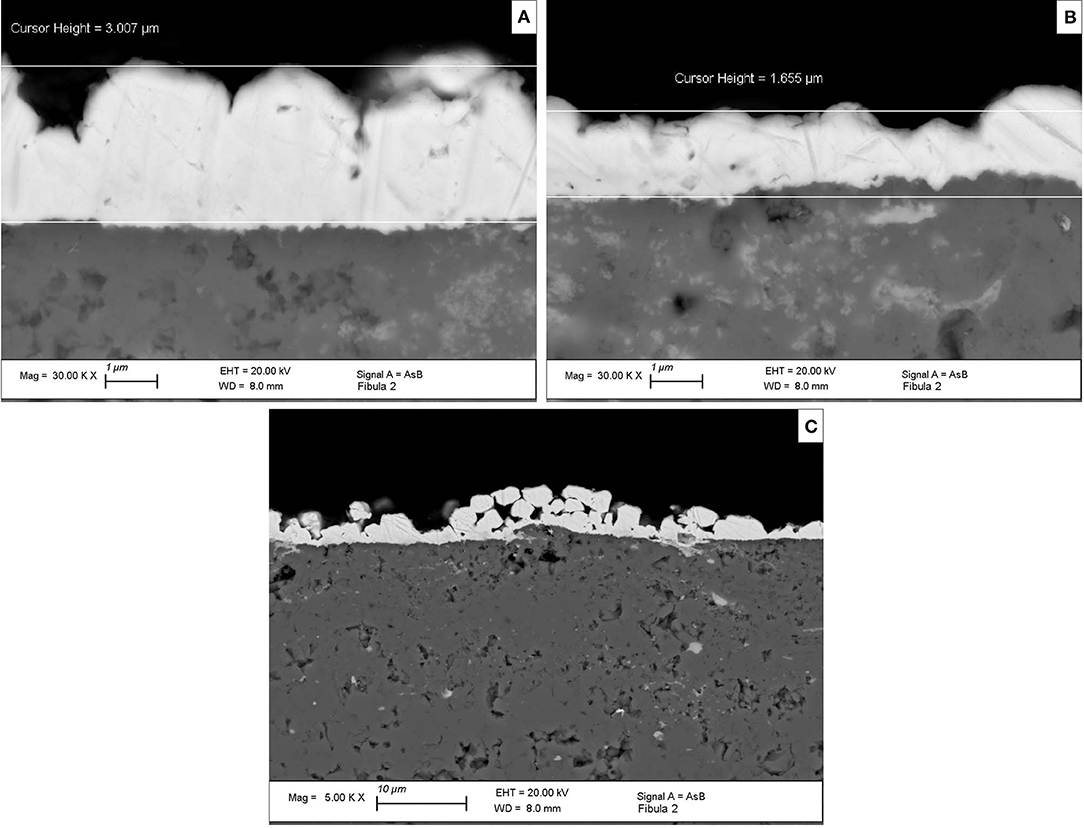
Figure 5. SEM-EDS images from sample's cross section reporting different gilding thicknesses ranging from 3 μm (A) to 1.6 μm (B). A general overview of the gilding layer on top of a corrosion substrate presenting a high porosity and variable thickness (C).
The estimated fissure value was fed into the algorithm to correct the attenuation coefficients and density of the gold layer, simulating the gold stratum as a homogeneous mixture of air and gold-mercury alloy. Figure 6 shows an exponential increase in both standard deviations and mean values obtained when fissure percentage increases. The joint effect of substrate composition thickness variation (corrosion) and varying fissure volumes greatly contribute to a high standard deviation. In this way, as the mean thickness values may fall within a similar region, the direct influence of fissures over the mean calculated thickness cannot be directly measured. Nevertheless, a large standard deviation is not unreasonable. The gilding layer presents an inhomogeneous thickness distribution as demonstrated by the SEM-EDS images (1.6 and 3 μm) (Figures 5A,B).
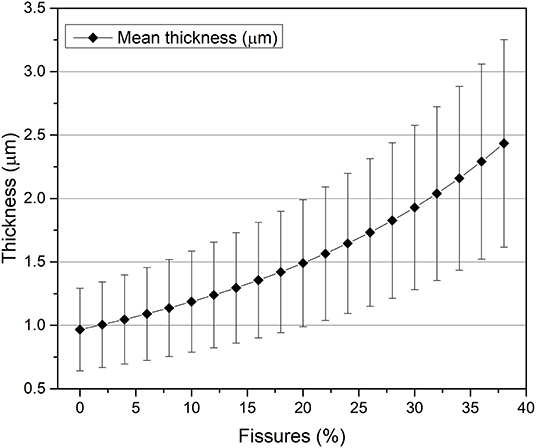
Figure 6. Mean thickness variation with increasing fissure volume.
The minimum detectable thickness can be calculated by the following relation:
The copper Kα/Kβ ratio statistical error is 2.5%, having a corresponding minimum detectable thickness of 0.26 (Equation 6), which is almost constant. The observed standard deviation in the AoI (0.43 μm) can be interpreted, being statistical, as the square root of the quadratic sum of the statistical contribution and the remaining sample variation. The latter being 0.32 μm for the AoI, whereas the statistical uncertainty is 0.25, slightly less. The measured error (surface roughness, solid angle, etc.) is part of the sample contribution (). This is true because the measuring error comes mostly from the sample through geometrical factors. When calculating the same parameters for the entire region where gold is found (310 pixels), a larger observed standard deviation is found (0.42 μm), demonstrating that the selected AoI is in fact more homogeneous in respect to the whole sample.The histogram of the calculated thickness distribution for the AoI (91 pixels) is shown in Figure 7 and, for the selected fissure percentage (12%), the gilded layer thickness mean value obtained was of 1.24 ± 0.43 μm. There is no significant variation between the individual thickness means of the three sampled areas (1.26 ± 0.43, 1.20 ± 0.42, and 1.25 ± 0.39). In addition, it is observed that the histogram shows a normal distribution that supports the statement that the measured mean value looks unbiased.
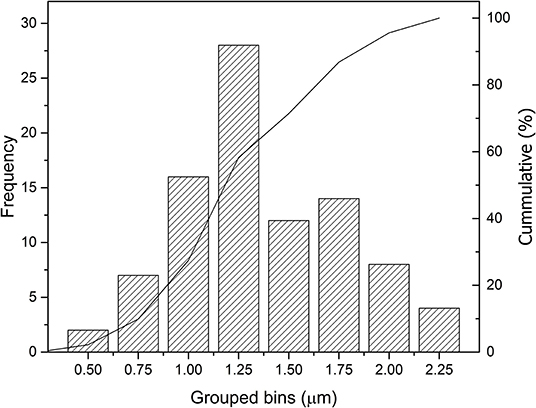
Figure 7. Grouped bins histogram of mean thickness values obtained with all 91 sampled pixels from the limited region of interest.
In Figure 8 the 3D plot of thickness distributions for the entirety of the gold layer is shown. When performing the calculations over the entire range where gold is detected (310 pixels), the results present systematic errors, where mean thickness values of up to 6.24 μm were observed. The high values are obtained exclusively in the regions where iron or lead are present in higher quantities, demonstrating the strong influence caused by great sample inhomogeneity.
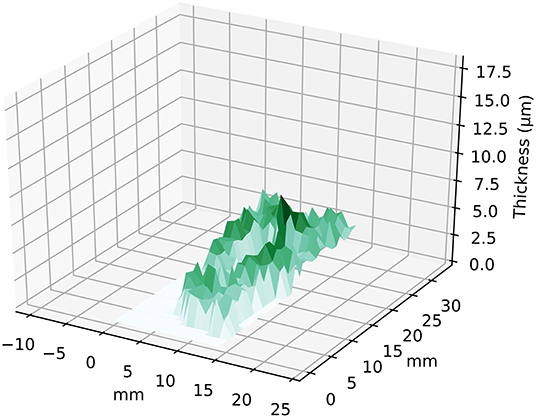
Figure 8. 3D plot of mean thickness values obtained for the entire sample region.
Conclusions
In the overall framework of recent research developments in MA-XRF analysis, which started in the last decade (Dik et al., 2008), an attempt was made to evaluate the capacity of measuring thin metallic layers deposited on a sample surface. For the first time, a new algorithm applied to MA-XRF datasets was developed to automatically extract net peak areas and, at the same time, to non-invasively determine the average thickness of an area of a given superimposing layer. The innovative algorithm was able to account different layer chemical compositions and fissure volumes, recalculating the linear attenuation coefficient according to the user input.
The results obtained with the proposed methodology were confronted with SEM-EDS cross-section analysis to assess its reliability. The non-invasive approach suggested a mean thickness value of 1.24 ± 0.43 μm, with a maximum of 2.20 μm for the amalgam-gilded layer, whereas the latter pointed to values of 1.65 and 3.00 μm in two different analyzed regions.
Some parameters needed to be considered and cautiously studied to achieve the most accurate results possible. Small variations in the gold and mercury concentration within the binary (Au/Hg) gilding layer were found to not significantly affect the mean thickness results. This is shown by the fact that the changes in the value measured in different areas of interest do not vary between them. Nonetheless, considering the influence of fissures percentage in the superficial gilding layer demonstrated to be of fundamental importance as it influences exponentially the final results. Last, the substrate in direct contact with the studied gilding layer had to be considered homogeneous throughout the sample. Because of that, areas with observable inhomogeneities or considerably different from the exposed central relief had to be unconsidered by the algorithm to not bias the final results.
The larger dataset naturally provided by MA-XRF scans yielded greater statistics than traditional spot measurements and in a faster fashion, thus making it possible to obtain a more accurate mean value as shown by the histogram distribution. Moreover, MA-XRF scans and the elemental distribution maps provided crucial information for selecting suitable regions where to perform the thickness calculations.
Finally, the indirect determination of a mean thickness value for an ancient amalgam-gilding stratum in a total non-invasive manner that is satisfactorily close to results obtained through other destructive methods was demonstrated to be possible.
Data Availability Statement
The datasets generated for this study are available on request to the corresponding author.
Author Contributions
SB drafted the work and performed the MA-XRF scanning experiments together with SR. SB, GG, and RC performed the scripting and MA-XRF data evaluation. GC, MA, and CR provided the sample for analysis, performed the sample treatment, sectioning, and SEM-EDS analysis. AF and PB developed a custom electronic readout for the MA-XRF scanner. LT conceptualized and reviewed the paper.
Funding
This project has received funding from the European Union's Horizon 2020 research and innovation programme under the Marie Skłodowska-Curie grant agreement No. 766311. LT and AF would like to thank Fondazione Roma (Grant No. 5229441F37) for research funding. The authors also acknowledge funding from Regione Lazio under the Project MUSA no. B86C17000280002, and project ADAMO No. B86C18001220002 of the Excellence Centre at the Lazio Technological District for Cultural Heritage (DTC).
Conflict of Interest
SR was employed by the company Ars Mensurae srl.
The remaining authors declare that the research was conducted in the absence of any commercial or financial relationships that could be construed as a potential conflict of interest.
Acknowledgments
The Surface Analysis Laboratory Roma Tre is part of laboratories within the Italian Institute for Nuclear Physics (INFN) network CHNet and the Excellence Center of the Lazio Technological District for Cultural Heritage (DTC).
References
Abdelhamid, M., Grassini, S., Angelini, E., Ingo, G. M., and Harith, M. A. (2010). Depth profiling of coated metallic artifacts adopting laser-induced breakdown spectrometry. Spectrochi.m Acta. B. 65, 695–701. doi: 10.1016/j.sab.2010.03.017
Ager, F. J., Ferretti, M., Grilli, M. L., Juanes, D., Ortega-Feliu, I., Respaldiza, M. A., et al. (2017). Reconsidering the accuracy of X-ray fluorescence and ion beam based methods when used to measure the thickness of ancient gildings. Spectrochim. Acta. B. 135, 42–47. doi: 10.1016/j.sab.2017.06.017
Anheuser, K. (1997). The pratice and characterization of historic fire gilding techniques. JOM 49, 58–62. doi: 10.1007/s11837-997-0015-6
Biocca, P., Santopadre, P., Sidoti, G., Sotgiu, G., de Notaristefani, F., and Tortora, L., (2016). ToF-SIMS study of gilding technique in the fresco Vela della Castità by Giotto's school. Surf. Interface Anal. 48, 404–408. doi: 10.1002/sia.5956
Bottaini, C., Brunetti, A., Bordalo, R., Valera, A., and Schiavon, N. (2017). Non-destructive characterization of archeological Cu-based artifacts from the early metallurgy of southern Portugal. Archaeol. Anthropol. Sci. 10, 1903–1912. doi: 10.1007/s12520-017-0501-x
Brunetti, A., Fabian, J., la Torre, C., and Schiavon, N. (2016). A combined XRF/Monte Carlo simulation study of multilayered peruvian metal artifacts from the tomb of the priestess of chornancap. Appl. Phys. A-Mater. 22, 1–8. doi: 10.1007/s00339-016-0096-6
Callister, W. D. J. (2007). Materials Science and Engineering An Introduction, 7th ed. New York, NY: John Wiley & Sons, Inc.
Cesareo, R. (2003). Non-destructive EDXRF-analysis of the golden haloes of Giotto's frescos in the chapel of the scrovegni in Padua. Nucl. Instrum. Methods Phys. Res. B. 211, 133–137. doi: 10.1016/S0168-583X(03)01165-0
Cesareo, R., Buccolieri, G., Castellano, A., Lopes, R. T., de Assis, J. T., Ridolfi, S., et al. (2015). The structure of two-layered objects reconstructed using EDXRF-analysis and internal X-ray ratios. X-Ray Spectrom. 44, 233–238. doi: 10.1002/xrs.2611
Cesareo, R., Bustamante, A., Fabian, J., Calza, C., dos Anjos, M., Lopes, R. T., et al. (2010). Energy-dispersive X-ray fluorescence analysis of a pre-Columbian funerary gold mask from the museum of Sicán, Peru. X-Ray Spectrom. 39, 122–126. doi: 10.1002/xrs.1192
Cesareo, R., Franco Jordan, R., Fernandez, A., Bustamante, A., Fabian, J., del Pilar Zambrano, S., et al. (2016). Analysis of the spectacular gold and silver from the Moche tomb “Señora de Cao.” X-Ray Spectrom. 45, 138–154. doi: 10.1002/xrs.2680
Cesareo, R., Rizzutto, M. A., Brunetti, A., and Rao, D. V. (2009). Metal location and thickness in a multilayered sheet by measuring Kα/Kβ, Lα/Lβ and Lα/Lγ X-ray ratios. Nucl. Instrum. Methods Phys. Res. B. 267, 2890–2896. doi: 10.1016/j.nimb.2009.06.119
Dik, J., Janssens, K., van der Snickt, G., van der Loeff, L., Rickers, K., and Cotte, M. (2008). Visualization of a lost painting by vincent van gogh using synchrotron radiation based X-ray fluorescence elemental mapping. Anal Chem. 80, 6436–6442. doi: 10.1021/ac800965g
Eveno, M., Ravaud, E., Calligaro, T., Pichon, L., and Laval, E. (2014). The louvre crucifix by giotto – unveiling the original decoration by 2D-XRF, X-ray radiography, emissiography and SEM-EDX analysis. Herit. Sci. 2, 1–9. doi: 10.1186/s40494-014-0017-y
Giurlani, W., Berretti, E., Innocenti, M., and Lavacchi, A. (2019). Coating thickness determination using x-ray fluorescence spectroscopy: monte carlo simulations as an alternative to the use of standards. Coatings 9:79. doi: 10.3390/coatings9020079
Graziani, V., Iorio, M., Albini, M., Riccucci, C., di Carlo, G., Branchini, P., and Tortora, L. (2020). Metals and environment: chemical outputs from the interaction between gilded copper-based objects and burial soil. Front. Mater. 7, 1–32. doi: 10.3389/fmats.2020.00032
Guerra, M. F. (2000). “The study of the characterisation and provenance of coins and other metalwork using XRF, PIXE and activation analysis,” in Radiation in Art and Archeometry, eds D. C. Cragh, and D. A. Bradley (Amsterdam: Elsevier), 378–416. doi: 10.1016/B978-044450487-6/50063-8
Ingo, G. M., Guida, G., Angelini, E., di Carlo, G., Mezzi, A., and Padeletti, G. (2013). Ancient mercury-based plating methods: combined use of surface analytical techniques for the study of manufacturing process and degradation phenomena. Acc. Chem. Res. 46, 2365–2375. doi: 10.1021/ar300232e
Ingo, G. M., Riccucci, C., Lavorgna, M., Salzano de Luna, M., Pascucci, M., and di Carlo, G. (2016). Surface investigation of naturally corroded gilded copper-based objects. Appl. Surf. Sci. 387, 244–251. doi: 10.1016/j.apsusc.2016.06.082
Ingo, G. M., Riccucci, C., Pascucci, M., Messina, E., Giuliani, C., Biocca, P., et al. (2018). Combined use of FE-SEM+EDS, ToF-SIMS, XPS, XRD and OM for the study of ancient gilded artifacts. Appl. Surf. Sci. 446, 168–176. doi: 10.1016/j.apsusc.2018.01.278
Iorio, M., Graziani, V., Lins, S., Ridolfi, S., Branchini, P., Fabbri, A., et al. (2019). Exploring manufacturing process and degradation products of gilt and painted leather. Appl. Sci. 9:3016. doi: 10.3390/app9153016
Lechtman, H., Erlij, A., and Barry, E. J., Jr. (1982). New perspectives on moche metallurgy: techniques of gilding copper at loma negra, northern peru. Soc. Am. Archaeol. 47, 3–30. doi: 10.2307/280051
Nardes, R. C., Silva, M. S., Rezier, A. N. S., Sanches, F. A. C. R. A., Filho, H. S. G., and Santos, R. S. (2019). Study on Brazilian 18th century imperial carriage using x-ray nondestructive techniques. Radiat. Phys. Chem. 154, 74–78. doi: 10.1016/j.radphyschem.2018.04.005
Nørgaard, H. W. (2017). Portable XRF on prehistoric bronze artifacts: limitations and use for the detection of bronze age metal workshops. Open Archaeol. 3, 101–122. doi: 10.1515/opar-2017-0006
Pessanha, S., Manso, M., Antunes, V., Carvalho, M. L., and Sampaio, J. M. (2019a). Monte Carlo simulation of portable XRF setup: non-invasive determination of gold leaf thickness in indo-Portuguese panel paintings. Spectrochim. Acta. B. 156, 1–6. doi: 10.1016/j.sab.2019.04.006
Pessanha, S., Queralt, I., Carvalho, M. L., and Sampaio, J. M. (2019b). Determination of gold leaf thickness using X-ray fluorescence spectrometry: accuracy comparison using analytical methodology and Monte Carlo simulations. Appl. Radiat. Isot. 152, 6–10. doi: 10.1016/j.apradiso.2019.06.014
Quaranta, M., Catelli, E., Prati, S., Sciutto, G., and Mazzeo, R. (2014). Chinese archaeological artifacts: microstructure and corrosion behaviour of high-leaded bronzes. J. Cult. Herit. 15, 283–291. doi: 10.1016/j.culher.2013.07.007
Robbiola, L., Blengino, J. M., and Fiaud, C. (1998). Morphology and mechanisms of formation of natural patinas on archaeological Cu-Sn alloys. Corrosi. Sci. 40, 2083–2111. doi: 10.1016/S0010-938X(98)00096-1
Romano, F. P., Caliri, C., Cosentino, L., Gammino, S., Giuntini, L., Mascali, D., et al. (2014). Macro and micro full field X-ray fluorescence with an X-ray pinhole camera presenting high energy and high spatial resolution. Anal. Chem. 86, 10892–10899. doi: 10.1021/ac503263h
Shabunya-Klyachkovskaya, E. V., Kulakovich, O. S., Mitskevich, A. G., Moiseev, Y. F., Kiris, V., Matsukovich, A. S., et al. (2017). A multi-analytical study of the belarusian icon “Virgin Eleusa” (XVII cent.). J. Cult. Herit. 28, 158–163. doi: 10.1016/j.culher.2017.02.016
Tortora, L., de Notaristefani, F., and Ioele, M. (2014). ToF-SIMS investigation of gilt and painted leather: Identification of indigo, oil binder and gold varnish. Surf. Interface Anal. 46, 807–811. doi: 10.1002/sia.5450
Trojek, T. (2011). Reduction of surface effects and relief reconstruction in X-ray fluorescence microanalysis of metallic objects. J. Anal. At. Spectrom. 26, 1253–1257. doi: 10.1039/c0ja00187b
van Espen, P., and Lemberge, P. (2000). ED-XRF Spectrum evaluation and quantitative analysis using multivariative and nonlinear techniques. Advances in X-Ray Analysis 43, 560–569. Available online at: https://www.scopus.com/record/display.uri?eid=2-s2.0-0347227295&origin=inward&txGid=5d6916ffd27f7c79d81b380ac22c6e95
Keywords: gilding, MA-XRF, differential attenuation, Cu-based artifacts, thickness estimation
Citation: Barcellos Lins SA, Ridolfi S, Gigante GE, Cesareo R, Albini M, Riccucci C, di Carlo G, Fabbri A, Branchini P and Tortora L (2020) Differential X-Ray Attenuation in MA-XRF Analysis for a Non-invasive Determination of Gilding Thickness. Front. Chem. 8:175. doi: 10.3389/fchem.2020.00175
Received: 18 December 2019; Accepted: 26 February 2020;
Published: 13 March 2020.
Edited by:
Shusheng Zhang, Linyi University, ChinaReviewed by:
Przemyslaw Niedzielski, Adam Mickiewicz University, PolandMaria Rachele Guascito, University of Salento, Italy
Copyright © 2020 Barcellos Lins, Ridolfi, Gigante, Cesareo, Albini, Riccucci, di Carlo, Fabbri, Branchini and Tortora. This is an open-access article distributed under the terms of the Creative Commons Attribution License (CC BY). The use, distribution or reproduction in other forums is permitted, provided the original author(s) and the copyright owner(s) are credited and that the original publication in this journal is cited, in accordance with accepted academic practice. No use, distribution or reproduction is permitted which does not comply with these terms.
*Correspondence: Sergio Augusto Barcellos Lins, c2VyZ2lvLmxpbnNAcm9tYTMuaW5mbi5pdA==