 Sakari S. Karhula1,2*
 Mikko A. Finnilä1,3,4Jonathan D. Freedman5Sami Kauppinen1Maarit Valkealahti6Petri Lehenkari4,6,7
 Kenneth P. H. Pritzker8,9
 Heikki J. Nieminen1,10,11
 Brian D. Snyder12Mark W. Grinstaff5
 Simo Saarakkala1,4,13
- 1Research Unit of Medical Imaging, Physics and Technology, Faculty of Medicine, University of Oulu, Oulu, Finland
- 2Infotech Doctoral Program, University of Oulu, Oulu, Finland
- 3Department of Applied Physics, University of Eastern Finland, Kuopio, Finland
- 4Medical Research Center, University of Oulu, Oulu, Finland
- 5Departments of Biomedical Engineering and Chemistry, Boston University, Boston, MA, United States
- 6Department of Surgery and Intensive Care, Oulu University Hospital, Oulu, Finland
- 7Department of Anatomy and Cell Biology, University of Oulu, Oulu, Finland
- 8Department of Laboratory Medicine and Pathobiology, University of Toronto, Toronto, ON, Canada
- 9Mount Sinai Hospital, Toronto, ON, Canada
- 10Department of Physics, University of Helsinki, Helsinki, Finland
- 11Department of Neuroscience and Biomedical Engineering, Aalto University, Espoo, Finland
- 12Center for Advanced Orthopaedic Studies, Beth Israel Deaconess Medical Center, Harvard Medical School, Boston, MA, United States
- 13Department of Diagnostic Radiology, Oulu University Hospital, Oulu, Finland
Contrast-enhanced micro-computed tomography (CEμCT) with cationic and anionic contrast agents reveals glycosaminoglycan (GAG) content and distribution in articular cartilage (AC). The advantage of using cationic stains (e.g., CA4+) compared to anionic stains (e.g., Hexabrix®), is that it distributes proportionally with GAGs, while anionic stain distribution in AC is inversely proportional to the GAG content. To date, studies using cationic stains have been conducted with sufficient resolution to study its distributions on the macro-scale, but with insufficient resolution to study its distributions on the micro-scale. Therefore, it is not known whether the cationic contrast agents accumulate in extra/pericellular matrix and if they interact with chondrocytes. The insufficient resolution has also prevented to answer the question whether CA4+ accumulation in chondrons could lead to an erroneous quantification of GAG distribution with low-resolution μCT setups. In this study, we use high-resolution μCT to investigate whether CA4+ accumulates in chondrocytes, and further, to determine whether it affects the low-resolution ex vivo μCT studies of CA4+ stained human AC with varying degree of osteoarthritis. Human osteochondral samples were immersed in three different concentrations of CA4+ (3 mgI/ml, 6 mgI/ml, and 24 mgI/ml) and imaged with high-resolution μCT at several timepoints. Different uptake diffusion profiles of CA4+ were observed between the segmented chondrons and the rest of the tissue. While the X-ray -detected CA4+ concentration in chondrons was greater than in the rest of the AC, its contribution to the uptake into the whole tissue was negligible and in line with macro-scale GAG content detected from histology. The efficient uptake of CA4+ into chondrons and surrounding territorial matrix can be explained by the micro-scale distribution of GAG content. CA4+ uptake in chondrons occurred regardless of the progression stage of osteoarthritis in the samples and the relative difference between the interterritorial matrix and segmented chondron area was less than 4%. To conclude, our results suggest that GAG quantification with CEμCT is not affected by the chondron uptake of CA4+. This further confirms the use of CA4+ for macro-scale assessment of GAG throughout the AC, and highlight the capability of studying chondron properties in 3D at the micro scale.
Introduction
One of the early changes in osteoarthritis (OA) is the depletion of proteoglycans (PG) in articular cartilage (AC) [1]. Chondrocyte hypertrophy, proliferation, and chondron enlargement are also signs of OA progression [1]. Contrast-enhanced computed tomography (CECT) with anionic contrast agents, e.g., Hexabrix®, can be used in clinical settings to detect the loss of PGs [2, 3]. The distribution of anionic contrast agents in articular cartilage (AC) is inversely related to the PG content due to the repulsion between the anionic contrast agent and the anionic glycosaminoglycans (GAGs). Consequently, anionic contrast agents are repelled from the cartilage tissue, which limits their use for mapping the heterogeneous distribution of GAGs within the AC, especially in the deeper zones. To increase the sensitivity and tissue differentiation capabilities, new iodinated cationic contrast agents have been developed [4].
Cationic contrast agents (especially CA4+), compared to anionic ones, demonstrate strong positive correlation to GAG content and reveal GAG distribution in articular cartilage even when used at low concentrations [5–7]. Successful application of these cationic contrast agents in ex vivo and in vivo studies [7, 8] indicate significant research potential. The distribution of CA4+ in AC is based on the attraction between the positive CA4+ and the negatively charged GAG macromolecules [5]. Cationic dyes are routinely used in histology (e.g., Safranin O, Toluidine blue, Alcian blue) to stain the proteoglycans of AC. Cationic dyes tend to stain also the nucleic acids as the negative phosphate groups present on nucleic acids found within chrondocytes attract positively charged ions. Furthermore, the local GAG content within the AC regions around the chondrocytes is known to be higher in pericellular and territorial matrix compared to the interterritorial matrix. Thus, we hypothesize that cationic CA4+ will accumulate in the chondrons or in the close proximity of the chondrons. However, the previous studies using CA4+ enhanced micro-computed tomography (μCT) [5–9] have been conducted with insufficient resolution to answer this hypothesis. The insufficient resolution has also prevented to answer the question whether CA4+ accumulation in chondrons could lead to an erroneous quantification of GAG distribution with low resolution μCT setups. In this study, we use high-resolution μCT, for the first time, to investigate whether CA4+ accumulates in chondrocytes, and further, to determine whether it affects the low-resolution ex vivo μCT studies of CA4+ stained human AC with varying degree of osteoarthritis.
Materials and Methods
To study CA4+ accumulation in human osteochondral samples two samplesets were generated. The first sample set was used to investigate the diffusion of CA4+ in chondrons and to optimize CA4+ protocol for human articular cartilage in ex vivo. The second set was used for investigating how CA4+ chondron accumulation would affect the analysis conducted with lower resolution μCT systems. The CA4+ solutions were prepared as previously described [7].
Sample Preparation and Contrast Agent Staining
For diffusion tests, three adjacent cylindrical (diameter = 2 mm) human osteochondral samples (n = 9) were harvested from total knee arthroplasty patients (N = 3, 1 female, 2 males, age range 56–77) under the approval of the ethics committee of Northern Ostrobothnia Hospital District (permit no: 7/2013). Written informed consents were obtained from all patients. From each patient, cores were exposed to a three different concentration of CA4+ (3, 6, and 24 mgI/ml; n = 3 per concentration) and imaged with CEμCT in several time points (0, 1, 3, 5, 9, 18, 24, 32, 40, and 48 h). The CA4+ concentrations used in this study were selected based on the previous studies using CA4+ for animal AC (concentration ranged between 8 and 27 mgI/ml) [5, 6, 10] and our preliminary trials with the human AC.
Based on the results from the diffusion tests, optimized protocol (24 h immersion to 6 mgI/ml concentration of CA4+) was selected and cylindrical (diameter = 2mm) osteochondral samples (n = 14) from tibial plateus of 14 total knee arthroplasty patients (approved by ethics committee of Northern Ostrobothnia Hospital District, permit no: 7/2013) with varying degree of osteoarthritis were subjected to the optimized staining protocol. From these 14 patients, 10 were females and 4 were males, the age range was 51–86.
CEμCT
Prior to each scan, samples were removed from the CA4+ solution, wrapped in parafilm and embedded inside the dental wax in order to fix the sample to its holder and to prevent it from drying during the scan. Scans were conducted with Skyscan 1272 μCT system (Brüker microCT, Kontich, Belgium) using the following settings: 45 kV tube voltage, 222 μA tube current, 1,200 projections, 3,050 ms exposure time, averaging 2 frames/projection, and 3.2 μm isotropic voxel size. Projection data were reconstructed with NRecon-software (v.1.6.9.8, Brüker microCT, Kontich, Belgium) with ring artifact and beam hardening corrections.
Processing and Analysis of Diffusion Dataset
From the reconstructed image stacks of diffusion dataset, 3D rigid body (6 degrees of freedom) image co-registration was conducted sample-wise for different timepoints with the Dataviewer software (v.1.5.1.3, Brüker microCT, Kontich, Belgium). Volume of interest (VOI) of 250 × 250 × Z μm was selected manually, Z being the sample-wise cartilage thickness (range 1,200–3,100 μm). CA4+ accumulated in the chondrocytes and, consequently, the chondrocytes were segmented with the CTAn-software (v.1.15.4.0, Brüker microCT, Kontich, Belgium) in order to analyze the CA4+ accumulation and diffusion in chondrons and interterritorial matrix (ITM) separately. Due the varying background grayscale values depending on CA4+ concentration and PG distribution, the segmentation was conducted with multilevel OTSU's method [11] in 3D and selecting first level (highest gray level values) as a chondron data. Prior to segmentation, noise removal was applied to datasets (uniform filter & unsharp mask). The segmentation of chondrons was conducted for the 48 h timepoint datasets in order to generate a separate binary mask of chondron volumes for each sample. This sample-wise binary mask was applied to other timepoints in order to segment the chondron volumes and to ensure that intensity alterations were investigated (due the diffusion of contrast agent). To generate the ITM volume of interest the chondron volume was subtracted from the original volume of interest. Sample and data processing for diffusion sample set is illustrated in Figure 1.
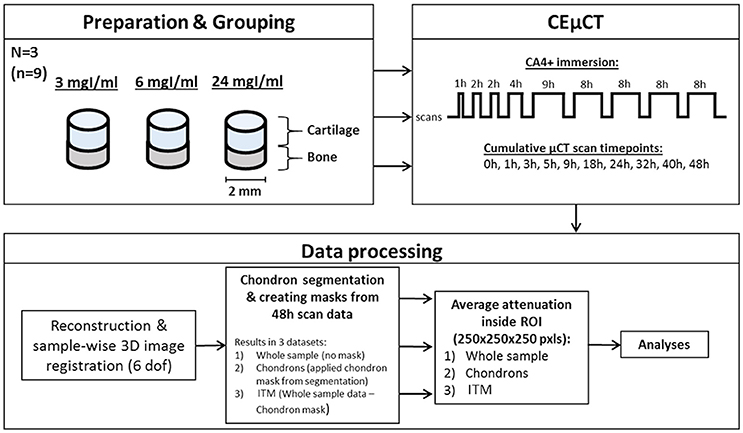
Figure 1. Flow chart of the sample procedure for diffusion sample set. Three adjacent cylindrical (diameter = 2 mm) osteochondral samples (n = 9) were harvested from three human femurs and divided to groups depending on the concentration of CA4+ immersion bath. Samples were scanned prior the immersion and in several timepoints (0–48 h) during the CA4+ immersion. Data-processing included reconstruction of μCT datasets, co-registration, segmentation of chondrons, and selection of Volume of Interests (VOIs) prior the analysis.
Datasets were grouped by contrast agent concentration used, and the gray level values (corresponding to the X-ray attenuation of CA4+ stained articular cartilage) were averaged through the whole depth and sample groups. Mean grayscale values were calculated for the data from the whole AC, segmented ITM, and segmented chondrons separately in each timepoint. Finally, the resulting mean grayscale values were normalized inside groups before fitting the equation 1 to datapoints. Equation (1) was derived from the previous studies [6, 12].
The diffusion of CA4+ was modeled by fitting (Equation 1) to the data points:
where the normalized X-ray attenuation A depends on time t, the maximum X-ray attenuation Amax, fit-dependent variable K, and the time constant τ. CA4+ immersion was determined to be sufficient when A reached 98% from Amax. The sufficient CA4+ immersion times were calculated for each fit.
Relative Difference between X-Ray Attenuation in ITM Volume and Full Tissue Volume
To determine how the CA4+ accumulation into chondron area would affect analyzing the GAG content in full tissue volume, averaged X-ray attenuation in segmented ITM volume was compared to averaged X-ray attenuation values in full tissue volume. Segmentation of chondrons were conducted as for the diffusion dataset described earlier. Mean grayscale values were calculated for the data from the full AC volume, and segmented ITM volume. Relative difference between the X-ray attenuation of ITM-segmented volume and unsegmented full tissue volume was calculated.
Histological Analyses
Adjacent sample plugs were subjected to histology for visual comparison between histological stains and CA4+. Thin 3 μm sections were prepared for Safranin O [13] stain to visualize the distribution of cationic stain in articular cartilage. For diffusion sample series, additional cationic histological stain Toluidine Blue was used to visualize the distribution of cationic stains in articular cartilage. Safranin O stained histological slices were evaluated with OARSI grading to estimate the OA progress in samples. The Spearman's rho was used to calculate the correlation between the OARSI grades and the averaged X-ray attenuation values (with ITM volume, chondrons and full tissue separately). The correlations were calculated with IBM SPSS (v.24, International Business Machines Corporation, Armonk, NY, U.S).
Results
The cationic CA4+ contrast agent accumulated in chondrocytes at all tested concentrations (Figure 2A). However, the extent of CA4+ accumulation differed between the chondron area and rest of the ITM. As expected, Safranin O and Toluidine Blue indicated similar depth-wise distribution of GAGs as observed with CA4+ stained AC, i.e., by having stronger staining in deeper tissue than that closer to the surface (Figure 2A). Additionally, visual differences were apparent between the stainability of GAG distribution with the different histological stains as well as between the different concentrations of CA4+. Toluidine Blue stain also showed increased stain outside of chondrocytes partially in the territorial matrix, and upon comparison to the images obtained with CA4+ enhanced μCT, CA4+ accumulated in both pericellular and the territorial matrix similarly and the stained area corresponded size-wise to the areas stained by Toluidine Blue (Figure 2B). The use of CA4+ enabled identification of the whole chondrons and parts of territorial matrix in cases where territorial matrix has a higher GAG content.
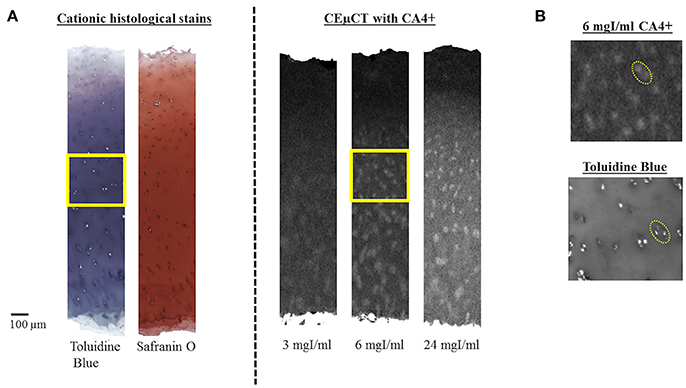
Figure 2. (A) Comparison of histological cationic stains to CEμCT with different concentrations of CA4+ (at 48 h). Safranin O and Toluidine Blue indicate similar GAG depth-wise distribution as in CA4+ stained AC by having stronger staining deeper on the tissue compared to the surface. Additionally, the difference in dynamic depth-wise stainability of GAG distribution can be observed between different histological stains as well as between the different concentrations of CA4+. Scalebar on the left corner 100 μm. Areas restricted by yellow square magnified in (B). (B) Magnification of Toluidine Blue stain (below) compared to 6mgI/ml concentration of CA4+, shows that the CA4+ accumulation exceeds the cell areas according to the GAG content around the chondrons (yellow dotted line circle, scaled to same size in both CA4+ and Toluidine Blue image).
Mean X-ray attenuation values in CA4+ stained chondrons, ITM, and in whole AC were obtained as a function of time (Figure 3). Strong correlations were observed when fitting the Equation (1) to the data points (Figure 3, Table 1). The time constant τ, calculated from the Equation (1), indicated the time point when the X-ray attenuation reached 63.2% from the maximum. With each concentration, the time constant was similar in unsegmented (whole AC) and ITM-segmented data (3 mgI/ml: whole AC = 1.678, ITM = 1.67; 6 mgI/ml: whole AC = 1.800, ITM = 1.749; 24 mgI/ml: whole AC = 1.216, ITM = 1.203), and in the chondron-segmented data, the time constant was higher compared to the ITM and unsegmented data (3 mgI/ml = 2.487; 6 mgI/ml = 2.486; 24 mgI/ml = 1.374).
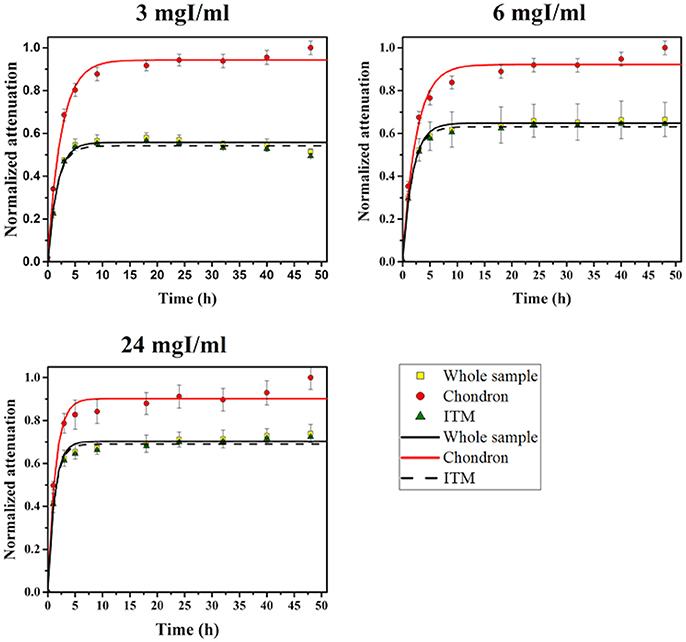
Figure 3. Diffusion profiles fitted on Chondron segmented, ITM segmented and unsegmented (Whole sample) data. Datapoints present normalized and averaged x-ray attenuation values in CA4+ stained chondron areas (Chondron), interterritorial matrix (ITM) and in whole articular cartilage (Whole sample). Datapoints were averaged inside each CA4+ concentration group (N = 3) and the standard deviation inside the group is presented as error bars in the plots. Equation (1) was used for the fits. Similarities of the diffusion profiles for the whole sample (both) and for the ITM can be observed.
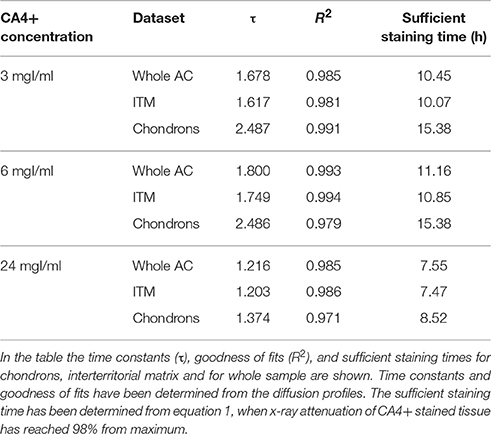
Table 1. Main results.
Sufficient staining times (h) were in the same range with CA4+ concentrations of 3 and 6 mgI/ml (Table 1), indicating that the staining time for the ITM and whole sample was in the range of 10–11 h and the corresponding time for the chondrocytes was ~15 h. However, with a CA4+ concentration of 24 mgI/ml, the staining times were shorter (~7.5 h for whole sample and ITM and ~8.5 h for chondrons).
The relative difference between ITM and unsegmented data was less than 4% in cartilage samples with varying OARSI grades (1.0–4.5). No correlation between the CA4+ accumulation and OARSI was found in this study (Chondron area: ρ = −0.047, ITM: ρ = 0.070, Full Tissue: ρ = 0.070). Visual comparison of CA4+ to histology showed that the depth-wise PG distribution compared relatively well with CA4+ distribution in the AC (Figure 4). The PG depletion, was observed in some samples (Figure 4: OARSI 1.5, 2.5, 3.5, and 4.5), but it did not seem to increase with the severity of the OARSI grade.
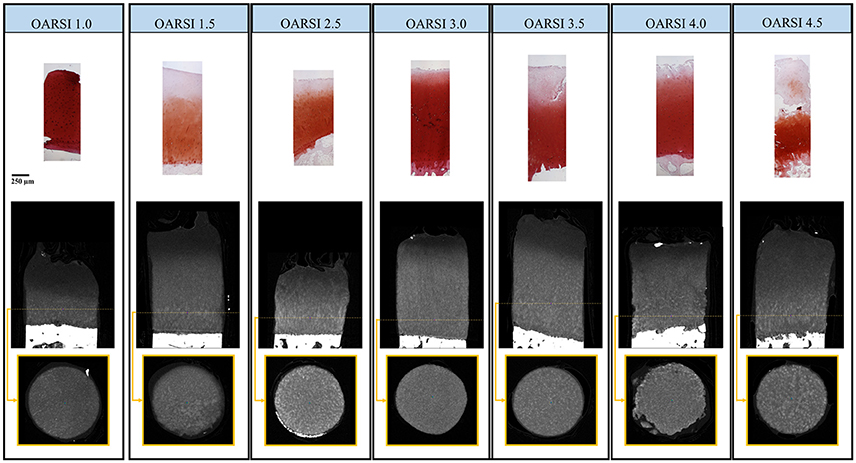
Figure 4. The OARSI graded histological samples (Safranin O− stained, top row) compared to the adjacent samples stained with CA4+ and imaged with μCT (middle row). The representative cross section (bottom row encircled with yellow box), from the deep zone (yellow dotted line) of the CA4+ stained plug shows varying micro-scale CA4+ accumulation. However the accumulation did not correlate with OARSI grading conducted from the adjacent histological cores. Histological slides and μCT images are set to same scale. Global scale bar (250 μm) under OARSI 1.0 – histological sample.
Discussion
The findings of this study support our hypothesis that cationic CA4+ accumulates in both the ITM and the chondrons at all concentrations investigated (e.g., 3, 6, and 24 mgI/ml). However, the contrast between the ITM and the chondrons is weakest at the lowest 3 mgI/ml CA4+ concentration (see Figure 2 and Supplemental Video 1) and not all chondrons are distinguishable after a 48 h immersion incubation time. Furthermore, CA4+ accumulation in the chondrons, located in the surface zone, is minimal with all concentrations investigated. Several studies describe zonal differences for GAG synthesis in chondrocytes [14–16] reporting reduced GAG synthesis of the chondrocytes in the surface zone compared to the deeper zones. This might explain why the CA4+ does not accumulate in surface layer chondrons and, furthermore, indicates that the attraction of nucleic acids alone are not sufficient for CA4+ accumulation in the chondrons. Comparison of chondron areas stained by CA4+ by the cationic Toluidine Blue staining showed that the CA4+ accumulates similarly as cationic histological stains also to the territorial matrix related to the GAG content.
The time constants for chondron-segmented data are higher than the value determined for ITM data at all concentrations. In fact, the CA4+ diffusion to chondron areas should be slower than in ITM due to the fact that the CA4+ diffusion to chondrons is dependent on the concentration of CA4+ in ITM. The CA4+ accumulation in the bulk ITM, containing the GAGs, is similar to the CA4+ accumulation in the whole sample as a function of time at all concentrations evaluated. The mean X-ray attenuation inside the whole tissue volume, calculated from the bulk analysis is not greatly affected by the CA4+ accumulation in chondron areas. Our results from the calculation of the relative difference between the ITM-segmented data and with the whole AC data also support this conclusion. The relative difference is less than 4% even at it greatest the difference. This observation limits the maximum accuracy of GAG content analyses conducted from the data obtained from low-resolution μCT or from clinical CT. However, strong correlations between the bulk GAG content and CA4+ distribution in several species are reported [6, 9], and with immersion times less than 24 h this small inaccuracy is even further decreased (maximum relative difference <1.5%).
In addition to GAG content, high-resolution μCT provides information about the microstructure of AC. Based on the size of these microstructures, these fine structures are likely chondrons but they may include parts of territorial matrix in some cases where the territorial matrix is high in GAG content. In general, the investigation of fine structures of AC with CEμCT is limited. With μCT systems, the pursuit for higher resolution increases the duration of the scan, and as the x-ray attenuation is heavily dependent on the contrast agent distribution, the diffusion of the contrast agent during the scan may result in moving artifacts and/or noise associated with the fine structure. This hinders the accurate segmentation of chondrons and their morphological analysis challenging. However, increase of GAG synthesis in the early stage of OA when compared to normal and late-stage OA has been reported [17]. This phenomenon, in theory, could increase the staining intensity of CA4+ in and near chondrons. Therefore, the use of CA4+ in high-resolution ex vivo μCT could provide tools for further OA research.
To our surprise, we did not find a statistically significant correlation between the CA4+ accumulation and the histological OARSI grades. A few limitations in our study might explain the absence of this correlation. First, it is important to notice that the OARSI grade evaluates the progression of OA based mainly on the cartilage degradation, giving only a low emphasis for the changes in macro- or micro-level GAG content and distribution. Figure 4 shows that the distribution of GAG content in histological stains (Safranin O) is relatively similar between the varying OARSI grades (OARSI 1.0-4.5). Figure 4 also shows that the slight differences between the histology and the CEμCT images is due the adjacency of these cores. Moreover, the heterogeneity of OA phenotypes and relatively wide age-range of the studied patients might have negatively influenced the correlation between the CA4+ stainability and OA progression. Especially the aging has been linked to the changes in the size, structure, and sulfation of human articular cartilage aggrecans [18–20]. Besided the above mentioned major limitations, following additional limitations of this study are noted. A detailed visual comparison with cationic histological stains suggests that CA4+ accumulation extends outside the chondrons in the territorial matrix, and thus segmentation of chondrons is challenging. Furthermore, the lack of healthy cartilage samples in this study may skew the PG distribution, and thus CA4+ accumulation in chondron areas in this study.
In conclusion, CA4+ accumulates in both the ITM and chondrons within AC enabling visualization of local GAG distribution within human AC corresponding to the histological cationic stains in histological sections. The efficient uptake of CA4+ into chondrons and surrounding territorial matrix is a consequence of the microscopic distribution of GAG content. CA4+ uptake in chondrons occurred regardless of the progression stage of OA and the relative difference between the ITM with and without segmented chondron area was less than 4%. Thus, macroscopic GAG quantification with low-resolution images is not affected by the chondron uptake of CA4+. The results of this study show that the use of CA4+ provides a means to study chondron properties in 3D (i.e., micro scale analysis) while retaining the capability to do conventional macro-scale assessment.
Author Contributions
All authors contributed to the conception and design of the study. SSK, MF, JF, SK, MV, PL participated in acquisition and analysis of the data. All authors contributed to interpreting the data, drafting or revising the manuscript, and have approved the submitted version of the manuscript.
Conflict of Interest Statement
The authors declare that the research was conducted in the absence of any commercial or financial relationships that could be construed as a potential conflict of interest.
Acknowledgments
The financial support in part from the Academy of Finland (grants no. 268378, 273571, 253579); Sigrid Juselius Foundation; European Research Council under the European Union's Seventh Framework Programme (FP/2007-2013)/ERC Grant Agreement no. 336267; the strategic funding of the University of Oulu; the National Institutes of Health (R01GM098361), and the T32 Pharmacology Training grant (5T32GM008541-14) are acknowledged.
Supplementary Material
The Supplementary Material for this article can be found online at: http://journal.frontiersin.org/article/10.3389/fphy.2017.00038/full#supplementary-material
Supplemental Video 1. CA4+ Diffusion in Human Articular Cartilage with Different CA4+ Concentrations.
References
1. Pritzker KPH. Pathology of osteoarthritis. In: Brandt KD, editor. Osteoarthritis, 2nd Edn. Oxford, MS: Oxford University Press (2003) 14:13–29.
2. Siebelt M, van Tiel J, Waarsing JH, Piscaer TM, van Straten M, Booij R, et al. Clinically applied CT arthrography to measure the sulphated glycosaminoglycan content of cartilage. Osteoarthritis Cartilage (2011) 19:1183–9. doi: 10.1016/j.joca.2011.07.006
3. van Tiel J, Siebelt M, Waarsing JH, Piscaer TM, van Straten M, Booij R, et al. CT arthrography of the human knee to measure cartilage quality with low radiation dose. Osteoarthritis Cartilage (2012) 20:678–85. doi: 10.1016/j.joca.2012.03.007
4. Lusic H, Grinstaff MW. X-ray-computed tomography contrast agents. Chem Rev. (2013) 113:1641–66. doi: 10.1021/cr200358s
5. Bansal PN, Stewart RC, Entezari V, Snyder BD, Grinstaff MW. Contrast agent electrostatic attraction rather than repulsion to glycosaminoglycans affords a greater contrast uptake ratio and improved quantitative CT imaging in cartilage. Osteoarthritis Cartilage (2011) 19:970–6. doi: 10.1016/j.joca.2011.04.004
6. Bansal PN, Joshi NS, Entezari V, Malone BC, Stewart RC, Snyder BD, et al. Cationic contrast agents improve quantification of glycosaminoglycan (GAG) content by contrast enhanced CT imaging of cartilage. J Orthop Res. (2011) 29:704–9. doi: 10.1002/jor.21312
7. Joshi NS, Bansal PN, Stewart RC, Snyder BD, Grinstaff MW. Effect of contrast agent charge on visualization of articular cartilage using computed tomography: exploiting electrostatic interactions for improved sensitivity. J Am Chem Soc. (2009) 131:13234–5. doi: 10.1021/ja9053306
8. Lakin BA, Ellis DJ, Shelofsky JS, Freedman JD, Grinstaff MW, Snyder BD. Contrast-enhanced CT facilitates rapid, non-destructive assessment of cartilage and bone properties of the human metacarpal. Osteoarthritis Cartilage (2015) 23:2158–66. doi: 10.1016/j.joca.2015.05.033
9. Lakin BA, Patel H, Holland C, Freedman JD, Shelofsky JS, Snyder BD, et al. Contrast-enhanced CT using a cationic contrast agent enables non-destructive assessment of the biochemical and biomechanical properties of mouse tibial plateau cartilage. J Orthop Res. (2015) 34:1130–8. doi: 10.1002/jor.23141
10. Stewart RC, Bansal PN, Entezari V, Lusic H, Nazarian RM, Snyder BD, et al. Contrast-enhanced CT with a high-affinity cationic contrast agent for imaging ex vivo bovine, intact ex vivo rabbit, and in vivo rabbit cartilage. Radiology (2013) 266:141–50. doi: 10.1148/radiol.12112246
11. Otsu N. A threshold selection method from gray-level histograms. IEEE Trans Syst Man Cybern. (1979) 9:62–6. doi: 10.1109/TSMC.1979.4310076
12. Mashiatulla M, Moran MM, Chan D, Li J, Freedman JD, Snyder BD, et al. Murine articular cartilage morphology and compositional quantification with high resolution cationic contrast-enhanced muCT. J Orthop Res. (2017). doi: 10.1002/jor.23595. [Epub ahead of print].
13. Kiviranta I, Jurvelin J, Tammi M, Saamanen AM, Helminen HJ. Microspectrophotometric quantitation of glycosaminoglycans in articular cartilage sections stained with Safranin O. Histochemistry (1985) 82:249–55. doi: 10.1007/BF00501401
14. Archer CW, McDowell J, Bayliss MT, Stephens MD, Bentley G. Phenotypic modulation in sub-populations of human articular chondrocytes in vitro. J Cell Sci. (1990) 97:361–71.
15. Aydelotte MB, Greenhill RR, Kuettner KE. Differences between sub-populations of cultured bovine articular chondrocytes. II. Proteoglycan metabolism. Connect Tissue Res. (1988) 18:223–34. doi: 10.3109/03008208809016809
16. Siczkowski M, Watt FM. Subpopulations of chondrocytes from different zones of pig articular cartilage. Isolation, growth and proteoglycan synthesis in culture. J Cell Sci. (1990) 97:349–60.
17. Venkatesan N, Barre L, Bourhim M, Magdalou J, Mainard D, Netter P, et al. Xylosyltransferase-I regulates glycosaminoglycan synthesis during the pathogenic process of human osteoarthritis. PLoS ONE (2012) 7:e34020. doi: 10.1371/journal.pone.0034020
18. Buckwalter JA, Roughley PJ, Rosenberg LC. Age-related changes in cartilage proteoglycans: quantitative electron microscopic studies. Microsc Res Tech. (1994) 28:398–408. doi: 10.1002/jemt.1070280506
19. Wells T, Davidson C, Morgelin M, Bird JL, Bayliss MT, Dudhia J. Age-related changes in the composition, the molecular stoichiometry and the stability of proteoglycan aggregates extracted from human articular cartilage. Biochem J (2003) 370(Pt 1):69–79. doi: 10.1042/bj20020968
Keywords: contrast agent, articular cartilage, chondron, computed tomography, CA4+
Citation: Karhula SS, Finnilä MA, Freedman JD, Kauppinen S, Valkealahti M, Lehenkari P, Pritzker KPH, Nieminen HJ, Snyder BD, Grinstaff MW and Saarakkala S (2017) Micro-Scale Distribution of CA4+ in Ex vivo Human Articular Cartilage Detected with Contrast-Enhanced Micro-Computed Tomography Imaging. Front. Phys. 5:38. doi: 10.3389/fphy.2017.00038
Received: 01 June 2017; Accepted: 18 August 2017;
Published: 31 August 2017.
Edited by:
Zhen Cheng, Stanford University, United StatesReviewed by:
Riccardo Lattanzi, New York University Langone Medical Center, United StatesPascal Sati, National Institutes of Health, United States
Copyright © 2017 Karhula, Finnilä, Freedman, Kauppinen, Valkealahti, Lehenkari, Pritzker, Nieminen, Snyder, Grinstaff and Saarakkala. This is an open-access article distributed under the terms of the Creative Commons Attribution License (CC BY). The use, distribution or reproduction in other forums is permitted, provided the original author(s) or licensor are credited and that the original publication in this journal is cited, in accordance with accepted academic practice. No use, distribution or reproduction is permitted which does not comply with these terms.
*Correspondence: Sakari S. Karhula, c2FrYXJpLmthcmh1bGFAb3VsdS5maQ==