 José A. Morales1,2
 Ewan Colman3,4Sergio Sánchez2
 Fernanda Sánchez-Puig1
 Carlos Pineda2,5
 Gerardo Iñiguez6,7Germinal Cocho2,4Jorge Flores2
 Carlos Gershenson3,4,8,9*
- 1Facultad de Ciencias, Universidad Nacional Autónoma de México, Mexico City, Mexico
- 2Instituto de Física, Universidad Nacional Autónoma de México, Mexico City, Mexico
- 3Instituto de Investigaciones en Matemáticas Aplicadas y en Sistemas, Universidad Nacional Autónoma de México, Mexico City, Mexico
- 4Centro de Ciencias de la Complejidad, Universidad Nacional Autónoma de México, Mexico City, Mexico
- 5Faculty of Physics, University of Vienna, Vienna, Austria
- 6Next Games, Helsinki, Finland
- 7Department of Computer Science, School of Science, Aalto University, Espoo, Finland
- 8SENSEable City Lab, Massachusetts Institute of Technology, Cambridge, MA, United States
- 9High Performance Computing Department, ITMO University, St. Petersburg, Russia
The recent dramatic increase in online data availability has allowed researchers to explore human culture with unprecedented detail, such as the growth and diversification of language. In particular, it provides statistical tools to explore whether word use is similar across languages, and if so, whether these generic features appear at different scales of language structure. Here we use the Google Books N-grams dataset to analyze the temporal evolution of word usage in several languages. We apply measures proposed recently to study rank dynamics, such as the diversity of N-grams in a given rank, the probability that an N-gram changes rank between successive time intervals, the rank entropy, and the rank complexity. Using different methods, results show that there are generic properties for different languages at different scales, such as a core of words necessary to minimally understand a language. We also propose a null model to explore the relevance of linguistic structure across multiple scales, concluding that N-gram statistics cannot be reduced to word statistics. We expect our results to be useful in improving text prediction algorithms, as well as in shedding light on the large-scale features of language use, beyond linguistic and cultural differences across human populations.
1. Introduction
The recent availability of large datasets on language, music, and other cultural constructs has allowed the study of human culture at a level never possible before, opening the data-driven field of culturomics [1–13]. In the social sciences and humanities, lack of data has traditionally made it difficult or even impossible to contrast and falsify theories of social behavior and cultural evolution. Fortunately, digitalized data and computational algorithms allow us to tackle these problems with a stronger statistical basis [14]. In particular, the Google Books N-grams dataset [2, 15–22] continues to be a fertile source of analysis in culturomics, since it contains an estimated 4% of all books printed throughout the world until 2009. From the 2012 update of this public dataset, we measure frequencies per year of words (1-grams), pairs of words (2-grams), up until N-grams with N = 5 for several languages, and focus on how scale (as measured by N) determines the statistical and temporal characteristics of language structure.
We have previously studied the temporal evolution of word usage (1-grams) for six Indo-European languages: English, Spanish, French, Russian, German, and Italian, between 1800 and 2009 [23]. We first analyzed the language rank distribution [24–27], i.e., the set of all words ordered according to their usage frequency. By making fits of this rank distribution with several models, we noticed that no single functional shape fits all languages well. Yet, we also found regularities on how ranks of words change in time: Every year, the most frequent word in English (rank 1) is “the,” while the second most frequent word (rank 2) is “of.” However, as the rank k increases, the number of words occupying the k-th place of usage (at some point in time) also increases. Intriguingly, we observe the same generic behavior in the temporal evolution of performance rankings in some sports and games [28].
To characterize this generic feature of rank dynamics, we have proposed the rank diversity d(k) as the number of words occupying a given rank k across all times, divided by the number T of time intervals considered (for [23], T = 210 intervals of 1 year). For example, in English d(1) = 1/210, as there is only one word (“the”) occupying k = 1 every year. The rank diversity increases with k, reaching a maximum d(k) = 1 when there is a different word at rank k each year. The rank diversity curves of all six languages studied can be well approximated by a sigmoid curve, suggesting that d(k) may reflect generic properties of language evolution, irrespective of differences in grammatical structure and cultural features of language use. Moreover, we have found rank diversity useful to estimate the size of the core of a language, i.e., the minimum set of words necessary to speak and understand a tongue [23].
In this work, we extend our previous analysis of rank dynamics to N-grams with N = 1, 2, …5 between 1855 and 2009 (T = 155) for the same six languages, considering the first 10, 913 ranks in all 30 datasets (to have equal size and avoid potential finite-size effects). In the next section, we present results for the rank diversity of N-grams. We then compare empirical digram data with a null expectation for 2-grams that are randomly generated from the monogram frequency distribution. Results for novel measures of change probability, rank entropy, and rank complexity follow. Change probability measures how often words change rank (even if they have visited the same ranks before). Rank entropy applies Shannon information to the words appearing at each rank, so it can be more precise than rank diversity, as it also considers the probability of words occurring at each rank. Rank entropy can be used to calculate rank complexity, which can be seen as a balance between variability and adaptability. Next, we discuss the implications of our results, from practical applications in text prediction algorithms, to the emergence of generic, large-scale features of language use despite the linguistic and cultural differences involved. Details of the methods used close the paper.
2. Results
2.1. Rank Diversity of N-Gram Usage
Figure 1 shows the rank trajectories across time for selected N-grams in French, classified by value of N and their rank of usage in the first year of measurement (1855). The behavior of these curves is similar for all languages: N-grams in low ranks (most frequently used) change their position less than N-grams in higher ranks, yielding a sigmoid rank diversity d(k) (Figure 2). Moreover, as N grows, the rank diversity tends to be larger, implying a larger variability in the use of particular phrases relative to words. To better grasp how N-gram usage varies in time, Tables S1–S30 in the Supplementary Information list the top N-grams in several years for all languages. We observe that the lowest ranked N-grams (most frequent) tend to be or contain function words (articles, prepositions, conjunctions), since their use is largely independent of the text topic. On the other hand, content words (nouns, verbs, adjectives, adverbs) are contextual, so their usage frequency varies widely across time and texts. Thus, we find it reasonable that top N-grams vary more in time for larger N. Since rank diversity grows relatively fast, it implies that most ranks have a diversity close to one. Thus, most N-grams have a very high variability in time.
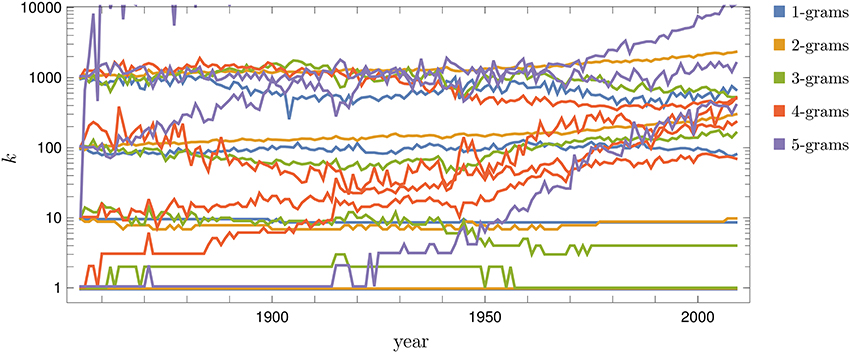
Figure 1. Rank evolution of N-grams in French. Rank trajectories across time for N-grams (N = 1, …, 5) that are initially in rank 1, 10, 100, and 1, 000 at the year 1855. The plot is semilogarithmic, so similar changes across ranks correspond to changes proportional to the rank itself. Other languages (not shown) behave in a similar way: changes are more frequent as N increases. We have added a small shift over the y-axis for some curves, to see more clearly how the most frequently used N-grams remain at k = 1 for long periods of time.
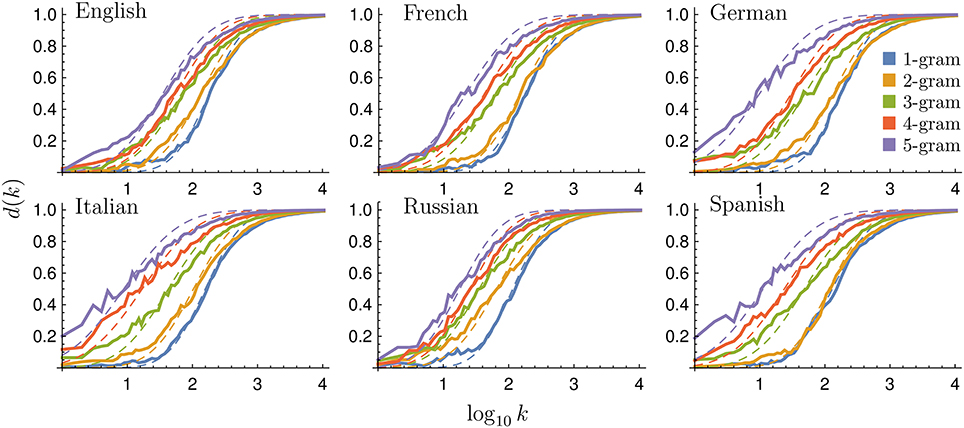
Figure 2. Rank diversity for different languages and N-grams. Binned rank diversity d(k) as a function of rank k for all languages and N values considered (continuous lines). We also include fits according to the sigmoid in Equation (1) (dashed lines), with μ, σ, and the associated e error summarized in Table 1. Windowing is done averaging d(k) every 0.05 in log10k.
As Figure 2 shows, rank diversity d(k) tends to grow with the scale N since, as N increases, it is less probable to find N-grams with only function words (especially in Russian, which has no articles). For N = 1, 2 in some languages, function words dominate the top ranks, decreasing their diversity, while the most popular content words (1-grams) change rank widely across centuries. Thus, we expect the most frequent 5-grams to change relatively more in time [for example, in Spanish, d(1) is for 1-grams and 2-grams, for 3-grams, for 4-grams, and finally for 5-grams]. Overall, we observe that all rank diversity curves can be well fitted by the sigmoid curve
where μ is the mean and σ the standard deviation of the sigmoid, both dependent on language and N value (Table 1). In previous works [23, 28] it has been shown that the diversity follows a sigmoid-like curve with log(k) as the independent variable. The diversity corresponds to the first hitting time and this one is proportional to the cumulative of the distribution. If multiplicative, independent, dynamical factors are present, then the distribution is a lognormal one, Gaussian with log(k) as independent variable. Then, the cumulative, the first hitting-time distribution, will be an erf(log(k)) function. This erf function has a sigmoid shape, as the one we have found in the data and therefore, it could be the origin of the sigmoid-like pattern.
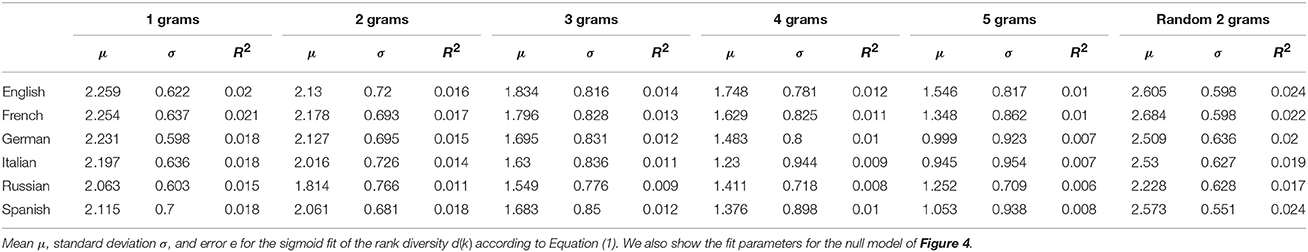
Table 1. Fit parameters for rank diversity for different languages, N-grams and null model.
In Cocho et al. [23], we used the sigmoid fits to approximate language “cores”: the essential number of words considered necessary to speak a language. Estimates of language cores range between 1,500 and 3,000 words [23]. After obtaining a sigmoid fit for a language, we defined the core to be of size μ+2σ, obtaining much closer estimates than previous statistical studies. We are not suggesting that the rank diversity determines language core size, but that it can be used as a correlate to identify the number of commonly used words.
In Figure 3 we see the fitted values of μ and σ for all datasets considered. In all cases μ decreases with N, while in most cases σ increases with N, roughly implying an inversely proportional relation between μ and σ.
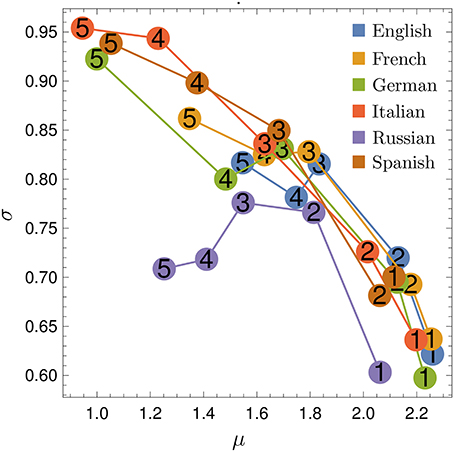
Figure 3. Fitted parameters for rank diversity. Parameters μ and σ for the sigmoid fit of the rank diversity d(k), for all languages (indicated by colors) and N-values (indicated by numbers). We observe an (approximate) inversely proportional relation between μ and σ.
2.2. Null Model: Random Shufflin of Monograms
In order to understand the dependence of language use — as measured by d(k) — on scale (N), we can ask whether the statistical properties of N-grams can be deduced exclusively from those of monograms, or if the use of higher-order N-grams reflects features of grammatical structure and cultural evolution that are not captured by word usage frequencies alone. To approach this question, we consider a null model of language in which grammatical structure does not influence the order of words. We base our model on the idea of shuffling 1-gram usage data to eliminate the grammatical structure of the language, while preserving the frequency of individual words (more details in Methods, section 4.2).
2.2.1. Rank Diversity in Null Model
As can be seen in Figure 4, the rank diversity of digrams constructed from shuffled monograms is generally lower than for the non-shuffled digrams, although it keeps the same functional shape of Equation (1) (see fit parameters in Table 1). In the absence of grammatical structure, the frequency of each 2-gram is determined by the frequencies of its two constituent 1-grams. Thus, combinations of high frequency 1-grams dominate the low ranks, including some that are not grammatically valid—e.g., “the the”, “the of”, “of of”—but are much more likely to occur than most others. Moreover, the rank diversity of such combinations is lower than we see in the non-shuffled data because the low ranked 1-grams that create these combinations are relatively stable over time. Thus, we can conclude that the statistics of higher order N-grams is determined by more than word statistics, i.e., language structure matters at different scales.
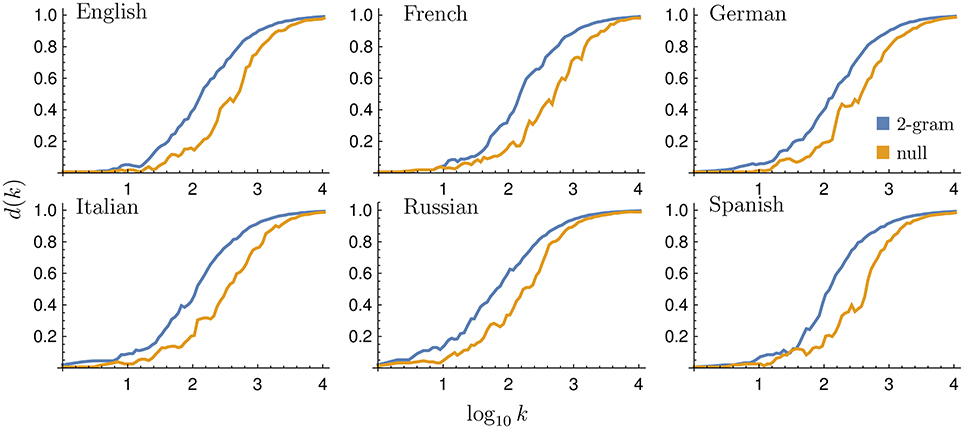
Figure 4. Rank diversity in the null model. Rank diversity d(k) of both empirical and randomly generated 2-grams. The rank diversity of the null model tends to be to the right of that of the data, i.e., lower. Windowing in this and similar figures is done in the same way as in Figure 2.
2.2.2. z-Scores in Null Model
The amount of structure each language exhibits can be quantified by the z-scores of the empirical 2-grams with respect to the shuffled data. Following its standard definition, the z-score of a 2-gram is a measure of the deviation between its observed frequency in empirical data and the frequency we expect to see in a shuffled dataset, normalized by the standard deviation seen if we were to shuffle the data and measure the frequency of the 2-gram many times (see section 4.2 for details).
The 2-grams with the highest z-scores are those for which usage of the 2-gram accounts for a large proportion of the usage of each of its two constituent words. That is, both words are more likely to appear together than they are in other contexts (for example, “led zeppelin” in the Spanish datasets), suggesting that the combination of words may form a linguistic token that is used in a similar way to an individual word. We observe that the majority of 2-grams have positive z-scores, which simply reflects the existence of non-random structure in language (Figure 5). What is more remarkable is that many 2-grams, including some at low ranks (“und der,” “and the,” “e di,”) have negative z-scores; a consequence of the high frequency and versatility of some individual words.
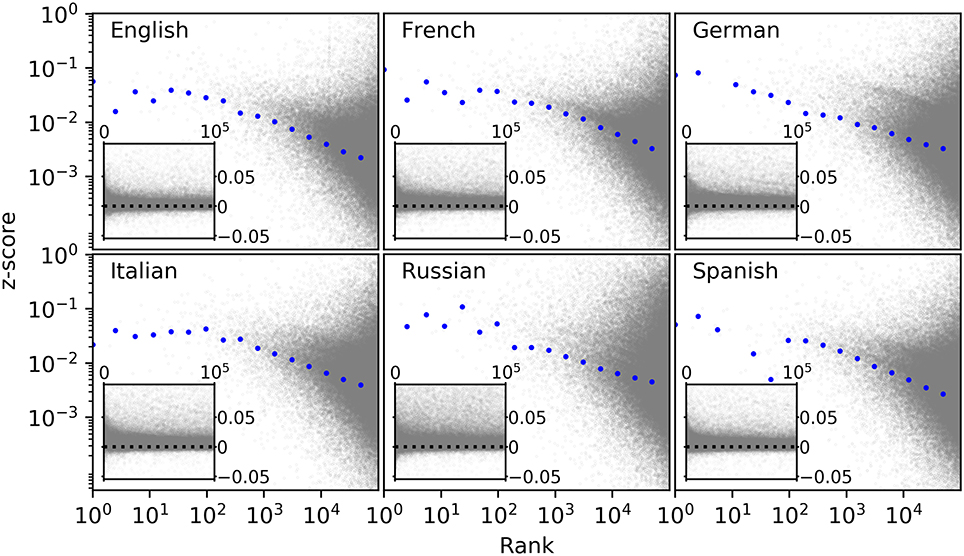
Figure 5. z-scores between empirical and null model digrams. z-scores, calculated from Equation (13), for the top 105 2-grams in 2008. Each point represents a 2-gram found in the empirical data. The blue dots show the median z-score of logarithmically binned values (first bin contains only the first rank; each consecutive bin is twice as large as the previous one). The inset shows the same values on a linear scale y axis, with a dashed line indicating z = 0.
After normalizing the results to account for varying total word frequencies between different language datasets, we see that all languages exhibit a similar tendency for the z-score to be smaller at higher ranks (measured by the median; this is not the case for the mean). This downward slope can be explained by the large number of 2-grams that are a combination of one highly versatile word, i.e., one that may be combined with a diverse range of other words, with relatively low frequency words (for example “the antelope”). In such cases, z-scores decrease with rank as z ~ k−1/2 (see section 4.2).
2.3. Next-Word Entropy
Motivated by the observation that some words appear alongside a diverse range of other words, whereas others appear more consistently with the same small set of words, we examine the distribution of next-word entropies. Specifically, we define the next-word entropy for a given word i as the (non-normalized) Shannon entropy of the set of words that appear as the second word in 2-grams for which i is the first. In short, the next-word entropy of a given word quantifies the difficulty of predicting the following word. As shown in Figure 6, words with higher next-word entropy are less abundant than those with lower next-word entropy, and the relationship is approximately exponential.
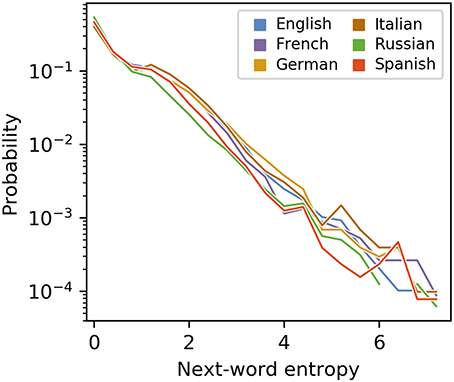
Figure 6. Next-word entropy for different languages and null model. The next-word entropy is calculated for each word using Equation (15). The plotted values are the normalized frequencies (i.e., probabilities) of words whose next-word entropy falls within each bin; the first bin contains values greater than or equal to 0 and less than 1/2, the second contains values greater than or equal to 1/2 and less than 1, and so on.
2.4. Change Probability of N-Gram Usage
To complement the analysis of rank diversity, we propose a related measure: the change probability p(k), i.e., the probability that a word at rank k will change rank in one time interval. We calculate it for a given language dataset by dividing the number of times elements change for given rank k by the number of temporal transitions, T − 1 (see section 4 for details). The change probability behaves similarly to rank diversity in some cases. For example, if there are only two N-grams that appear with rank 1, d(1) = 2/155. If one word was ranked first until 1900 and then a different word became first, there was only one rank change, thus p(1) = 1/154. However, if the words alternated ranks every year (which does not occur in the datasets studied), the rank diversity would be the same, but p(1) = 1.
Figure 7 shows the behavior of the change probability p(k) for all languages studied. We see that p(k) grows faster than d(k) for increasing rank k. The curves can also be well fitted with the sigmoid of Equation (1) (fit parameters in Table 2). Figure 8 shows the relationship between μ and σ of the sigmoid fits for the change probability p(k). As with the rank diversity, μ decreases with N for each language, except for German between 3-grams and 4-grams. However, the σ values seem to have a low correlation with N. We also analyze the difference between rank diversity and change probability, d(k) − p(k) (Figure S1). As the change probability grows faster with rank k, the difference becomes negative and then grows together with the rank diversity. For large k, both rank diversity and change probability tend to one, so their difference is zero.
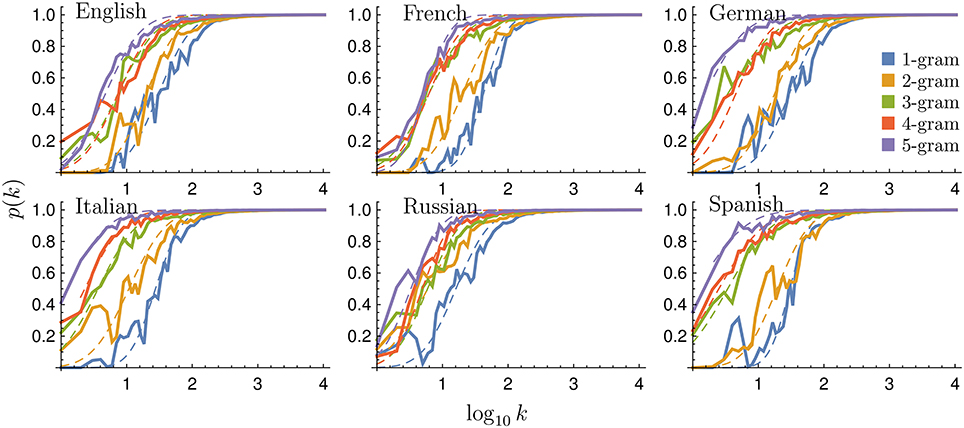
Figure 7. Change probability for different languages and N-grams. Binned change probability p(k) as a function of rank k for all languages and N values considered (continuous lines). We also include fits according to the sigmoid in Equation (1) (dashed lines), as in Figure 2.
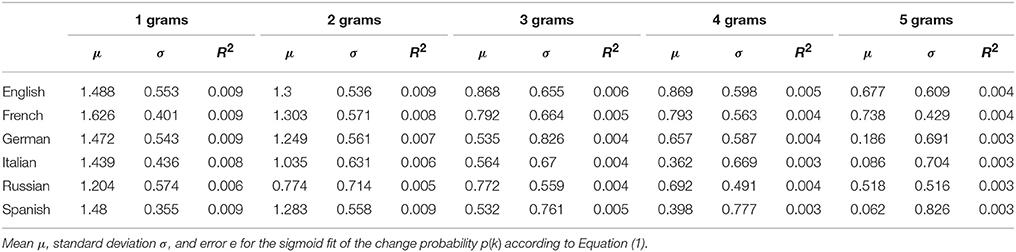
Table 2. Fit parameters for change probability for different languages.
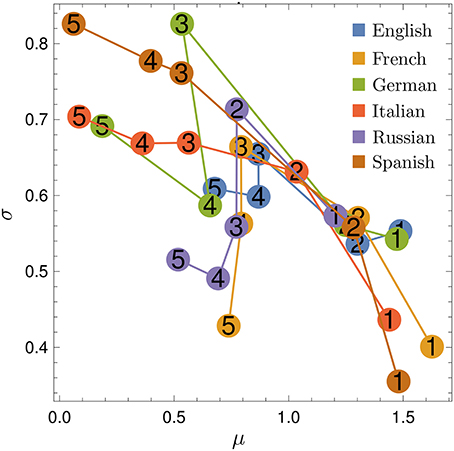
Figure 8. Fitted parameters for change probability. Parameters μ and σ for the sigmoid fit of the change probability p(k), for all languages (indicated by colors) and N-values (indicated by numbers).
2.5. Rank Entropy of N-Gram Usage
We can define another related measure: the rank entropy E(k). Based on Shannon's information, it is simply the normalized information for the elements appearing at rank k during all time intervals (see section 4). For example, if at rank k = 1 only two N-grams appear, d(1) = 2/155. Information is maximal when the probabilities of elements are homogeneous, i.e., when each N-gram appears half of the time, as it is uncertain which of the elements will occur in the future. However, if one element appears only once, information will be minimal, as there will be a high probability that the other element will appear in the future. As with the rank diversity and change probability, the rank entropy E(k) also increases its value with rank k, even faster in fact, as shown in Figure 9. Similarly, E(k) tends to be higher as N grows, and may be fitted by the sigmoid of Equation (1) at least for high enough k (see fit parameters in Table 3) Notice that since rank entropy in some cases has already high values at k = 1, the sigmoids can have negative μ values.
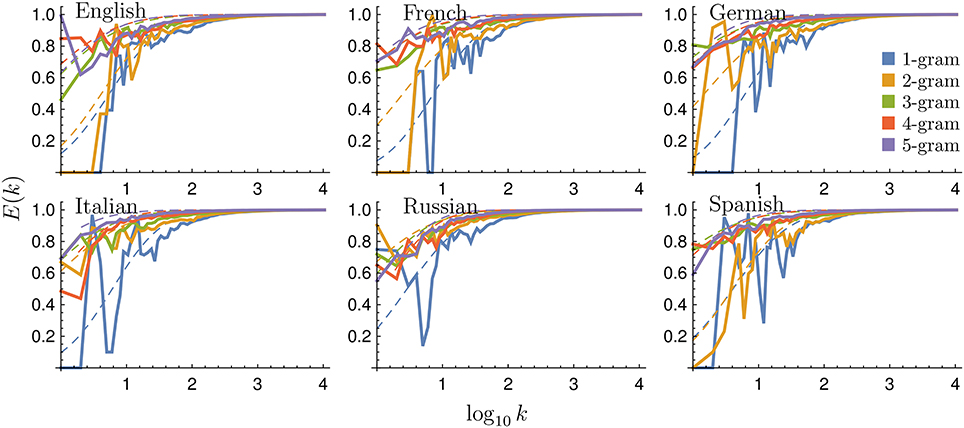
Figure 9. Rank entropy for different languages and N-grams. Binned rank entropy E(k) as a function of rank k for all languages and N values considered (continuous lines). We also include fits according to the sigmoid in Equation (1) (dashed lines), as in Figure 2.
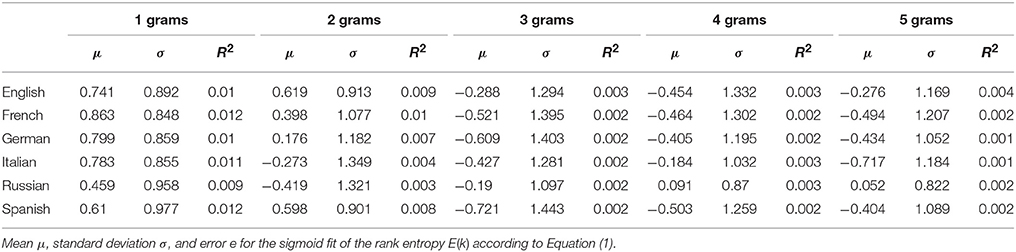
Table 3. Fit parameters for rank entropy for different languages.
The μ and σ values are compared in Figure 10. The behavior of these parameters is more diverse than for rank diversity and change probability. Still, the curves tend to have a “horseshoe” shape, where μ decreases and σ increases up to N ≈ 3, and then μ slightly increases while σ decreases.
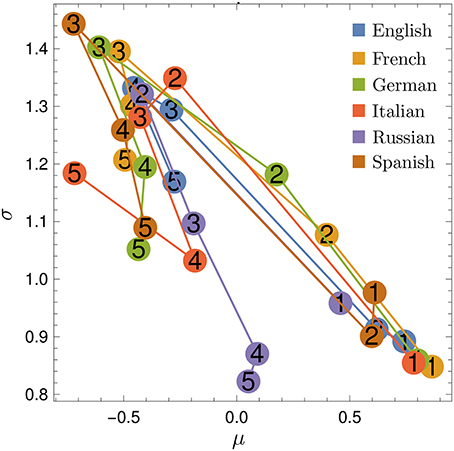
Figure 10. Fitted parameters for rank entropy. Parameters μ and σ for the sigmoid fit of rank entropy E(k), for all languages (indicated by colors) and N-values (indicated by numbers).
It should be noted that the original datasets for tetragrams and pentagrams are much smaller than for digrams and trigrams. Whether this is related with the change of behavior in σ between N = 3 and N = 4 for the different measures remains to be explored, probably with a different dataset.
2.6. Rank Complexity of N-Gram Usage
Finally, we define the rank complexity C(k) as
This measure of complexity represents a balance between stability (low entropy) and change (high entropy) [29–31]. So complexity is minimal for extreme values of the normalized entropy [E(k) = 0 or E(k) = 1] and maximal for intermediate values [E(k) = 0.5]. Figure 11 shows the behavior of the rank complexity C(k) for all languages studied. In general, since E(k) ≈ 0.5 for low ranks, the highest C(k) values appear for low ranks and decrease as E(k) increases. C(k) also decreases with N. Moreover, C(k) curves reach values close to zero when E(k) is close to one: around k = 102 for N = 5 and k = 103 for N = 1, for all languages.
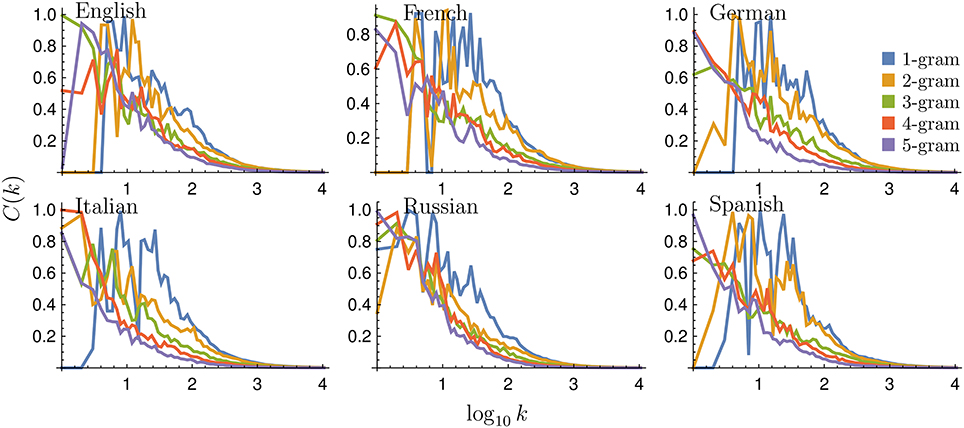
Figure 11. Rank complexity for different languages and N-grams. Binned rank complexity C(k) as a function of rank k for all languages and N values considered. Rank complexity tends to be greater for lower N, as rank entropy increases with N.
3. Discussion
Our statistical analysis suggests that human language is an example of a cultural construct where macroscopic statistics (usage frequencies of N-grams for N > 1) cannot be deduced from microscopic statistics (1-grams). Since not all word combinations are valid in the grammatical sense, in order to study higher-order N-grams, the statistics of 1-grams are not enough, as shown by the null model results. In other words, N-gram statistics cannot be reduced to word statistics. This implies that multiple scales should be studied at the same time to understand language structure and use in a more integral fashion. We conclude not only that semantics and grammar cannot be reduced to syntax, but that even within syntax, higher scales (N-grams with N > 1) have an emergent, relevant structure which cannot be exclusively deduced from the lowest scale (N = 1).
While the alphabet, the grammar, and the subject matter of a text can vary greatly among languages, unifying statistical patterns do exist, and they allow us to study language as a social and cultural phenomenon without limiting our conclusions to one specific language. We have shown that despite many clear differences between the six languages we have studied, each language balances a versatile but stable core of words with less frequent but adaptable (and more content-specific) words in a very similar way. This leads to linguistic structures that deviate far from what would be expected in a random “language” of shuffled 1-grams. In particular, it causes the most commonly used word combinations to deviate further from random that those at the other end of the usage scale.
If we are to assume that all languages have converged on the same pattern because it is in some way “optimal,” then it is perhaps this statistical property that allows word combinations to carry more information that the sum of their parts; to allow words to combine in the most efficient way possible in order to convey a concept that cannot be conveyed through a sequence of disconnected words. The question of whether or not the results we report here are consistent with theories of language evolution [32–34] is certainly a topic for discussion and future research.
It should be noted that our statistical analyses conform to a coarse grained description of language change, which certainly can be performed at a much finer scale in particular contexts [35–39]. Using other datasets, the measures used in this paper could be applied to study how words change at different timescales, as the smallest Δt possible is 1 year in the Google Books N-grams datasets. For example, with Twitter, one could vary Δt from minutes to years. Would faster timescales lead to higher rank diversities? This is something to be explored.
Apart from studying rank diversity, in this work we have introduced measures of change probability, rank entropy, and rank complexity. Analytically, the change probability is simpler to treat than rank diversity, as the latter varies with the number of time intervals considered (T), while the former is more stable (for a large enough number of observations). Still, rank diversity produces smoother curves and gives more information about rank dynamics, since the change probability grows faster with k. Rank entropy grows even faster, but all three measures [d(k), p(k), and E(k)] seem related, as they tend to grow with k and N in a similar fashion. Moreover, all three measures can be relatively well fitted by sigmoid curves (the worst fit has e = 0.02, as seen in Tables 1–3). Our results suggest that a sigmoid functional shape fits rank diversity the best for low ranks, as the change probability and rank entropy have greater variability in that region. To compare the relationship between rank diversity and the novel measures, Figures S2–S4 show scatter plots for different languages and N values. As it can be seen from the overlaps, the relationship between d(k) and the other measures is very similar for all languages and N values.
In Cocho et al. [23], we used the parameters of the sigmoid fit to rank diversity as an approximation of language core size, i.e., the number of 1-grams minimally required to speak a language. Assuming that these basic words are frequently used (low k) and thus have d(k) < 1, we consider the core size to be bounded by log10k = μ + 2σ. As Table 4 shows, this value decreases with N, i.e., N-gram structures with larger N tend to have smaller cores. However, if the number of different words found on cores is counted, they increase from monograms to digrams, except for Spanish and Italian. From N = 2, the number of words in cores decreases constantly for all languages. This suggests that core words can be combined to form more complex expressions without the requirement of learning new words. English and French tend to have more words in their cores, while Russian has the least. It is interesting to note that the null model produces cores with about twice as many words as real 2-grams. Also, only in language cores rank complexity values are not close to zero. In other words, only ranks within the core have a high rank complexity. Whether rank diversity or rank complexity are better proxies of language core size is still an open question.
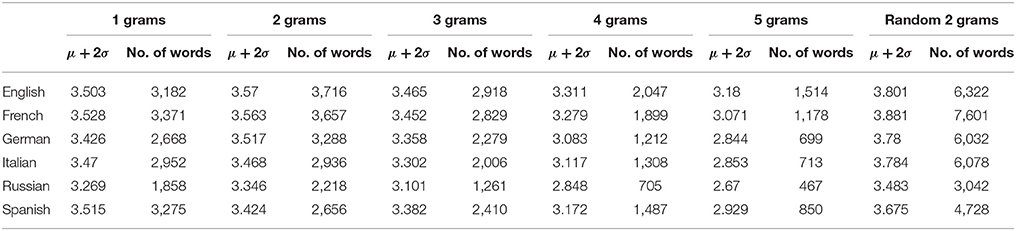
Table 4. Language core parameters. Upper bound rank log10k = μ+2σ for the estimated core size of all languages studied, according to the sigmoid fit of Equation (1), as well as the number of words included in the N-grams within the core in the year 2009.
Our results may have implications for next-word prediction algorithms used in modern typing interfaces like smartphones. Lower ranked N-grams tend to be more predictable (higher z-scores and lower next word entropy on average). Thus, next-word prediction should adjust the N value (scale) depending on the expected rank of the recent, already-typed words. If these are not in top ranked N-grams, then N should be decreased. For example, on the iOS 11 platform, after typing “United States of”, the system suggests “the”, “all”, and “a”, as the next-word prediction by analyzing 2-grams. However, it is clear that the most probable next-word is “America”, as this is a low-ranked 4-gram.
Beyond the previous considerations, perhaps the most relevant aspect of our results is that the rank dynamics of language use is generic not only for all six languages, but for all five scales studied. Whether the generic properties of rank diversity and related measures are universal still remains to be explored. Yet, we expect this and other research questions to be answered in the coming years as more data on language use and human culture becomes available.
4. Methods
4.1. Data Description
Data was obtained from the Google Books N-gram dataset1, filtered and processed to obtain ranked N-grams for each year for each language. Data considers only the first 10, 913 ranks, as this was the maximum rank available for all time intervals and languages studied. From these, rank diversity, change probability, rank entropy, and rank complexity were calculated as follows. Rank diversity is given by
where |X(k)| is the cardinality (i.e., number of elements) that appear at rank k during all T = 155 time intervals (between 1855 and 2009 with 1-year differences, or Δt = 1). The change probability is
where δ(X(k, t), X(k, t+1)) is the Kronecker delta; equal to zero if there is a change of N-gram in rank k in Δt [i.e., the element X(k, t) is different from element X(k, t+1)], and equal to one if there is no change. The rank entropy is given by
where
so as to normalize E(k) in the interval [0, 1]. Note that |X(k)| is the alphabet length, i.e., the number of elements that have occurred at rank k. Finally, the rank complexity is calculated using Equations (2) and (5) [30].
4.2. Modeling Shuffled Data
We first describe a shuffling process that eliminates any structure found within the 2-gram data, while preserving the frequency of individual words. Consider a sequence consisting of the most frequent word a number of times equal to its frequency, followed by the second most frequent word a number of times equal to its frequency, and so on all the way up to the 10, 913th most frequent word (i.e., until all the words in the monogram data have been exhausted). Now suppose we shuffle this sequence and obtain the frequencies of 2-grams in the new sequence. Thus, we have neglected any grammatical rules about which words are allowed to follow which others (we can have the same word twice in the same 2-gram, for example), but the frequency of words remains the same.
We now derive an expression for the probability that a 2-gram will have a given frequency after shuffling has been performed. Let fi denote the number of times the word i appears in the text, and fij the number of times the 2-gram ij appears. Additionally, . We want to know the probability P(fij) that ij appears exactly fij times in the table. We can think of P(fij) as the probability that exactly fij occurrences of i are followed by j. Supposing fi < fj, fij is determined by fi independent Bernoulli trials with the probability of success equal to the probability that the next word will be j, i.e., fj/F. In this case we have
This distribution meets the condition that allows it to be approximated by a Poisson distribution, namely that fifj/F is constant, so we have
where
is the mean, and also the variance, of the distribution of values of fij.
For each 2-gram we calculate the z-score. This is a normalized frequency of its occurrence, i.e., we normalize the actual frequency fij by subtracting the mean of the null distribution and dividing by the standard deviation,
In other words, the z-score tells us how many standard deviations the actual frequency is from the mean of the distribution derived from the shuffling process. The result is that the 2-grams with the highest z-scores are those which occur relatively frequently but their component words occur relatively infrequently.
4.2.1. Normalization
To compare z-scores of different languages, we normalize to eliminate the effects of incomplete data. Specifically, we normalize z-scores by dividing by the upper bound (which happens to be equal in order of magnitude to the lower bound). The highest possible z-score occurs in cases where fi = fj = fij = f. Therefore and
so an upper bound exists at . Similarly, The lowest possible z-score would hypothetically occur when fi = fj ≈ F/2 and fij = f, giving
We thus define the normalized z-score as
4.2.2. The Relationship Between Rank and z-Score
To understand how the z-score changes as a function of rank, we look at another special case: suppose that i is a word that is found to be the first word in a relatively large number of 2-grams, and that all occurrences of the word j are preceded by i. In such cases we have fi, j = fj, so Equation (13) reduces to
Now consider only the subset of 2-grams that start with i and end with words that are only ever found to be preceded by i. Since fi is constant within this subset, we have , where A is a constant. If we now assume that Zipf's law holds for the set of second words in the subset, i.e., that where rj is the rank of j and B another constant, then we have , with C a third constant.
4.2.3. Data
Unlike in other parts of this study, the shuffling analysis is applied to the 105 lowest ranked 2-grams.
4.3. Next-Word Entropy
The relationship between rank and z-score of 2-grams appears to be, at least partially, a consequence of the existence of high frequency core words that can be followed by many possible next words. This diversity of next words can be quantified by what we call the next-word entropy. Given a word i, we define the next-word entropy, , of i to be the (non-normalized) Shannon entropy of the distribution of 2-gram frequencies of 2-grams that have i as the first word,
4.4. Fitting Process
The curve fitting for rank diversity, change probability, and rank entropy has been made with the scipy-numpy package using the non-linear least squares method (Levenberg-Marquardt algorithm). For rank entropy, we average data over each ten ranks, , as well as over rank entropy values, . With this averaged data, we adjust a cumulative normal (erf function) over the data of and . For rank diversity and change probability, we average data over points equally spaced in log10(ki). Like for rank entropy, a sigmoid (Eq. 1) is fitted for log10(k) and d(k), as well as for log10(k) and p(k). To calculate the mean quadratic error, we use
where is the value of the sigmoid adjusted to rank ki and Xi is the real value of d(ki). For p(k) and E(k) the error is calculated in the same way.
Author Contributions
All authors contributed to the conception of the paper. JM, EC, and SS processed and analyzed the data. EC and GI devised the null model. CP and EC made the figures. EC, GI, JF, and CG wrote sections of the paper. All authors contributed to manuscript revision, read and approved the final version of the article.
Funding
We acknowledge support from UNAM-PAPIIT Grant No. IG100518, CONACyT Grant No. 285754 and 221341, and the Fundación Marcos Moshinsky.
Conflict of Interest Statement
The authors declare that the research was conducted in the absence of any commercial or financial relationships that could be construed as a potential conflict of interest.
Acknowledgments
We appreciate useful comments from the reviewers which improved the presentation of the results.
Supplementary Material
The Supplementary Material for this article can be found online at: https://www.frontiersin.org/articles/10.3389/fphy.2018.00045/full#supplementary-material
Footnotes
References
1. Lieberman E, Michel JB, Jackson J, Tang T, Nowak MA. Quantifying the evolutionary dynamics of language. Nature (2007) 449:713–6. doi: 10.1038/nature06137
2. Michel JB, Shen YK, Aiden AP, Veres A, Gray MK, Team TGB, et al. Quantitative analysis Of culture using millions of digitized books. Science (2011) 331:176–82. doi: 10.1126/science.1199644
3. Dodds PS, Harris KD, Kloumann IM, Bliss CA, Danforth CM. Temporal patterns of happiness and information in a global social network: hedonometrics and Twitter. PLoS ONE (2011) 6:e26752. doi: 10.1371/journal.pone.0026752
4. Serrà J, Corral Á, Boguñá M, Haro M, Arcos JL. Measuring the evolution of contemporary western popular music. Sci Rep. (2012) 2:521. doi: 10.1038/srep00521
5. Blumm N, Ghoshal G, Forró Z, Schich M, Bianconi G, Bouchaud JP, et al. Dynamics of ranking processes in complex systems. Phys Rev Lett. (2012) 109:128701. doi: 10.1103/PhysRevLett.109.128701
6. Solé RV, Valverde S, Casals MR, Kauffman SA, Farmer D, Eldredge N. The evolutionary ecology of technological innovations. Complexity (2013) 18:15–27. doi: 10.1002/cplx.21436
7. Tadić B, Gligorijević V, Mitrović M, Šuvakov M. Co-evolutionary mechanisms of emotional bursts in online social dynamics and networks. Entropy (2013) 15:5084–120. doi: 10.3390/e15125084
8. Gerlach M, Altmann EG. Stochastic Model for the Vocabulary Growth in Natural Languages. Phys Rev X (2013) 3:021006. doi: 10.1103/PhysRevX.3.021006.
9. Perc M. Self-organization of progress across the century of physics. Sci Rep. (2013) 3:1720. doi: 10.1038/srep01720
10. Febres G, Jaffe K, Gershenson C. Complexity measurement of natural and artificial languages. Complexity (2015) 20:25–48. doi: 10.1002/cplx.21529
11. Wagner C, Singer P, Strohmaier M. The nature and evolution of online food preferences. EPJ Data Sci. (2014) 3:38. doi: 10.1140/epjds/s13688-014-0036-7
12. Piña-Garcia CA, Gershenson C, Siqueiros-García JM. Towards a standard sampling methodology on online social networks: collecting global trends on Twitter. Appl Netw Sci. (2016) 1:3. doi: 10.1007/s41109-016-0004-1
13. Piña-García CA, Siqueiros-García JM, Robles-Belmont E, Carreón G, Gershenson C, López JAD. From neuroscience to computer science: a topical approach on Twitter. J Comput Soc Sci. (2018) 1:187–208. doi: 10.1007/s42001-017-0002-9
14. Wilkens M. Digital humanities and its application in the study of literature and culture. Comp Lit. (2015) 67:11–20. doi: 10.1215/00104124-2861911
15. Wijaya DT, Yeniterzi R. Understanding semantic change of words over centuries. In: Proceedings of the 2011 International Workshop on Detecting and Exploiting Cultural Diversity on the Social Web (Glasgow, UK: ACM) (2011), 35–40.
16. Petersen AM, Tenenbaum JN, Havlin S, Stanley HE, Perc M. Languages cool as they expand: allometric scaling and the decreasing need for new words. Sci Rep. (2012) 2:943. doi: 10.1038/srep00943
17. Petersen AM, Tenenbaum J, Havlin S, Stanley HE. Statistical laws governing fluctuations in word use from word birth to word death. Sci Rep. (2012) 2:313. doi: 10.1038/srep00313
18. Perc M. Evolution of the most common English words and phrases over the centuries. J R Soc Interface (2012) 9:3323–8. doi: 10.1098/rsif.2012.0491
19. Acerbi A, Lampos V, Garnett P, Bentley RA. The expression of emotions in 20th century books. PLoS ONE (2013) 8:e59030. doi: 10.1371%2Fjournal.pone.0059030
20. Ghanbarnejad F, Gerlach M, Miotto JM, Altmann EG. Extracting information from S-curves of language change. J R Soc Interface (2014) 11:20141044. doi: 10.1098/rsif.2014.1044
21. Dodds PS, Clark EM, Desu S, Frank MR, Reagan AJ, Williams JR, et al. Human language reveals a universal positivity bias. Proc Natl Acad Sci USA (2015) 112:2389–94. doi: 10.1073/pnas.1411678112
22. Gerlach M, Font-Clos F, Altmann EG. Similarity of Symbol Frequency Distributions with Heavy Tails. Phys Rev X (2016) 6:021009. doi: 10.1103/PhysRevX.6.021009
23. Cocho G, Flores J, Gershenson C, Pineda C, Sánchez S. Rank diversity of languages: generic behavior in computational linguistics. PLoS ONE (2015) 10:e0121898. doi: 10.13712/journal.pone.0121898
24. Zipf GK. Selective Studies and the Principle of Relative Frequency in Language. Cambridge, MA: Harvard University Press (1932).
25. Newman ME. Power laws, Pareto distributions and Zipf's law. Contemp Phys. (2005) 46:323–51. doi: 10.1016/j.cities.2012.03.001
26. Baek SK, Bernhardsson S, Minnhagen P. Zipf's law unzipped. N J Phys. (2011) 13:043004. doi: 10.1088/1367-2630/13/4/043004
27. Corominas-Murtra B, Fortuny J, Solé RV. Emergence of Zipf's law in the evolution of communication. Phys Rev E (2011) 83:036115. doi: 10.1103/PhysRevE.83.036115
28. Morales JA, Sánchez S, Flores J, Pineda C, Gershenson C, Cocho G, et al. Generic temporal features of performance rankings in sports and games. EPJ Data Sci. (2016) 5:33. doi: 10.1140/epjds/s13688-016-0096-y
29. Gershenson C, Fernández N. Complexity and information: measuring emergence, self-organization, and homeostasis at multiple scales. Complexity (2012) 18:29–44. doi: 10.1002/cplx.21424
30. Fernández N, Maldonado C, Gershenson C. Information measures of complexity, emergence, self-organization, homeostasis, and autopoiesis. In: Prokopenko M, editor. Guided Self-organization: Inception. Vol. 9 of Emergence, Complexity and Computation. Berlin; Heidelberg: Springer (2014). p. 19–51.
31. Santamaría-Bonfil G, Fernández N, Gershenson C. Measuring the complexity of continuous distributions. Entropy (2016) 18:72. doi: 10.3390/e18030072
32. Nowak MA, Krakauer DC. The evolution of language. Proc Natl Acad Sci USA (1999) 96:8028–33. doi: 10.1073/pnas.96.14.8028
33. Cancho RFi, Solé RV. Least effort and the origins of scaling in human language. Proc Natl Acad Sci USA (2003) 100:788–91. doi: 10.1073/pnas.0335980100
34. Baronchelli A, Felici M, Loreto V, Caglioti E, Steels L. Sharp transition towards shared vocabularies in multi-agent systems. J Stat Mech Theor Exp. (2006) 2006:P06014. doi: 10.1088/1742-5468/2006/06/P06014
35. Yarkoni T. Personality in 100,000 Words: a large-scale analysis of personality and word use among bloggers. J Res Pers. (2010) 44:363–73. doi: 10.1016/j.jrp.2010.04.001
36. Šuvakov M, Mitrović M, Gligorijević V, Tadić B. How the online social networks are used: dialogues-based structure of MySpace. J R Soc Interface (2013) 10:20120819. doi: 10.1098/rsif.2012.0819
37. Gonzales AL. Text-based communication influences self-esteem more than face-to-face or cellphone communication. Comp Hum Behav. (2014) 39:197–203. doi: 10.1016/j.chb.2014.07.026
38. Amancio DR. A complex network approach to stylometry. PLoS ONE (2015) 10:e0136076. doi: 10.1371/journal.pone.0136076
Keywords: culturomics, N-grams, language evolution, rank diversity, complexity
Citation: Morales JA, Colman E, Sánchez S, Sánchez-Puig F, Pineda C, Iñiguez G, Cocho G, Flores J and Gershenson C (2018) Rank Dynamics of Word Usage at Multiple Scales. Front. Phys. 6:45. doi: 10.3389/fphy.2018.00045
Received: 14 February 2018; Accepted: 30 April 2018;
Published: 22 May 2018.
Edited by:
Claudia Wagner, Leibniz Institut für Sozialwissenschaften (GESIS), GermanyReviewed by:
Bosiljka Tadic, Jožef Stefan Institute (IJS), SloveniaHaroldo Valentin Ribeiro, Universidade Estadual de Maringá, Brazil
Copyright © 2018 Morales, Colman, Sánchez, Sánchez-Puig, Pineda, Iñiguez, Cocho, Flores and Gershenson. This is an open-access article distributed under the terms of the Creative Commons Attribution License (CC BY). The use, distribution or reproduction in other forums is permitted, provided the original author(s) and the copyright owner are credited and that the original publication in this journal is cited, in accordance with accepted academic practice. No use, distribution or reproduction is permitted which does not comply with these terms.
*Correspondence: Carlos Gershenson, Y2dnQHVuYW0ubXg=