 Ramy Abdlaty1†
 Lilian Doerwald-Munoz2
 Ali Madooei3
 Samir Sahli4
 Shu-Chi A. Yeh1,5Josiane Zerubia6Raimond K. W. Wong2
 Joseph E. Hayward2Thomas J. Farrell2
 Qiyin Fang1,4*
- 1School of Biomedical Engineering, McMaster University, Hamilton, ON, Canada
- 2Juravinski Cancer Centre, Hamilton Health Sciences, Hamilton, ON, Canada
- 3School of Computing Science, Simon Fraser University, Vancouver, BC, Canada
- 4Department of Engineering Physics, McMaster University, Hamilton, ON, Canada
- 5Wellman Center for Photomedicine, Harvard University, Cambridge, MA, United States
- 6Université Côte d'Azur, INRIA, Sophia Antipolis, France
Erythema is an inflammatory condition of the skin that is commonly used as a feature to monitor the progression of cutaneous diseases or treatment induced side effects. In radiation therapy, skin erythema is routinely assessed visually by an expert using standardized grading criteria. However, visual assessment (VA) is subjective and commonly used grading tools are too coarse to score the onset of erythema. Therefore, an objective method capable of quantitatively grading early erythema changes may help identify patients at higher risk for developing severe radiation induced skin toxicities. The purpose of this study is to investigate the feasibility of using hyperspectral imaging (HSI) for quantitative assessment of early erythema and to characterize its performance against VA documented on conventional digital photographic red-green-blue (RGB) images. Erythema was induced artificially on 3 volunteers in a controlled pilot study; and was subsequently measured using HSI and color imaging. HSI and color imaging data was analyzed using linear discriminant analysis (LDA) to perform classification. The classification results, including accuracy, and precision, demonstrated that HSI is superior to color imaging in skin erythema assessment.
Introduction
Skin Erythema, also called cutaneous inflammation, is a symptom associated with diverse cutaneous diseases [1] such as psoriasis [2, 3] and acne lesions [4], as well as with skin injuries such as pressure sores and burns [5, 6]. In more extreme cases of thrombocytopenia, cutaneous inflammation is claimed to be a trigger for a life-threatening hemorrhaging condition [7]. Although considered an adverse response, erythema is commonly used as a feature to monitor the manifestation of skin diseases and the severity of treatment induced side effects. In radiation therapy, erythema reactions resulting from skin exposure to ionizing radiation also known as radiation dermatitis is a common limiting factor. Unchecked, severe radiation dermatitis can lead to intense pain, skin ulcers and tissue necrosis resulting in treatment interruptions and reduced quality of life [8–11]. Early assessment of radiation induced erythema can facilitate more timely interventions; it may help reduce patient discomfort, increase compliance with treatment and improve treatment outcomes[10].
Skin erythema is routinely assessed visually by a clinical specialist using standardized grading criteria [12]. Unfortunately, visual assessment (VA) has its own disadvantages that renders it less than optimal. Some of these drawbacks are its dependency on skills and knowledge of the observer and lack of precise quantification, i.e., common grading tools are categorical and too coarse to score early changes in erythema development [13]. Additionally, VA is prone to inter-observer and intra-observer variations and potential observer visual acuity deficiencies [12, 13].
Ideally, techniques to evaluate erythema should be quantitative in nature, contact-free and minimally invasive [6]. Various imaging technologies have been investigated for this purpose, including colorimetry [12, 13], diffuse reflectance spectroscopy (DRS) [11], laser Doppler flowmeter [8], digital photography [3, 4], confocal microscopy [1], optical coherence tomography [1], ultrasound [10], and magnetic resonance imaging [14]. In spite of the various techniques under investigation, erythema assessment by VA with the naked eye is still considered the gold standard [15].
Two optical modalities: DRS [10, 11] and photographic color imaging [3, 4, 16] have been studied for erythema quantification. However, DRS measurements requires direct contact with patients' skin and, can only assess a small region of skin at a time. Photographic imaging techniques, on the other hand, are contact free and able to capture larger field of view; but it is limited in the visual spectrum for interpretation of skin color change. The limitation of conventional digital photography is due to its dependence on merely three colors, red, green, and blue (RGB) to generate images. Thus, digital photography has a limited spectral range for differentiating between erythema grades. Hyperspectral imaging (HSI) has the potential to overcome the limitations of both DRS and digital photography techniques [17]. Similar to RGB imaging, HSI does not require skin contact and is capable of examining sizable tissue regions. Spectrally, HSI has a much broader range, it is not limited to the trichromatic bands of conventional digital photographic imaging.
The purpose of this study is to investigate the feasibility of HSI for precise classification of skin erythema. The key objectives of this project include: (1) Determine HSI sensitivity for detecting subtle erythema changes in the skin, (2) delineating the essential spectral zone for detecting erythema variation, (3) classifying skin erythema, and (4) use the classification results to juxtapose digital and spectral imaging for erythema assessment.
Methodology
Instrumentation
A custom-built acousto-optic tunable filter (AOTF) based HSI is used to monitor the artificially induced erythema on the volunteers' forearms. The HSI has been fully characterized and described in detail elsewhere [17]. Briefly, the illumination is provided by two halogen lamps (total 300 watts). A zoom lens (EF-S 18-55 mm f/3.5-5.6, Canon) collects the back reflected light and directs it to the input of the AOTF. The output spectral images are captured by a near-infrared (NIR) enhanced monochrome camera and then transferred to a computer workstation. A schematic of the AOTF-HSI system mounted on a moving cart is shown in Figure 1.
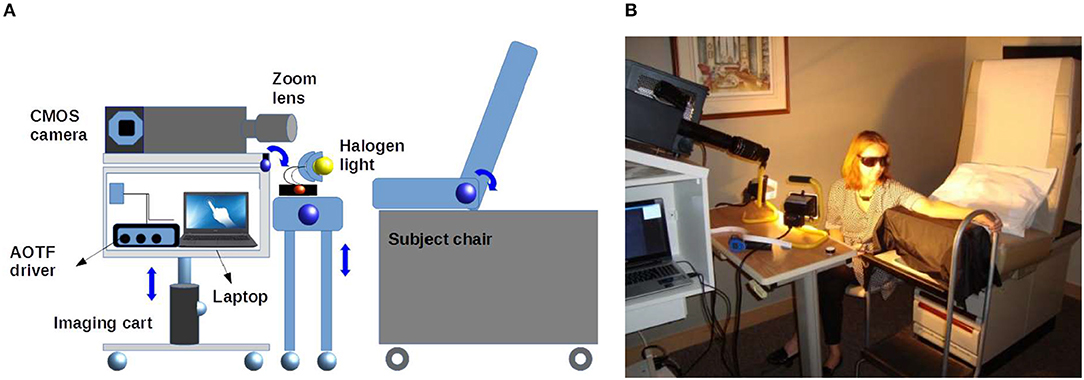
Figure 1. (A) Diagram representing the system setup used in the acquisition of HSI data sets. Two halogen lamps are used to illuminate the ROI. Two custom-built height adjustable instrument carts carry the HSI and the light sources. (B) Photograph showing the setup used to image a volunteer's forearm.
In the experiments reported here, the AOTF-HSI was set up to acquire images between 450 and 800 nm with corresponding bandwidth of 1.5–4 nm. The HSI system uses an NIR enhanced camera with 2048 × 2048 pixels. Conventional digital color images are captured by a 16-megapixel camera (HDMI-768, Hyundai, Korea). In addition, a white standard calibration surface with 99% reflection (SRS-99, Labsphere, NH) was used for image normalization.
Erythema Model and Study Design
In this study, 3 healthy adult volunteers were recruited, two males and one female. The volunteers' ages ranged from 35 to 50 years, were of Caucasian or Asian descent and, had no cutaneous diseases or any prior cutaneous injuries in the selected region of interest (ROI). For the purpose of simulating radiation dermatitis, transient erythema was induced in the forearm of the volunteer subjects by repeatedly striking a plastic ruler against the dermis until the skin was visibly reddened (~3 min). The artificially induced erythema disappeared after ~40 min and no lasting detrimental effects were seen in the volunteers' arm after that time. After inducing erythema within the ROI, the skin was graded by VA and sequential RGB and HSI were obtained. The clinician annotated the RGB images with the corresponding erythema scores obtained by VA. After processing the HSI were compared to the annotated RGB images. See Figure 2 for a flow chart illustrating the study's design.
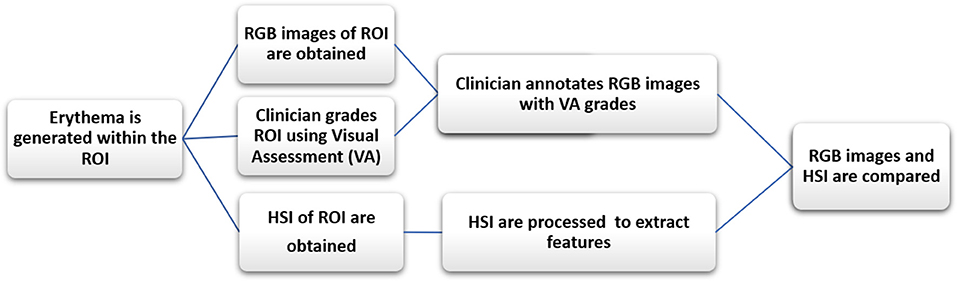
Figure 2. The flow chart illustrates the study's design. After initiating erythema within the ROI, the skin is graded by VA and RGB and HSI were obtained. The clinician then annotates the RGB images with the erythema scores. After processing the HSI, the annotated RGB images are compared to the HSI ones. The RGB images are used as a proxy to compare HSI to VA.
The study protocol and consent were reviewed and approved by the Hamilton Integrated Research Ethics Board (HiREB) responsible for research studies within McMaster University and affiliated regional healthcare institutions (i.e., Hamilton Health Science).
Erythema was graded, by a clinical specialist, on a 4-point ordinal scoring scale from 1 to 4 (1-very faint, 2-faint, 3-bright, 4-very bright). See scoring chart in Table 1 [18]. The VA scale used for this study was developed specifically to grade subtle erythematic changes in the subject's skin within the ROI. More widely used clinical assessment tools for skin toxicities including Common Terminology Criteria for Adverse Events (CTCAE), and Radiation Therapy Oncology Group (RTOG) were too coarse and did not suit the needs of this study [13, 19].
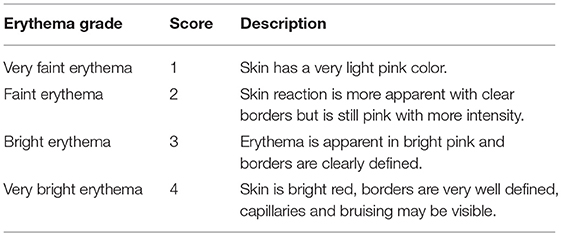
Table 1. Visual assessment ordinal scale used by an expert radiotherapist to grade skin erythema.
Immediately after erythema was induced, the clinical specialist visually assessed the skin within the ROI at 3-min intervals. At each interval, erythema grades were assigned by the clinical specialist using the predetermined ordinal scale for erythema scoring (Table 1). These grades were used as the Ground Truth for image analysis and classification.
RGB Image Acquisition and Generation of Erythema Region of Interests
Sequential digital photographic red-green-blue (RGB) images and HSI data sets were obtained of the volunteers' erythematous skin over time; starting before the erythema was induced and ending until the erythema disappeared. An experienced clinical radiation therapy specialist reviewed the RGB images and marked areas of uniform erythema with green or blue markers [20]. The clinical specialist then visually assessed and graded erythema induced within the marked ROI, based on criteria outlined in [18] and the results are shown in Figure 3. The erythema intensity and rate of development vary among the three participating volunteers. For instance, the lighter the skin color the faster erythema became visible.
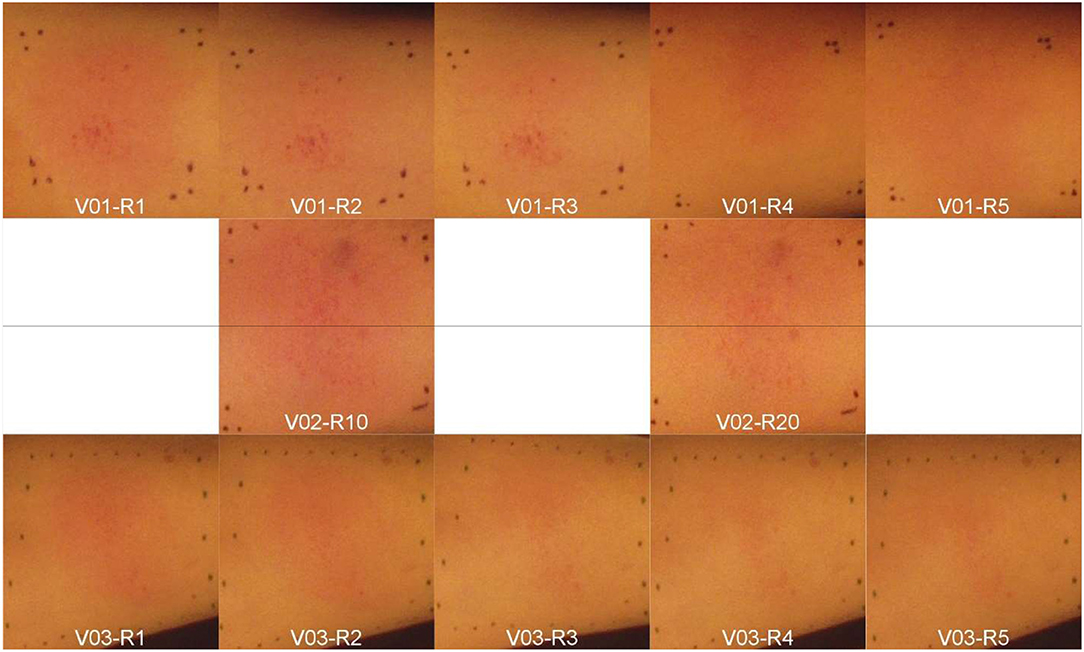
Figure 3. Artificially induced skin erythema on three volunteers' (V01-V03) forearms. Each row represents a different subject (V01-V03). All the images were captured sequentially by the digital color camera at 3-minute intervals or rounds (R1-R20) after inducing erythema. The V02's images were named as R10 and R20 just for arrangement purpose within the figure.
Prior to inducing skin erythema, two reference images of the ROI are acquired; one spectral and one color. The reference images are used as baseline for each subject. Immediately after inducing erythema, a radiotherapist assessed and graded erythema. Color digital images were obtained first, followed by spectral images using the HSI system.
For each spectral image of the erythema, a dark and a white standard spectral data cubes were acquired with matching imaging configuration. The dark spectral data cube was acquired with the camera lens covered. It is utilized to account for the dark current noise in the CMOS sensor, which is illustrated in Figure 4, by subtracting the background. The white standard spectral image was acquired with an isotropic reflectance standard (SRS-99, Labsphere, NH, USA) placed in front of the ROI. It is used to compensate for uneven illumination and instrumentation spectral response. Each set of spectral plus color imaging took ~3 min; therefore, image acquisition was repeated at 3-min intervals until erythema faded away and was no longer visible to the radiotherapist.
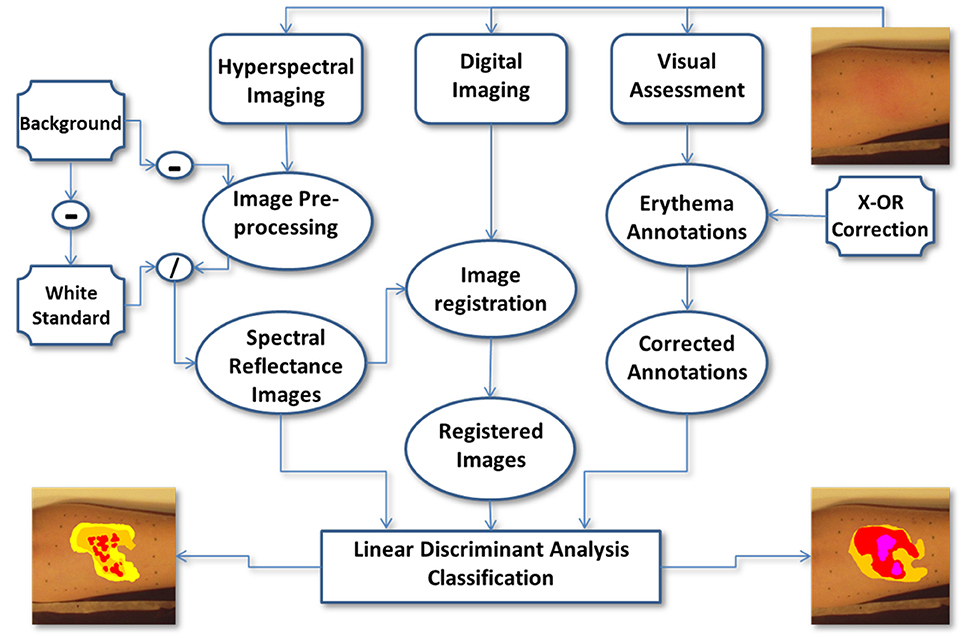
Figure 4. Overview of the image processing workflow.
An overview of the image analysis work flow is illustrated in the flow chart in Figure 4.
Data Processing
In the VA, a radiotherapist graded the induced skin reaction based on his/her clinical expertise out of a predetermined number of possibilities as shown in Figure 5. To avoid the possible subjective judgment of one radiotherapist, a second experienced radiotherapist was involved in offline VA. These erythema grades are considered as the Ground Truth in this study. The induced skin reactions were generally inhomogeneous. As a result, the radiotherapists use their experience to draw contours to separate each level of erythema. The graded regions were contoured using Image-J [18] and were separately stored under skin annotation labels. The skin annotations were masks that can be overlaid on both color and hyperspectral images without altering the original information in the data. A sample of skin annotations provided by the radiotherapist is shown in the top row of Figure 5, where the various skin reactions are identified by overlapping contours.
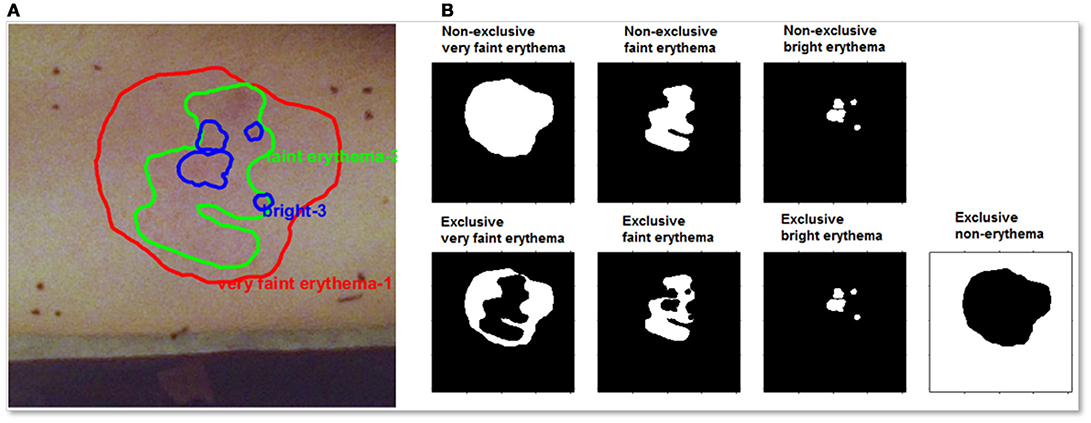
Figure 5. (A) A color image for initial skin erythema annotations provided by the radiotherapist for one volunteer. (B-top) Separated skin erythema annotations provided by the radiotherapist for the same volunteer. White area indicates positive for the intended grade. (B-bottom) XOR process was accomplished for correcting the overlap effect. The correction process yields exclusive annotations. A new annotation of the non-erythematous region was generated to count for normal skin.
For example, as shown in the top row of Figure 5, the lower grade erythema area (left) encloses both higher graded areas (middle and right). An XOR logic process is applied on these original annotations and the resulting classification for each erythema type is shown in the bottom row of Figure 5. The ROI without erythema is calculated by subtracting the sum of all erythematous regions. The corrected skin annotations enable precise monitoring for both the spatial and the temporal skin reaction alterations.
In the current study, the constructed skin contours display the temporal phases along with the spatial changes of the skin reaction intensity. The displayed contours, of different reactions, are attained via a sequence of steps. The first step is grading the induced skin reaction by VA. This step is repeated for all consecutive imaging cycles for each volunteer. Following grading, the second step is computing the ratio of each erythematous reaction region with respect to the entire ROI. The final step is plotting the graded contours of skin at the corresponding imaging cycle, which represents the temporal evolution as shown in Figure 6. The induced skin erythema intensity fades away gradually over time.
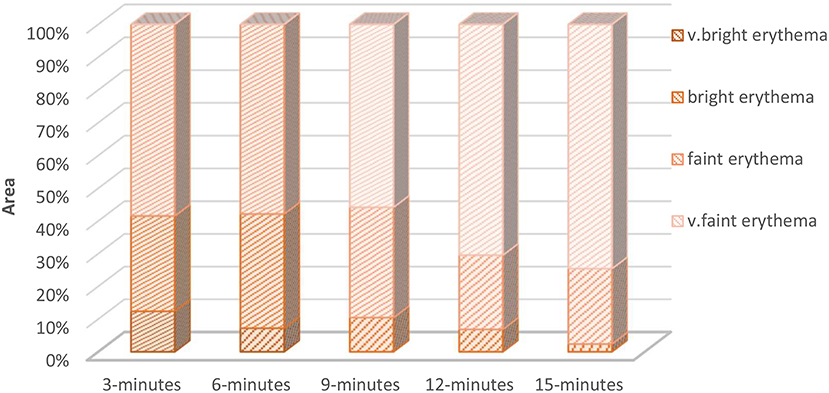
Figure 6. The relative percentage of each erythema grade measured at different time after initial induction. This figure shows an example of erythema from a single volunteer ventral arm side evolution through multiple image sequence cycles. The initial measurements show high erythema intensities (very bright, bright, and faint erythema regions). As time goes by, the skin recovers and the erythema intensity decreases. By the time of 15 minutes, most of the ROI was occupied by the lowest erythema grade (very faint erythema).
Spectral reflectance data are computed via processing the acquired hyperspectral images, which is a 3-dimensional matrix or data cube contains images (2-dimensional matrix of pixel intensity values) at different wavelengths as the third, spectral dimension. Simply, the dark noise was removed from the raw spectral data cube (IROI) by subtracting the sensor dark current (Idark). The effect of uneven illumination is corrected by normalizing the ROI data cube to a white standard reflectance target (Iws). Both the white standard target and the dark noise images were collected under the same conditions. Hence, the skin ROI reflectance (RROI) is computed as follows
Once the skin reflectance was computed, the processed frames were co-registered using ImageJ. The image registration procedure started by selecting a reference frame for the reflectance data cube RROI. The reference frame selection is governed by the computed histogram value at a spot within the ROI. The designated spot usually contains a distinguishable feature/ landmark; be it natural (skin freckle or mole) or artificial (green or blue marked dots). The spectral frames, in the ROI data cube, were co-registered to the reference frame provided that pixel shift was set to minimum. Similar to the spectral frames, the color images were co-registered to the corresponding reference frame. This process aims to maintain the same FOV for both the spectral and the digital images. Following the co-registration process, the ROI data cube undergoes further processing including band selection and classification. A detailed description of the developed classification algorithm including the challenges of learning with noisy labels and proposed solution for dealing with noisy measurements has been published [18].
Classification and Results
After processing, the color images were co-registered with the corresponding spectral data cube; and the skin annotations are overlaid on color and spectral data. Figure 7 shows an example of the overlaid erythema regions of different grades from one such data set. In this example, time-lapsed images of the erythema from time zero (immediate following erythema induction) to 15 min when the induced erythema becomes invisible to the radiotherapist. The sequence of images in Figure 7 demonstrates the gradual decrease of erythema over time.
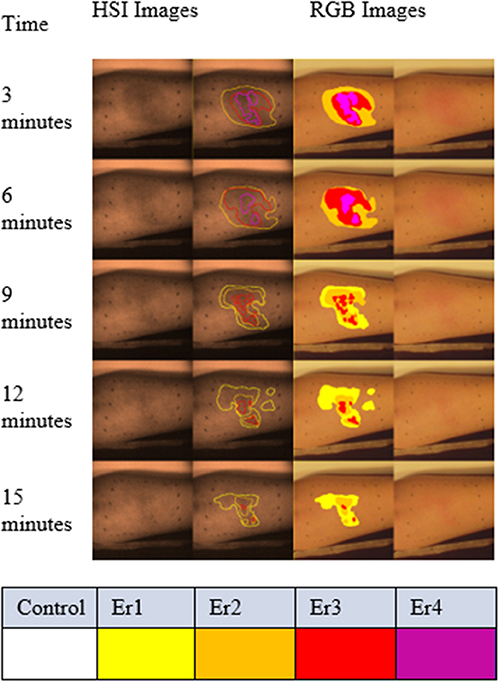
Figure 7. Graded regions of different erythema levels overlaid with color (right two columns) and spectral images (gray scale images in the left two columns) from one volunteer. The sequence from top to bottom is based on the time scale of imaging. The spectral images in this figure were captured at 540 nm, which is one of the absorption peaks for oxyhemoglobin. The spectral images in the right column are overlaid with the radiotherapists' grading results. Similarly, the graded results are shown for the color images. The different levels of erythema are color-coded: very faint erythema (Er1) in yellow, faint erythema (Er2) in orange, bright erythema (Er3) in red and very bright erythema (Er4) in magenta.
The skin reflectance is computed based on the pixel intensities (Equation 1) for each ROI at different skin responses. Skin erythematous levels and normal healthy skin reflectance were plotted in Figure 8A. The result identified the spectral region between 500 and 650 nm for maximum separation between the healthy and erythematous skin. Figure 8B zooms in this spectral region using a single subject's data, which was smoothed using the Savitzky-Golay [21] low pass filter. The error bars in the shown figure demonstrate the heterogeneity of the erythematous zone. Only error bars for the normal healthy skin, and very bright erythema are displayed for contrast purposes.
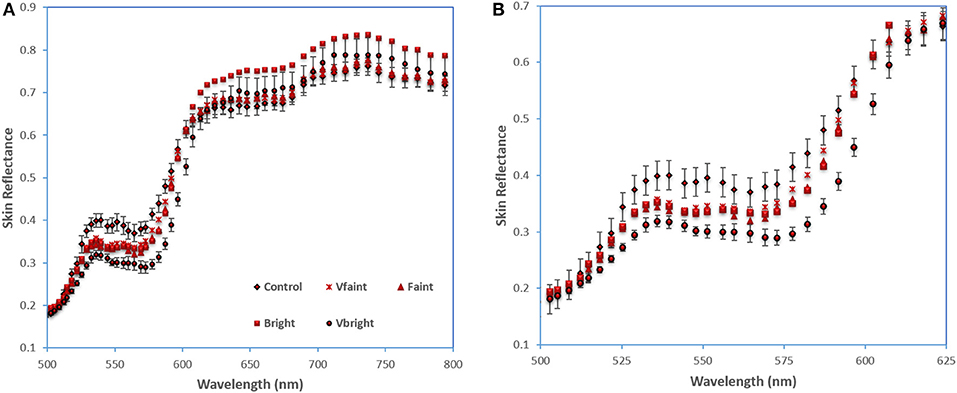
Figure 8. Skin reflectance of normal skin and erythema regions (A) averaged over three subjects; (B) smoothed data from one subject between 500-650 nm. Error bar shows standard error.
For comparison purposes, the skin reflectance was also computed based on the color images. Each color image was split into the three basic components: red, green, and blue. Then the skin annotated ROI's pixel intensities were averaged for each color layer, as shown in Figure 9. The color image analysis also shows that the green layer is the most sensitive region for the development of skin erythema.
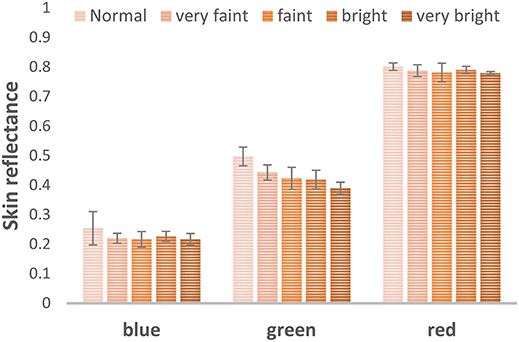
Figure 9. Skin reflectance computed from the color images blue, green, red channels to examine the most sensitive part of the visible region to erythema development.
In case of no dimension reduction for the captured hypercube, the basic spectral feature, in HSI, used for classification is the normalized reflectance spectra [22]. As a result, we performed pixel-level classification of erythema in the spectral datacubes. In our captured cubes, the lower end of the operating spectrum of the used HSI camera provides weak signal to noise ratio (SNR). The former weakness is attributed to two factors; the first is the lower sensitivity of the used sensor, while the second is the fade emission of the light source. We found out, by empirical testing, that removing the low SNR bands has improved the classification performance. In order to remove the low-informative bands, a problem of matrix “Column Subset Selection” was levied. The problem is solved using a straight-forward technique based on “matrix low-rank representation” [23]. The former technique aims to sort the captured bands in terms of the contributed information by each, where the contribution is computed using the Frobenius (element-wise) matrix norm [24]. Simply, the summation of the squared values of each column of the data matrix are sorted in a descendant order. The second step is to add the sorted values to the norm matrix. The ratio between the newly formed matrices to the matrix norm is compared to a threshold value (p ϵ [0,1]). Holding 99% of the contained information (p = 0.99) is the constraint that is used in our study to get rid of the lowest contributing bands. Applying the former procedure, we found out that the highest contributing bands are whose central wavelength: (728, 688, 695, 719, and 703 nm), while the lowest ones are (443, 451, 453, 438, and 455 nm).
The low SNR hyperspectral data is partly attributed to the instrument noise. This noise was reduced by applying Weiner filter [25]. Weiner filter runs in an adaptive way governed by the level of variance of the image's pixels intensities. Weiner's filtered image has pixel intensity Iw(x), where x indexes frame pixels. The former term, Iw(x), is computed adaptively based on the level of noise contained in the original pixel intensity I0(x).
Linear discriminant analysis (LDA) was applied to both the spectral, upon noise reduction, and the color images in a supervised parametric approach, where the ground truth is the results from the radiotherapist. Briefly, LDA classifies the observation data based on the basic assumption of a normal distribution occurring within each particular class. Given a number (n) of labeled set of observations (x, y) where the term: x ∈ ℝm and the term m is the spectral datacube dimension, and y is a single class out of S discrete classes [26]. LDA aims to identify the transformation matrix G that linearly reduces the experimental multidimensional spectral data to a smaller s-dimensional vector (a), where a = GTx ∈ ℝs, provided that s < m. The purpose of transformation to small dimensional vector space is to achieve the maximum separability among distinct existing classes in the multidimensional observations according to an accustomed criterion. This criterion is a mathematical function used for discrimination between groups of data points that come together around a central mean. For instance, a discrimination function (fd) can be determined as follows:
Where Bayes rule has been employed to determine individual class posterior:
An empirical assignment for the prior probability is used in this classification to be equal to n s/n. The p(X) is a utilized as a normalization constant process and is delineated as the summation over the number of discrete classes S as follows:
LDA modeled particular class conditional probability (x|y = s) by applying multivariate normalized density function (fmul):
Where μS and are particular class mean and covariance, and the two mathematical formats |·| and ·−1 are expressing the matrix determinant and inverse, respectively. A further assumption used in the discriminant analysis is that the embedded distinct classes in the provided observation data share a common covariance matrix Σ s = Σ ∀ s which yields a linear boundaries decision. The previous assumptions assisted in the inference of both the mean μŝ and the covariance matrix specifications based on the training ratio of the observation data.
Twelve data sets were collected in this study from the three volunteers. These data sets were divided into two groups; training and test sets. The ratio between the training group and the test group data sets, according to the Pareto principle, was set to 20–80%, respectively. A random selection of the training set was accomplished by a random key generator function. Since the number of data samples was large, ~50,000,000 pixels, down sampling is performed for the acquired data by a factor 0.6 to reduce the size in order to speed up the classification processing time. The classification process was run for 10 consecutive times, and the output results were averaged for verification purposes. Five parameters were reported to weigh classification results; accuracy, precision, sensitivity, specificity and geometrical mean [27].
The average values for the entire formerly mentioned classification parameters were higher in HSI against color imaging. Moreover, the HSI achieved an outstanding performance in accuracy and precision as exhibited in Table 2.
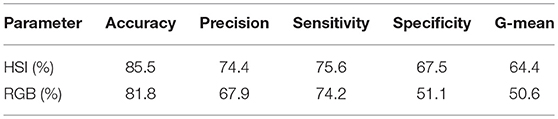
Table 2. Comparison of performance of HSI and RGB imaging for the distinction of erythema ROIs.
Conclusion and Discussion
In this study, we aimed to investigate the feasibility to use an AOTF-HSI system to quantitatively measure skin erythema. This pilot study on healthy volunteers with artificially induced erythema is a checkpoint prior to apply the AOTF-HSI method in a clinical study on radiation treatment induced skin erythema. The current study results demonstrated that HSI can sufficiently classify skin erythema. Compared to diffuse reflectance spectroscopy or color photography, HSI acquires a complete set of wide-field images with full spectral information, which is shown to be important to skin erythema classification.
Even though both spectral and color imaging techniques approved the green region as the most discriminating region in erythema assessment; color imaging is sufficient for interpreting the green reflectance change with erythema alteration. In addition to skin reflectance analysis, supervised classification, LDA processing, contributed in clustering distinct level of induced skin erythema. This clustering technique yields a map for distributed changes of skin erythema. Training the developed LDA classifier with the ground truth created an objective quantitative method of erythema assessment.
Ultimately, the presented exploratory study provided a testimony for: (1) HSI is a feasible optical imaging technique for objective quantitative erythema assessment, (2) the green spectra are the most sensitive visible region for skin erythema alteration. (3) LDA classification method is operating efficiently in sorting erythema grades. 4) HSI outstanding performance, proved by LDA classification parameters, against color imaging in accuracy and precision of detecting erythematous skin regions.
To this end, it is recommended to go through a long-term study for a clinical condition associated with skin erythema. One candidate condition is radiation dermatitis, a skin reaction resulting from the treatment of cancer with radiation. Hyperspectral imaging may prove useful in radiation therapy for monitoring the progression of skin erythema reactions over time. Based on the exploratory study results, it is expected that HSI could be a well-performing contact-free objective monitoring technique for radiation dermatitis. However, much work needs to be done in order to validate HSI as a system for investigating the skin reactions in dermatological clinics. For this purpose, a preliminary study is proceeding to use HSI to detect erythema development on skin cancer patients during radiotherapy treatment.
Author Contributions
QF, JH, TF, RW contributed to experiment design, plan, and data analysis. RA, LD-M contributed to the experimental study and data analysis. AM, S-CY, SS, JZ contributed to classification algorithm design and data analysis. RA, LD-M, and QF wrote the initial version of the manuscript and all authors contributed to the revisions.
Conflict of Interest Statement
The authors declare that the research was conducted in the absence of any commercial or financial relationships that could be construed as a potential conflict of interest.
Acknowledgments
This project is support in part by the Nature Science and Engineering Research Council (NSERC) of Canada, the Canadian Cancer Society Research Institute, the Canadian Foundation of Innovation (CFI) and the Ontario Research Fund: Research Infrastructure program. QF held the Canada Research Chair in Biophotonics. RA is supported by a scholarship provided by the Egyptian Government. S-CY held an NSERC Alexander Graham Bell Canada Graduate Scholarship (CGS) and her 4-month visit to INRIA was supported by an NSERC CGS Michael Smith Foreign Study Supplement Award. JZ, QF, and AM would like to thank the INRIA/ MITACS collaboration program for the partial funding of AM's 3 months visit of INRIA.
References
1. Kollias N, Stamatas GN. Optical non-invasive approaches to diagnosis of skin diseases. J Investig Dermatol Symp Proc. (2002) 7:64–75. doi: 10.1046/j.1523-1747.2002.19635.x
2. Ahmad Fadzil MH, Ihtatho D, Mohd Affandi A, Hussein SH. Objective assessment of psoriasis erythema for PASI scoring. J Med Eng Technol. (2009) 7:516–24. doi: 10.1080/07434610902744074
3. Raina A, Hennessy R, Rains M, Allred J, Diven D, Markey MK. Objective measurement of erythema in psoriasis using digital color photography with color calibration. Ski Res Technol. (2015) 22:375–80. doi: 10.1111/srt.12276
4. Rizova E, Kligman A. New photographic techniques for clinical evaluation of acne. J Eur Acad Dermatol Venereol. (2001) 15 (Suppl. 3):13–18. doi: 10.1046/j.1468-3083.15.s.3.1.x
5. Van Den Kerckhove E, Stappaerts K, Fieuws S, Laperre J, Massage P, Flour M, et al. The assessment of erythema and thickness on burn related scars during pressure garment therapy as a preventive measure for hypertrophic scarring. Burns (2005) 6:696–702. doi: 10.1016/j.burns.2005.04.014
6. Oliveira GV, Chinkes D, Mitchell C, Oliveras G, Hawkins HK, Herndon DN. Objective assessment of burn scar vascularity, erythema, pliability, thickness, and planimetry. Dermatol Surg. (2005) 31:48–58. doi: 10.1111/j.1524-4725.2005.31004
7. Goerge T, Ho-Tin-Noe B, Carbo C, Benarafa C, Remold-O'Donnell E, Zhao BQ, et al. Inflammation induces hemorrhage in thrombocytopenia. Blood (2008) 10:4958–64. doi: 10.1182/blood-2007-11-123620
8. Lahti A, Kopola H, Harila A, Myllyla R. Assessment of skin erythema by eye, laser doppler flowmeter, spectroradiometer, two channel erythema meter, and Minolta chroma meter. Arch Dermatol Res. (1993) 285:278. doi: 10.1007/BF00371596
9. Nyström J, Geladi P, Lindholm-Sethson B, Rattfelt J, Svensk AC, Franzen L Objective measurements of radiotherapy-induced erythema. Ski Res Technol. (2004) 4:242–250. doi: 10.1562/0031-8655(2003)0780331OMOMEA2.0.CO2
10. Yoshida EJ, Chen H, Torres MA, Curran WJ, Liu T. Spectrophotometer and ultrasound evaluation of late toxicity following breast-cancer radiotherapy. Med Phys. (2011) 10:5747–55. doi: 10.1118/1.3633942
11. Glennie D, Doerwald-Munoz L, Ostapiak O, Patterson M, Hayward JE, Farrell T. Time series analysis of skin reactions during heck and neck IMRT. Med Phys. (2014) 38:3493. doi: 10.1118/1.3611985
12. Trotti A, Colevas AD, Setser A, Rusch V, Jaques D, Budach V., et al. CTCAE v3.0: Development of a comprehensive grading system for the adverse effects of cancer treatment. Semin Radiat Oncol. (2003) 13:176–81. doi: 10.1016/S1053-4296(03)00031-6
13. Pramanik T, Khatiwada B, Pandit R. Color vision deficiency among a group of students of health sciences. Nepal Med Coll J. (2012) 4:334–6.
14. Querleux B. Magnetic resonance imaging and spectroscopy of skin and subcutis. J Cosmet Dermatol (2004) 3:156–61. doi: 10.1111/j.1473-2130.2004.00118.x
15. Maddocks-Jennings W, Wilkinson JM, Shillington D. Novel approaches to radiotherapy-induced skin reactions: a literature review. Complement Ther Clin Pract. (2005) 4:224–31. doi: 10.1016/j.ctcp.2005.02.001
16. Setaro M, Sparavigna A. Quantification of erythema using digital camera and computer-based colour image analysis: a multicentre study. Skin Res Technol. (2002) 8:84–8. doi: 10.1034/j.1600-0846.2002.00328.x
17. Abdlaty R, Orepoulos J, Sinclair P, Berman R, Fang Q. High throughput AOTF hyperspectral imager for randomly polarized light. Photonics (2018) 5:3. doi: 10.3390/photonics5010003
18. Madooei A, Abdlaty RM, Doerwald-Munoz L, Hayward J, Drew MS, et al. Hyperspectral image processing for detection and grading of skin Erythema. In: SPIE Medical Imaging Conference. Florida (2017). doi: 10.1038/nmeth.2089
19. Wong S, Kaur A, Back M, Lee KM, Baggarley S, Lu JJ. An ultrasonographic evaluation of skin thickness in breast cancer patients after postmastectomy radiation therapy. Radiat Oncol. (2011) 6:9. doi: 10.1186/1748-717X-6-9
20. D'haese S, Van Roy M, Bate T, Bijdekerke P, Vinh-Hung V. Management of skin reactions during radiotherapy in Flanders (Belgium): a study of nursing practice before and after the introduction of a skin care protocol. Eur J Oncol Nurs. (2010) 5:367–72. doi: 10.1016/j.ejon.2009.10.006
21. Chen J, Jönsson P, Tamura M, Gu Z, Matsushita B, Eklundh L. A simple method for reconstructing a high-quality NDVI time-series data set based on the Savitzky-Golay filter. Remote Sens Environ. (2004) 91:332–44. doi: 10.1016/j.rse.2004.03.014
22. Lu G, Wang D, Chen ZG. Spectral-spatial classification for noninvasive cancer detection using hyperspectral imaging. J Biomed Opt. (2014) 19:106004. doi: 10.1117/1.JBO.19.10.106004
23. Palsson F, Sveinsson JR, Ulfarsson MO, Benediktsson JA. Model-BasedFusion of Multi-and Hyperspectral Images using PCA and Wavelets. IEEE Trans Geosci Remote Sens. (2015) 5:2652–63. doi: 10.1109/TGRS.2014.2363477
24. Liu G, Lin Z, Yan S, Sun J, Yu Y, Ma Y. Robust recovery of subspace structures by low-rank representation. Pattern Anal Mach Intell IEEE Trans. (2013) 1:171–84. doi: 10.1109/TPAMI.2012.88
25. Tan S, Young R, Budgett D, Richardson J, Chatwin C. A pattern recognition Weiner filter for realistic clutter backgrounds. Opt Commun. (1999) 6:193–202.
26. Bandos T. Classification of hyperspectral images with regularized linear discriminant analysis. Geosci Remote. (2009) 3:862–73. doi: 10.1109/TGRS.2008.2005729
Keywords: erythema, skin, hyperspectral imaging, classification, radiation therapy, cancer, AOTF
Citation: Abdlaty R, Doerwald-Munoz L, Madooei A, Sahli S, Yeh S-CA, Zerubia J, Wong RKW, Hayward JE, Farrell TJ and Fang Q (2018) Hyperspectral Imaging and Classification for Grading Skin Erythema. Front. Phys. 6:72. doi: 10.3389/fphy.2018.00072
Received: 12 April 2018; Accepted: 26 June 2018;
Published: 28 August 2018.
Edited by:
Zhen Cheng, Stanford University, United StatesReviewed by:
Zhenhua Hu, University of Chinese Academy of Sciences (UCAS), ChinaHongguang Liu, Northeastern University, China
Copyright © 2018 Abdlaty, Doerwald-Munoz, Madooei, Sahli, Yeh, Zerubia, Wong, Hayward, Farrell and Fang. This is an open-access article distributed under the terms of the Creative Commons Attribution License (CC BY). The use, distribution or reproduction in other forums is permitted, provided the original author(s) and the copyright owner(s) are credited and that the original publication in this journal is cited, in accordance with accepted academic practice. No use, distribution or reproduction is permitted which does not comply with these terms.
*Correspondence: Qiyin Fang, cWl5aW4uZmFuZ0BtY21hc3Rlci5jYQ==
†Present Address: Ramy Abdlaty, Department of Biomedical Engineering, Military Technical College, Cairo, Egypt