 Li Feng1,2*
 Weiqun Gan1,2Siqing Liu3Huaning Wang4Hui Li1,2Long Xu4Weiguo Zong5Xiaoxing Zhang5Yaguang Zhu6Haiyan Wu3Anqin Chen5Yanmei Cui3Xinghua Dai7Juan Guo4
 Han He4Xin Huang4Lei Lu1,2
 Qiao Song5Jingjing Wang3Qiuzhen Zhong3Ling Chen3Zhanle Du4Xingliang Guo6Yu Huang1,2
 Hu Li3
 Ying Li1,2Senlin Xiong3Shenggao Yang6Beili Ying1,2
- 1Key Laboratory of Dark Matter and Space Astronomy, Purple Mountain Observatory, Chinese Academy of Sciences, Nanjing, China
- 2School of Astronomy and Space Science, University of Science and Technology of China, Hefei, China
- 3National Space Science Center, Chinese Academy of Sciences, Beijing, China
- 4Key Laboratory of Solar Activity, National Astronomical Observatories, Chinese Academy of Sciences, Beijing, China
- 5Key Laboratory of Space Weather, National Center for Space Weather, China Meteorological Administration, Beijing, China
- 6State Key Laboratory of Astronautic Dynamics, Xi'an, China
- 7School of Physics and Information Engineering, Shanxi Normal University, Linfen, China
The Advanced Space-based Solar Observatory (ASO-S) is a mission aiming at exploring solar flares, coronal mass ejections (CMEs), solar magnetic field and their relationships. To fulfill its major scientific objectives, ASO-S has three elaborately-designed payloads onboard: the Full-disk vector MagnetoGraph (FMG), the Lyman-alpha Solar Telescope (LST), and the Hard X-ray Imager (HXI) dedicated to observe vector magnetic fields, CMEs, and flares, respectively. Beside the scientific objectives, we have an operational objective to observe solar eruptions and magnetic field for making related space weather forecasts. More specifically, we have set a priority for the downlink of CME data observed by LST, and will distribute those data to different space weather prediction centers in China within 2 h once the Science Operation and Data Center (SODC) of ASO-S receive the data. After data downlink and archiving, different automatic detection, tracking, and cataloging procedures are planned to run for the most critical solar eruptive features. On the other hand, based on the distributed and downloaded data, different space weather prediction centers are to activate their forecast systems for the ASO-S observed solar eruption events. Our particular interests are currently focused on nowcast of different eruption events, prediction of CME arrivals, forecast of solar flares and the onset of solar eruptions. We are also working on further forecast potentials using the ASO-S data to make contributions to other possible important issues of space weather.
1. Introduction
The Sun is the major driver of space weather. Coronal mass ejections (CMEs) are eruptions of plasma and magnetic field from the solar corona, and solar flares are sudden enhancement of radiation. On the Sun they are two most relevant phenomena to space weather impacts at Earth and even in the heliosphere. CMEs are the sources of major geomagnetic storms which results in intense currents in the Earth's magnetosphere, changes in the radiation belts, and in the ionosphere. Severe storms can cause extra drag on low-orbit satellites, disrupt navigation system, create errors in the positioning service of GPS, and harm the power grids and pipelines. Usually a CME takes several days to reach Earth. However, for very fast events, the arrival time can be as short as 18 h. Therefore, the prediction of CME arrivals as precise as possible is crucial. There have been quite a number of propagation models developed for CMEs and their driven shock. For a list of the models and their corresponding references, we refer readers to https://swrc.gsfc.nasa.gov/main/cmemodels. A CME arrival time scoreboard is also provided where users can submit their forecast, view all forecasts at once in real-time, and compare forecasting results when the CME arrives at Earth.
The forecasting of solar flares is another important topic of space weather research. The radiation of flares has an almost immediate effect of the sudden ionospheric disturbances, which disturb radar communication systems in the sunlit hemisphere. The solar energetic particles (SEPs) accelerated by the magnetic reconnection during flares and CME-driven shocks have broad space weather impacts as well. Therefore, it is highly desirable to be capable of predicting the occurrence time and magnitude of a flare before it is observed. Barnes et al. [1], Leka et al. [2, 3] published a series of review papers on the comparison of different flare forecasting methods for operational solar flare forecasting systems, which include rigorously measure the performance of different methods and evaluate temporal patterns of forecasting errors.
Forecasting the onset of a solar eruption event is a more challenging space weather task. There have been lots of efforts in this direction. e.g., searching the magnetic null points [4–7], calculating the critical decay index [8], twist number [9], etc, based on the computed magnetic fields. However, we are not at a stage that operational forecasts of eruption onset are available yet.
The Advanced Space-based Solar Observatory (ASO-S) mission [10] will be the first Chinese solar mission in space. It aims at exploring solar flares, CMEs, solar magnetic field and their relationships. Flares and CMEs have energies from the magnetic field. Therefore, simultaneous observations of the magnetic field, flares and CMEs, and their corresponding studies are of particular importance. We also have an operational objective, that is, to observe solar eruptions and magnetic fields, and provide data products to different space weather prediction centers in China for designing suitable forecast products and making corresponding forecasts. To fulfill its major scientific and operational objectives, the Chinese solar physics community proposed the ASO-S mission, which has three elaborately designed payloads: the Full-disc vector MagnetoGraph (FMG, [11, 12]), the Lyman-alpha (Lyα) Solar Telescope (LST, [13–15]), and the Hard X-ray Imager (HXI, [16, 17]) dedicated to observe magnetic fields, CMEs, and flares, respectively.
Based on the scientific and operational objectives, payloads and available data products of ASO-S, in this paper, we mainly review on the space-weather products which are applicable to the ASO-S mission, and are developed by different prediction centers in China. They are the Space Environment Prediction Center (SEPC) of the National Space Science Center, the Solar Activity Prediction Center (SAPC) of the National Astronomical Observatories, and the National Center for Space Weather (NCSW) of China Meteorological Administration (CMA), State Key Laboratory of Astronautic Dynamics. The products presented in the paper are the outcome of a few workshops we held on space weather with ASO-S. At the moment, our space weather products cover the solar eruption nowcast, prediction of CME arrivals, flare forecast, and eruption onset forecast. Moreover, we are currently improving these products and tailoring them to the data products of ASO-S. We also welcome further contributions from the space weather community to fulfill the operational objective of the mission.
2. Overview of the ASO-S Mission
The ASO-S is a mission proposed by the Chinese solar community for the solar activities close to the 25th solar maximum. There are three major scientific objectives and one major operational objective for this mission [10]: (1) To simultaneously acquire non-thermal images of solar flares in hard X-rays, and the initiations of CME in Lyα waveband, in order to understand the relationships between flares and CMEs; (2) To simultaneously observe the full-disk vector magnetic field, the energy build up and release of solar flares, and the formation of CMEs, in order to understand the causality among them; (3) To record the response of solar atmosphere to eruptions, in order to understand the mechanisms of energy release and transport; (4) To observe solar eruptions and the evolution of magnetic field, in order to provide clues for forecasting space weather.
To fulfill these objectives, there are three elaborately-designed payloads onboard. FMG measures the vector magnetic fields in the photosphere on the solar disk. It has a larger field of view (34 arcmin) and higher time cadence (120 s) than the magnetograph onboard Hinode. And it has a simpler observation mode and a higher measurement precision than the magnetographs onboard SDO and SOHO. FMG has six sub-systems: optical imaging, polarization, electronics, thermal control, imaging stability, and data processing [10]. LST consists of three instruments observing in Lyα and white light: solar disk imager (SDI), solar coronagraph imager (SCI), and white-light solar telescope (WST). SDI and SCI can observe CMEs seamlessly from solar disk to 2.5 R⊙, in Lyα with high temporal and spatial resolution. The hydrogen Lyα line is the strongest line in UV. Our Lyα observations will provide new diagnostics of CMEs and flares. SCI also has a white-light polarimetric coronagraph. WST mainly observes white-light flares, an important aspect of flare research. HXI is designed for flare observations and images the full solar disk in the energy range from about 30 to 200 keV. It has a high angular resolution and time cadence. The imaging principle of HXI is similar to the hard X-ray telescope onboard YOHKOH using indirect imaging technique of spatial modulation. The main characteristics of three payloads are summarized in Table 1.
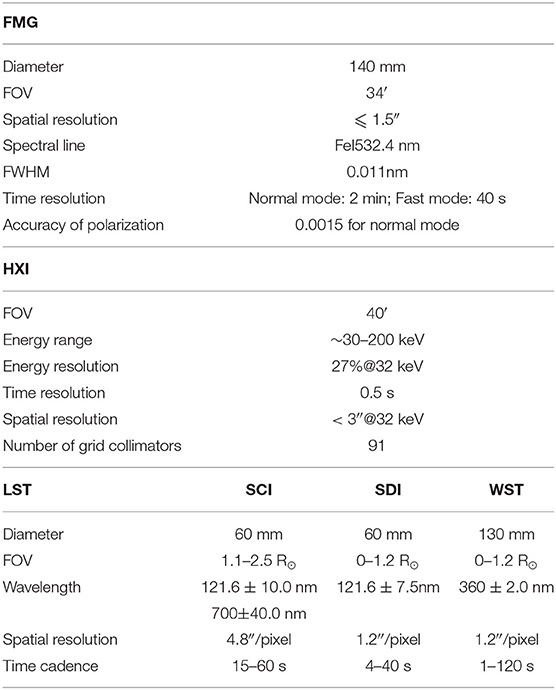
Table 1. The main parameters of three instruments aboard ASO-S. This table is adapted from Gan et al. [10].
3. ASO-S Data Support for Space Weather
The inflight telemetry from ASO-S is received by the Science Mission Operation Center (SMOC) in the National Space Science Center of China to produce level 0 data, then transferred by using a dedicated network for ASO-S to the Science Operation and Data Center (SODC, [18]) in Purple Mountain Observatory (PMO) for further data processing. Q0 and level 0 are obtained directly from SMOC. ASO-S follows the open data policy in the international solar and space weather communities. After SODC receives data from SMOC, the data products of different levels are expected to be ready for distribution within 24 h routinely. In the future, users can access and download data from the official ASO-S website which are in both English and Chinese.
We have set priority to the data products dedicated to the space weather predictions. In particular, the images containing CME structures observed by the SCI white-light coronagraph of LST are distributed to collaborative prediction centers within 2 h after SODC receives the data from SMOC. Note that SMOC also requires some hours to receive the raw telemetry, process and distribute them to SODC. In the case of SCI, it takes no more than 18 h in principle. Therefore, the SCI data with CMEs will usually flow to our prediction centers within a total of no more than 20 h after CMEs are observed by the spacecraft.
As only the coronagraph data with CMEs are distributed, we plan to classify the future white-light coronagraph images into two categories, i.e., the CME-detected category and the CME-not-detected category. The former category includes images which contain CME structures in the images, while the latter category not. To implement such classification, we have applied a machine learning technique and have tested it with the LASCO C2 data. Convolutional neural networks (CNNs) have shown excellent performance in image classification in recent years. We have used a trained CNN LeNet to classify the coronagraph images. More details of the image classification with CNN can be found in Wang et al. [19].
4. Preparations for the Future Space Weather Products Based on the ASO-S Data
Space weather predominantly encompasses the impact of solar eruptions at the Earth and in the heliosphere. The operational objective of ASO-S is to observe solar eruptions and evolution of solar magnetic field, and provide data products to different space weather prediction centers in China for designing forecast products and making corresponding forecasts. To fulfill the operational objective of ASO-S, we have established a space weather working group which involves the ASO-S team and members from different prediction centers. The following subsections mainly summarize the outcome of a couple of workshops that we had. At the moment, our space weather products cover the solar eruption nowcast, prediction of CME arrivals, flare forecast, and eruption onset forecast.
4.1. Solar Eruption Nowcast
Foreseeing the large amount and different types of data streams after the launch of ASO-S, an integrated image viewing system is crucial for monitoring the solar activities observed by ASO-S. Classifying different features observed by ASO-S is very helpful for users to search interested targets for analyses. Categorized computer vision modules designed for the Solar Dynamics Observatory (SDO) which provide the entries to the Heliophysics Events Knowledgebase (HEK) are good examples for such purposes [20].
4.1.1. Integrated Image Viewing Systems
High-resolution, high-cadence, and multi-band observations have brought a large amount of data, which leads a problem to space weather forecasters who want to quickly understand the comprehensive situation of the Sun. The Solar Activity Prediction Center (SAPC) of the National Astronomical Observatories, Chinese Academy of Sciences (NAOC) is a professional institution in China dedicated for the solar activity monitoring and forecasting [21–23]. SAPC suggests an overall solar activity monitoring and nowcast scheme based on the ASO-S observations. In the nowcast scheme by the SAPC, all the instruments of the ASO-S including FMG, LST/SDI, LST/SCI, LST/WST, HXI are employed to yield an overall view of solar activity. The contents of the solar activity nowcast include: (1) the global solar activity condition nowcast; (2) the flare activity nowcast; and (3) the CME activity nowcast. In addition to the solar images taken by the ASO-S mission, the coronal magnetic field as well as the physical measures of the photospheric and coronal magnetic field in the source regions of solar eruptions are also calculated from the observed data and visualized. The nowcast products of solar activity are a synthesis of the observed images, the visualized field lines and physical measure distributions, and the animations of flare and CME eruptions. Table 2 gives a full list of the nowcast products based on the ASO-S observations.
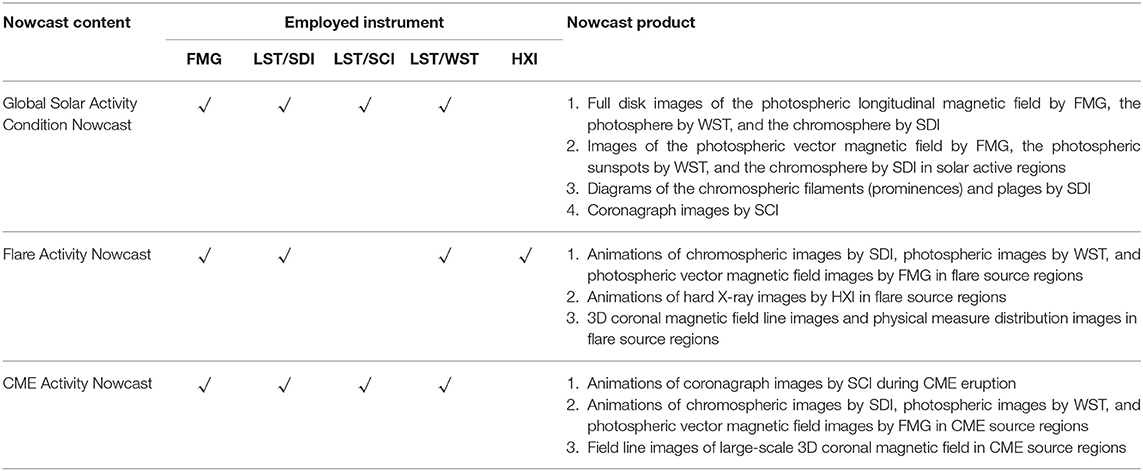
Table 2. Solar activity nowcast products based on the ASO-S observations.
The National Center for Space Weather (NCSW) is the space weather operational unit of China Meteorological Administration (CMA) and it provides monitoring, early warning, nowcast, forecast and other space weather services for nearly two decades. We develop the solar synoptic chart (SSC) method to improve the daily operational efficiency of space weather forecast. The SSC is an integrated image viewing system based on the survey of both literatures and observations, and it is focusing on the key objects of solar activities, tracing magnetic fields, and visualizing quantitative data. The quantitative data is as important as observational images in the SSC. For example, the non-potential parameters of the solar magnetic fields are closely related to the eruption of flares [24], and the multi-band solar images can show the observational characteristics of flares [25]. Case studies show that comprehensive information of the SSC reveals the general state of solar atmosphere as well as eruptions, which proves that it is a beneficial tool for space weather forecasting [26]. At present, the SSC contains four EUV channels of SDO/AIA, 4500 continuum images and longitudinal magnetic fields of SDO/HMI, and Hα data of NCSW. We will add the data of the three payloads of ASO-S to the SSC in the future. The near-real-time and high-quality data of ASO-S will be useful to identify active regions, coronal holes, filaments/prominences, and the eruption of flares and CMEs, and to improve the numerical prediction and the space weather service.
4.1.2. Feature Detection and Cataloging
Building different catalogs for different solar features is very useful for data users to search their interested objects for further case and statistical studies. Therefore, the SODC in PMO and different space weather prediction centers are working together to develop automatic detection techniques for different features and set up catalogs for active regions, CMEs, filaments, prominences, flares, etc. These catalogs will be shared through the official ASO-S website and the website of our prediction centers.
A suite of automatic procedures for the detection of solar active regions (ARs), calculations of AR key magnetic parameters, and recognition of the AR morphology are presented in Fang et al. [27] and Li et al. [28]. A CNN method is applied for the characteristic recognition of solar active regions including sunspot umbra and penumbra, which has a productive performance in identification of the magnetic types and McIntosh classification. These results are very beneficial to forecast solar activity and space weather.
For CMEs, both automatic and manual detection tools [29] are used at SEPC [30]). An algorithm using J-maps [31, 32] and the Hough transform [33] is adopted to detect and identify CMEs automatically. Hough transform is a feature extraction method that is used to identify lines in an image classically. The detection runs in real-time and the detected CME results are one of the important references for forecasters. A human-computer interaction tool has been developed, and is expected to help us to identify rather faint fronts of a halo CME where the automatic detection does not work well. The manual detection improves the fitting accuracy of a halo CME, and consequently the forecast accuracy from the CME propagation model. Recently, the SODC of ASO-S also developed a detection and tracking method CAMEL using machine learning techniques. Currently we have finished the method development, and are setting up a catalog for LASCO C2 data. For details of the method please see Wang et al. [19]. A comparison of the detection results by CAMEL and by a few other existing methods for the most geo-effective halo CMEs can be seen in Figure 1. The aforementioned techniques will be tested on the LST/SCI white-light coronagraph data.
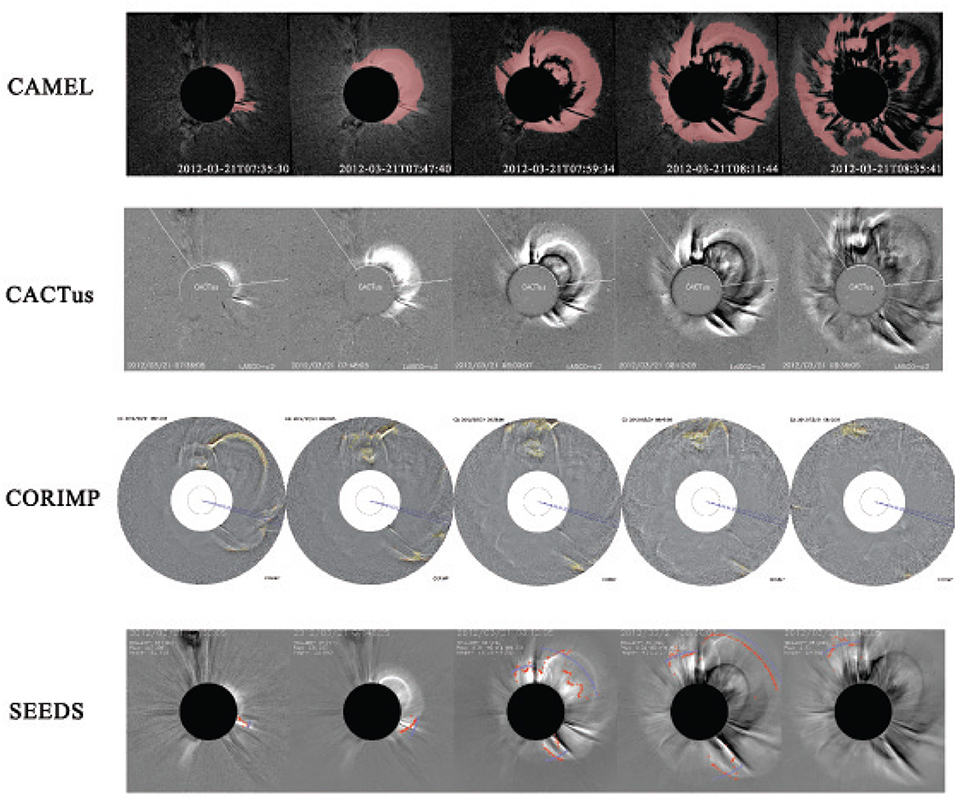
Figure 1. Comparison of the detection and tracking results between CAMEL and a few other existing methods for the CME event on 2012 March 21. This figure is adapted from Wang et al. [19].
By collaborating with Nanjing University, we plan to generate a filament catalog based on LST/SDI observations. The catalog will include some basic information of filaments, such as location, area, perimeter, alignment, length of main axis, number of barbs, etc. The algorithm has already been established and the codes have been developed. They have been tested with currently available ground-based and space-borne observations in both visible and ultraviolet wavebands [34, 35]. Prominence is another interesting feature to detect beyond the solar limb from LST/SDI data. The technique we are going to implement is adopted from the Solar Limb Prominence Catcher and Tracker (SLIPCAT, [36]) and has been successfully applied to the STEREO/EUVI data at 304 Å. Both codes will be optimized for the ASO-S observations when available. In addition, a flare catalog is currently being developed and tested.
4.2. Prediction of CME Arrivals
Prediction of CME arrivals is the major space weather task for ASO-S. FMG produces synoptic magnetic maps for a given Carrington rotation which is one of the inputs for the background solar wind modeling. LST/SCI has a white-light coronagraph with the capability of polarimetric measurements [15]. The 3D reconstruction of CMEs based on the coronagraph images yield key parameters of CME, e.g., speed, width, propagation direction, which are the main input parameters for the CME propagation models. In this Section, we describe the methods that we will adopt in the future for the prediction of CME arrivals with the FMG and LST data.
4.2.1. Background Solar Wind Modeling
The operational solar wind prediction system [29] in SEPC first calculates the background solar wind on the source surface at 2.5 R⊙. Using the PFSS model [37, 38] we extrapolate the magnetic field to the source surface from the photospheric magnetic field synoptic map obtained from the Global Oscillation Network Group (GONG; [39]). To compute the solar wind speed at the source surface, we apply the empirical WSA method [40–43]. Beyond the source surface, we apply the empirical HAF model to simulate the propagation of the solar wind using the solar wind parameters at the source surface as part of the initial inner boundary conditions [44, 45]. Our system can be used to predict solar wind conditions at 1 AU.
4.2.2. 3D Reconstruction of CMEs
There have been quite a number of methods for 3D reconstruction of CMEs as reviewed by Howard [46] and Feng et al. [47]. Here we only include those methods which will possibly be used for the ASO-S mission by our team members. The operational solar wind prediction system [29] in SEPC adopt the ice-cream cone model [48] for the geometric fitting of the detected CMEs. It is the simplest model for 3D reconstruction of CMEs. Another geometric fitting method with an assumed CME shape that is mostly used is the Graduated Cylindrical Shell (GCS) model [49]. To avoid the assumption of a specific shape for a CME, [50] developed the mask-fitting method and used the traced CME periphery in the images observed from multi-viewpoints to constrain the 3D CME volume. Besides the geometrical methods, the polarization ratio (PR) method [51, 52] is often used when we have the observation from only one perspective. As LST offers the polarimetric observations with polarizers at three different positions in white light [53], the PR method can be considered as an important candidate for calculating 3D parameters of a CME observed from only a single viewpoint at Earth.
The polarization of the sunlight scattered by coronal electrons is well known. According to the Thomson scattering theory, the polarization degree of the scattered light is determined by the electrons distributed along each light of sight (LOS), i.e., for a given LOS, the further the electron is away from the plane of the sky, the lower the polarization degree in white light. The PR technique can convert the polarimetric observations to average distances of the contributing electrons off their sky plane in 3D. The technique is generally applied to limb CMEs, while for halo CMEs, it is rarely applied. Lu et al. [54] made this technique applicable to halo CMEs with a careful processing of polarimetric observations, such as subtracting a well-prepared background image, isolating and removing irrelevant background structures, and so on. For halo CMEs, one unavoidable problem is the missing of part of their most front due to the occultation of typical coronagraphs. To obtain the 3D information of the entire CME, we apply the widely used GCS model to fit the 3D points derived from the PR technique. Our results in Figure 2 suggest that the combination of the GCS model with the PR method (GCS-PR) can give a reliable estimate of the direction of CME propagation.
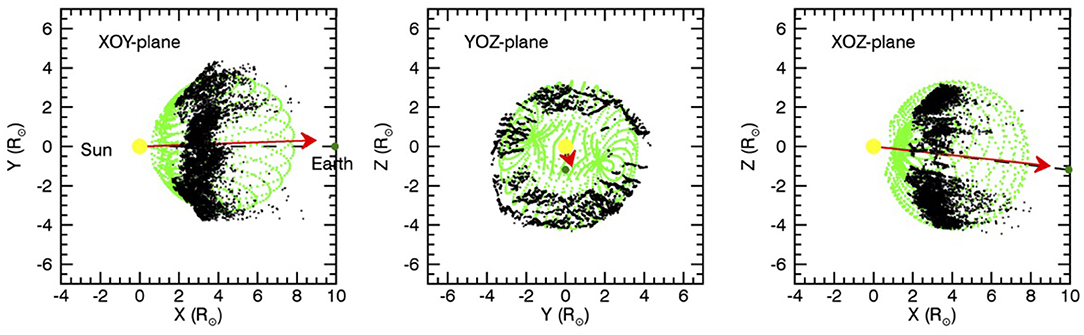
Figure 2. Projections of the reconstructed CME with the GCS-PR method onto different planes. The red arrows indicate the direction from the Sun to the center of the GCS reconstructed CME. This figure is adapted from Lu et al. [54].
Dai et al. [55] classified the ambiguity into explicit and implicit type during CME reconstruction using the PR method based on the polarimetric white light data from coronagraphs onboard STEREO. Such classification evaluates the reliability of the reconstruction results. We can reconstruct CMEs without ambiguity under explicit condition. On the other hand, we can not reconstruct CMEs without ambiguity under implicit condition. Dai et al. [56] pointed out that the intrinsic ambiguity of polarization ratio method does not affect the mass calculation of CMEs. They applied the method to obtain a more accurate 3D position of electrons along each line of sight (LOS) corresponding to each pixel on the CME images to improve the accuracy of mass calculation. Combination of the work of Dai et al. [55, 56] may give us a more reliable CME reconstruction with more accurate location and mass using data from only one viewpoint.
4.2.3. CME Propagation Models
The operational solar wind prediction system [29] in SEPC adopted the modified HAF model to propagate CMEs by taking into account the background solar wind, the eruption source information, and the 3D CME parameters. We adopted a deceleration function for the CME speed profile. The initial speed distribution is calculated from the fitted CME speed and angular width over the source surface. Our system has the capability to predict solar wind disturbances near Earth, especially the arrival time of CMEs. Figure 3 is a simulation snapshot of the solar wind and CME on April 18, 2014.
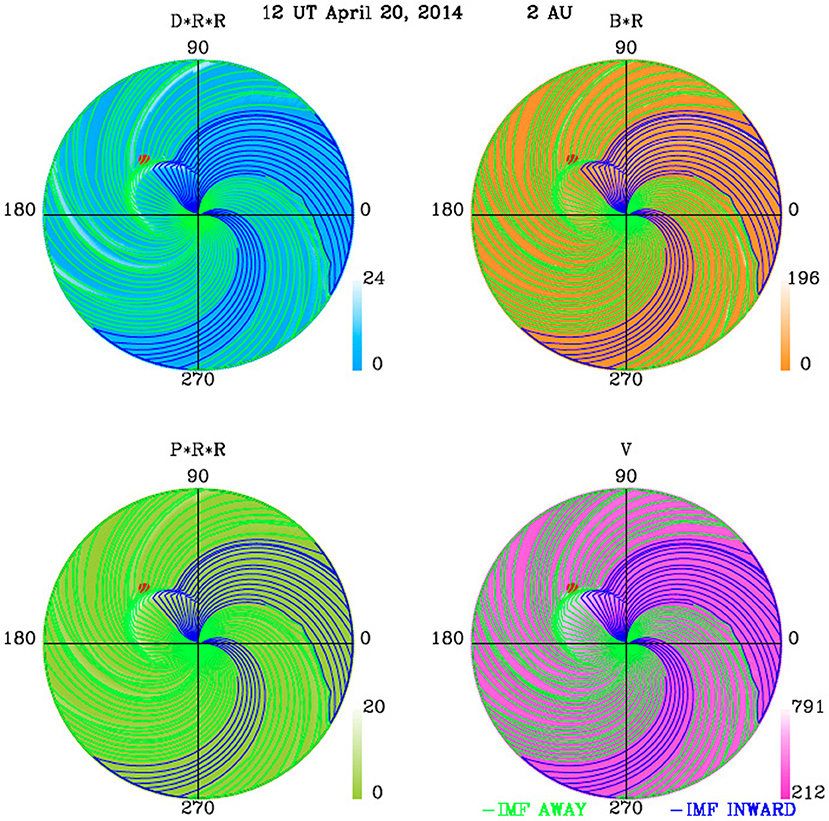
Figure 3. A snapshot of the cone plus HAF simulation on the solar wind and CME in the ecliptic plane on April 18, 2014. The panels from left to right and from top to bottom are proton density, magnetic field strength, dynamic pressure, and solar wind speed, respectively. The red dot represents the Earth. The inward and outward field lines are indicated by blue and green lines. This Figure is adapted from Wang et al. [29].
On the other hand, the results of 3D reconstruction of CMEs can be used as key input parameters of the CME propagation model in the frame of the Space Weather Modeling Framework (SWMF) [57, 58]. The CME is firstly inserted into the Solar Corona (SC) component and then propagate into Inner Heliosphere (IH) by the coupling between SC and IH. Block-Adaptive Tree Solar wind Roe-type Upwind Scheme [59] (BATS-R-US) algorithm is used to solve the 3D magnetohydrodynamics (MHD) equations to simulate the propagation of the reconstructed CME. Component SC and IH are coupled between 18 and 20 R⊙. The computational domain for SC simulation is defined by −24 R⊙ < x,y,z < 24 R⊙ and for IH by −240 R⊙ < x,y,z < 240 R⊙. A successful demonstration of the CME propagation in the interplanetary space can be found in Jin et al. [60]. The working group have tested the propagation model with a few CME events, and compared the simulated density, velocity and magnetic field with the Advanced Composition Explorer (ACE) [61] in situ measurements. It's shown that the prediction precision can be less than 10 h.
4.3. Solar Eruption Forecast
4.3.1. Solar Flare Forecasting Models
Although the physical mechanism of solar flare is not yet very clear, there has been a great deal of efforts to establish a probabilistic flare forecasting model. The basic idea of solar flare forecast is to find sensitive precursors, and build a forecasting model which characterizes the relationships between precursors and solar flares.
From the point of view of precursors, lots of morphological or physical parameters are extracted from active regions. For example, McIntosh classifications [62], the effectively connected magnetic field (Beff) [63], magnetic neutral line [64, 65], a weighted measure of the magnetic flux near the neutral line [66], free magnetic energy [67], Magnetic helicity [68], the magnetic energy spectrum [69], active longitudes [70] and so on. From the point of view of modeling methods, quite a number of statistical and machine learning methods are applied to set up a forecasting model. For example, superposed epoch analysis [71], neural networks [72], decision tree [73], the Random Forest Algorithm [74], Bayesian network [75] and so on.
So far, solar flare forecast is still a challenging task. Because of the random nature of solar flares, it is difficult to find an effective precursor. In the recent development of solar flare forecast, deep learning methods [76–79] are used to automatically extract forecasting patterns from the observational data and finally build a forecasting model. Depending on the big observational solar data, deep learning methods may be one of ways to improve the performance of solar flare forecast. For example, based on the line-of-sight magnetograms of active regions and soft X-ray observations of flares, Huang et al. [76] developed a flare forecasting model using the CNN in deep learning. Figure 4 illustrates the structure of the CNN. The authors showed that the performance of the proposed model is comparable to that of the state-of-the-art flare forecasting models. The method is not sensitive to the forecasting periods of 6, 12, 24, or 48 h. Case studies revealed that the deep-learning-based forecasting method pays attention to regions in the line-of-sight magnetograms of active regions with the polarity-inversion line or strong magnetic field. The input of the forecast, i.e., the magnetograms will be provided by FMG, flare information can be acquired from LST in Lyα and white light and HXI in hard X-ray in the future.
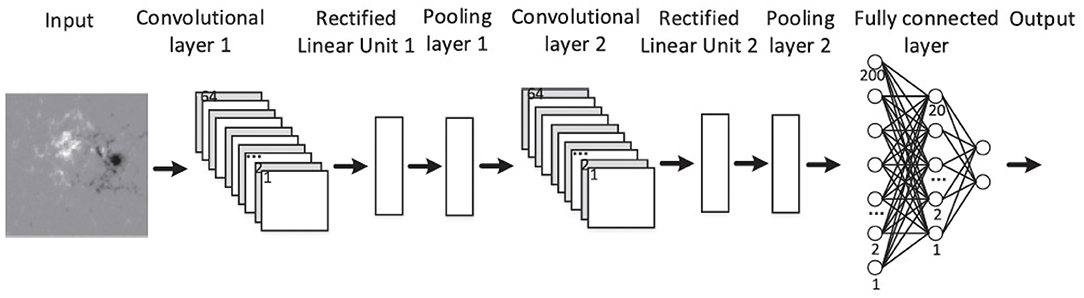
Figure 4. Structure of the convolutional neural network in the deep learning method for flare forecasting. The method uses the line-of-sight magnetogram as input. This Figure is adapted from Huang et al. [76].
The FMG instrument can obtain time series of photospheric vector magnetograms in active regions with high spatial and temporal resolution. The time evolution of the photospheric vector magnetic fields can be traced continuously for nearly all active regions appearing on the solar disk except for the marginal area near the solar limb. By numerical modeling of the coronal magnetic fields with the sophisticated nonlinear force-free field (NLFFF) model from the observed photospheric vector magnetograms [80, 81], the time series data of the coronal magnetic fields corresponding to the time series photospheric vector magnetograms can also be obtained. Then the numerical analysis can be performed on the coronal magnetic field data, and the time evolution of the internal coronal structures as well as the evolution of the non-potentiality in active regions can be revealed [82, 83]. The deduced quantitative measures of the coronal magnetic fields from the numerical analysis, such as electric current density, force-free factor, and magnetic energy density, can be utilized in the solar flare forecasting and for establishing the solar flare prediction model. Through the numerical analysis of the time series magnetic fields in active regions, it is expected to predict location, class, and timing of flares.
4.3.2. Forecast of the Onset of Solar Eruptions
Violent solar eruptions frequently happen in the magnetic interfaces among different topology of independent flux system, named solar magnetic synoptic meteorology by Wang and Li [84]. Circular flares, jets, and remote brightening are related to some dome-like fan feature with an outer spine [85–91]. A CME along a non-radial direction can be related to a coronal null topology inclined over loops [92]. Catastrophic changes of magnetic topology, e.g., magnetic reconnection, are often associated with fast CMEs and large flares [93]. It has been shown that magnetic topology can determine the internal characters of CME and flare shape [5, 94]. Once the null points are found in the extrapolated 3D magnetic fields of an active region, the related magnetic topology, including null point, fan, spine, separator and separatrix surface, can be figured out. Usually the evolution of magnetic field in the solar photosphere are relatively slow. It is possible to predict the initial clue of eruption by monitoring the related local activity in the upper solar atmosphere based on the 3D magnetic topology skeleton analysis of solar active regions. In space weather forecasting, it is very important to know whether a large flare is confined or eruptive. By investigating magnetic conditions of the eruptive and confined flares in active regions, we found that eruptive flares with high-speed CMEs tend to take place in active regions with more free energy and larger decay index [95].
We also investigated the properties of super active regions (SARs), which is often recognized to represent the most significant characteristics of solar activity in each solar cycle. About more than 40% of all the major flares are produced by fewer than 0.5% of ARs. Chen et al. [96] selected 45 SARs in cycles 21–23 according to the following four criteria, i.e., maximum sunspot area, soft X-ray flare index, the 10.7 cm radio peak flux, and short-term total solar irradiance decrease. Chen and Wang [97] studied the vector magnetic field properties of 14 SARs and eight large but inactive ARs, which were called fallow ARs (FARs), in cycles 22 and 23. It revealed that SARs and FARs had significantly different vector magnetic field properties. Most of the SARs had a higher net magnetic flux, a higher total free magnetic energy density in the photosphere, a longer neutral line with a steeper horizontal gradient of the LOS magnetic field, and a larger area with strong magnetic shear. Based on these four characteristics, they put forward a composite vector magnetic field index. It showed that most of the SARs had higher magnetic indices. The authors also found a clear relationship between the flare index and the magnetic field index for SARs [98].
5. Conclusions
ASO-S is a small-satellite mission which will be launched around 2022. It will be the first solar space mission in China. To make contribution on the space weather forecasts to the community, we have made a dedicated operational objective for ASO-S, that is, to observe solar eruptions and the evolution of magnetic fields, and provide data for different prediction centers to make space weather forecasts. We have established a working group in China and have made detailed working plans on the space weather products of solar eruption nowcast which consists of integrated image viewers of ASO-S data products and various catalogs of solar features; prediction tools of CME arrivals; solar eruption forecasts including the flare forecasts and eruption onset forecasts. The products of the solar eruption forecasts are still on the way to be operational. This paper basically summarize the space weather products that will probably be used by ASO-S, the data supports to these products. Our next step is to test the proposed space weather products for ASO-S with simulated data of FMG, LST, and HXI. We are also working on further space weather potentials with ASO-S, and we welcome the involvement of other contributions from the solar and heliophysical communities.
Author Contributions
AC, YC, XD, JG, HH, XH, HuiL, LL, QS, JW, and QZ contributed materials to the manuscript. LF wrote and compiled the manuscript. WG, SL, HW, LX, WZ, YZ, and LF organized the working group of the space weather with ASO-S. The other authors contributed presentations or discussions in the regular space weather workshops which form part of the content of the manuscript.
Funding
This work was supported by CAS Strategic Pioneer Program on Space Science, Grant No. XDA15052200, XDA15320103, and XDA15320301, NSFC grants U1731241, 11921003, and 11973012, the mobility grant of Sino-German Science Center M-0068, National key research and development program 2018YFA0404202, and the Youth Innovation Promotion Association, CAS.
Conflict of Interest
The authors declare that the research was conducted in the absence of any commercial or financial relationships that could be construed as a potential conflict of interest.
References
1. Barnes G, Leka KD, Schrijver CJ, Colak T, Qahwaji R, Ashamari OW, et al. A comparison of flare forecasting methods. I. Results from the “All-Clear” workshop. Astrophys J.(2016) 829:89. doi: 10.3847/0004-637X/829/2/89
2. Leka KD, Park SH, Kusano K, Andries J, Barnes G, Bingham S, et al. A comparison of flare forecasting methods. II. Benchmarks, metrics, and performance results for operational solar flare forecasting systems. Astrophys J Suppl.(2019) 243:36. doi: 10.3847/1538-4365/ab2e12
3. Leka KD, Park SH, Kusano K, Andries J, Barnes G, Bingham S, et al. A comparison of flare forecasting methods. III. Systematic behaviors of operational solar flare forecasting systems. Astrophys J.(2019) 881:101. doi: 10.3847/1538-4357/ab2e11
4. Wang H, Yan Y, Sakurai T. Topology of magnetic field and coronal heating in solar active regions. Solar Phys.(2001) 201:323–36. doi: 10.1023/A:1017570613127
5. Guo J, Wang H, Wang J, Zhu X, Dai X, Huang X, et al. The role of a magnetic topology skeleton in a solar active region. Astrophys J.(2019) 874:181. doi: 10.3847/1538-4357/ab0aed
6. Fu HS, Vaivads A, Khotyaintsev YV, Olshevsky V, André M, Cao JB, et al. How to find magnetic nulls and reconstruct field topology with MMS data? J Geophys Res. (2015) 120:3758–82. doi: 10.1002/2015JA021082
7. Fu HS, Vaivads A, Khotyaintsev YV, André M, Cao JB, Olshevsky V, et al. Intermittent energy dissipation by turbulent reconnection. Geophys Res Lett.(2017) 44:37–43. doi: 10.1002/2016GL071787
8. Kliem B, Lin J, Forbes TG, Priest ER, Török T. Catastrophe versus instability for the eruption of a toroidal solar magnetic flux rope. Astrophys J.(2014) 789:46. doi: 10.1088/0004-637X/789/1/46
9. Liu R, Kliem B, Titov VS, Chen J, Wang Y, Wang H, et al. Structure, stability, and evolution of magnetic flux ropes from the perspective of magnetic twist. Astrophys J.(2016) 818:148. doi: 10.3847/0004-637X/818/2/148
10. Gan W, Zhu C, Deng Y, Li H, Su Y, Zhang H, et al. Advanced space-based solar observatory (ASO-S): an overview. Res Astron Astrophys. (2019) 19:156. doi: 10.1088/1674-4527/19/11/155
11. Deng YY, Zhang HY, Yang JF, Li F, Lin JB, Hou JF, et al. Design of the full-disk magnetoGraph (FMG) onboard the ASO-S. Res Astron Astrophys. (2019) 19:157. doi: 10.1088/1674-4527/19/11/157
12. Su JT, Bai XY, Chen J, Guo JJ, Liu S, Wang XF, et al. Data reduction and calibration of the FMG onboard ASO-S. Res Astron Astrophys. (2019) 19:161. doi: 10.1088/1674-4527/19/11/161
13. Li H, Chen B, Feng L, Li Y, Huang Y, Li J, et al. The lyman-alpha solar telescope (LST) for the ASO-S mission I. Scientific objectives and overview. Res Astron Astrophys. (2019) 19:158. doi: 10.1088/1674-4527/19/11/158
14. Chen B, Li H, Song K, Guo G, Zhang PJ, He L, et al. The lyman-alpha solar telescope (LST) for the ASO-S mission. II. Design of the payload. Res Astron Astrophys. (2019) 19:159. doi: 10.1088/1674-4527/19/11/159
15. Feng L, Li H, Chen B, Li Y, Susino R, Huang Y, et al. The lyman-alpha solar telescope (LST) for the ASO-S mission III. Data and potential diagnostics. Res Astron Astrophys. (2019) 19:162. doi: 10.1088/1674-4527/19/11/162
16. Zhang Z, Chen DY, Wu J, Chang J, Hu YM, Su Y, et al. Hard X-ray imager (HXI) onboard the ASO-S mission. Res Astron Astrophys. (2019) 19:160. doi: 10.1088/1674-4527/19/11/160
17. Su Y, Liu W, Li YP, Zhang Z, Gordon HJ, Chen W, et al. Simulations and software development for the Hard X-ray Imager onboard ASO-S. Res Astron Astrophys. (2019) 19:163. doi: 10.1088/1674-4527/19/11/163
18. Huang Y, Li H, Gan WQ, Li YP, Su JT, Deng YY, et al. The science operations and data center (SODC) of the ASO-S mission. Res Astron Astrophys. (2019) 19:164. doi: 10.1088/1674-4527/19/11/164
19. Wang PY, Zhang Y, Feng L, Pan YY, Gan Y, Lu L, et al. A new tool for automatic detection and tracking of coronal mass ejections with machine learning technique. Astrophys J Suppl.(2019) 244:9. doi: 10.3847/1538-4365/ab340c
20. Martens PCH, Attrill GDR, Davey AR, Engell A, Farid S, Grigis PC, et al. Computer vision for the solar dynamics observatory (SDO). Solar Phys.(2012) 275:79–113. doi: 10.1007/978-1-4614-3673-7_6
21. He H, Wang H, Du Z, Li R, Cui Y, Zhang L, et al. Solar activity prediction studies and services in NAOC. Adv Space Res. (2008) 42:1450–6. doi: 10.1016/j.asr.2007.02.068
22. He H, Wang H, Du Z, Zhang L, Huang X, Yan Y, et al. Recent progress of solar weather forecasting at NAOC. In: Bhardwaj A, Yau A, editors. Advances in Geosciences: Volume 30: Planetary Science (PS) and Solar & Terrestrial Science (ST). Singapore: World Scientific (2012). p. 117–26.
23. He H, Wang H, Du Z, Huang X, Yan Y, Dai X, et al. A brief history of Regional Warning Center China (RWC-China). Hist Geo Space Sci. (2018) 9:41–7. doi: 10.5194/hgss-9-41-2018
24. Song Q, Zhang J, Yang SH, Liu Y. Flares and magnetic non-potentiality of NOAA AR 11158. Res Astron Astrophys. (2013) 13:226–38. doi: 10.1088/1674-4527/13/2/009
25. Song Q, Wang JS, Feng X, Zhang X. Dark post-flare loops observed by the solar dynamics observatory. Astrophys J.. (2016) 821:83. doi: 10.3847/0004-637X/821/2/83
26. Song Q, Wang JS, Feng XS, Zhang XX. The design of solar synoptic chart for space weather forecast. In: Kosovichev AG, Hawley SL, Heinzel P, editors. Solar and Stellar Flares and their Effects on Planets. vol. 320 of IAU Symposium. (2016). p. 324–9. doi: 10.1017/S174392131600017X
27. Fang Y, Cui Y, Ao X. Deep learning for automatic recognition of magnetic type in sunspot groups. Adv Astron. (2019) 2019:9196234. doi: 10.1155/2019/9196234
28. Li L, Cui Y, Lei L, Liu S. Automatic detection of sunspots and extraction of sunspot characteristic parameters. Chin J Space Sci. (accepted).
29. Wang J, Ao X, Wang Y, Wang C, Cai Y, Luo B, et al. An operational solar wind prediction system transitioning fundamental science to operations. J Space Weather Space Clim. (2018) 8:A39. doi: 10.1051/swsc/2018025
30. Liu S. Operational space weather services in national space science center of Chinese Academy of Sciences. Space Weather. (2015) 13:599–605. doi: 10.1002/2015SW001298
31. Sheeley N Jr, Walters J, Wang YM, Howard R. Continuous tracking of coronal outflows: two kinds of coronal mass ejections. J Geophys Res Space Phys. (1999) 104:24739–67. doi: 10.1029/1999JA900308
32. Davis CJ, Davies J, Lockwood M, Rouillard A, Eyles C, Harrison R. Stereoscopic imaging of an Earth-impacting solar coronal mass ejection: a major milestone for the STEREO mission. Geophys Res Lett. (2009) 36:L08102. doi: 10.1029/2009GL038021
33. Duda RO, Hart PE. Use of the Hough Transformation to Detect Lines and Curves in Pictures. Communications of the ACM. (1972) 15:11–15.
34. Hao Q, Fang C, Chen PF. Developing an advanced automated method for solar filament recognition and its scientific application to a solar cycle of MLSO Hα data. Solar Phys.(2013) 286:385–404. doi: 10.1007/s11207-013-0285-9
35. Hao Q, Fang C, Cao W, Chen PF. Statistical analysis of filament features based on the Hα solar images from 1988 to 2013 by computer automated detection method. Astrophys J Suppl.(2015) 221:33. doi: 10.1088/0067-0049/221/2/33
36. Wang Y, Cao H, Chen J, Zhang T, Yu S, Zheng H, et al. Solar limb prominence catcher and tracker (SLIPCAT): an automated system and its preliminary statistical results. Astrophys J.(2010) 717:973–86. doi: 10.1088/0004-637X/717/2/973
37. Schatten KH, Wilcox JM, Ness NF. A model of interplanetary and coronal magnetic fields. Solar Phys. (1969) 6:442–55. doi: 10.1007/BF00146478
38. Hakamada K. A simple method to compute spherical harmonic coefficients for the potential model of the coronal magnetic field. Solar Phys. (1995) 159:89–96. doi: 10.1007/BF00733033
39. Harvey J, Hill F, Hubbard R, Kennedy J, Leibacher J, Pintar J, et al. The global oscillation network group (GONG) project. Science. (1996) 272:1284–6. doi: 10.1126/science.272.5266.1284
40. Wang YM, Sheeley N Jr. Solar wind speed and coronal flux-tube expansion. Astrophys J. (1990) 355:726–32. doi: 10.1086/168805
41. Wang YM, Sheeley N Jr. Why fast solar wind originates from slowly expanding coronal flux tubes. Astrophys J. (1991) 372:L45–8. doi: 10.1086/186020
42. Arge C, Pizzo V. Improvement in the prediction of solar wind conditions using near-real time solar magnetic field updates. J Geophys Res Space Phys. (2000) 105:10465–79. doi: 10.1029/1999JA000262
43. Arge C, Luhmann J, Odstrcil D, Schrijver C, Li Y. Stream structure and coronal sources of the solar wind during the May 12th, 1997 CME. J Atmospher Solar-Terrestr Phys. (2004) 66:1295–309. doi: 10.1016/j.jastp.2004.03.018
44. Fry C, Sun W, Deehr C, Dryer M, Smith Z, Akasofu SI, et al. Improvements to the HAF solar wind model for space weather predictions. J Geophys Res Space Phys. (2001) 106:20985–1001. doi: 10.1029/2000JA000220
45. Fry C, Dryer M, Smith Z, Sun W, Deehr C, Akasofu SI. Forecasting solar wind structures and shock arrival times using an ensemble of models. J Geophys Res Space Phys. (2003) 108:1070. doi: 10.1029/2002JA009474
46. Howard T. Space Weather and Coronal Mass Ejections. Berlin: Springer-Verlag (2014). doi: 10.1007/978-1-4614-7975-8
47. Feng L, Inhester B, Mierla M. Comparisons of CME morphological characteristics derived from five 3D reconstruction methods. Solar Phys.(2013) 282:221–38. doi: 10.1007/s11207-012-0143-1
48. Xue X, Wang C, Dou X. An ice-cream cone model for coronal mass ejections. J Geophys Res Space Phys. (2005) 110:A08103. doi: 10.1029/2004JA010698
49. Thernisien A, Vourlidas A, Howard RA. Forward modeling of coronal mass ejections using STEREO/SECCHI data. Solar Phys.(2009) 256:111–30. doi: 10.1007/s11207-009-9346-5
50. Feng L, Inhester B, Wei Y, Gan WQ, Zhang TL, Wang MY. Morphological evolution of a three-dimensional coronal mass ejection cloud reconstructed from three viewpoints. Astrophys J.. (2012) 751:18. doi: 10.1088/0004-637X/751/1/18
51. Moran TG, Davila JM. Three-dimensional polarimetric imaging of coronal mass ejections. Science. (2004) 305:66–71. doi: 10.1126/science.1098937
52. Mierla M, Inhester B, Marqué C, Rodriguez L, Gissot S, Zhukov AN, et al. On 3D reconstruction of coronal mass ejections: I. Method description and application to SECCHI-COR data. Solar Phys.(2009) 259:123–41. doi: 10.1007/s11207-009-9416-8
53. Feng L, Li H, Inhester B, Chen B, Ying BL, Lu L, et al. On the error analyses of polarization measurements of the white-light coronagraph aboard ASO-S. Res Astron Astrophys. (2019) 19:59. doi: 10.1088/1674-4527/19/4/59
54. Lu L, Inhester B, Feng L, Liu S, Zhao X. Measure the propagation of a Halo CME and its driven shock with the observations from a single perspective at earth. Astrophys J.(2017) 835:188. doi: 10.3847/1538-4357/835/2/188
55. Dai X, Wang H, Huang X, Du Z, He H. The classification of ambiguity in polarimetric reconstruction of coronal mass ejection. Astrophys J.(2014) 780:141. doi: 10.1088/0004-637X/780/2/141
56. Dai X, Wang H, Huang X, Du Z, He H. An improvement on mass calculations of solar coronal mass ejections via polarimetric reconstruction. Astrophys J.(2015) 801:39. doi: 10.1088/0004-637X/801/1/39
57. Tóth G, Sokolov IV, Gombosi TI, Chesney DR, Clauer CR, de Zeeuw DL, et al. Space weather modeling framework: a new tool for the space science community. J Geophys Res. (2005) 110:A12226. doi: 10.1029/2005JA011126
58. Tóth G, van der Holst B, Sokolov IV, De Zeeuw DL, Gombosi TI, Fang F, et al. Adaptive numerical algorithms in space weather modeling. J Comput Phys. (2012) 231:870–903. doi: 10.1016/j.jcp.2011.02.006
59. Powell KG, Roe PL, Linde TJ, Gombosi TI, De Zeeuw DL. A solution-adaptive upwind scheme for ideal magnetohydrodynamics. J Comput Phys. (1999) 154:284–309. doi: 10.1006/jcph.1999.6299
60. Jin M, Manchester WB, van der Holst B, Sokolov I, Tóth G, Vourlidas A, et al. Chromosphere to 1 AU simulation of the 2011 march 7th event: a comprehensive study of coronal mass ejection propagation. Astrophys J.(2017) 834:172. doi: 10.3847/1538-4357/834/2/172
61. Chiu MC, von-Mehlem UI, Willey CE, Betenbaugh TM, Maynard JJ, Krein JA, et al. ACE spacecraft. Space Sci Rev.(1998) 86:257–84. doi: 10.1007/978-94-011-4762-0_13
62. McIntosh PS. The classification of sunspot groups. Solar Phys.(1990) 125:251–67. doi: 10.1007/BF00158405
63. Georgoulis MK, Rust DM. Quantitative forecasting of major solar flares. Astrophys J Lett.(2007) 661:L109–12. doi: 10.1086/518718
64. Falconer DA. A prospective method for predicting coronal mass ejections from vector magnetograms. J Geophys Res.(2001) 106:25185–90. doi: 10.1029/2000JA004005
65. Cui Y, Li R, Zhang L, He Y, Wang H. Correlation between solar flare productivity and photospheric magnetic field properties. 1. Maximum horizontal gradient, length of neutral line, number of singular points. Solar Phys.(2006) 237:45–59. doi: 10.1007/s11207-006-0077-6
66. Schrijver CJ. A characteristic magnetic field pattern associated with all major solar flares and its use in flare forecasting. Astrophys J Lett.(2007) 655:L117–20. doi: 10.1086/511857
67. Leka KD, Barnes G. Photospheric magnetic field properties of flaring versus flare-quiet active regions. II. Discriminant analysis. Astrophys J.(2003) 595:1296–306. doi: 10.1086/377512
68. Park Sh, Chae J, Wang H. Productivity of solar flares and magnetic helicity injection in active regions. Astrophys J.(2010) 718:43–51. doi: 10.1088/0004-637X/718/1/43
69. McAteer RTJ, Gallagher PT, Ireland J. Statistics of active region complexity: a large-scale fractal dimension survey. Astrophys J.(2005) 631:628–35. doi: 10.1086/432412
70. Huang X, Wang HN. Solar flare prediction using highly stressed longitudinal magnetic field parameters. Res Astron Astrophys. (2013) 13:351–8. doi: 10.1088/1674-4527/13/3/010
71. Mason JP, Hoeksema JT. Testing automated solar flare forecasting with 13 years of michelson doppler imager magnetograms. Astrophys J.(2010) 723:634–40. doi: 10.1088/0004-637X/723/1/634
72. Li R, Zhu J. Solar flare forecasting based on sequential sunspot data. Res Astron Astrophys. (2013) 13:1118–26. doi: 10.1088/1674-4527/13/9/010
73. Yu D, Huang X, Wang H, Cui Y. Short-term solar flare prediction using a sequential supervised learning method. Solar Phys.(2009) 255:91–105. doi: 10.1007/s11207-009-9318-9
74. Liu C, Deng N, Wang JTL, Wang H. Predicting solar flares using SDO/HMI vector magnetic data products and the random forest algorithm. Astrophys J.(2017) 843:104. doi: 10.3847/1538-4357/aa789b
75. Yu D, Huang X, Wang H, Cui Y, Hu Q, Zhou R. Short-term solar flare level prediction using a Bayesian network approach. Astrophys J.(2010) 710:869–77. doi: 10.1088/0004-637X/710/1/869
76. Huang X, Wang H, Xu L, Liu J, Li R, Dai X. Deep learning based solar flare forecasting model. I. Results for line-of-sight magnetograms. Astrophys J.(2018) 856:7. doi: 10.3847/1538-4357/aaae00
77. Nishizuka N, Sugiura K, Kubo Y, Den M, Ishii M. Deep flare net (DeFN) model for solar flare prediction. Astrophys J.(2018) 858:113. doi: 10.3847/1538-4357/aab9a7
78. Domijan K, Bloomfield DS, Pitié F. Solar flare forecasting from magnetic feature properties generated by the solar monitor active region tracker. Solar Phys. (2019) 294:6. doi: 10.1007/s11207-018-1392-4
79. Liu H, Liu C, Wang JTL, Wang H. Predicting solar flares using a long short-term memory network. Astrophys J.(2019) 877:121. doi: 10.3847/1538-4357/ab1b3c
80. Yan Y, Li Z. Direct boundary integral formulation for solar non-constant-α force-free magnetic fields. Astrophys J. (2006) 638:1162–8. doi: 10.1086/499064
81. He H, Wang H. Nonlinear force-free coronal magnetic field extrapolation scheme based on the direct boundary integral formulation. J Geophys Res Space Phys. (2008) 113:A05S90. doi: 10.1029/2007JA012441
82. He H, Wang H, Yan Y. Nonlinear force-free field extrapolation of the coronal magnetic field using the data obtained by the Hinode satellite. J Geophys Res Space Phys. (2011) 116:A01101. doi: 10.1029/2010JA015610
83. He H, Wang H, Yan Y, Chen PF, Fang C. Variations of the 3-D coronal magnetic field associated with the X3.4-class solar flare event of AR 10930. J Geophys Res Space Phys. (2014) 119:3286–315. doi: 10.1002/2013JA019157
84. Wang J, Li W. Vector magnetic fields in the base of filaments and the filament environment. In: Webb DF, Schmieder B, Rust DM, editors. IAU Colloq. 167: New Perspectives on Solar Prominences. vol. 150 of Astronomical Society of the Pacific Conference Series. Aussois (1998). p. 98. doi: 10.1017/S0252921100047370
85. Zhang QM, Chen PF, Guo Y, Fang C, Ding MD. Two types of magnetic reconnection in coronal bright points and the corresponding magnetic configuration. Astrophys J.(2012) 746:19. doi: 10.1088/0004-637X/746/1/19
86. Galsgaard K, Madjarska MS, Moreno-Insertis F, Huang Z, Wiegelmann T. Magnetic topological analysis of coronal bright points. Astron Astrophys.(2017) 606:A46. doi: 10.1051/0004-6361/201731041
87. Masson S, Pariat E, Aulanier G, Schrijver CJ. The nature of flare ribbons in coronal null-point topology. Astrophys J.(2009) 700:559–78. doi: 10.1088/0004-637X/700/1/559
88. Hao Q, Yang K, Cheng X, Guo Y, Fang C, Ding MD, et al. A circular white-light flare with impulsive and gradual white-light kernels. Nat Commun. (2017) 8:2202. doi: 10.1038/s41467-017-02343-0
89. Romano P, Falco M, Guglielmino SL, Murabito M. Observation of a 3D magnetic null point. Astrophys J.(2017) 837:173. doi: 10.3847/1538-4357/aa63f4
90. Xu Z, Yang K, Guo Y, Zhao J, Zhao ZJ, Kashapova L. Homologous circular-ribbon flares driven by twisted flux emergence. Astrophys J.(2017) 851:30. doi: 10.3847/1538-4357/aa9995
91. Wang H, Liu C. Circular ribbon flares and homologous jets. Astrophys J.(2012) 760:101. doi: 10.1088/0004-637X/760/2/101
92. Sun X, Hoeksema JT, Liu Y, Chen Q, Hayashi K. A non-radial eruption in a quadrupolar magnetic configuration with a coronal null. Astrophys J.(2012) 757:149. doi: 10.1088/0004-637X/757/2/149
93. Zhao H, Wang JX, Zhang J, Xiao CJ, Wang HM. Determination of the topology skeleton of magnetic fields in a solar active region. Chin J Astron Astrophys.(2008) 8:133–45. doi: 10.1088/1009-9271/8/2/01
94. Wang H, Yan Y, He H, Huang X, Dai X, Zhu X, et al. Numerical short-term solar activity forecasting. In: Foullon C, Malandraki OE, editors. Space Weather of the Heliosphere: Processes and Forecasts. vol. 335 of IAU Symposium. (2018). p. 243–9. doi: 10.1017/S1743921318000534
95. Cui Y, Wang H, Xu Y, Liu S. Statistical study of magnetic topology for eruptive and confined solar flares. J Geophys Res. (2018) 123:1704–14. doi: 10.1002/2017JA024710
96. Chen AQ, Wang JX, Li JW, Feynman J, Zhang J. Statistical properties of superactive regions during solar cycles 19-23. Astron Astrophys.(2011) 534:A47. doi: 10.1051/0004-6361/201116790
97. Chen AQ, Wang JX. Quantifying solar superactive regions with vector magnetic field observations. Astron Astrophys.(2012) 543:A49. doi: 10.1051/0004-6361/201118037
Keywords: Sun: solar-terrestrial relations, Sun: magnetic fields, Sun: coronal mass ejections (CMEs), Sun: flares, Sun: filaments, Sun: prominences, Sun: solar wind
Citation: Feng L, Gan W, Liu S, Wang H, Li H, Xu L, Zong W, Zhang X, Zhu Y, Wu H, Chen A, Cui Y, Dai X, Guo J, He H, Huang X, Lu L, Song Q, Wang J, Zhong Q, Chen L, Du Z, Guo X, Huang Y, Li H, Li Y, Xiong S, Yang S and Ying B (2020) Space Weather Related to Solar Eruptions With the ASO-S Mission. Front. Phys. 8:45. doi: 10.3389/fphy.2020.00045
Received: 07 November 2019; Accepted: 19 February 2020;
Published: 11 March 2020.
Edited by:
Nat Gopalswamy, Goddard Space Flight Center, National Aeronautics and Space Administration, United StatesReviewed by:
Arnaud Masson, European Space Astronomy Centre (ESAC), SpainHuishan Fu, Beihang University, China
Copyright © 2020 Feng, Gan, Liu, Wang, Li, Xu, Zong, Zhang, Zhu, Wu, Chen, Cui, Dai, Guo, He, Huang, Lu, Song, Wang, Zhong, Chen, Du, Guo, Huang, Li, Li, Xiong, Yang and Ying. This is an open-access article distributed under the terms of the Creative Commons Attribution License (CC BY). The use, distribution or reproduction in other forums is permitted, provided the original author(s) and the copyright owner(s) are credited and that the original publication in this journal is cited, in accordance with accepted academic practice. No use, distribution or reproduction is permitted which does not comply with these terms.
*Correspondence: Li Feng, bGZlbmdAcG1vLmFjLmNu