 Vishwas Kukreti
 Hirdesh K. Pharasi
 Priya Gupta
 Sunil Kumar
- 1School of Computational and Integrative Sciences, Jawaharlal Nehru University, New Delhi, India
- 2Instituto de Ciencias Fisicas, Universidad Nacional Autónoma de México, Cuernavaca, Mexico
- 3Atal Bihari Vajpayee School of Management & Entrepreneurship, Jawaharlal Nehru University, New Delhi, India
- 4Department of Physics, Ramjas College, University of Delhi, New Delhi, India
In this mini-review, we critically examine the recent work done on correlation-based networks in financial systems. The structure of empirical correlation matrices constructed from the financial market data changes as the individual stock prices fluctuate with time, showing interesting evolutionary patterns, especially during critical events such as market crashes, bubbles, etc. We show that the study of correlation-based networks and their evolution with time is useful for extracting important information of the underlying market dynamics. Also, we present our perspective on the use of recently-developed entropy measures, such as structural entropy and eigen-entropy, for continuous monitoring of correlation-based networks.
1. Introduction
Network science [1–4] has emerged as an important tool for studying different complex phenomena– spread of infectious diseases [5, 6], economic production [7], construction of robust sustainable infrastructure and technological networks [8], processing human information [9], innovation diffusion [10], detection of financial crashes [11–13], etc. In this mini-review, we focus on the role of network science in understanding complex financial markets. Our aims are two-fold: (i) To uncover the structure of the complex interactions among stocks at a particular period of time (static picture) through correlation-based networks, where the nodes represent the stocks in the financial market, and the links represent the interaction strengths of co-movements of stocks (as measured by correlations). For this purpose, one starts with computing the cross-correlations among stock price returns and then constructs any of the correlation-based networks– Minimum Spanning Tree (MST) [14, 15], Threshold Network [16], Planar Maximally Filtered Graph (PMFG) [17], etc. Using these networks, one can identify stocks (or sectors) that are in the “core” or “periphery” [18], as well as study their hierarchy/importance of the different stocks driving the market fluctuations. The correlations among stocks change with time, and the underlying dynamics of the market produces very intriguing and correlation structures. Temporal networks are those networks in which links are time dependent [19] and are useful for studying systems in which connections change or evolve with time. Correlation-based networks in the stock market are therefore temporal networks, because their links (constructed from correlation values) change or evolve with time. The understanding of the stock market dynamics can be very important for practical applications like portfolio optimization, risk management, etc. (ii) To continuously monitor (dynamic picture) the health and fragility of the financial market. The market index, which is a weighted arithmetic mean of the prices of selected stocks in the market, reflects the performance of the market and assists agents in comparing the current price levels relative to past prices. The daily index return is the difference of the logarithmic values of the index (at market closure) over a period of 1 day. Thus, for the purpose of continuous monitoring of the financial market, we study the temporal evolution of the market index returns along with two entropy measures, structural entropy [20] and eigen-entropy [21]. This becomes very useful and necessary for measuring the systemic risk, market regulation and predicting downturns or crashes [22], since there often exist sizable fluctuations during crashes and bubbles.
2. Correlation-Based Networks
Mantegna first studied the hierarchical structures of correlation-based networks in financial markets [14, 15]. Later, similar studies of correlation-based networks were made (see, e.g., [23–25]). These correlation-based networks provided easy visual representations of multivariate time series and extracted meaningful information about the complex market dynamics. The analysis of evolution of correlation-based networks provides an understanding of the underlying market trends, especially during periods of crisis [16]. For the construction of a correlation-based network to represent N stocks in a financial market in a time-epoch ending on date τ, one begins with the correlation matrix, C(τ), and uses a transformation to construct a distance matrix, (for mathematical details, see Supplementary Material).
2.1. Minimum Spanning Tree
MST is constructed by using the distances dij's, which represent the interaction strengths (correlations) between pairs of stocks i, j = 1, …, N in a market for a specific time window, such that all N nodes (stocks) are connected with exactly N − 1 edges under the constraint that total distance is minimum [25–27]. Algorithms due to Kruskal or Prim are generally utilized to obtain MST from a distance matrix. For a non-degenerate distance matrix, the MST is uniquely determined. Two of the main advantages of MST are that: (i) it produces a network structure without putting any arbitrary threshold, and (ii) it has property of inherent hierarchical clustering. There have been many papers with applications of MST in equity markets [16, 18], currency exchange rates [28], global foreign exchange dynamics [29]. MST is useful for studying the taxonomy or the sector classification [30], with potential applications in portfolio optimization. Researchers have also carried out analysis of dynamical correlations using MST [24]. Among disadvantages, there is the fact that the order and classification of nodes in a cluster of MST is not robust, and often sensitive to minor changes in correlations or spurious correlations. Therefore, for improvement of results, either noise suppression techniques like Random Matrix Theory (RMT) [31] and power mapping [13] have been used, or alternative algorithms such as PMFG, Triangulated Maximally Filtered Graph, Average Linkage Minimum Spanning Tree, Directed Bubble Hierarchical Tree [17, 32–35] have been proposed. Instead of using pair-wise Pearson correlations, partial correlations and mutual information have also been explored in some studies [36, 37].
2.2. Threshold Networks
In this approach, an adjacency matrix is constructed by applying a threshold value in the correlation (Cij) or distance (dij) of the network. It filters out the strongest correlations (or shortest distances) by putting a certain value of threshold and discard the remaining correlations/distances. A high threshold value in the distance gives rise to a completely connected graph (one extreme), while decreasing value of threshold makes the connections less and less, until one gets a null network (at the other extreme). Thus, one can tune the threshold in order to get the desired strength of correlations. For a particular value of threshold, as correlation matrices change with time, the threshold networks also change (see Supplementary Material). One drawback of the threshold networks is that we do not get a spanning graph, and therefore, there is a “loss of information”; when we put a threshold value we discard some nodes and edges. Also, threshold networks are found to be very sensitive to the noise (random fluctuations).
2.3. Planar Maximally Filtered Graph
PMFG is a network drawn in a plane, such that there are no intersecting links [17, 38]. If N is total number of stocks, then it contains 3(N − 2) links. The PMFG has the advantage that it retains the structure of MST (which contains N − 1 links) and provides additional information about the connections [17, 32]. However, PMFG has a disadvantage that there exists a certain arbitrariness in its results, as there is an embedding of data from higher dimension to lower dimension with a zero genus [39]. Recently, PMFG and threshold network have been combined to produce PMFG-based threshold networks [40]. Threshold networks of the financial market are constructed over multi-scale and at multi-threshold [41].
3. Entropy Measures
As in other domains, entropy has also been used to understand the financial hazards as well as to construct an early warning indicator for predicting systematic risks [42, 43]. Maasoumi and Racine examined the predictability of the market returns using entropy measure and found that it is capable to detect the non-linear dependence within the time series of market returns as well as between returns and other prediction variables obtained from other models [44]. Recently, Ricci curvature and entropy have been used to construct an economic indicator for market fragility and systemic risk [45]. Very recently, Almog et al. presented a perspective on the use of entropy measures such as structural entropy [20], which is computed from the communities in correlation-based networks. Chakraborti et al. computed the eigen-entropy from the eigen-vector centrality of the stocks in the correlation-based network [21]. Below, we discuss the structural entropy [20] and eigen-entropy [21], and compare the two measures.
3.1. Structural Entropy
The concept of structural entropy has resolved the problem of choosing different period of crisis and extracting substantial information from the large network of stock market. The structural entropy measures the amount of heterogeneity of the network nodes with an assumption that more connected nodes share common attributes than others. The authors assume the nature of clusters to be independent sub-units of the network. The process of calculating the structural entropy involves two steps: (i) Calculation of an optimal partition function which places every node in a certain cluster using a community detection algorithm. (ii) Analysing the partition function and extracting the representative value of the diversity level (for mathematical details and schematic diagram, see Supplementary Material). The formula for Shannon's entropy is applied: , in terms of probability vector , where M is the number of communities and ci is the size of community i (proportional size of the community in the network).
Structural entropy S of the network provides a way to continuously monitor the state of the network. However, it is sensitive to the choice of community detection algorithm employed in detecting communities. This arbitrariness makes the calculation of entropy dependent on the choice of the user and hence is not unique.
3.2. Eigen-Entropy
Very recently, the concept of eigen-entropy was used in studying financial markets [21]. It is computed from eigen-centrality of the network obtained from the short time series correlation matrices [21, 46]. In order to capture the global feature of the network, every node is ranked by its eigen-centrality (for mathematical details and schematic diagram, see Supplementary Material). The similarity of the eigen-centralities (ranks) of the stocks is uniquely measured by eigen-entropy, defined as , where pi is the eigen-centrality of the i-th node (stock). Higher the similarity of the stock centralities, higher the eigen-entropy.
Empirical correlation matrix of the market may be decomposed in multiple ways. In many papers, it was decomposed into three separated modes, market mode CM, the group mode CG and the random mode CR. However, it is difficult (and somewhat arbitrary) to choose the range of eigenvalues corresponding to the group mode CG and the random mode CR, as the boundary is not often distinct. Another way to decompose is to consider the market mode CM (corresponding to the maximum eigenvalue) and the group-random modes CGR (rest of the eigenvalues), hence without any arbitrariness. CM&CGR is the preferable decomposition and corresponding eigen-entropy HM and HGR could be calculated as (matrix element-wise) and (matrix element-wise), respectively. The eigen-entropy computed using above method gives a simple yet robust measure to quantify the randomness of the financial market without using any arbitrary thresholds. Further, Chakraborti et al. [21] used the variables H − HM and H − HGR to construct a phase space, where the market epochs show phase separation and order-disorder transitions. These results are certainly of deep significance for the understanding of financial market behavior and designing strategies for risk management.
4. Empirical Analyses and Results
We have analyzed stock prices of the S&P500 USA market for the period of 1985-2016 (for details of data and methodology, see Supplementary Material), and made some plots of correlation-based networks as well as entropy measures, as presented below as well as in the Supplementary Material. In order to illustrate the usage and concepts of correlation-based networks and entropy measures, we have compared three correlation frames chosen arbitrarily from crash, bubble and normal periods of the market. It may be mentioned that during a market crash there is a sharp fall in the index return and all the stocks start behaving similarly; the whole market begins to act like a single huge cluster or community. During a bubble period, a particular sector gets overpriced or over-performs, causing accentuation of disparities among the various sectors or communities. In both the crash and bubble periods, there are sizable fluctuations (as mentioned earlier in the introduction) and consequently market volatility (see Supplementary Material for definition) is higher than the normal period. In the normal or business-as-usual period, there are several distinct sectors performing well, but the market volatility is low.
Figure 1 shows the analysis for three time-epoch of 40 days ending at: (first column) 23/07/1985, (second column) 08/01/2007, and (third column) 17/06/2010. Figures 1A–C show the heat-map of correlation matrices at three different periods. It shows the amount of correlation between N = 194 stocks of S&P 500 at different time periods: (Figure 1A) normal period (23/07/1985), when market behaves normally with low mean correlation between the stocks, (Figure 1B) bubble period (08/01/2007), when market experienced an upward drift in price in some sectors only and (Figure 1C) crash period (17/06/2010), when the market experienced huge recession. The corresponding MST's are shown in Figures 1D–F, which have been generated using the Prim's algorithm. Different colors in MST's correspond to different sectors in the market. The different market structures reflected in the correlation matrix are also visible in the correlation based Threshold Networks Figures 1G–I with threshold (dij ≤ 1) and PMFG's Figures 1J–L.
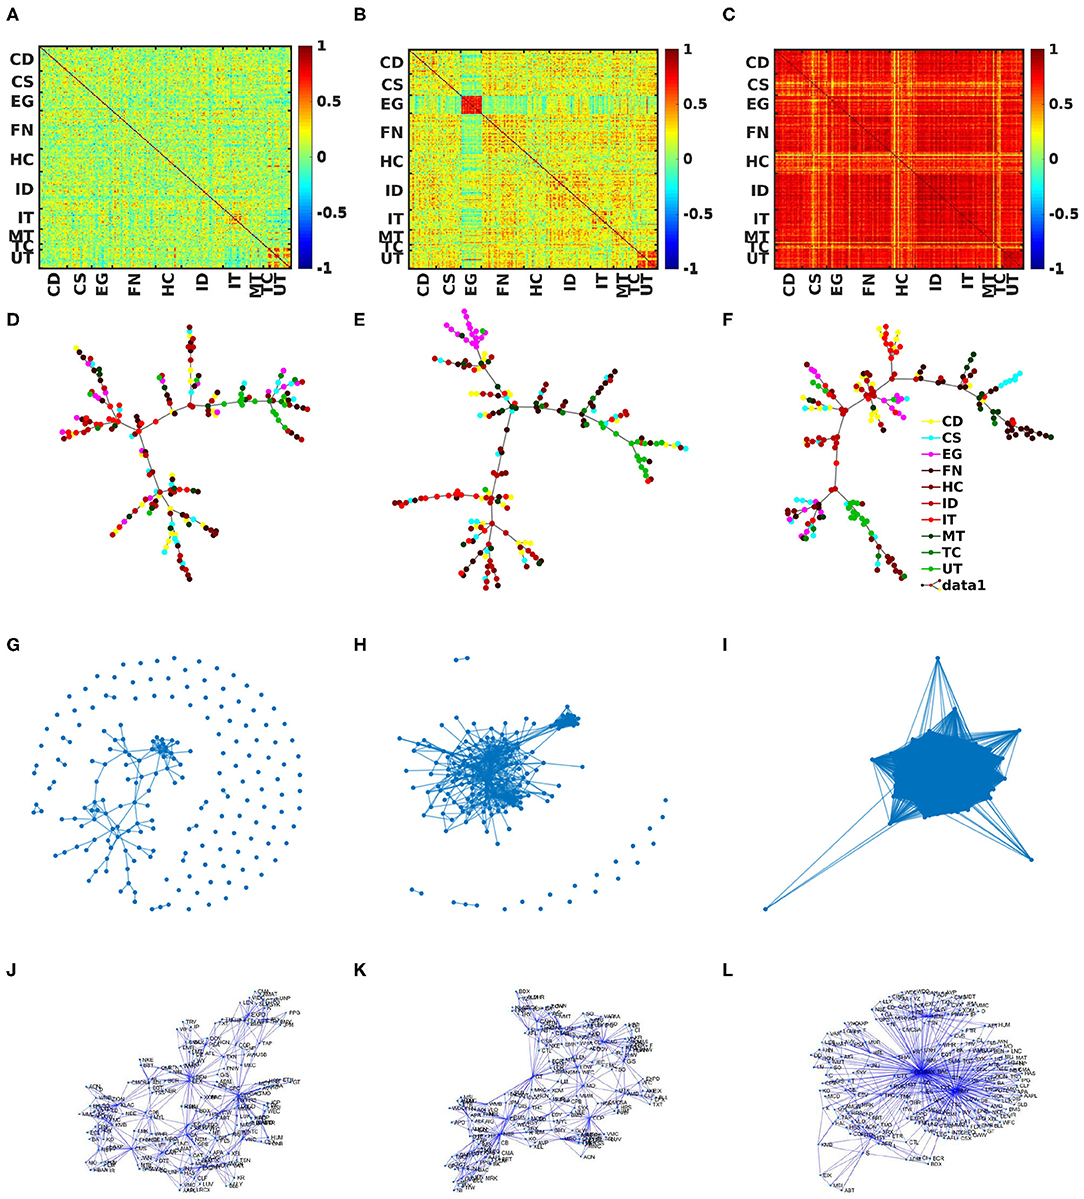
Figure 1. Static correlation-based networks: Analysis of S&P 500 market with 194 stocks (epoch of 40 days) for three different periods: first, second, and third columns are corresponding to 23/07/1985 (normal period), 08/01/2007 (bubble period), and 17/06/2010 (crash period), respectively. (A–C) are heat maps of correlation matrices of different periods. Minimum Spanning Trees are shown in (D–F). From (G–I), Threshold Networks at a particular value of threshold. Planar Maximally Filtered Graphs (J–L) for three different periods.
During the normal phase (Figures 1A,D,G,J) the market interactions are well-distributed across the stocks and the mean market correlations are not very high and the volatility is low (see Supplementary Material). During the bubble period (Figures 1B,E,H,K) certain sectors of stocks are more correlated with each other than the rest of stocks in the market. As visible in Figure 1H, few of the stocks are bunched together. This property is pronounced during times when a particular sector experiences a surge, e.g., during the dot-com bubble period, where the IT sector saw a boost but not the entire market. During the crashes (for the list, see Supplementary Material), the entire S&P market react in a similar way, which made the stocks in the market extremely correlated with each other (Figures 1C,F,I,L).
Figure 2 shows how the entropy measures may be used for continuous monitoring of the financial markets. Figures 2A–C show the evolution of S&P 500 market over a period of 1985 − 2016 for index returns r(τ), eigen-entropies H(τ), and structural entropy S(τ), respectively. Three vertical dashed line are corresponding to epochs ending at 23/07/1985, 08/01/2007, and 17/06/2010. We find that the Pearson correlation among the two measures S(τ) and H(τ) is −0.22, which indicates that the two measures are anti-correlated. The two entropy measures actually capture different aspects of the financial market.
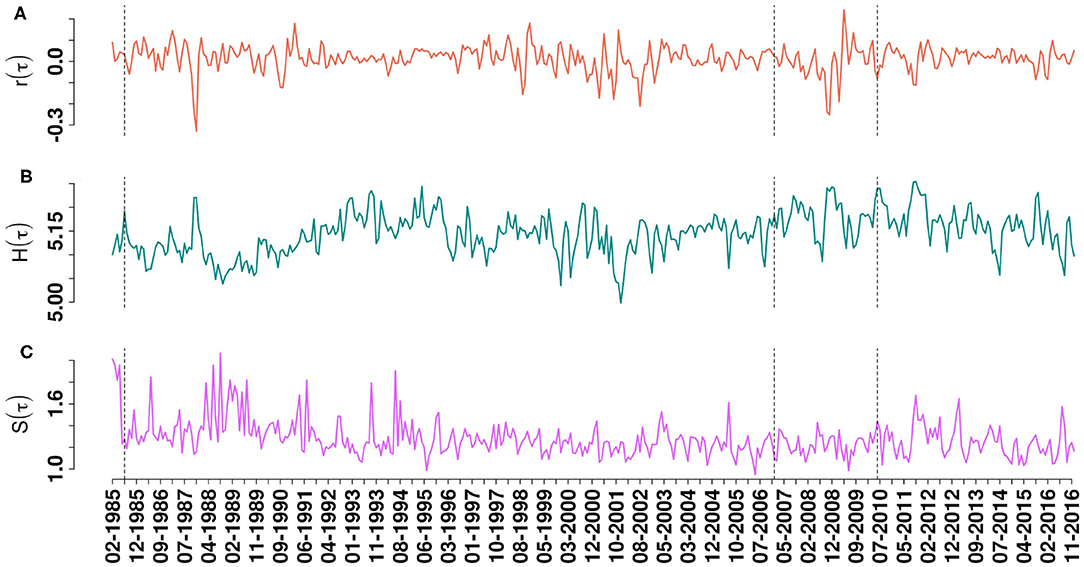
Figure 2. Continuous monitoring of S&P 500 market with 194 stocks and for a rolling time-epoch of 40 days and shift of 20 days over a period of 1985 − 2016: The logarithmic returns of S&P 500 index is shown in (A). (B) Shows the temporal evolution of a new measurement “eigen-entropy” H(τ), calculated from eigen-vector centralities of correlation matrices. Evolution of structural entropy S(τ) calculated by using community detection algorithm is shown in (C). The dashed vertical lines are corresponding to different periods (normal, bubble, and crash) whose static results are shown in Figure 1.
The structural entropy is based on the idea of “structural diversity” in a network, and it was proposed to utilize the number of communities in a system and their corresponding sizes. In a way, the structural entropy tries to capture the amount of heterogeneity of the nodes in the network, with the assumption that nodes which share common attributes belong to the same community [39, 47]. The structural entropy reaches maximum (ln N), when the community structure is heterogeneous– there are N communities of equal size (unity), i.e., each node is assigned to a different community; it reaches minimum (zero), when all the N nodes are assigned to a single community. During a market crash, the market is extremely correlated and all stocks behave in a similar way as if belonging to a single community. Hence, the structural entropy decreases significantly (see also figure in Supplementary Material).
The eigen-entropy measures how similar the eigen-centrality ranks of the stocks are. The eigen-entropy reaches its maximum value (ln N), when all the centralities are of similar value, i.e., all the individual nodes have similar rank/importance, such that the variance of the eigen-centralities becomes low. From the return time series point of view, this occurs when all of stock prices are entirely uncorrelated such that the market is totally disordered (or random)—indicative of the lack of any group or sectoral structures, or when the market is extremely correlated such that all the stocks behave in a similar way. During a market crash, the market is extremely correlated and all stocks behave in a similar way and so the eigen-entropy increases significantly.
5. Discussions and Concluding Remarks
In this review, we have discussed different methods for analysis of static and dynamic correlation-based networks of financial markets, and also studied how entropy measures can be used to identify normal, bubble, and crash periods. Specifically, we have compared the recently developed concepts of structural entropy and eigen-entropy.
It is noteworthy that financial networks are naturally “weighted,” as each link bears a numeric value representing the correlation between the nodes (stocks). In a recent paper [48], it has been shown how real weighted network with large link weights heterogeneity may lower robustness in case of nodes/links failure. It would be interesting to see how these methods could be used to increase the robustness in context of financial networks.
We have also seen that many of the correlation-based networks have shown clustering with communities of stocks. Thus, community detection in network science serves as an important technique for extraction of the clustering information from empirical correlation matrix of a multivariate time series. Several community detection algorithms have been proposed [39, 47, 49]. The problem is that different community detection algorithms yield different results for the same empirical correlation matrix. So, often domain knowledge is required to determine what is a sensible or meaningful community.
Further, we have seen that many of the networks are sensitive to noise or spurious correlations. Properties of random matrices [50] have turned out to be useful in reducing noise and thus understanding dynamics of complex systems [51]. An ensemble of random matrices, also known as stationary or standard random (Gaussian) matrix ensemble [50], introduced by Wigner [52, 53], have been applied to many studies in physics, biology, finance, etc. (see [54] and references therein). The probability distribution of eigenvalues of Wishart orthogonal ensemble (WOE) follows Marcenko-Pastur distribution [55]. The empirical correlation matrix of a complex system is normally compared with WOE [24, 31, 56]. It has been observed from eigenvalues statistics of empirical correlation matrices that the few largest eigenvalues show deviations from the Wishart ensemble. Note that Pearson cross-correlation assumes that the time series are stationary, which are valid for shorter lengths of time series. However, if the number of time series are greater than the lengths of time series, then corresponding empirical correlation matrices are noisy and highly singular. For such short time series, there is a great need of noise suppression in correlation matrix to extract actual correlations. There are different techniques for suppressing the noise in correlation matrix [57–59]. Notably, any empirical correlation matrix of financial market can be decomposed into partial correlations, consisting of market CM, group CG and random CR modes, respectively [60]. It enables us to identify the dominant stocks, sectors and inherent structures of the market. Recently, detailed analyses of the empirical correlation matrices using these approaches have been carried out to understand the complexity in dynamics of stock market [13, 51, 61]. It has been found that during the crisis, the eigenvalue spectrum behaves very differently from one corresponding to a normal period.
Finally, we must mention that the prediction of collapses of financial markets using traditional economic theories has been a disastrous failure. These new and alternate methods have the potential use of continuous monitoring and understanding of the complex structures and dynamics of financial markets. These are a few of the attempts physicists have made for generation of early warning signals for crisis, and these methods can be used for timely intervention.
Author Contributions
SK and HP designed the idea, wrote the main manuscript text, and prepared the figures. VK and PG contributed to the literature review. All authors reviewed the manuscript.
Conflict of Interest
The authors declare that the research was conducted in the absence of any commercial or financial relationships that could be construed as a potential conflict of interest.
Acknowledgments
The authors are grateful to Anirban Chakraborti, Hrishidev, Suchetana Sadhukhan, Kiran Sharma, and Thomas H. Seligman for their critical inputs. HP is grateful for financial support provided by UNAM-DGAPA and CONACYT Proyecto Fronteras 952. This research was supported in part by the International Centre for Theoretical Sciences (ICTS) during the visits of VK, PG, and SK for participating in the Summer research program on Dynamics of Complex Systems (Code: ICTS/Prog-DCS2019/07). The topic editors are acknowledged for supporting this open access publication.
Supplementary Material
The Supplementary Material for this article can be found online at: https://www.frontiersin.org/articles/10.3389/fphy.2020.00323/full#supplementary-material
References
1. Albert R, Barabási AL. Statistical mechanics of complex networks. Rev Modern Phys. (2002) 74:47. doi: 10.1103/RevModPhys.74.47
2. Boccaletti S, Latora V, Moreno Y, Chavez M, Hwang DU. Complex networks: structure and dynamics. Phys Rep. (2006) 424:175–308. doi: 10.1016/j.physrep.2005.10.009
3. Newman M. Networks: An Introduction. Oxford: Oxford University Press (2010). doi: 10.1093/acprof:oso/9780199206650.003.0001
5. Balcan D, Colizza V, Gonçalves B, Hu H, Ramasco JJ, Vespignani A. Multiscale mobility networks and the spatial spreading of infectious diseases. Proc Natl Acad Sci USA. (2009) 106:21484–9. doi: 10.1073/pnas.0906910106
6. Brockmann D, Helbing D. The hidden geometry of complex, network-driven contagion phenomena. Science. (2013) 342:1337–42. doi: 10.1126/science.1245200
7. Acemoglu D, Azar PD. Endogenous production networks. Econometrica. (2020) 88:33–82. doi: 10.3982/ECTA15899
8. Reis SD, Hu Y, Babino A, Andrade JS Jr, Canals S, Sigman M, et al. Avoiding catastrophic failure in correlated networks of networks. Nat Phys. (2014) 10:762–7. doi: 10.1038/nphys3081
9. Lynn CW, Papadopoulos L, Kahn AE, Bassett DS. Human information processing in complex networks. Nat Phys. (2020) 1–9. doi: 10.1038/s41567-020-0985-7
10. Acemoglu D, Akcigit U, Kerr WR. Innovation network. Proc Natl Acad Sci USA. (2016) 113:11483–8. doi: 10.1073/pnas.1613559113
11. Münnix MC, Shimada T, Schäfer R, Leyvraz F, Seligman TH, Guhr T, et al. Identifying states of a financial market. Sci Rep. (2012) 2:644. doi: 10.1038/srep00644
12. Battiston S, Puliga M, Kaushik R, Tasca P, Caldarelli G. Debtrank: too central to fail? Financial networks, the fed and systemic risk. Sci Rep. (2012) 2:541. doi: 10.1038/srep00541
13. Pharasi HK, Sharma K, Chatterjee R, Chakraborti A, Leyvraz F, Seligman TH. Identifying long-term precursors of financial market crashes using correlation patterns. N J Phys. (2018) 20:103041. doi: 10.1088/1367-2630/aae7e0
14. Mantegna RN. Information and hierarchical structure in financial markets. Comput Phys Commun. (1999) 121–2:153–6. doi: 10.1016/S0010-4655(99)00302-1
15. Mantegna RN. Hierarchical structure in financial markets. Eur Phys J B Condens Matter Complex Syst. (1999) 11:193–7. doi: 10.1007/s100510050929
16. Kumar S, Deo N. Correlation and network analysis of global financial indices. Phys Rev E. (2012) 86:026101. doi: 10.1103/PhysRevE.86.026101
17. Tumminello M, Aste T, Di Matteo T, Mantegna RN. A tool for filtering information in complex systems. Proc Natl Acad Sci USA. (2005) 102:10421–6. doi: 10.1073/pnas.0500298102
18. Sharma K, Gopalakrishnan B, Chakrabarti AS, Chakraborti A. Financial fluctuations anchored to economic fundamentals: a mesoscopic network approach. Sci Rep. (2017) 7:8055. doi: 10.1038/s41598-017-07758-9
19. Holme P, Saramäki J. Temporal networks. Phys Rep. (2012) 519:97–125. doi: 10.1016/j.physrep.2012.03.001
20. Almog A, Shmueli E. Structural entropy: monitoring correlation-based networks over time with application to financial markets. Sci Rep. (2019) 9:1–13. doi: 10.1038/s41598-019-47210-8
21. Chakraborti A, Hrishidev Sharma K, Pharasi HK. Phase separation and scaling in correlation structures of financial markets. arXiv [Preprint]. arXiv:1910.06242v3 (2020). Available online at: https://arxiv.org/abs/1910.06242
22. Battiston S, Farmer JD, Flache A, Garlaschelli D, Haldane AG, Heesterbeek H, et al. Complexity theory and financial regulation. Science. (2016) 351:818–9. doi: 10.1126/science.aad0299
23. Onnela JP, Chakraborti A, Kaski K, Kertiész J. Dynamic asset trees and portfolio analysis. Eur Phys J B Condens Matter Complex Syst. (2002) 30:285–8. doi: 10.1140/epjb/e2002-00380-9
24. Onnela JP, Chakraborti A, Kaski K, Kertesz J, Kanto A. Dynamics of market correlations: taxonomy and portfolio analysis. Phys Rev E. (2003) 68:056110. doi: 10.1103/PhysRevE.68.056110
25. Bonanno G, Caldarelli G, Lillo F, Mantegna RN. Topology of correlation-based minimal spanning trees in real and model markets. Phys Rev E. (2003) 68:046130. doi: 10.1103/PhysRevE.68.046130
26. Bonanno G, Caldarelli G, Lillo F, Micciché S, Vandewalle N, Mantegna RN. Networks of equities in financial markets. Eur Phys J B. (2004) 38:363-371. doi: 10.1140/epjb/e2004-00129-6
27. Tumminello M, Lillo F, Mantegna RN. Correlation, hierarchies, and networks in financial markets. J Econ Behav Organ. (2010) 75:40–58. doi: 10.1016/j.jebo.2010.01.004
28. Jang W, Lee J, Chang W. Currency crises and the evolution of foreign exchange market: Evidence from minimum spanning tree. Phys A Stat Mech Appl. (2011) 390:707–18. doi: 10.1016/j.physa.2010.10.028
29. McDonald M, Suleman O, Williams S, Howison S, Johnson NF. Detecting a currency's dominance or dependence using foreign exchange network trees. Phys Rev E. (2005) 72:046106. doi: 10.1103/PhysRevE.72.046106
30. Onnela JP, Kaski K, Kertész J. Clustering and information in correlation based financial networks. Eur Phys J B. (2004) 38:353–62. doi: 10.1140/epjb/e2004-00128-7
31. Plerou V, Gopikrishnan P, Rosenow B, Amaral LN, Stanley HE. A random matrix theory approach to financial cross-correlations. Phys A Stat Mech Appl. (2000) 287:374–82. doi: 10.1016/S0378-4371(00)00376-9
32. Aste T, Di Matteo T, Hyde S. Complex networks on hyperbolic surfaces. Phys A Stat Mech Appl. (2005) 346:20–6. doi: 10.1016/j.physa.2004.08.045
33. Song WM, Di Matteo T, Aste T. Nested hierarchies in planar graphs. Discrete App Math. (2011) 159:2135–46. doi: 10.1016/j.dam.2011.07.018
34. Song WM, Di Matteo T, Aste T. Hierarchical information clustering by means of topologically embedded graphs. PLoS ONE. (2012) 7:e31929. doi: 10.1371/journal.pone.0031929
35. Tumminello M, Di Matteo T, Aste T, Mantegna RN. Correlation based networks of equity returns sampled at different time horizons. Eur Phys J B. (2007) 55:209–17. doi: 10.1140/epjb/e2006-00414-4
36. Kenett DY, Tumminello M, Madi A, Gur-Gershgoren G, Mantegna RN, Ben-Jacob E. Dominating clasp of the financial sector revealed by partial correlation analysis of the stock market. PLoS ONE. (2010) 5:e15032. doi: 10.1371/journal.pone.0015032
37. Kenett DY, Shapira Y, Madi A, Bransburg-Zabary S, Gur-Gershgoren G, Ben-Jacob E. Dynamics of stock market correlations. AUCO Czech Econ Rev. (2010) 4:330–41.
38. Nie CX, Song FT. Relationship between entropy and dimension of financial correlation-based network. Entropy. (2018). 20:177. doi: 10.3390/e20030177
39. MacMahon M, Garlaschelli D. Community detection for correlation matrices. Phys Rev X. (2015) 5:021006. doi: 10.1103/PhysRevX.5.021006
40. Nie CX. Dynamics of cluster structure in financial correlation matrix. Chaos Solitons Fractals. (2017) doi: 10.1016/j.chaos.2017.05.039
41. Sui G, Li H, Feng S, Liu X, Jiang M. Correlations of stock price fluctuations under multi-scale and multi-threshold scenarios. Phys A Stat Mech Appl. (2018) 490:1501–12. doi: 10.1016/j.physa.2017.08.141
42. Bowden RJ. Directional entropy and tail uncertainty, with applications to financial hazard. Quant Fin. (2011) 11:437–46. doi: 10.1080/14697681003685548
43. Gradojevic N, Caric M. Predicting systemic risk with entropic indicators. J Forecast. (2017) 36:16–25. doi: 10.1002/for.2411
44. Maasoumi E, Racine J. Entropy and predictability of stock market returns. J Econometr. (2002) 107:291–312. doi: 10.1016/S0304-4076(01)00125-7
45. Sandhu RS, Georgiou TT, Tannenbaum AR. Ricci curvature: an economic indicator for market fragility and systemic risk. Sci Adv. (2016) 2:1–10. doi: 10.1126/sciadv.1501495
46. Fan Y, Zeng LL, Shen H, Qin J, Li F, Hu D. Lifespan development of the human brain revealed by large-scale network eigen-entropy. Entropy. (2017) 19:471. doi: 10.3390/e19090471
47. Fortunato S. Community detection in graphs. Phys Rep. (2010) 486:75–174. doi: 10.1016/j.physrep.2009.11.002
48. Bellingeri M, Bevacqua D, Scotognella F, Cassi D. The heterogeneity in link weights may decrease the robustness of real-world complex weighted networks. Sci Rep. (2019) 9:1–13. doi: 10.1038/s41598-019-47119-2
49. Laloux L, Cizeau P, Bouchaud JP, Potters M. Noise dressing of financial correlation matrices. Phys Rev Lett. (1999) 83:1467–70. doi: 10.1103/PhysRevLett.83.1467
51. Pharasi HK, Sharma K, Chakraborti A, Seligman TH. Complex market dynamics in the light of random matrix theory. In: Abergel A, Chakrabarti BK, Chakraborti A, Deo N, Sharma K, editors New Perspectives and Challenges in Econophysics and Sociophysics. Cham: Springer (2019) p. 13–34. doi: 10.1007/978-3-030-11364-3_2
52. Wigner EP. On the distribution of the roots of certain symmetric matrices. Ann Math. (1958) 67:325–27. doi: 10.2307/1970008
54. Guhr T, Müller-Groeling A, Weidenmüller HA. Random-matrix theories in quantum physics: common concepts. Phys Rep. (1998) 299:189–425. doi: 10.1016/S0370-1573(97)00088-4
55. Marčenko VA, Pastur LA. Distribution of eigenvalues for some sets of random matrices. Math USSR Sbornik. (1967) 1:457. doi: 10.1070/SM1967v001n04ABEH001994
56. Kumar S, Deo N. Analysing correlations after the financial crisis of 2008 and multifractality in global financial time series. Pramana. (2015) 84:317–25. doi: 10.1007/s12043-015-0935-6
57. Guhr T, Kälber B. A new method to estimate the noise in financial correlation matrices. J Phys A Math Gen. (2003) 36:3009. doi: 10.1088/0305-4470/36/12/310
58. Vinayak, Schäfer R, Seligman TH. Emerging spectra of singular correlation matrices under small power-map deformations. Phys Rev E. (2013) 88:032115. doi: 10.1103/PhysRevE.88.032115
59. Vinayak, Seligman TH; AIP. Time series, correlation matrices and random matrix models. AIP Conf Proc. (2014) 1575:196–217. doi: 10.1063/1.4861704
60. Sharma K, Shah S, Chakrabarti AS, Chakraborti A. Sectoral co-movements in the Indian stock market: a mesoscopic network analysis. In: Aruka Y, Kirman A, editors Economic Foundations for Social Complexity Science. Singapore: Springer (2017) p. 211–38. doi: 10.1007/978-981-10-5705-2_11
61. Pharasi HK, Seligman E, Seligman TH. Market states: a new understanding. arXiv [Preprint]. arXiv:2003.07058 (2020). Available online at: https://arxiv.org/abs/2003.07058
Keywords: econophysics, random matrix theory, correlation, networks, minimum spanning trees, clustering, financial networks
Citation: Kukreti V, Pharasi HK, Gupta P and Kumar S (2020) A Perspective on Correlation-Based Financial Networks and Entropy Measures. Front. Phys. 8:323. doi: 10.3389/fphy.2020.00323
Received: 20 April 2020; Accepted: 13 July 2020;
Published: 25 August 2020.
Edited by:
Takayuki Mizuno, National Institute of Informatics, JapanReviewed by:
Michele Bellingeri, University of Parma, ItalyYuyao Wang, Nanjing University of Science and Technology, China
Copyright © 2020 Kukreti, Pharasi, Gupta and Kumar. This is an open-access article distributed under the terms of the Creative Commons Attribution License (CC BY). The use, distribution or reproduction in other forums is permitted, provided the original author(s) and the copyright owner(s) are credited and that the original publication in this journal is cited, in accordance with accepted academic practice. No use, distribution or reproduction is permitted which does not comply with these terms.
*Correspondence: Sunil Kumar, ZHUuc3VuaWxAZ21haWwuY29t; c2t1bWFyQHJhbWphcy5kdS5hYy5pbg==; Hirdesh K. Pharasi, aGlyZGVzaHBoYXJhc2lAZ21haWwuY29t