 Jie Liu
 Wen Wan2
- 1Department of Building Engineering, Hunan Institute of Engineering, Xiangtan, China
- 2School of Resource, Environment and Safety Engineering, Hunan University of Science and Technology, Xiangtan, China
- 3School of Highway, Chang'an University, Xi'an, China
The discrete element method is adopted to investigate the failure process in punch-through shear tests. The numerical tests agree well with the laboratory tests on crack propagation sequence and the influence of confining stress on effective shear fracture toughness. More importantly, the numerical tests indicate that the increase in axial force first causes stress concentrations. When the stresses reach critical values, cracks initiate and the concentrated stresses dissipate. With further increase in axial displacement, the axial force may fluctuate, accompanied with crack development. In addition, the increase in confining stress promotes the critical values of the concentrated stresses before crack propagation. Thus, the numerical tests show that the increase in confining stress promotes the effective shear fracture toughness and restrains the propagation of tensile cracks.
Introduction
Rock masses containing many initial defects may be in complex geological conditions and subjected to various external loads [1–3]. Then, loads frequently cause stress concentrations and may further result in the opening (Mode I) and sliding (Mode II) displacements of the crack surfaces. In rock engineering, sliding (Mode II) is the commonest mode of failure [4]. Thus, many researchers have performed laboratory and numerical studies to investigate the shear fracture toughness (KIIC), a critical index for shear (sliding) failure. For example, Rao et al. [4] conducted shear-box tests to determine the Mode II crack toughness and proposed that effective KIIC decreases with the increase of both the specimen thickness. Timothy and Don [5] applied double-edge notched compression specimens to determine the Mode II fracture toughness and found that the ratio of KIIC to KIC (tensile fracture toughness) is ~1.6. In addition, their study showed that shear force fluctuates near the peak points, and residual shear occurs. Similar fluctuations and residual shear were observed in the laboratory study, by applying punch-through shear tests [6]. Based on the calculation model by Watkins [7] and Golewski and Sadowski [8] proposed that the content of the fly-ash influences the KIIC by performing electronic scanning tests and shear tests on concrete specimens. They further proposed an equation describing the critical force (corresponding to the shear crack initiation) and the shear fracture toughness. By performing compression tests on the cracked chevron-notched Brazilian Disc specimens, Ghanbari et al. [9] stated that the effective shear fracture toughness first increases and then decreases with the increase in temperature. Dehestani et al. [10, 11] applied crack Brazilian disc specimens to investigate the influence of wetting–drying cycles on the effective shear fracture toughness in neutral and acidic environments. They found that the increase in the wetting–drying cycles decreases the effective shear fracture toughness. By conducting numerical and laboratory tests on the fine-grained marble specimens, Xu et al. [12] proposed that the optimal height–diameter ratio is 2. The above studies clearly show that many methods can measure the shear fracture tests. In addition, many factors, including confinement, geometric sizes, and test temperature, can influence the measured results. Besides the above methods, the punch-through shear test is the suggested method of the ISRM (International Society for Rock Mechanics) [13, 14]. By performing extensive laboratory tests, Backers et al. [6] and Backers and Stephansson [13] found that tensile crack may first form, and then shear planes initiate from the bottom tip of the notches. In addition, they proposed that the shear crack propagates in a stable way, and the effective shear fracture toughness closely relates to the peak axial compression force and the confinement. The conclusion on shear crack propagation agrees well with the laboratory tests by Golewski and Sadowski [8] and Wu et al. [15].
Roux et al. [16] and Patinet et al. [17] stated that the effective toughness is the average of the local toughness in the weak pinning regime, characterized by regular propagation. However, in the strong pinning regime, a much higher effective toughness, accompanied with unstable propagation, is observed. The shear fracture in the specimen gradually propagates [6, 13]. However, the stress evolution in the rock bridge, remaining unclear, may successfully explain the above phenomena. However, the stress measurement in the laboratory test is approximately impossible [6]. The numerical method may shed some light on how to correlate fractures to stress evolution. For example, Liu et al. [18] measured the shear fracture toughness using the rock failure process analysis. Moon et al. [19] and Moon and Oh [20] successfully applied discrete element method to measure the tensile fracture toughness. Recent, by applying finite element method, Aminzadeh [21] et al. and Ma et al. [22] investigated the shear behavior of the rock specimens. Especially, among these methods, the discrete element method can record the crack development [23–25]. Thus, with the recent studies, using the measure circle logic to study stress evolution characteristics [15, 26–28], we applied Particle Flow Code 2D (PFC 2D) to relate the stress evolution to crack development in the punch-through tests.
Numerical Preparation
Calibration
In the present article, the laboratory dates reported by Backers were referred [29] (Table 1). The uniaxial compression strength (UCS)/tensile strength (TS) ratio is higher than 14. To obtain this realistic ratio, the flat-joint model instead of the parallel bond model was adopted [30, 31]. This model mainly consists of particles and the flat-joint contacts. In this model, two groups of springs can provide the normal and the shear stiffness. The first group includes the normal stiffness of the particles (Kn) and the flat-joint contact (), respectively (Figure 1A). Correspondingly, the other group consists of the shear stiffness, Ks and (Figure 1B). When the normal stress between particles exceeds the TS, σb, the bond breaks in a tensile manner, and the bond fails (Figure 1C). The shear strength first follows the Coulomb criterion when the shear stress is relatively low:
where cb and ϕb are the bond cohesion and the local friction angle.
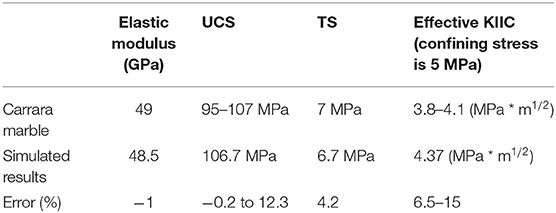
Table 1. Mechanical parameters.
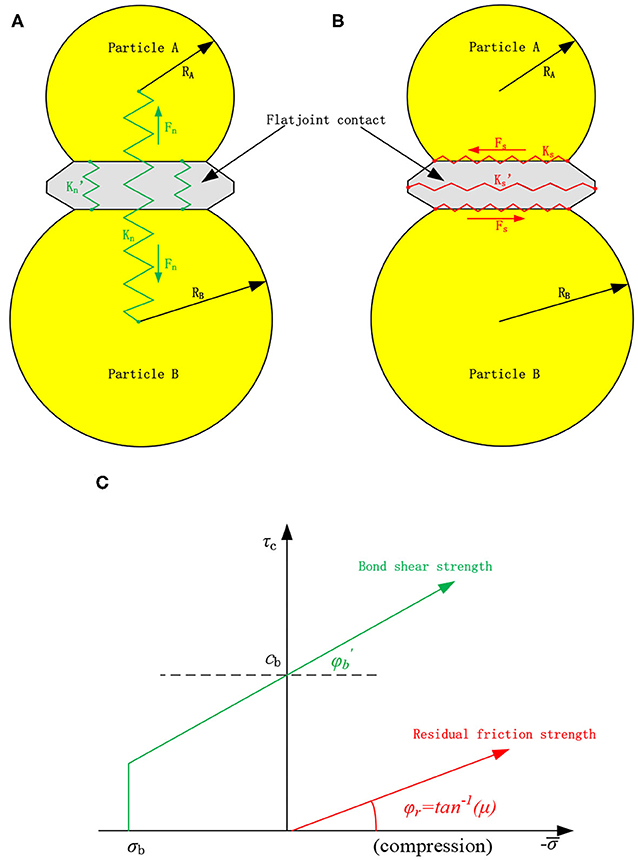
Figure 1. Deformability and strength of a flat-joint contact. (A) normal stiffness, (B) shear stiffness, and (C) strength criterion.
When the shear stress increases to a critical value, the bond fails in a shear manner. However, residual shear stress remains because of the friction:
where τr and ϕr are the residual friction strength and the residual friction angle. Thus, the flat-joint model can successfully simulate the post-peak behavior.
UCS and TS are two important parameters for rock fracture [30, 31]. Thus, by modifying bond cohesion, particle contact modulus, and bond modulus (Table 2), the elastic modulus and UCS were first calibrated according to the disciplines of trial and error tests [31]. Then, the TS was subsequently calibrated by modifying bond normal strength (Table 2). Figure 2 shows the calibration results, using the uniaxial compression tests and the Brazil tensile tests. Clearly, a shear failure plane and a tensile plane form in the uniaxial compression test and Brazil tension test, respectively. The UCS and the TS are close to the laboratory results (Table 1).
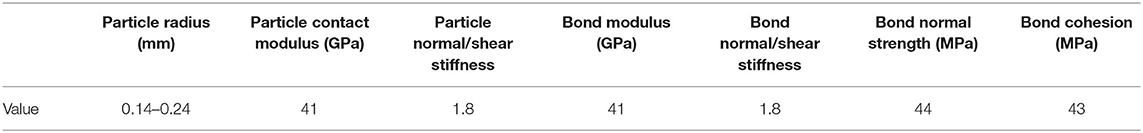
Table 2. Microparameters.
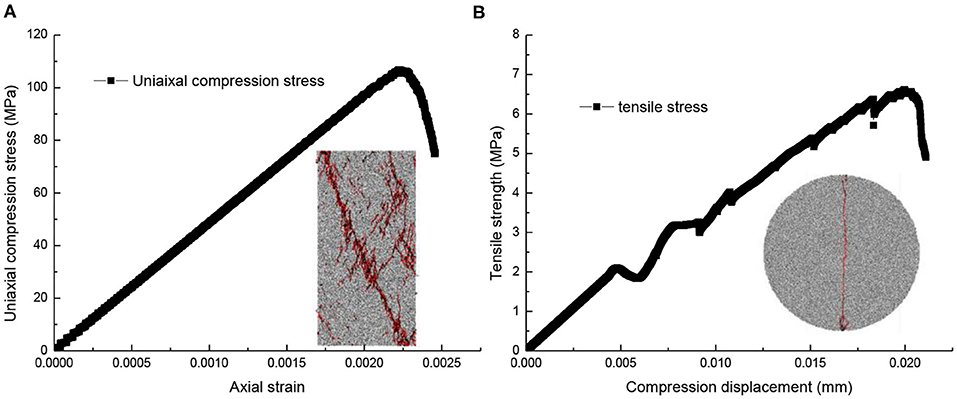
Figure 2. Calibration results: (A) and (B) correspond to UCS and TS, respectively.
Numerical Model and Test Scheme
According to the suggested sizes of ISRM and the previous studies [13, 15, 32], the numerical model containing 16,865 particles and 45,632 flat-joint bonds was established (Figure 3A). Before loading, the lateral walls were servo-controlled to ensure the specified confinement. Then, the middle-upper wall was displacement-controlled to compress the specimen with a constant rate of 0.05 m/s. The studies by Goldhirsch and Goldenberg [33] and Goldenberg et al. [34] indicated that force chains appear in granular materials, and continuum theories may be valid for granular materials. In the PFC model (consisting of particles), contact forces that can form force chains can be computed. However, they cannot be directly transferred to a continuum model. Averaging procedures are necessary to make the step from the microscale to a continuum [35]. Thus, PFC 2D calculates the average stress in a measurement region using the following equation:
where , V, Nc, F(c), ⊗, and L(c) are the average stress, the volume in 3D (area in 2D), the number of contacts in the measurement region or on its boundary, the contact force vector in the circle region, the outer product, and the branch vector joining the centroids of the two bodies in contact, respectively. In the loading process, overlapping measure circles with a radius of 1 mm (Figure 3B), covering more than six particles, were installed to record the horizontal (σh), vertical (σv), and shear stresses (τxy) in the specimen. Thus, the shear stress and the maximum principal stress, being equal to , can be recorded in the loading process.
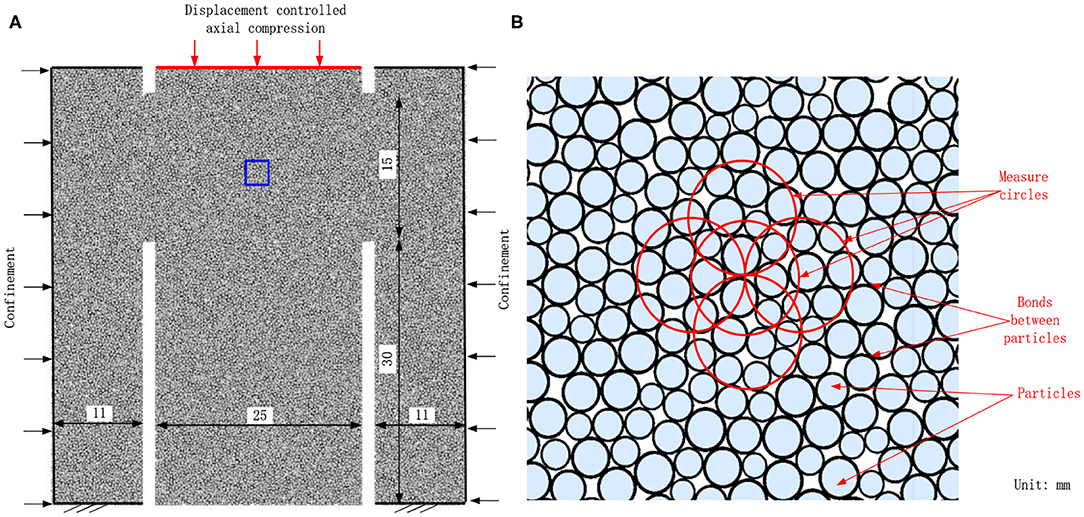
Figure 3. Details of the numerical model: (A) is the geometry and the loading schematic of numerical model, and (B) is the magnified picture of the blue rectangle.
Numerical Results and Discussions
Comparison Between Numerical and Laboratory Results
Figure 4 shows the axial force–displacement curves in the laboratory tests [6] and the present numerical study with the confining stress of 5 MPa. In PFC 2D, the default thickness of the specimen is 1 m. Thus, the shear area in the model was 0.03 m2. In the laboratory tests by Backers [32], the shear area was 0.00118 m2. Thus, according to Equation 4 obtained by fitting the laboratory results [13, 32], for the same shear area, the calculated effective shear fracture toughness is 4.37 MPa * m1/2. This simulated effective shear fracture toughness is close to the laboratory results (Table 1). The above descriptions indicate that the laboratory axial force–displacement curve agrees well with the numerical axial force–displacement curve in the peak value. However, the axial force–displacement curve for the laboratory test is concave, which is different from the numerical curve. In the laboratory tests, the micropores are responsible for the concave curve in the early compression process of rock materials. However, in the PFC simulation, the intact bonds between particles before cracking may prevent the pore compaction [24]. Interestingly, similar to the previous studies [5, 6, 15], the axial compression force fluctuates near the peak. These fluctuations may relate to the shear crack propagation and the stress evolution in the shear process and deserve further investigation.
where Fmax and Pc are the peak axial force (kN) and the confinement (MPa), respectively.
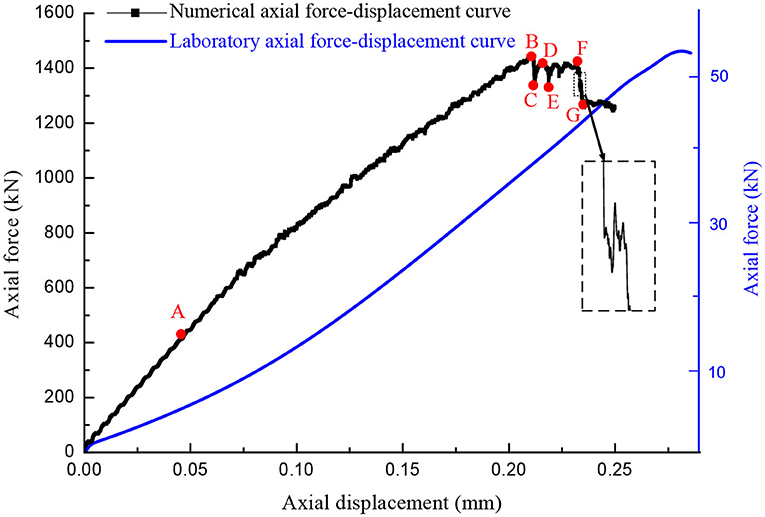
Figure 4. Numerical and laboratory [6] axial compression forces and the monitor points on the numerical curve.
The laboratory tests indicate that two tensile cracks, denoted in red lines in Figure 5A, first initiated from the inner tips of the lower notches. Subsequently, shear cracks, numbered 1 and denoted in pink lines, initiated from the outer tips of the lower notches. In addition, Backers [32] stated that these shear crack show some opening from this junction to the notch. In other words, these cracks may be shear–tensile cracks. With the increase in axial displacement, shear cracks, numbered 2 and 3, sequentially connected the rock bridges between the upper and the lower notches [29]. Interestingly, at Mode II loading conditions, the macroscopic fracture follows the direction of Mode II. Besides, tensile cracks appear in the specimen. This phenomenon may be reasonable because fracturing in rock material always involves a mixed mode on the microscale [13]. Clearly, the numerical failure pattern is similar to the laboratory result (Figure 5B). However, the crack propagation sequence is still unclear. The previous studies [26–28] show that the stress evolution relates to the crack development. According to the comparisons on the axial compression force and the fracture pattern between laboratory and numerical results, we may infer that the stress evolution may relate to the crack development and the fluctuations in axial compression force. Thus, in the following section, we are trying to investigate the stress evolution in the shear process.
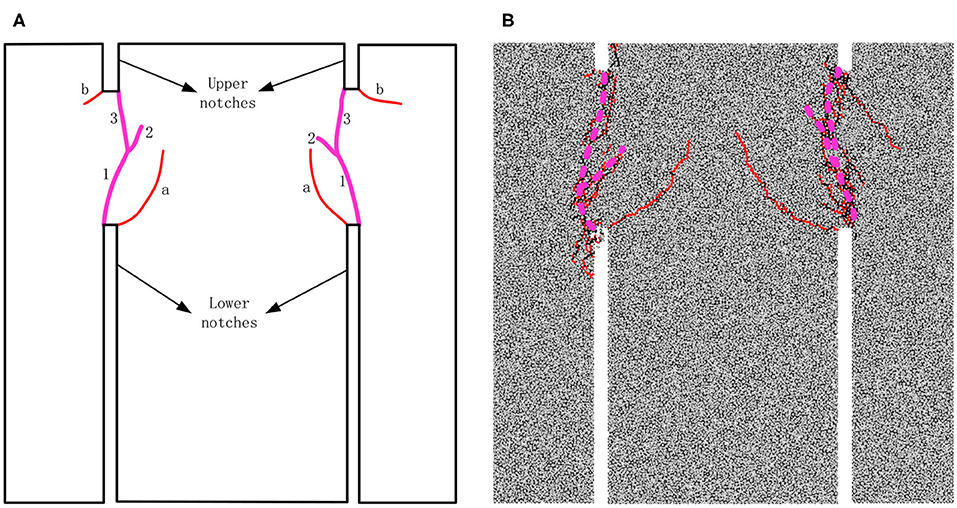
Figure 5. Fractures in punch-through tests: (A) and (B) are the laboratory [29] and numerical fractures, respectively.
Stress Evolution in the Shear Process
The concentrated stresses may be responsible for the crack development. Thus, to investigate the typical crack (shear and tensile cracks) developments, Figure 6 shows the numerical crack propagation and stress evolution in the shear process at typical monitor points (A–G) on the axial force–displacement curve in Figure 4. At Point A, two shear concentration zones (SCZ), named SCZ 1 and SCZ 2, form at the outer tips of the bottom notches (Figure 6A2). Simultaneously, in PFC 2D, tensile stress is positive; thus, Figure 6A3 clearly shows that two tensile concentration zones (TCZs) form at the inner tips of the bottom notches. However, shear and tensile cracks fail to form (Figure 6A1). When the axial displacement increases to 0.21 mm, the first peak axial force at point B appears (Figure 4). Two tensile cracks, accompanied with minor fluctuations on the axial compression force, TC 1 and TC 2, form during this loading period (Figure 6B1). These tensile cracks also formed at previous laboratory tests [6, 32]. Interestingly, the initiation points locate at the TCZ 1 and TCZ 2, and the tensile stress concentrations at these crack tips significantly dissipate (Figure 6B3). Thus, we can infer that the concentrated tensile stresses at the inner tips of the bottom notches first form tensile cracks. In addition, TCZ 3 and TCZ 4 form at the rock bridges between the upper and the bottom notches (Figure 6B3). At the peak point, the shear stresses at SCZ 1 and SCZ 2 highly concentrate, and four shear concentration zones (SCZ 3–SCZ 6) form at the inner tips of the upper notches and the rock bridges (Figure 6B2). With further increase in axial displacement, the axial force sharply drops. At the first bottom point C, a shear crack (SC 1) initiates from the outer tip of the right-bottom notch, and the initiation point overlaps with the SCZ 2 (Figures 6C1,C2). The shear stress concentration at SCZ 2 dissipates, and the tensile stress concentration at TCZ 3 significantly dissipates. Thus, we can infer that the shear and tensile concentration at SCZ 2 and TCZ 3 are responsible for SC 1. This inference can properly verify the referred laboratory results that the shear crack shows some opening from this junction to the notch [32]. In addition, another shear crack (SC 2) initiates from the right-upper notch. With further increase in axial displacement, the axial force reaches the second peak at Point D. Clearly, the cracks fail to further generate (Figures 6C1,D1). However, the shear stresses at SCZ 5 and SCZ 6 further concentrate. Additionally, TCZ 5 forms at the tip of SC 2 (Figure 6D1). Subsequently, the second drop at Point E appears, accompanied with the formation of SC 3 (Figures 4, 6E1). After the formation of SC 3, the area of SCZ 5 slightly decreases; however, the compression at the right rock bridge greatly concentrates. In addition, the tensile stress further concentrates at TCZ 5. Then, when the axial displacement further increases to 0.23 mm, the third peak appears at point F (Figure 4). The development of the cracks is minor. However, the shear stresses further concentrate at the shear concentration zones (except SCZ 2), and the tensile stress simultaneously concentrates at TZ 4. Finally, with further increase in axial displacement, the axial force significantly drops, and the third bottom point (G) forms. Between Points F and G, similar fluctuations generate (shown by the magnified area in Figure 4). In addition, SC 5, SC 6, and SC 7 sequentially connected the bottom and upper notches (Figure 6G1). Interestingly, the shear concentrations at SCZ 1 and SCZ 2 slightly move upward (Figure 6G2) and the tensile stress at TCZ 4 dissipates.
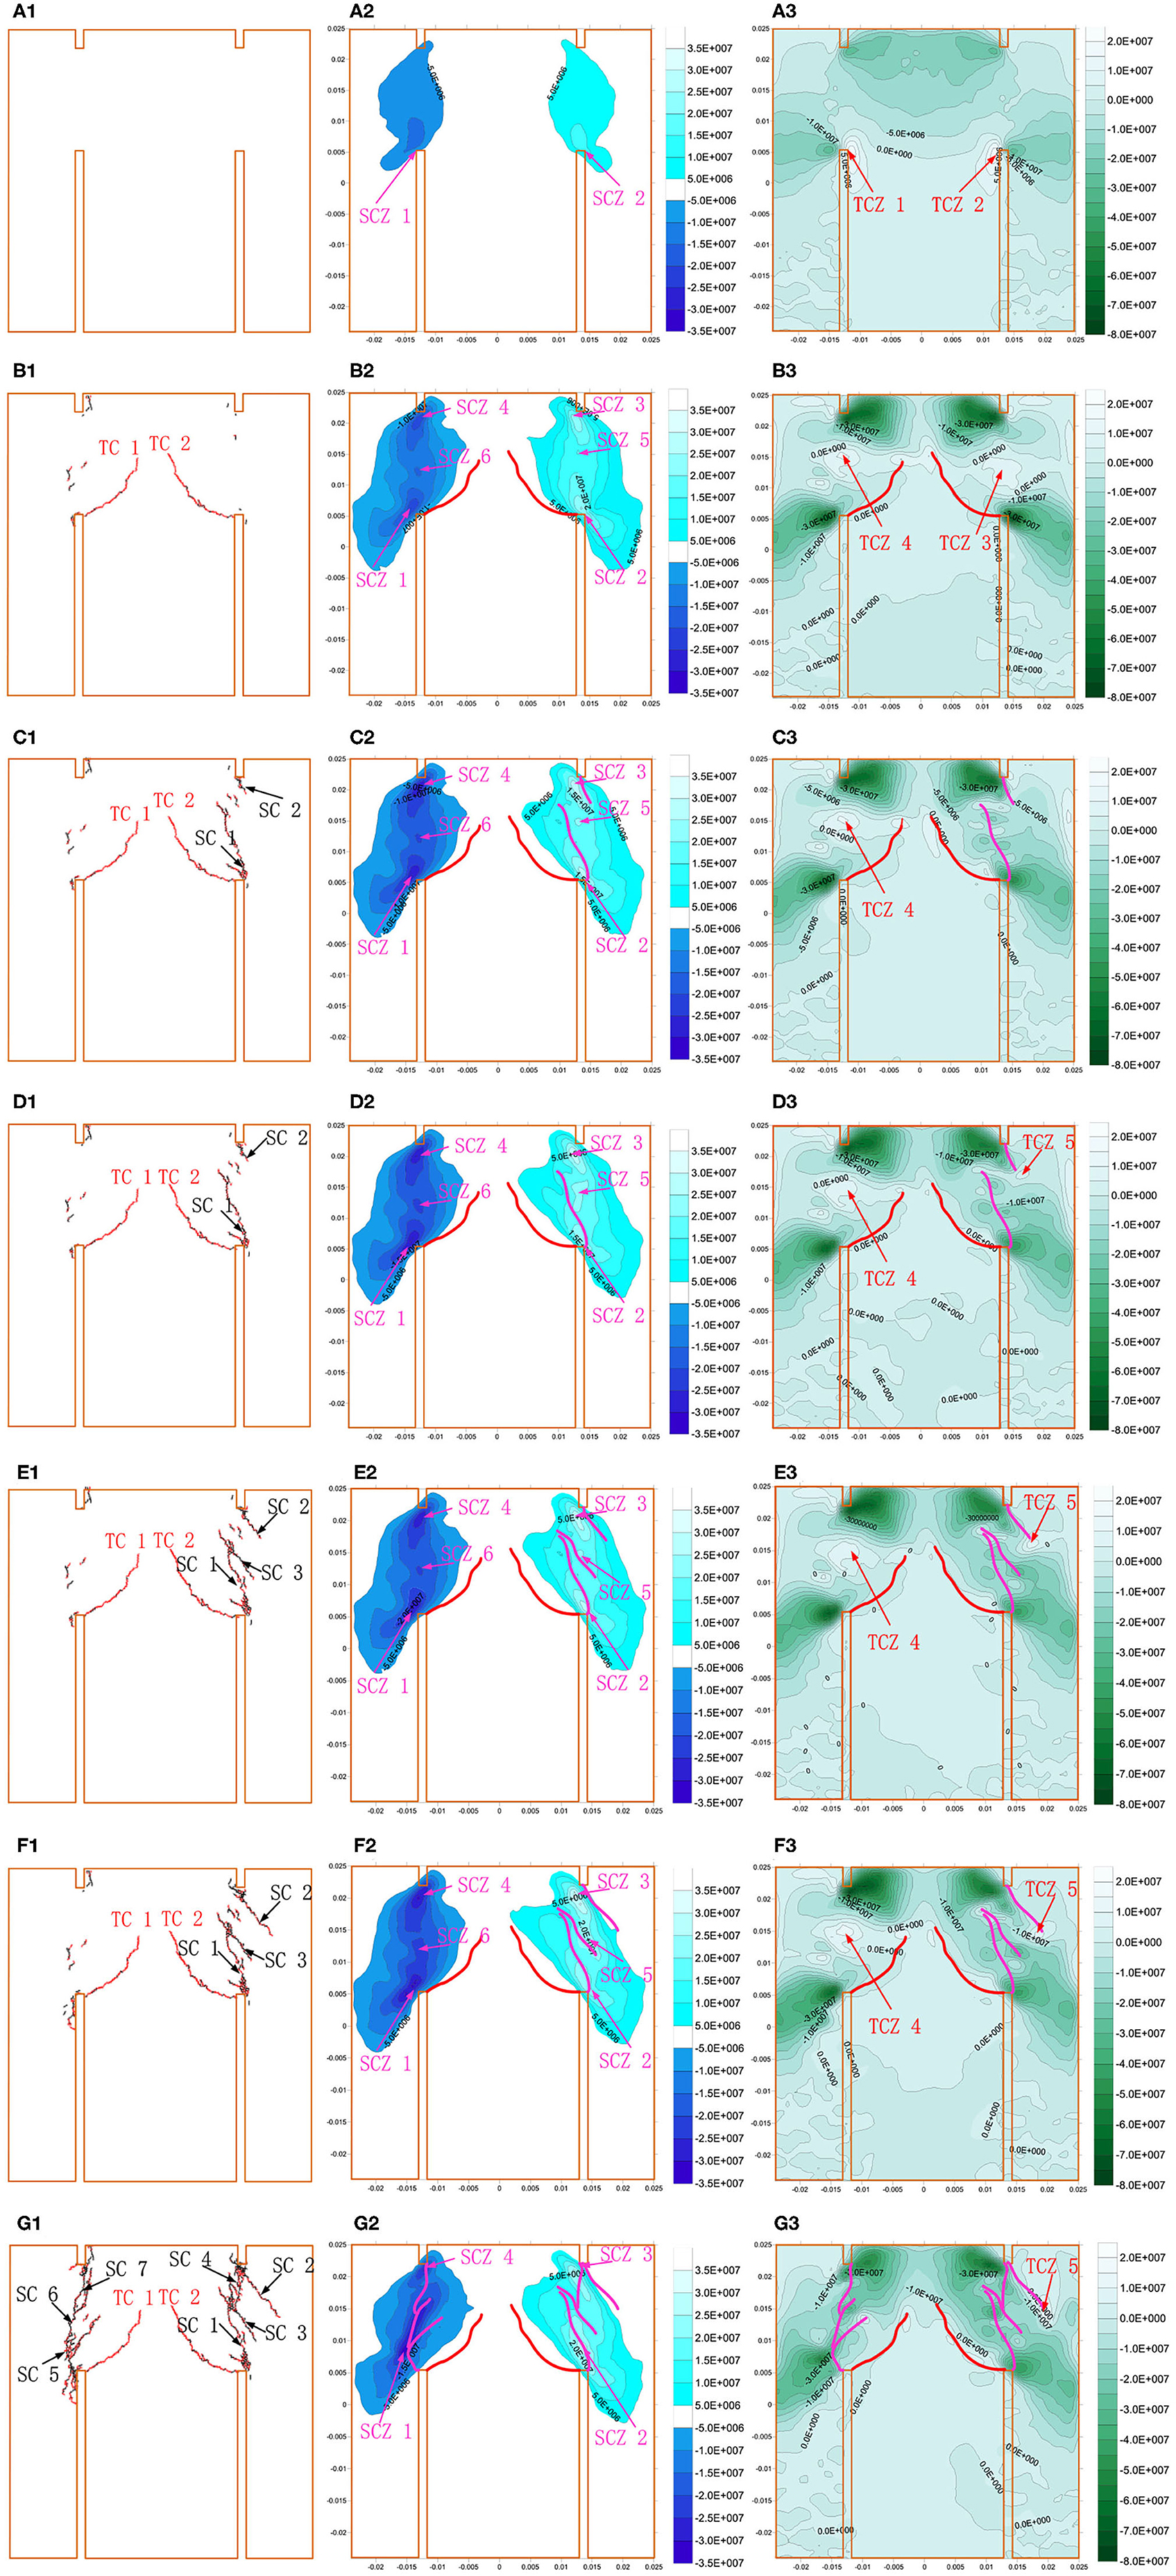
Figure 6. Fracture development and stress distributions in the shear process: (A1–G1) are the fracture developments, (A2–G2) are the shear stress distributions, and (A3–G3) are the maximum principal stress distributions at the typical monitor points (A–G).
The above descriptions indicate that the tensile concentrations at TCZ 1 and TCZ 2 are responsible for the TC 1 and TC 2, reported in previous studies [6, 32]. In addition, shear stress concentrations at the outer tips of the bottom tips first form shear cracks, and then, with the tensile concentration at the rock bridge, shear–tensile cracks form. With further increase in axial displacement, the shear cracks, driven by the shear concentrations at the inner tip of the upper notches, finally coalesce the rock bridge. The reported laboratory tests and the numerical simulation agree well on crack propagation sequence. More interestingly, we find that the drop of the axial force frequently accompanies crack propagation and stress dissipation, whereas the increase in the axial displacement usually causes stress concentrations instead of obvious crack propagation.
The Influence of Confining Stress on the Failure Characteristics
The laboratory tests by Backers et al. [6] and Backers [32] indicated that the increase in confining stress frequently promotes the tested effective shear fracture toughness and restrains the development of tensile cracks. Thus, to verify the above conclusions, three simulations with the confining stresses of 0, 10, and 15 MPa were performed.
Similar to the laboratory tests [6, 32], the increase in confining stress restrains the tensile crack propagation (Figure 7). In addition, the width of the shear band between the upper and bottom notches increases with the increase in confining stress. Moreover, for the relatively low confining stresses, the axial force significantly fluctuates after the peak points (Figure 8). However, with the increase in confining stress, the fluctuations of the axial force are minor. This phenomenon agrees well with the laboratory results [6, 32]. More importantly, the increase in confining stress promotes the peak axial force. Thus, according to Equation 4 proposed by Backers and Stephansson [13] and Backers [32], the calculated effective shear fracture toughness simultaneously increases (Figure 9), and the numerical values of the effective shear fracture toughness are close to the laboratory ones.
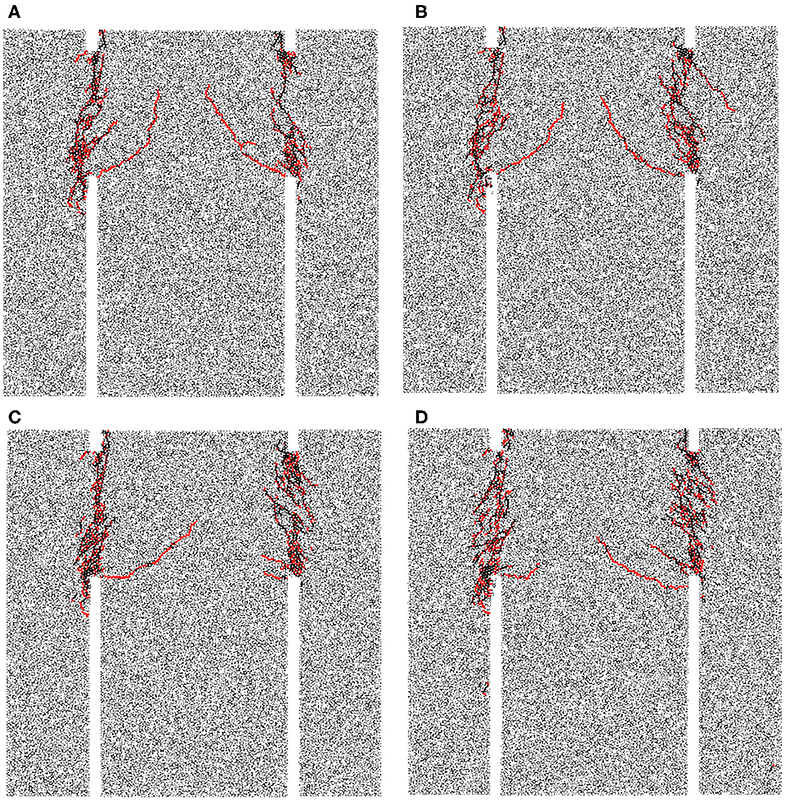
Figure 7. Numerical fractures: (A–D) are the fractures when the confining stresses are 0, 5, 10, and 15 MPa, respectively.
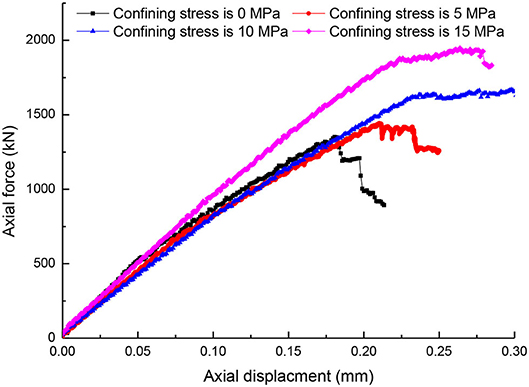
Figure 8. The axial force–displacement curves for various confinements.
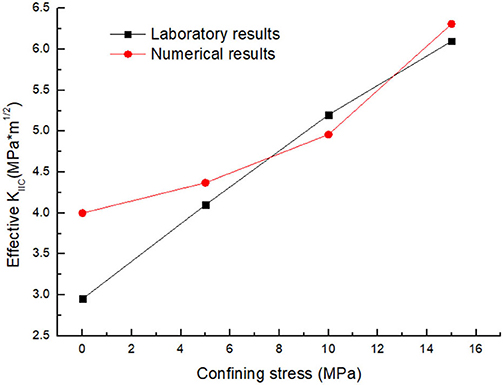
Figure 9. The numerical and laboratory effective shear fracture toughness for various confinements.
The above descriptions indicate that the numerical results agree well with the laboratory results on the effects of confining stress on fracture development and effective shear fracture toughness. To explain the above phenomena, we will further discuss the stress evolution for various confining stresses.
Figure 10 shows the maximum principal stresses before tensile crack initiation. Clearly, tensile stress concentration zones form at the inner tips of the bottom notches. These concentrated tensile stresses are responsible for the tensile crack propagation in Figure 7. Interestingly, the increase in confining stress elevates the corresponding maximum principal stresses (Figure 12). Thus, we can infer that the increase in confining stress may increase the effective tensile fracture toughness. Simultaneously, the absolute value of the maximum principal stress (negative) significantly increases between the upper and bottom notches. In other words, the compression at the rock between the upper and bottom notches intensifies with the increase in confining stress. The increased compression will restrain the tensile crack propagation between the upper and bottom notches. Thus, according to the above description, we may infer that the promoted effective tensile fracture toughness and the compression between the upper and bottom are responsible for the restrained tensile crack propagation when the confining stress increases.
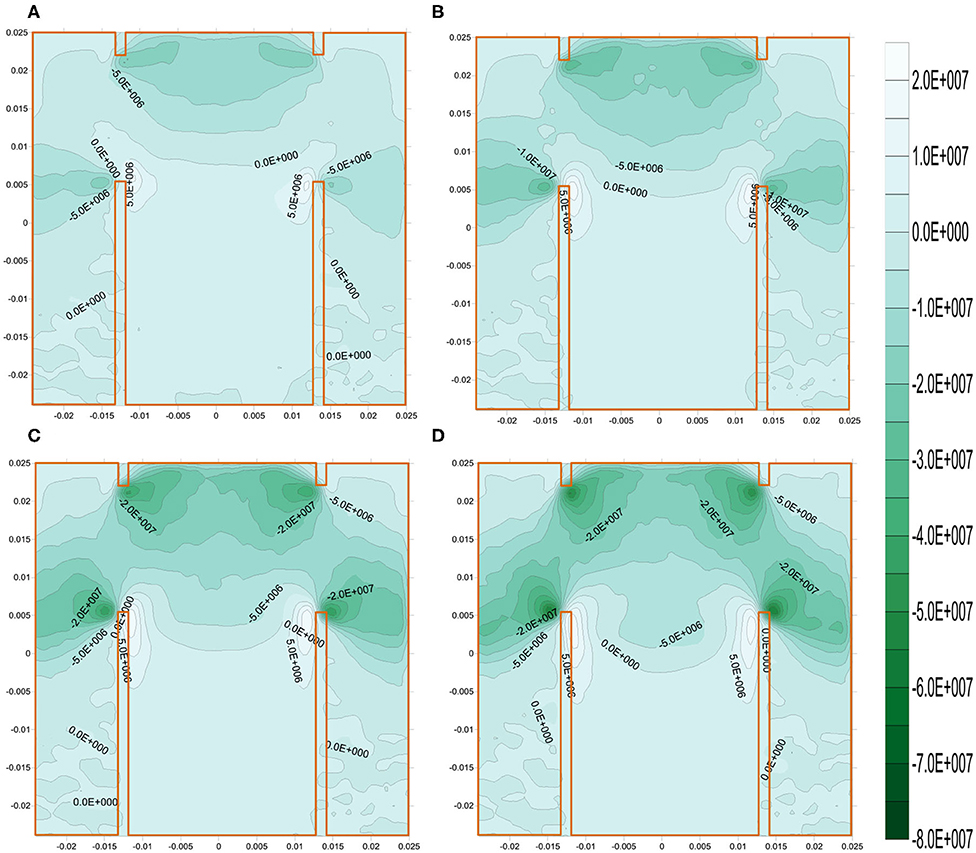
Figure 10. The maximum principal stresses before tensile crack initiations: (A–D) are for the confining stresses of 0, 5, 10, and 15 MPa, respectively.
The peak axial force, usually corresponding to the shear crack initiation from the outer tip of the bottom notches, can be used to calculate the effective shear fracture toughness. Thus, Figure 11 depicts the shear stress contours at the first peak point of the axial force. With the initiation shear stresses in Figure 12, we can obtain that the increase in confining stress promotes the shear initiation stresses. The geometries of the notches are the same; thus, these promoted shear initiation stresses can properly verify that the increase in confining stress promotes the effective shear fracture toughness [6, 32].
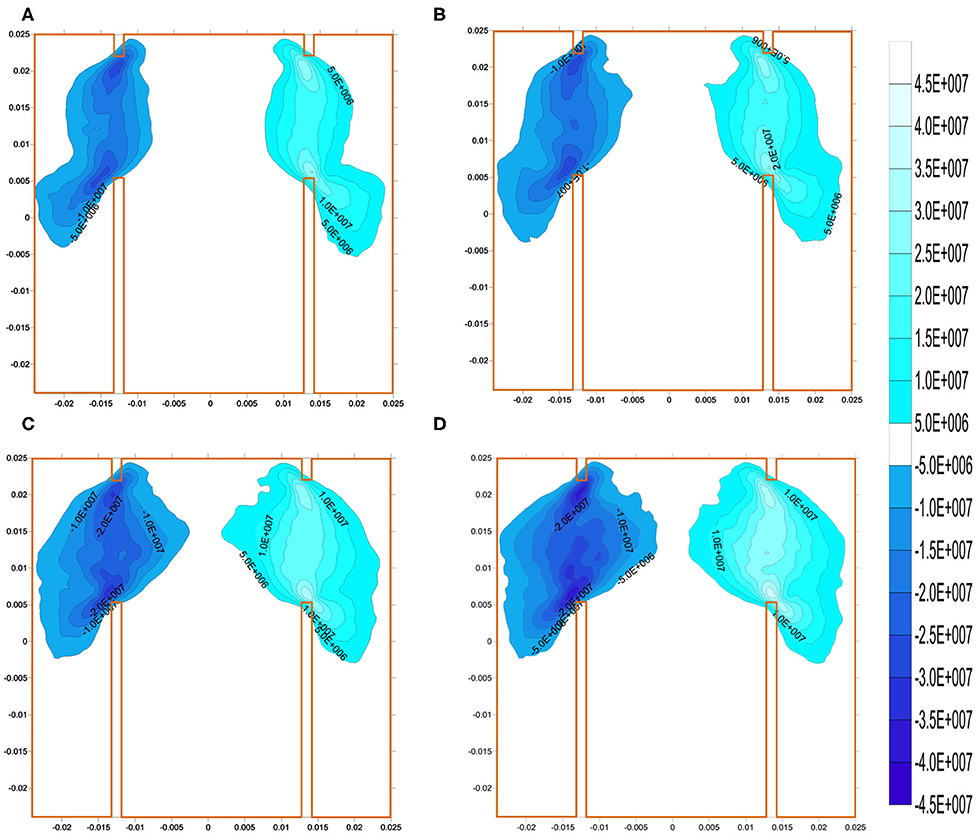
Figure 11. Shear stresses before shear crack propagation: (A–D) are for the confining stresses of 0, 5, 10, and 15 MPa, respectively.
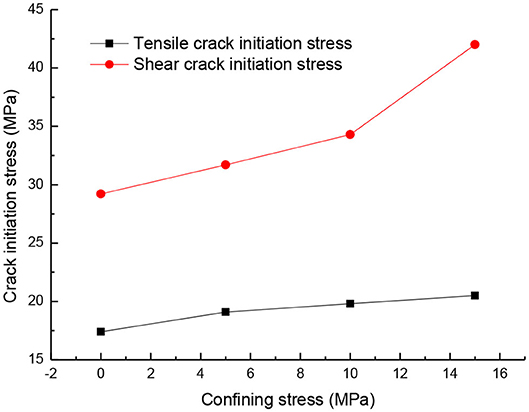
Figure 12. The tensile and shear crack initiation stresses.
Conclusions
The numerical simulation agrees well with the previous laboratory result that tensile cracks first initiate from the inner tips of the bottom notches. Then, shear–tensile cracks initiate from the outer tips of the bottom notches. Subsequently, the cracks at the middle of the rock bridge and the shear cracks initiating from the upper notches connect the rock bridge. More importantly, near the peak point of the axial compression force curve, the numerical tests indicate that the drops of the axial compression force frequently accompany with crack propagation and stress dissipation, whereas the increases in the axial force concentrate the stresses with hardly crack propagation. Then, the numerical tests indicate the increase in confining stress promotes the effective tensile fracture toughness and the compression between the upper and bottom notches. Thus, the increasing confining stress restrains tensile crack propagation and promotes the effective shear fracture toughness.
Data Availability Statement
The raw data supporting the conclusions of this article will be made available by the authors, without undue reservation.
Author Contributions
All authors performed the simulation, provided financial support, provided theoretical guidance, and provided numerical guidance, respectively.
Funding
The authors would like to acknowledge these financial supports: Projects (51804110) supported by the National Natural Science Foundation of China; Projects (2020JJ5101) supported by the Natural Science Foundation of Hunan Province; Scientific Research Foundation of Hunan Province Education Department (18B391, 18A345).
Conflict of Interest
The authors declare that the research was conducted in the absence of any commercial or financial relationships that could be construed as a potential conflict of interest.
References
1. Zhao YL, Wang YX, Wang WJ, Tang LM, Liu Q. Modeling of rheological fracture behavior of rock cracks subjected to hydraulic pressure and far field stresses. Theor Appl Fract Mech. (2019) 101:59–66. doi: 10.1016/j.tafmec.2019.01.026
2. Dong LJ, Zou W, Li XB, Shu WW, Wang ZW. Collaborative localization method using analytical and iterative solutions for microseismic/acoustic emission sources in the rockmass structure for underground mining. Eng Fract Mech. (2019) 210:95–112. doi: 10.1016/j.engfracmech.2018.01.032
3. Zhao YL, Zhang LY, Wang WJ, Pu CZ, Wan W, Tang JZ. Cracking and stress-strain behavior of rock-like material containing two flaws under uniaxial compression. Rock Mech Rock Eng. (2016) 49:2665–87. doi: 10.1007/s00603-016-0932-1
4. Rao QH, Sun ZQ, Stephansson O, Li CL, Stillborg B. Shear fracture (Mode II) of brittle rock. Int J Rock Mech Min Sci. (2003) 40:355–75. doi: 10.1016/S1365-1609(03)00003-0
5. Timothy DB, Don E III. The shear fracture toughness, KIIc, of graphite. Carbon. (2016) 98:267–79. doi: 10.1016/j.carbon.2015.10.084
6. Backers T, Stephansson O, Rybacki E. Rock fracture toughness testing in Mode II punch-through shear test. Int J Rock Mech Min Sci. (2002) 39:755–69. doi: 10.1016/S1365-1609(02)00066-7
7. Watkins J. Fracture toughness test for soil-cement samples in mode II. Int J Fract. (1983) 23:RI35–8. doi: 10.1007/BF00020700
8. Golewski GL, Sadowski T. An analysis of shear fracture toughness KIIc and microstructure in concretes containing fly-ash. Constr Build Mater. (2014) 51:207–14. doi: 10.1016/j.conbuildmat.2013.10.044
9. Ghanbaria N, Hosseinia M, Saghafiyazdia M. Effects of temperature and confining pressure on the mode I and mode II fracture toughness of cement mortar. Theor Appl Fract Mech. (2019) 104:102361. doi: 10.1016/j.tafmec.2019.102361
10. Dehestani A, Hosseini M, Beydokhti AT. Effect of wetting-drying cycles on mode I and mode II fracture toughness of cement mortar and concrete. Theor Appl Fract Mech. (2020) 106:102448. doi: 10.1016/j.tafmec.2019.102448
11. Dehestani A, Hosseini M, Beydokhti AT. Effect of wetting-drying cycles on mode I and mode II fracture toughness of sandstone in natural (pH = 7) and acidic (pH = 3) environments. Theor Appl Fract Mech. (2020) 107:102512. doi: 10.1016/j.tafmec.2020.102512
12. Xu Y, Yao W, Zhao GL, Xia KW. Evaluation of the short core in compression (SCC) method for measuring mode II fracture toughness of rocks. Eng Fract Mech. (2020) 224:106747. doi: 10.1016/j.engfracmech.2019.106747
13. Backers T, Stephansson O. ISRM suggested method for the determination of mode II fracture toughness. Rock Mech Rock Eng. (2012) 45:45–56. doi: 10.1007/s00603-012-0271-9
14. Yao W, Xu Y, Yu CY, Xia KW. A dynamic punch-through shear method for determining dynamic Mode II fracture toughness of rocks. Eng Fract Mech. (2017) 176:161–77. doi: 10.1016/j.engfracmech.2017.03.012
15. Wu HY, Kemeny J, Wu SC. Experimental and numerical investigation of the punch-through shear test for mode II fracture toughness determination in rock. Eng Fract Mech. (2017) 184:59–74. doi: 10.1016/j.engfracmech.2017.08.006
16. Roux S, Vandembroucq D, Hild F. Effective toughness of heterogeneous brittle materials. Eur J Mech A Solids. (2003) 22:743–49. doi: 10.1016/S0997-7538(03)00078-0
17. Patinet S, Vandembroucq D, Roux S. Quantitative prediction of effective toughness at random heterogeneous interfaces. Phys Rev Lett. (2006) 110:165507. doi: 10.1103/PhysRevLett.110.165507
18. Liu HY, Kou SQ, Lindqvist PA, Tang CA. Numerical simulation of shear fracture (Mode II) in heterogeneous brittle rock. Int J Rock Mech Min Sci. (2004) 41:355. doi: 10.1016/j.ijrmms.2003.12.148
19. Moon T, Nakagawa M, Berger J. Measurement of fracture toughness using the distinct element method. Int J Rock Mech Min Sci. (2007) 44:449–56. doi: 10.1016/j.ijrmms.2006.07.015
20. Moon T, Oh J. A Study of optimal rock-cutting conditions for hard rock TBM using the discrete element method. Rock Mech Rock Eng. (2012) 45:837–49. doi: 10.1007/s00603-011-0180-3
21. Aminzadeha A, Fahimifara A, Nejatib M. On Brazilian disk test for I/II mixed-mode fracture toughness experiments of anisotropic rocks. Theor Appl Fract Mech. (2019) 102:222–38. doi: 10.1016/j.tafmec.2019.04.010
22. Ma LF, Yari N, Wiercigroch M. Shear stress triggering brittle shear fracturing of rock-like materials. Int J Mech Sci. (2018) 146–7:295–302. doi: 10.1016/j.ijmecsci.2018.07.008
23. Fan X, Li KH, Lai HP, Xie YL, Cao RH, Zheng J. Internal stress distribution and cracking around flaws and openings of rock block under uniaxial compression: a particle mechanics approach. Comput Geotech. (2018) 102:28–38. doi: 10.1016/j.compgeo.2018.06.002
24. Cao Rh, Cao P, Lin H, Pu CZ, Ou K. Mechanical behavior of brittle rock-like specimens with pre-existing fissures under uniaxial loading: experimental studies and particle mechanics approach. Rock Mech Rock Eng. (2015) 49:763–83. doi: 10.1007/s00603-015-0779-x
25. Dong LJ, Deng SJ, Wang FY. Some developments and new insights for environmental sustainability and disaster control of tailings dam. J Clean Prod. (2020) 269:122270. doi: 10.1016/j.jclepro.2020.122270
26. Liu J, Wang J, Wan W. Numerical study of crack propagation in an indented rock specimen. Comput Geotech. (2018) 96:1–11. doi: 10.1016/j.compgeo.2017.10.014
27. Liu J, Wang J. The effect of indentation sequence on rock breakages: a study based on laboratory and numerical tests. C R Mecanique. (2018) 346:26–38. doi: 10.1016/j.crme.2017.11.004
28. Liu J, Wan W, Chen Y, Wang J. Dynamic indentation characteristics for various spacings and indentation depths: a study based on laboratory and numerical tests. Adv Civil Eng. (2018) 2018:1–12. doi: 10.1155/2018/8412165
29. Backers T, Dresen G, Rybacki E, Stephansson O. New data on mode II fracture toughness of rock from the punch-through shear test. Int J Rock Mech Min Sci. (2004) 41:349–546. doi: 10.1016/j.ijrmms.2003.12.059
30. Wu SC, Xu XL. A study of three intrinsic problems of the classic discrete element method using flat-joint model. Rock Mech Rock Eng. (2016) 49:1813–30. doi: 10.1007/s00603-015-0890-z
31. Yang XX, Qiao WG. Numerical investigation of the shear behavior of granite materials containing discontinuous joints by utilizing the flat-joint model. Comput Geotech. (2018) 104:69–80. doi: 10.1016/j.compgeo.2018.08.014
32. Backers T. Fracture Toughness Determination and Micromechanics of Rock Under Mode I and Mode II Loading. Potsdam: University of Potsdam (2004).
33. Goldhirsch I, Goldenberg C. On the microscopic foundations of elasticity. Eur Phys J E. (2002) 9:245–51. doi: 10.1140/epje/i2002-10073-5
Keywords: effective shear fracture toughness, failure process, confining stress, crack propagation, fluctuation
Citation: Liu J, Wan W, Zhao Y and Fan X (2020) Stress Evolution in Punch-Through Shear Tests: A Numerical Study Based on Discrete Element Method. Front. Phys. 8:327. doi: 10.3389/fphy.2020.00327
Received: 19 April 2020; Accepted: 15 July 2020;
Published: 26 August 2020.
Edited by:
Longjun Dong, Central South University, ChinaReviewed by:
Allbens Picardi Faria Atman, Federal Center for Technological Education of Minas Gerais, BrazilDavy Dalmas, UMR5513 Laboratoire de Tribologie et Dynamique des Systèmes (LTDS), France
Copyright © 2020 Liu, Wan, Zhao and Fan. This is an open-access article distributed under the terms of the Creative Commons Attribution License (CC BY). The use, distribution or reproduction in other forums is permitted, provided the original author(s) and the copyright owner(s) are credited and that the original publication in this journal is cited, in accordance with accepted academic practice. No use, distribution or reproduction is permitted which does not comply with these terms.
*Correspondence: Jie Liu, bGp5ZHNsakAxNjMuY29t