 Chuantaidou Qiao
 Yi Xu2
 Weidong Zhao
 HongGuang Sun
- 1School of Resources and Environmental Engineering, Hefei University of Technology, Hefei, China
- 2State Key Laboratory of Hydrology-Water Resources and Hydraulic Engineering, College of Mechanics and Materials, Hohai University, Nanjing, China
- 3Shandong Luqing Safety Assessment Technology Co., Ltd., Jinan, China
Solute transport in a single vertical fracture (SVF) cannot be reliably described by the classical advection-dispersion equation (ADE) model, due to the heterogeneity nature of fracture. This study conducted a group of experiments to investigate chloride ion transport in the SVFs under different rough-walled conditions, and then applied a time fractional advection-dispersion equation (F-ADE) model to offer an accurate description. A comparison between F-ADE model and a classical ADE model in describing experimental data, was also carried out. Results show that the FADE model is better than the ADE model in describing the breakthrough curve and heavy-tail phenomenon of solute transport in the fracture. Especially in the experiments with lower flow rate and higher roughness fracture, the FADE model can offer a better description for non-Fickian transport, indicating that it is a promising tool for characterizing solute transport heterogeneous vertical fracture.
Introduction
Fracture water as part of underground water, is of great significance in water resources. It is closely related to the production and living activities of human beings and involves complex natural and human factors [1]. In heterogeneous media such as rock fractures, the assessment of solute transport in fractures can avoid overexploitation of groundwater resources and predict the diffusion of fluids and pollutants, which is one of the main tasks of hydrogeology [2, 3]. Therefore, quantifying pollutant transport in fractures has always been regarded as an important research topic [4, 5]. In recent years, how to quantitatively describe and experiment solute transport in fractured media has attracted more and more attention [6].
Until now, researchers have developed several theoretical and empirical models to quantify solute transport in fractured media [7–9]. But solute particles in heterogeneous media will have different retention zones due to the change of flow rate and space, then the classical solute transport model deviates from experimental results [10–13]. In many tests, the breakthrough curves (BTCs) showed anomalous and trailing phenomena, indicating that the classic advection-dispersion equation (ADE) model based on the average transport could not accurately describe these phenomena [14–17].
To overcome the drawbacks of classic ADE model, some researchers developed new models to simulate the non-Fickian transport [18–25]. For example, a continuous time random walk (CTRW) framework using a set of Langevin equations, has been used to approximate the random process of particle trajectory [18]. Qian et al. used the mobile-immobile (MIM) model to prove that it is better than the ADE model in describing the dispersion phenomenon of BTCs [19]. Fractional-order model has been used to describe the non-Fickian phenomenon of solute transport in recent decade. It describes the solute transport in residence zone by introducing fractional derivative operator in time. But there are only a few studies have been carried out in fractured media. Sun et al. [20] developed the time F-ADE model used to characterize sodium chloride transport in a single fracture and capture non-Fician transport. But the selection of model parameters and mechanism of anomalous transport have not been fully understood.
The objective of this study is to conduct a group of experiments to investigate chloride ion transport in the SVFs under different rough-walled conditions, especially observe the non-Fickian transport phenomena, and to establish a time fractional advection-dispersion equation (F-ADE) model to offer an effective description for the anomalous transport. This study includes the following contents. First, we introduce the experimental device and the experiment of NaCl transport in a single fracture, while the classic ADE model and fractional order model are provided. Then, we provide experimental analysis and discussion of experimental results with a comparison of the ADE model and the time F-ADE model. At last, some conclusions are given.
Materials and Methods
Experiment Description
In last century, some researchers have described breakthrough curves and concentration profiles, revealing the important effects of flow velocity, matrix porosity and matrix distribution coefficient on solute transport in fractures [26]. To investigate the solute transport in smooth and rough fractures under a single fracture, an experiment was conducted here. This experiment is composed by three parts: upstream water supply and downstream water discharge and single fracture. Some concentration measuring devices are also included.
According to the previous experimental design, the main body of the experimental design is cuboid, which is made of 6 mm plexiglass plate. In order to conduct multiple experiments, the width of cracks can be adjusted [27], and glass plates with different roughness can be attached to the walls of the plexiglass plate. To construct an artificial rough single crack, we select two types of plexiglass plates of coarse degree to stick the inner wall and ensured that the same rough surface of each test is parallel, with dimensions are 40 × 40 × 1 mm and 40 × 40 × 2 mm [28]. So, the thickness of the plywood is the concave-convex height of the crack, denoted by the symbol Δ. The relative roughness is Δ/e. Regarding the average fracture width e, a formula can be given
where, Volf represents the water volume in the fracture, h1 is the water level of the inlet of the fracture, h2 is the water level of theoutlet of the fracture, and l is the distance from the inlet of the fracture to the outlet.
In addition, to maintain the stability of water pressure at the inlet, the high-water tank is used for water supply in the test. The overflow tank is set in the water tank to keep the water level in the tank stable. In this way, the problem of unstable water pressure and flow due to voltage instability can be avoided in the water supply by the inlet pump to reduce the systematic error of the test. The flow meter is installed at both ends of the test device. By adjusting the flow meter valves at the inlet and outlet, the solute transport can be measured at different flow rates.
Methods
Experimental Method
First, we make the model according to the designed size, and then confirm the water tightness of the whole device is intact before further test. Second, adjust the upstream and downstream water tanks and fill them with water to stabilize the water level. The configured NaCl solution is then rapidly injected, and the timing starts. Samples were taken at regular intervals and the concentration was measured. Third, clean the equipment after every experiment. According to the above method, two kinds of experiments were carried out in the crack with different flow rate, different surface roughness and different crack width.
(1) Seven pulse tracer tests are successfully carried out under different hydraulic conditions and different fracture widths.
(2) Five experiments are carried out on the cracks under different occurrence conditions, including multiple gap widths, multiple relative roughness and multiple average flow rates.
Test Methods
NaCl solution is used as the tracer solution in this experiment. Since trace determination is needed, the conductivity method is selected for the determination within the permitted range of experimental conditions. Its basic principle is the conductivity of water and its inorganic acid, alkali, salt content has a certain relationship. When the concentration is low, the conductivity increases with the concentration, so this index can be used to predict the total concentration or salt content of ions in water. The solution concentration can be converted by measuring the conductivity of the solution and the background value of the conductivity of tap water. The conductivity used in the test has the function of temperature compensation, that is, regardless of the solution temperature, it can be automatically converted to the conductivity value at 25°C.
Before the experiment, a series of NaCl solutions with different concentrations were accurately prepared by using an electronic balance, and their conductivity values were measured [29]. Then, the standard curve equation is solved by using the least square method
Where c is the concentration of NaCl in g/L, EC is the electrical conductivity value in us/cm, and the correlation coefficient of the equation is 0.99977.
Model Methods
For many years, the advection—dispersion equation (ADE) based on Fick's law has been used to simulate the curve (BTCs) of solute transport in uniform media. For one-dimensional flow, the expression of ADE is
Where C is the solute concentration, D is the dispersion coefficient, v is the average flow rate, x is the solute transport distance, and t is the transport time. In recent years, fractional differential equations have been used more and more widely, which can better describe some natural physical phenomena and dynamic processes [30–32]. In the aspect of solute transport in groundwater, F-ADE model can be used to describe the non-Fickian phenomena and anomalous diffusion in solute transport [33, 34]. If time dependence is considered, the time FADE is established as
In the formula, α is the fractional derivative order. According to the experimental results of Sun et al. [20], because the time fractional derivative term can well-describe the influence of fracture heterogeneity, the time fractional derivative model can accurately describe the overall trend of BTCs, especially the phenomena of tail-dragging [35].
To evaluate the fitting results of the time fractional advection-dispersion equation, the root mean square error (RMSE) and the coefficient of determination (R2) are selected as the important parameters [36, 37]. RMSE is also known as the effective value [37], which is the square root of the square number of deviations between the predicted value and the true value and the ratio of n times of observation. R2 shows the extent to which all the explanatory variables included in the model affect the association of dependent variables. In this experiment, the closer the error value is to 0, the value of the coefficient is to 1, indicating that the fitting result is better. The expression is
where N is the number of individual observation points,Cio is the measured value of the concentration,Cie is the simulated value of the concentration, is the average value of the measured concentration.
Results and Discussion
Non-Fickian Transport of Solute in Smooth Fractures
In order to better observe the trailing phenomenon of solute transport, Figure 1(left) is the graph of test results after taking logarithm, and the right side is the graph of test results under normal coordinate system.
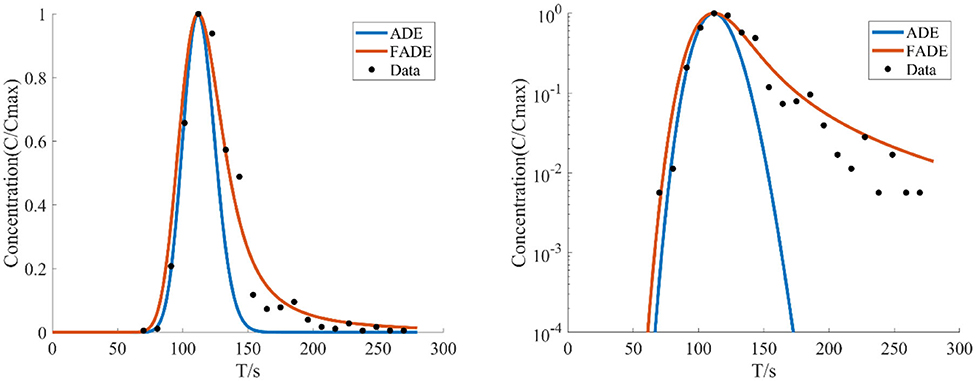
Figure 1. The average flow velocity is v = 6.785 mm/s, the crack width is B = 4 mm, and the breakthrough curves (BTCs) fitted by ADE model and FADE model is used.
Figures 1–4 show the fitting curves of different average flow rates for the same crack width B = 4 mm, and Table 1 shows the fitting results of the FADE model. The results show that the ADE model approximately presents a normal distribution, while the FADE model can well-describe the tail phenomenon of BTCs. It shows that the time fractional derivative has an obvious advantage in describing the non-Fickian phenomenon of solute transport. In addition, according to the observation, the fitting accuracy of the fade-away model is the highest at a lower average flow rate, indicating that the average flow rate plays an important role in characterization of the solute transport in fracture.
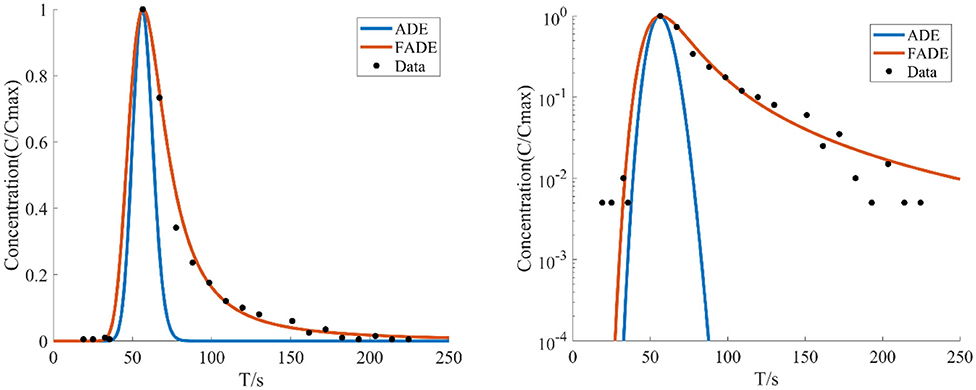
Figure 2. The average flow rate is v = 13.675 mm/s, the crack width is B = 4 mm, and BTCs fitted by ADE model and FADE model is used.
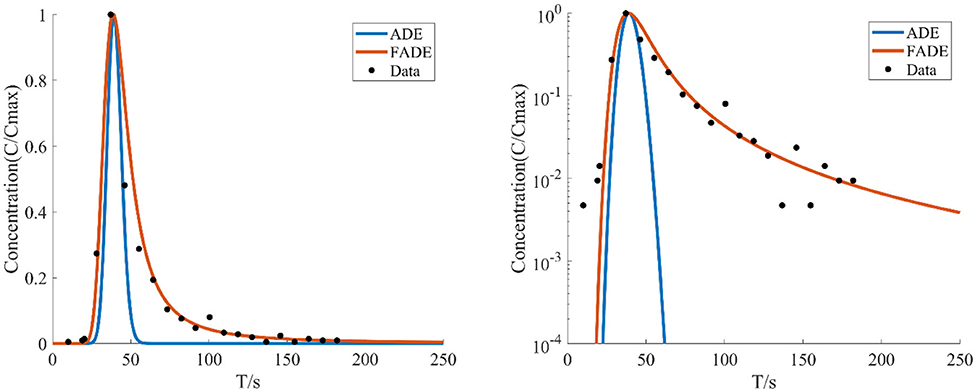
Figure 3. The average flow rate is v = 20.36 mm/s, the crack width is B = 4 mm, and BTCs fitted by using the ADE model and the FADE model.
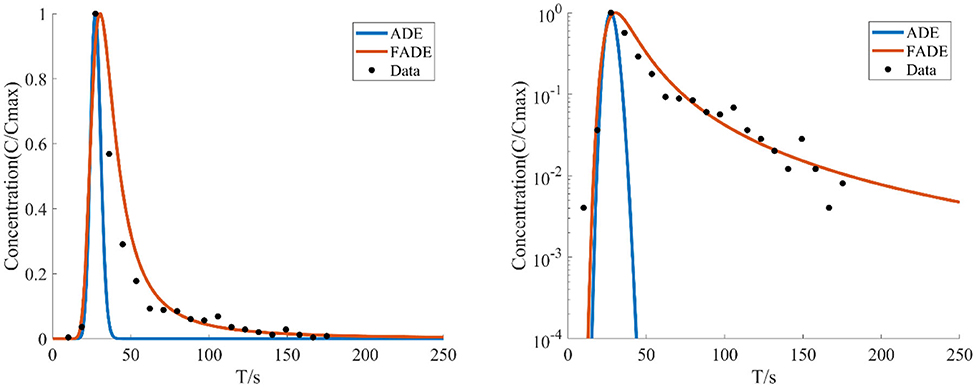
Figure 4. The average flow rate is v = 26.962 mm/s, the crack width is B = 4 mm, the BTCs are fitted by ADE model and FADE model.
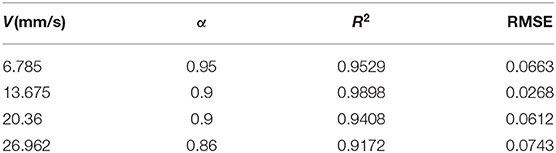
Table 1. Parameter fitting of the FADE model with fracture width of 4 mm at different flow rates.
Figures 5–7 show the fitting curve of similar low average flow rate with different fracture widths. Table 2 shows the fitting results of the FADE model with 4 types of fracture widths ranging from 4 to 9 mm. The results show, the peak arrival time of BTCs curve is gradually delayed and the peak duration is gradually prolonged with the increase of fracture width. Although the ADE model also offered an approximate trend, there is still a gap to the fitting results, while the FADE model is accurate. In addition, it is found that the FADE model provides a higher fitting accuracy in the smaller fracture widths, indicating that fracture width is also an important factor affecting the description of non-Fickian phenomena.
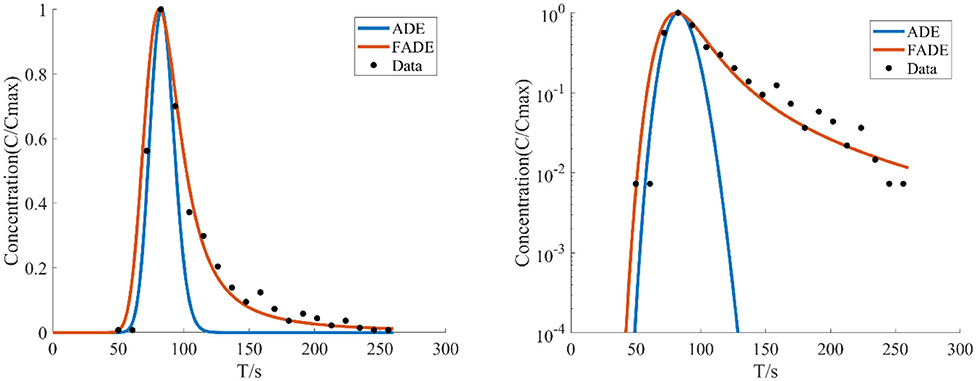
Figure 5. The average flow rate is v = 9.02 mm/s, the crack width is B = 6 mm, the BTCs are fitted by ADE model and FADE model.
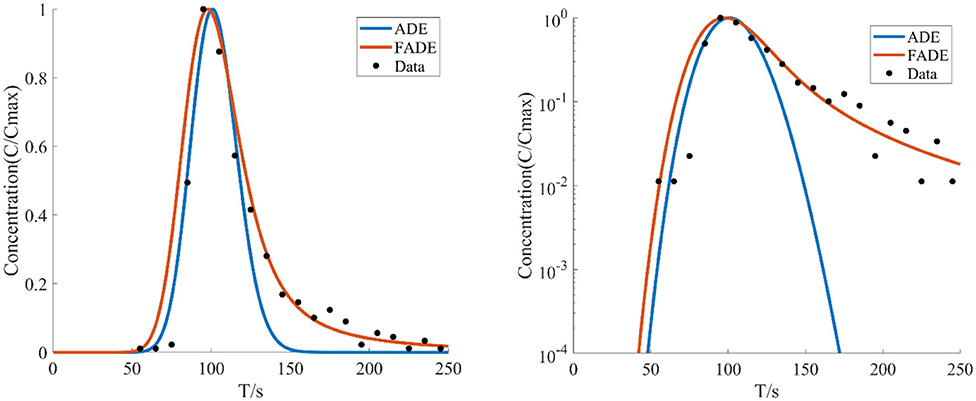
Figure 6. The average flow rate is v = 7.924 mm/s, the crack width is B = 7 mm, the BTCs are fitted by ADE model and FADE model.
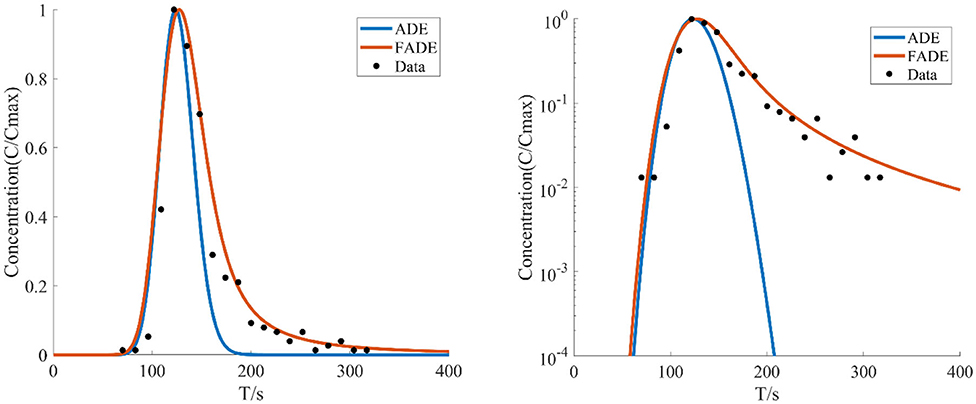
Figure 7. The average flow velocity is v = 6.161 mm/s, the crack width is B = 9 mm, the BTCs are fitted by ADE model and FADE model.
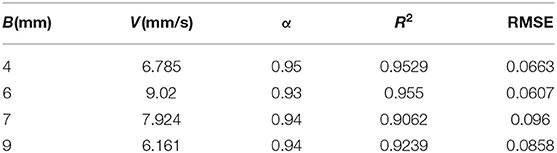
Table 2. Parameters of the FADE model with similar low average velocity and different fracture widths.
Non-Fickian Transport of Solute in Coarse Fractures
The First (Non-anastomosis) Experiment
Three experiments are conducted on the fracture pattern of a parallel plexiglass plate with a spacing of 6 mm and a length, width and height of 40 × 40 × 1 mm in the adhesion of a rough plastic plate (with a protuberance of 1 mm).
The Second (Non-anastomosis) Experiment
Three experiments are conducted on the fracture pattern of a parallel plexiglass plate with a spacing of 6 mm and a length, width and height of 40 × 40 × 2 mm in the adhesion of a rough plastic plate (with a protuberance of 1 mm).
Figures 8–12 show the fitting curves of the experimental results of two kinds of different fracture occurrence, while Table 3 shows the fitting results of the FADE model of the five groups of experiments. Under the same relative roughness condition, the peak arrival time of the medium and low average flow rate is gradually delayed, and the accuracy of ADE model description is reduced accordingly. However, it can be observed from Table 3 that the fitting accuracy of the FADE model is better. Under different roughness conditions, the higher the relative roughness value is, the better the fitting result of the FADE model in the experiment of low average flow rate is. It also indicates that the average flow rate and fracture roughness have significant influence on the non-Fickian phenomenon of solute transport in the fracture.
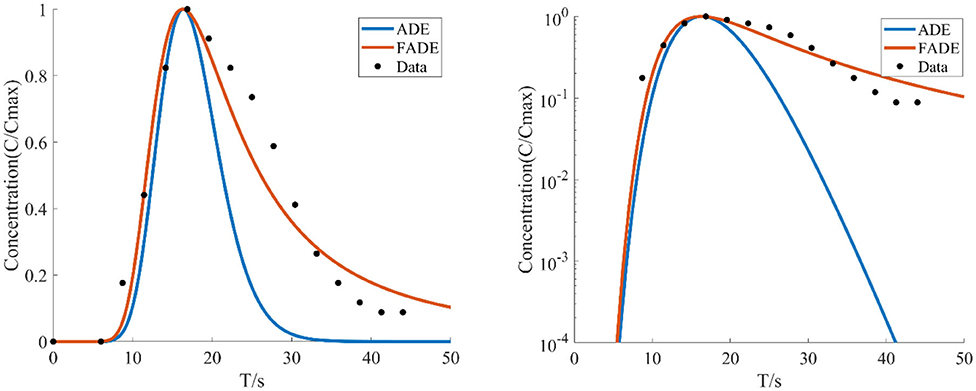
Figure 8. With the average flow velocity v = 40.5887 mm/s, the average fracture width is e = 4.9 mm, the concentration of the relative roughness Δ/e is 0.2041 test data, the BTCs are fitted by ADE model and FADE model.
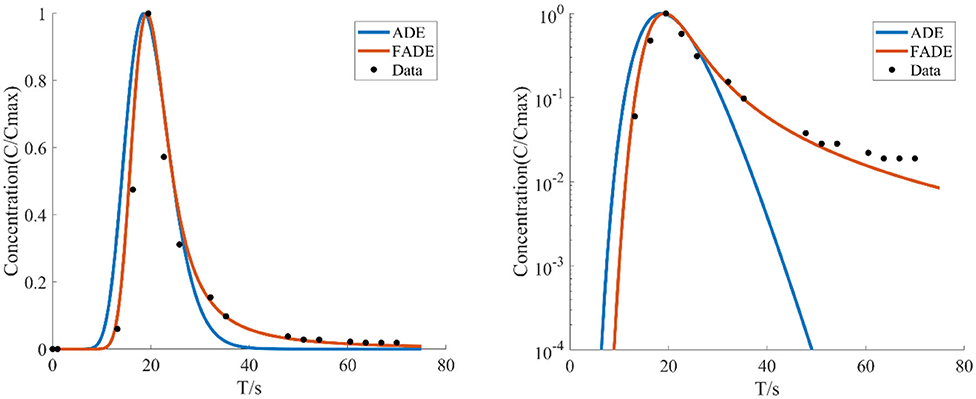
Figure 9. With the average flow velocity v = 31.2064 mm/s, the average fracture width is e = 4.9 mm, the concentration of the relative roughness Δ/e is 0.2041 test data, the BTCs are fitted by ADE model and FADE model.
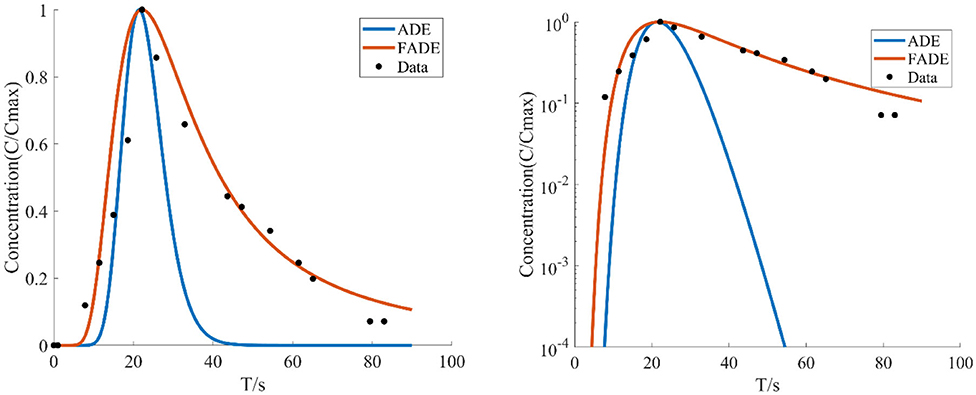
Figure 10. With the average flow velocity v = 23.3541 mm/s, the average fracture width is e = 4.9 mm, the concentration of the relative roughness Δ/e is 0.2041 test data, the BTCs are fitted by ADE model and FADE model.
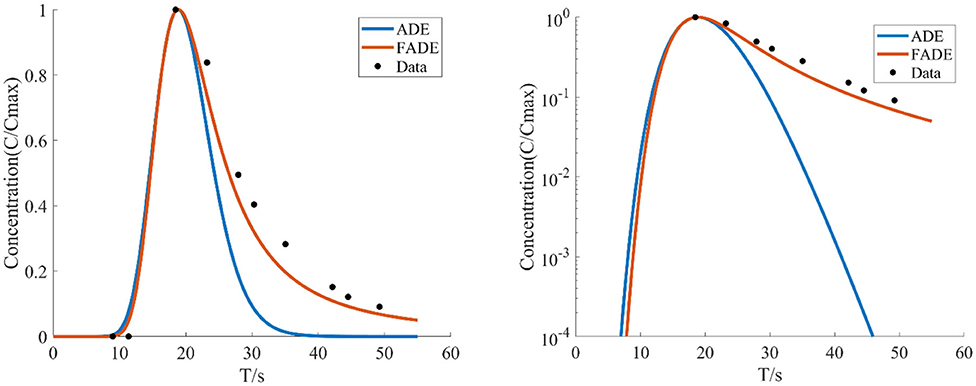
Figure 11. With the average flow velocity v = 22.5909 mm/s, the average fracture width is e = 4.5 mm, the concentration of the relative roughness Δ/e is 0.4444 test data, the BTCs are fitted by ADE model and FADE model.
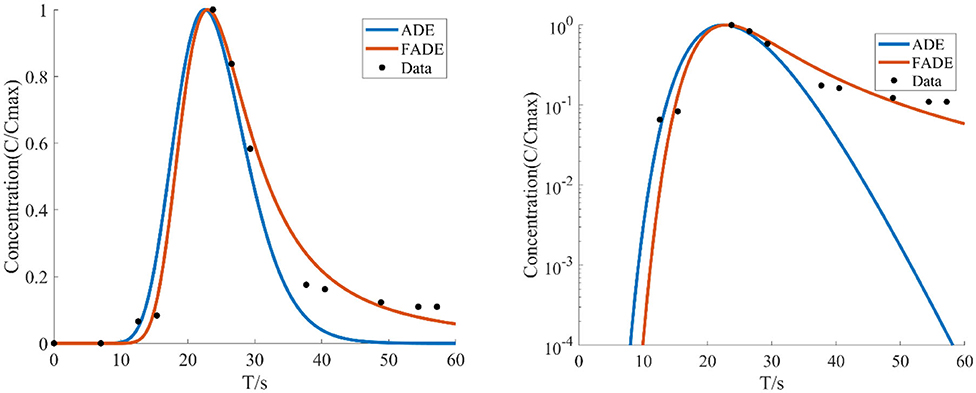
Figure 12. With the average flow velocity v = 18.0257 mm/s, the average fracture width is e = 4.5 mm, the concentration of the relative roughness Δ/e is 0.4444 test data, the BTCs are fitted by ADE model and FADE model.
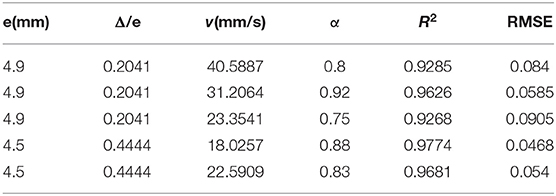
Table 3. Parameter fitting of the FADE model with different mean flow rates under two groups of same relative roughness fracture conditions.
Conclusions
Two groups of experiments, a total of 12 times for different flow velocity, roughness of fracture, the width of fracture condition were carried out. Non-Fickian phenomena of solute transport were clearly observed. According to the fitting results of BTCs diagram and numerical analysis, it is clear that the heavy-tail phenomena of BTCs can be well-captured and described by the FADE model, while the ADE model can only roughly describe the peak value of BTCs. In addition, we found that the BTCs peak of rough fracture reaches earlier than that of smooth crack, and the phenomenon of long tail is more obvious. Compared with the traditional ADE model, the FADE model has a great advantage in describing the anomalous transport in a single fracture under the conditions of rough fracture and low average flow rate. However, the main disadvantage of the FADE model is that it takes more computational time, which is caused by the inclusion of convolution integral in the model. In the future, we can also study the law of solute transport in porous media and a more complicated transport process of reactive solutes. Furthermore, there are still many problems for our model to be solved such as how to determine the fractional derivative order, non-linear modeling of the fractional order and so on. More and more theoretical analysis and complex experiments need to be carried out to study in depth.
Data Availability Statement
The original contributions presented in the study are included in the article/supplementary material, further inquiries can be directed to the corresponding author/s.
Author Contributions
CQ mainly responsible for model making, conducting experiments, and writing paper. YX was responsible for the analysis and processing of experimental data, and paper writing, etc. WZ was responsible for the overall design of the experiment and the guidance of the paper. JQ assists in the overall design of the experimental plan and the design of the paper. YW assists in the analysis and processing of experimental data, and paper writing, etc. HS directs experiments and paper writing. All authors contributed to the article and approved the submitted version.
Funding
This study was supported by National Natural Science Foundation of China (41831289; 41772250; and 41877191). The National Natural Science Foundation of China (41831289) received for open access publication fees.
Conflict of Interest
YW was employed by company Shandong Luqing Safety Assessment Technology Co., Ltd.
The remaining authors declare that the research was conducted in the absence of any commercial or financial relationships that could be construed as a potential conflict of interest.
References
1. Lee JY, Lee KK. Use of hydrologic time series data for identification of recharge mechanism in a fractured bedrock aquifer system. J Hydrol. (2000) 229:190–201. doi: 10.1016/s0022-1694(00)00158-x
2. Le Borgne T, Bour O, Paillet FL, Caudal JP. Assessment of preferential flow path connectivity and hydraulic properties at single-borehole and cross-borehole scales in a fractured aquifer. J Hydrol. (2006) 328:347–59. doi: 10.1016/j.jhydrol.2005.12.029
3. Manna F, Walton KM, Cherry JA, Parker BL. Mechanisms of recharge in a fractured porous rock aquifer in a semi-arid region. J Hydrol. (2017) 555:869–80. doi: 10.1016/j.jhydrol.2017.10.060
4. Malard F, Reygrobellet JL, Soulie M. Transport and retention of fecal bacteria at sewage-polluted fractured rock sites. J Environ Qual. (1994) 23:1352–63.doi: 10.2134/jeq1994.00472425002300060032x
5. Kreitler CW, Browning LA. Nitrogen-isotope analysis of groundwater nitrate in carbonate aquifers: natural sources versus human pollution. J Hydrol. (1983) 61:285–301.doi: 10.1016/0022-1694(83)90254-8
6. Wang M, Zhao WD, Garrard R, Zhang Y, Liu Y, Qian JZ. Revisit of advection-dispersion equation model with velocity-dependent dispersion in capturing tracer dynamics in single empty fractures. J Hydrodyn. (2018) 30:1055–63. doi: 10.1007/s42241-018-0134-2
7. Johns RA, Roberts PV. A solute transport model for channelized flow in a fracture. Water Resour Res. (1991) 27:1797–808. doi: 10.1016/0148-9062(92)92286-l
8. Tsang YW, Tsang CF, Hale FV, Dverstorp B. Tracer transport in a stochastic continuum model of fractured media. Water Resour Res. (1996) 32:3077–92. doi: 10.1029/96wr01397
9. Tsang YW, Tsang CF. Channel model of flow through fractured media. Water Resour Res. (1987) 23:467–79. doi: 10.1029/wr023i003p00467
10. Morales T, Uriarte JA, Olazar M, Antigüedad I, Angulo B. Solute transport modelling in karst conduits with slow zones during different hydrologic conditions. J Hydrol. (2010) 390:182–9.doi: 10.1016/j.jhydrol.2010.06.041
11. Marion A, Zaramella M, Bottacin-Busolin A. Solute transport in rivers with multiple storage zones: the STIR model. Water Resour Res. (2008) 44:W10406. doi: 10.1029/2008wr007037
12. Zhang Y, Benson DA, Reeves DM. Time and space nonlocalities underlying fractional-derivative models: distinction and literature review of field applications. Adv Water Resour. (2009) 32:561–81. doi: 10.1016/j.advwatres.2009.01.008
13. Roubinet D, De Dreuzy JR, Tartakovsky DM. Particle-tracking simulations of anomalous transport in hierarchically fractured rocks. Computers Geosci. (2013) 50:52–8.doi: 10.1016/j.cageo.2012.07.032
14. Pedretti D, Fernàndez-Garcia D, Bolster D, Sanchez-Vila X. On the formation of breakthrough curves tailing during convergent flow tracer tests in three-dimensional heterogeneous aquifers. Water Resour Res. (2013) 49:4157–73. doi: 10.1002/wrcr.20330
15. Dentz M, Cortis A, Scher H, Berkowitz B. Time behavior of solute transport in heterogeneous media: transition from anomalous to normal transport. Adv Water Resour. (2004) 27:155–73.doi: 10.1016/j.advwatres.2003.11.002
16. Chen Z, Qian JZ, Qin H. Experimental study of the non-darcy flow and solute transport in a channeled single fracture. J Hydrodyn. (2011) 23:745–51.doi: 10.1016/s1001-6058(10)60172-2
17. Tan YF, Zhou ZF. Simulation of solute transport in a parallel single fracture with LBM/MMP mixed method. J Hydrodyn. (2008) 20:365–72. doi: 10.1016/s1001-6058(08)60069-4
18. Srinivasan G, Tartakovsky DM, Dentz M, Viswanathan H, Berkowitz B, Robinson BA. Random walk particle tracking simulations of non-Fickian transport in heterogeneous media. J Comput Phys. (2010) 229:4304–14. doi: 10.1016/j.jcp.2010.02.014
19. Qian J, Zhan H, Chen Z, Ye H. Experimental study of solute transport under non-Darcian flow in a single fracture. J Hydrol. (2011) 399:246–54. doi: 10.1016/j.jhydrol.2011.01.003
20. Sun HG, Wang Y., Jiazhong Qian J, Zhang Y, Zhou D. An investigation on fractional derivative model in characterizing sodium chloride transport in a single fracture. Eur Phys J Plus. (2019) 134:440. doi: 10.1140/epjp/i2019-12954-9
21. Liu F, Anh VV, Turner I, Zhuang P. Time fractional advection-dispersion equation. J Appl Math Comput. (2003) 13:233–45. doi: 10.1007/bf02936089
22. Huang F, Liu F. The fundamental solution of the space-time fractional advection-dispersion equation. J Appl Math Comput. (2005) 18:339–50. doi: 10.1007/bf02936577
23. Benson DA, Meerschaert MM, Revielle J. Fractional calculus in hydrologic modeling: a numerical perspective. Adv Water Resour. (2013) 51:479–97. doi: 10.1016/j.advwatres.2012.04.005
24. Fomin SA, Chugunov VA, Hashida T. Non-Fickian mass transport in fractured porous media. Adv Water Resour. (2011) 34:205–14. doi: 10.1016/j.advwatres.2010.11.002
25. Suzuki A, Fomin SA, Chugunov VA, Niibori Y, Hashida T. Fractional diffusion modeling of heat transfer in porous and fractured media. Int J Heat Mass Transfer. (2016) 103:611–8.doi: 10.1016/j.ijheatmasstransfer.2016.08.002
26. Grisak GE, Pickens JF. Solute transport through fractured media: 1. The effect of matrix diffusion. Water Resour Res. (1980) 16:719–30. doi: 10.1029/wr016i004p00719
27. Qian JZ, Chen Z, Zhan HB, Luo SH. Solute transport in a filled single fracture under non-Darcian flow. Int J Rock Mech Mining Sci. (2011) 48:132–40. doi: 10.1016/j.ijrmms.2010.09.009
28. Qian J, Chen Z, Zhan H, Guan H. Experimental study of the effect of roughness and Reynolds number on fluid flow in rough-walled single fractures: a check of local cubic law. Hydrol Proc. (2011) 25:614–22. doi: 10.1002/hyp.7849
29. Peyman A, Gabriel C, Grant EH. Complex permittivity of sodium chloride solutions at microwave frequencies. Bioelectromagnet J Bioelectromagnet Soc. (2007) 28:264–74.doi: 10.1002/bem.20271
30. Chen Y, Yi M, Yu C. Error analysis for numerical solution of fractional differential equation by Haar wavelets method. J Comput Sci. (2012) 3:367–73. doi: 10.1016/j.jocs.2012.04.008
31. Xu M, Tan W. Intermediate processes and critical phenomena: theory, method and progress of fractional operators and their applications to modern mechanics. Sci China Series G. (2006) 49:257–72.doi: 10.1007/s11433-006-0257-2
32. Shang YL. Vulnerability of networks: fractional percolation on random graphs. Phys Rev E Stat Nonlin Soft Matter Phys. (2014) 89:012813. doi: 10.1103/PhysRevE.89.012813
33. Atangana A, Kilicman A. Analytical solutions of the space-time fractional derivative of advection dispersion equation. Math Probl Eng. (2013) 2013:1–9. doi: 10.1155/2013/853127
34. Garrard RM, Zhang Y, Wei S, Sun H, Qian J. Can a time fractional-derivative model capture scale-dependent dispersion in saturated soils. Groundwater. (2017) 55:857–70.doi: 10.1111/gwat.12532
35. Sun H, Chen W, Li C, Chen Y. Fractional differential models for anomalous diffusion. Physica A Statist Mech Appl. (2010) 389:2719–24. doi: 10.1016/j.physa.2010.02.030
36. Wang W, Lu Y. Analysis of the mean absolute error (MAE) and the root mean square error (RMSE) in assessing rounding model. In: IOP Conference Series: Materials Science and Engineering. Kuala Lumpur: IOP Publishing (2018). doi: 10.1088/1757-899x/324/1/012049
Keywords: solute transport, single vertical fracture, fractional advection-dispersion equation, non-Fickian transport, hydrodynamics, hydraulic condition
Citation: Qiao C, Xu Y, Zhao W, Qian J, Wu Y and Sun H (2020) Fractional Derivative Modeling on Solute Non-Fickian Transport in a Single Vertical Fracture. Front. Phys. 8:378. doi: 10.3389/fphy.2020.00378
Received: 05 June 2020; Accepted: 05 August 2020;
Published: 11 September 2020.
Edited by:
Jagdev Singh, JECRC University, IndiaReviewed by:
Antonella Lupica, University of Tuscia, ItalyYilun Shang, Northumbria University, United Kingdom
Copyright © 2020 Qiao, Xu, Zhao, Qian, Wu and Sun. This is an open-access article distributed under the terms of the Creative Commons Attribution License (CC BY). The use, distribution or reproduction in other forums is permitted, provided the original author(s) and the copyright owner(s) are credited and that the original publication in this journal is cited, in accordance with accepted academic practice. No use, distribution or reproduction is permitted which does not comply with these terms.
*Correspondence: Weidong Zhao, emhhb3dkQGhmdXQuZWR1LmNu; Jiazhong Qian, cWlhbmppYXpob25nQGhmdXQuZWR1LmNu