 Kaimin Wang1
 Zhaorui Wang1
 Chunyan Bai1Leihong Zhang1Bo Dai1Yuxing Zhang1
 Hualong Ye1
 Zhisheng Zhang1
 Xiaoxuan Han1Tong Xue1Meiyong Xu2Jiafeng Hu3Xiangjun Xin2
 Dawei Zhang1*
- 1Ministry of Education and Shanghai Key Lab of Modern Optical System, Engineering Research Center of Optical Instrument and System, University of Shanghai for Science and Technology, Shanghai, China
- 2School of Electronic Engineering, Beijing University of Posts and Telecommunications, Beijing, China
- 3School of Physics and Electronics, East China Normal University, Shanghai, China
Ghost imaging is a novel imaging technique that has various advantages over traditional imaging. However, most of the existing works on this technique do not achieve a better resolution than the diffraction limit. In this work, we presented a ghost imaging system with plasmonic structure illumination microscopy that achieved super-resolution imaging. The resolution reaches three to four times of the diffraction limit with surface plasmon polaritons and structure illumination microscopy theory. Since it can produce super-resolution images, this method has important implications in medical fields, such as in microimaging and endoscopy. We used the gamma–gamma intensity-fluctuation model to simulate the ghost imaging system in an atmospheric turbulence channel. By setting proper values of the transmission distance and refractive-index structure parameter, we obtain the peak signal-to-noise ratio (PSNR) performance and symbol-error rate (SER) performance. Finally, the PSNR and SER are used to evaluate the imaging quality, which provides a theoretical model to research the ghost-imaging algorithm further.
Introduction
Ghost imaging is a new quantum imaging technology that advances with the development of quantum technology. It utilizes the properties of quantum entanglement to achieve non-local image transmission [1]. Ghost imaging has various advantages over traditional optics due to the existence of correlation characteristics, such as anti-interference ability, weak optical imaging capability [2–4], and encryption capability. However, since ghost imaging is transmitted through the optical path, the resolution remains limited by optical diffraction conditions.
Ghost imaging has attracted significant attention in the field of image transmission [1–12]. It has been continuously developed in recent years, from entangled photon pair [1] to thermal sources [5], from traditional ghost imaging to computational ghost imaging (CGI) [6]. In addition, many improved methods have been proposed, such as compressed sensing [7] and differential correlation imaging [8]. With the improvement of image quality, super-resolution imaging has always been a focus of research. Ermeydan et al. proposed a millimeter-wave-based compression-sensing super-resolution algorithm [9]. A new compressive imaging approach using a strategy called cake cutting, which optimally reorders the deterministic Hadamard basis, is also reported [10]. Deep learning with computational correlation imaging was combined to achieve super-resolution [11]. These ghost imaging super-resolution methods perform super-resolution imaging at the software level, such as encoding and restoration algorithms; however, they have not been improved from the hardware level. Recently, two colors of light were used for imaging to achieve super-resolution, which refers to two-photon microscope imaging [12].
Plasmonic structure illumination microscopy (PSIM) is a super-resolution imaging technology with great research value. As a combination of structure illumination microscopy (SIM) technology and dynamically controllable surface plasmon polaritons (SPPs) field, it can improve the resolution significantly. It has the advantages of super-resolution, wide field, and fast imaging [13, 14], which has been used in the super-resolution enhancement of Raman spectral signals [15]. Combining the above two technologies, one can design a method for detecting or imaging objects in the micro- or nanoscale.
In this study, we applied PSIM to ghost imaging to achieve super-resolution imaging. The ghost imaging is based on the surface-to-point single image transmission of the CGI. After the process of encoding, transmittance, reception, and reconstruction, the final resolution can reach three to four times of the diffraction limit. This work has great implications in biomedical fields such as microscopic imaging and endoscopy.
The rest of this paper is organized into three sections: The theories of ghost imaging, PSIM, and atmospheric turbulence channel are presented in Theory of Computational Ghost Imaging, Theory of Plasmonic Structure Illumination Microscopy, and Theory of Atmospheric Turbulence Channel Model, respectively. Theory of Ghost Imaging Based on Plasmonic Structure Illumination Microscopy contains the scheme for the ghost imaging system under the gamma–gamma atmospheric turbulence channel. The results of the peak signal-to-noise ratio (PSNR) and symbol-error rate (SER) simulations and the measurement of the performance of proposed scheme are presented in Simulation and Results. The PSNR and SER performance are determined by the refractive-index structure parameter and the transmission distance d, as further discussed in Analysis of the Influence under Different Conditions of Transmission Distance and Analysis of the Influence under Different Conditions of Refractive-Index Structure Parameter. The conclusion of this research is presented in Conclusion.
Theory
Theory of Computational Ghost Imaging
Ghost imaging is a new type of imaging technique; it can acquire the target image information non-locally by calculating the intensity correlation function between the reference light and the detection light. It is also known as correlated imaging or two-photon imaging. Unlike classical optical imaging, ghost imaging can be independent of the light speed. This is an important feature of ghost imaging, which distinguishes quantum optics from classical theory.
Traditional ghost imaging requires two optical paths. The requirement will cause some operational problems, such as experimental difficulties and large space occupation. To solve these problems, Shapiro proposed CGI [16], which was further improved by Bromberg et al. [17]. Instead of rotating the ground glass, they applied a spatial light modulator to simplify the two light paths into one. Then, Duarte successfully realized CGI with the digital micromirror device (DMD) [18]. The schematic of CGI is shown in Figure 1.
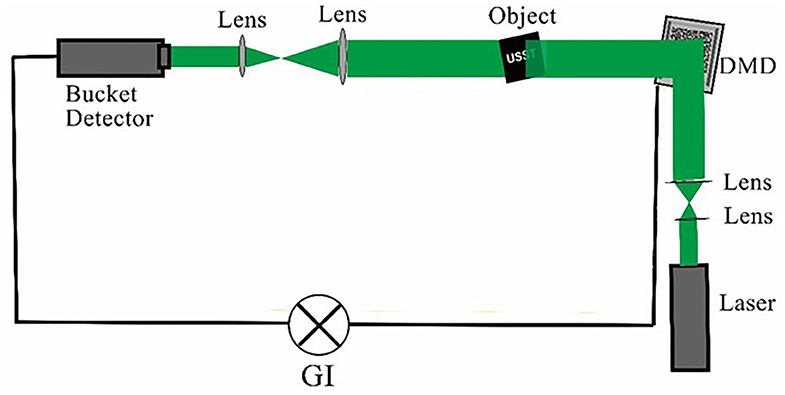
Figure 1. Schematic of computational ghost imaging system, which consists of laser digital micromirror device (DMD) and bucket detector.
The two most important devices in CGI are the digital micromirror device (DMD) and the bucket detector [19]. The device modulates the light from the laser by loading a series of random modulation matrices φi (x, y) onto the DMD. Then, the light is transmitted through the object T (x, y) and detected by the bucket detector (only the total light intensity of the transmitted object is detected, without any resolution). The total intensity Ri, where i refers to the sample number, is calculated as
After sampling N times, the modulation matrix and the value from the bucket detector are correlated. Finally, the image of the object is reconstructed. The correlation function CCGI (x, y) is expressed as [20]:
Here, 〈R〉 is the average value of light intensity.
Theory of Plasmonic Structure Illumination Microscopy
The plasmonic structure illumination microscopy technology is a proposed far-field super-resolution microimaging technology that has been gaining attention in recent years. It has the characteristics of wide field, super-resolution, and fast imaging; therefore, it is of great research value with excessive application prospects. The development of PSIM was inspired by two technologies, namely, surface plasmon polaritons and structure light imaging. Both can improve the imaging resolution; however, the principle of improving the resolution is different. For instance, to improve the resolution, the former breaks through the diffraction limit by the wavelength of SPPs, while the latter uses the high-frequency information through the structure algorithm. Therefore, combining the two techniques can further improve the resolution of the imaging.
Theory and Excite Method of Surface Plasmon Polaritons
SPPs are a type of collective oscillation electromagnetic mode formed by the resonance of photons and free electrons in a metal surface—that is, it is a mixed excited state formed by the coupling of electrons and photons [21]. SPPs are a surface wave propagating along the metal surface, and its field strength decays exponentially in the direction perpendicular to the surface. Due to the characteristics of breaking the diffraction limit, near-field enhancement, and surface localization, SPPs has a wide application prospect in optical imaging, super-resolution nano-lithography, micro–nanophotonics, information processing, biomedical, and other fields [22]. As a result, it has attracted much attention in the past decade.
SPPs are the electromagnetic field generated by the resonance coupling: when light waves are incident on the interface between metal and other media, the oscillation frequency of the electrons is consistent with the frequency of the incident light waves; then, resonance occurs and forms a special surface electromagnetic mode that strengthens the incident field by several orders of magnitude. SPPs is a mixed mode of surface electromagnetic waves and free-electron oscillations generated by the interaction between light and metal on the metal surface, as shown in Figure 2. The wavelength of the light passing through the SPPs is smaller than that of the incident light.
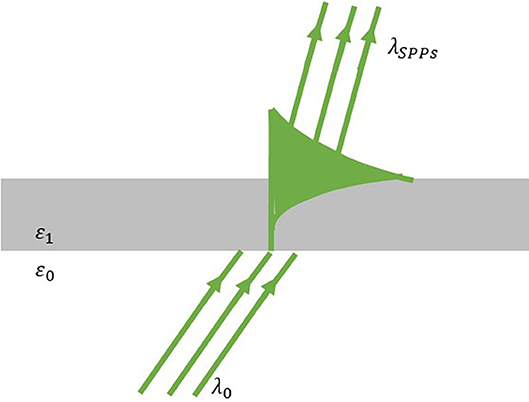
Figure 2. Schematic for surface plasmon polaritons (SPPs) at the metal–dielectric interface.
However, the incident beams cannot be directly coupled to form the SPPs on the metal surface. According to the dispersion equation of the SPPs on the semi-infinite metal–dielectric interface [23], in the range of visible and near-infrared wavelengths, the wave vector of the SPPs is larger than that of the light in free space. Therefore, to excite SPPs effectively, the wave vector of the excitation beam must be compensated to match the wave vector of the SPP. The wave vector matching is the key condition for SPPs excitation. Commonly used excitation methods for SPPs are the prism coupling method, near field scattering excitation method, tight focus excitation method, and grating excitation method, which are shown in Figure 3.
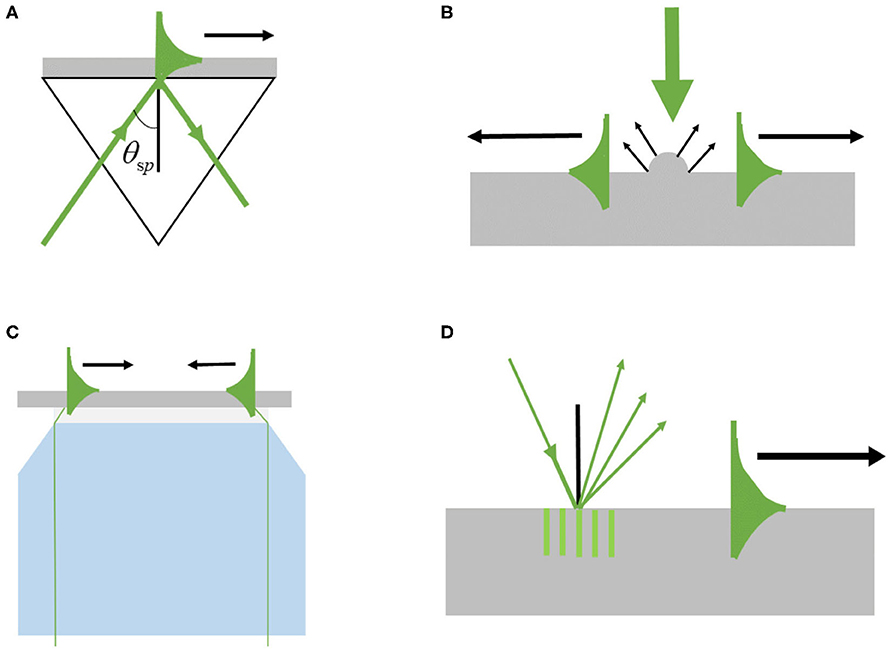
Figure 3. Common excitation methods for surface plasmon polaritons (SPPs). (A) Prism-coupled excitation; (B) Near-field scattering excitation; (C) Tight focus excitation; (D) Grating excitation.
Prism coupling method [24] is a simple and effective method with the advantages of low loss and high coupling accuracy. It is widely used in the field of biophotonics sensing. However, the size of the system is too large to be applied to optical integrated devices. The method of near-field scattering excitation [25] can realize the excitation of SPPs without being restricted by the wave vector matching conditions. The principle of the tight focus coupling is that a high numerical aperture microscope objective is utilized to increase the incident angle of the excitation beam. If the maximum incident angle is greater than the total reflection angle, SPPs can be excited on the metal surface by part of the light field satisfying the excitation condition [26]. Because it can be integrated with traditional microscopy systems and the metal film can be replaced at any time, it is widely used in imaging. The method of grating coupling excitation adds an additional grating vector to the wave vector in free space. This method excites SPPs with high efficiency, and the compact structure allows the grating to be applied to photoelectric surface plasma devices [27]. In this study, the grating excitation method with a slit array is used to excite SPPs.
The SPPs waves propagating along the interface between metal and air can be generated by exciting the grating. When the z-direction is defined to be perpendicular to the air–metal interface, the z-component of the SPPs wave at distance r along the x–y plane can be expressed as [28–30]
where ω is the angular frequency of the incident beam, ϕSPP is the phase of the SPPs wave, and kSPP is the SPPs wave vector.
According to Equation (3), two counter-propagating SPP waves are generated through exciting two independent parallel gratings and interfere with each other in the middle area to form an SPPs standing wave. When the distance between the two gratings is 2r, the expression of SPPs standing wave is [31]
where E0 = ESPP exp (−r/2LSPP) exp [i (kSPPr − ωt)], and ϕSPP1 and ϕSPP2 are the phases of the two SPPs waves, respectively. From Equation (4), the electric field intensity of the SPPs standing wave at the center of the structure depends on the phase difference of the two SPPs waves. However, the phase difference of the SPPs wave is related to the phase difference of the incident beam. When two gratings are illuminated by two beams with the same polarization directions, respectively, the phase difference between two SPPs waves can be expressed as
where ϕ1 and ϕ2 are the phases of the two excitating beams, respectively. It can be seen from Equation (5) that the SPPs standing wave can be dynamically moved by adjusting the phase of the incident beams. In addition, because two SPPs wave propagate in the opposite directions and with the same field strength, the transverse electric field components from two SPPs waves will counteract. The light intensity of the standing wave can be expressed as
Therefore, based on the characteristics of the breaks, diffraction limit, field enhancement, and flexible movement, the SPPs standing wave can be combined with SIM technology to improve the resolution of imaging further.
Principles of Structure Illumination Microscopy
SIM is a far-field super-resolution optical imaging technology. By employing specific structured light as the illuminating light, it can obtain high-frequency information and break the diffraction limit. Structure illumination imaging technology was first realized by adding a sinusoidal grating in the illumination light path [32], and the piezoelectric ceramic controller was used to move the grating to achieve the phase shift of the structured light; however, this mechanical moving device reduced the stability of the system. In the later stage, the spatial light modulator [33–35] and digital micromirror device [36], which can be controlled dynamically, are used instead of the grating to realize structured light illumination. Structured light illumination has the ability of tomographic imaging; it uses the moire fringes formed by the frequency components of structured light and sample to improve the resolution. By irradiating the object with the structure light modulated by space, encoding the high-frequency information of the object field space, and extracting the high-frequency information by calculation, the resolution can be increased to twice the diffraction limit frequency. Note that the imaging resolution value and the structure light wave vector are positively correlated; therefore, increasing the structure light wave vector improves the system's ability to receive high-frequency information, which also improves the spatial resolution of the imaging.
Because the structured light illumination frequency and source image frequency are both limited by the system's diffraction limit frequency, the output of the system is expressed as [37]:
where I0 is the average intensity, φ is the initial phase, and k0 is the fringe spatial frequency (reciprocal of the fringe period). D (k) represents the information recorded by the CCD, where DN is the low-frequency information, which reflects the outline of the object; DN− and DN+ are high-frequency information, which reflect the details of the object.
The SIM system obtains the mixed information of low- and high-frequency information beyond the diffraction limit. To recover the image, the low-frequency and two high-frequency information should be separated first, and then, the high-frequency information should be moved back to the corresponding position and fused with the low-frequency information. Finally, the super-resolution image can be recovered using a deconvolution operation [38]. Due to the need for separating the spectrum components, the phase is evidently the most appropriate modulation parameter. The reconstruction of SIM with three different initial phases are expressed as [39]:
After the reconstruction of the SIM algorithm, the maximum spatial frequency of the system can reach twice the diffraction limit. However, it is only scanning in a single direction that may lead to information leakage. Generally, SIM reconstruction will be carried out again in the intersection direction to realize the information reconstruction of the whole plane. Finally, the resolution will be doubled.
Basic Principles of Plasmonic Structure Illumination Microscopy
PSIM, combining SIM technology with SPPs, can resolve the resolution of traditional SIM without the help of non-linear effects. The resolution is increased from two times the traditional diffraction limit frequency to three to four times. The SPPs interference fringes are stable standing wave field generated by the interference of two SPPs waves propagating in opposite directions. The fringe period depends on the SPPs wavelength. Because the SPPs wavelength can be much smaller than the wavelength of free space light, the period of the SPPs interference fringes is much smaller than the diffraction limit. Therefore, it can be used as a structured light field that breaks through the diffraction limit and applied to the SIM imaging system. Consequently, as a new type of super-resolution wide-field microscopic imaging technology, PSIM combining the advantages of SIM and SPPs can further improve the imaging resolution [33–35, 40–43]. The design of horizontal and vertical excitation modes on the excitation medium can meet the imaging requirements of SIM in the plane space so that SPPs and SIM can be combined to achieve better super-resolution imaging effects.
The wavelength of the SPPs can be calculated as [31]:
where λ0 is the wavelength of the excitation source, ε0 is the dielectric constants of the air, and is the real part of the dielectric constants of metal.
According to Equation (9), we can calculate the wavelengths of the SPPs. The SPPs are obtained by utilizing various metals and material. Then, by the SIM system, we can finally improve the resolution, as well as obtain the enhancement on spatial resolution. The results of enhancement in different materials and light source wavelengths are given in Table 1; Ag and Al2O3 are used in this work. The enhancement on spatial resolution is 3.86 times.
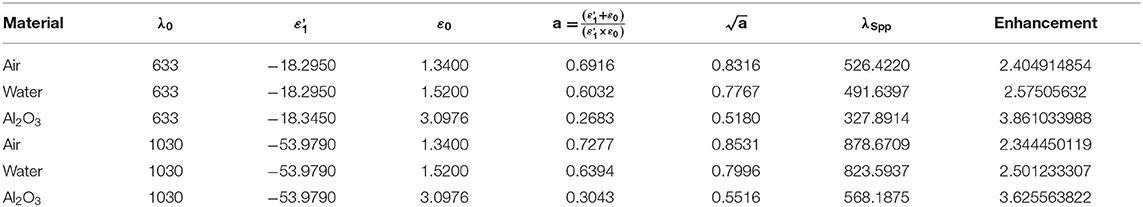
Table 1. Multiple of plasmonic structure illumination microscopy (PSIM) and diffraction limit of silver in different materials and wavelengths.
Theory of Ghost Imaging Based on Plasmonic Structure Illumination Microscopy
The super-resolution ghost imaging based on plasmonic structure illumination microscopy is abbreviated as PSIM-GI. The system schematic is shown in Figure 4. The light from the light source is radiated to the DMD through the lens, filter, and 4f system. After being modulated by the structured light algorithm, it is radiated to the object platform composed of the metal film, which excites SPPs and irradiates to the detection object. After passing through the object, the light is converged by the objective lens, irradiated to the DMD for correlation modulation and emission. Finally, the light is received by the bucket detector. After demodulating and reconstructing the information received by the bucket detector, the super-resolution object image is finally obtained.
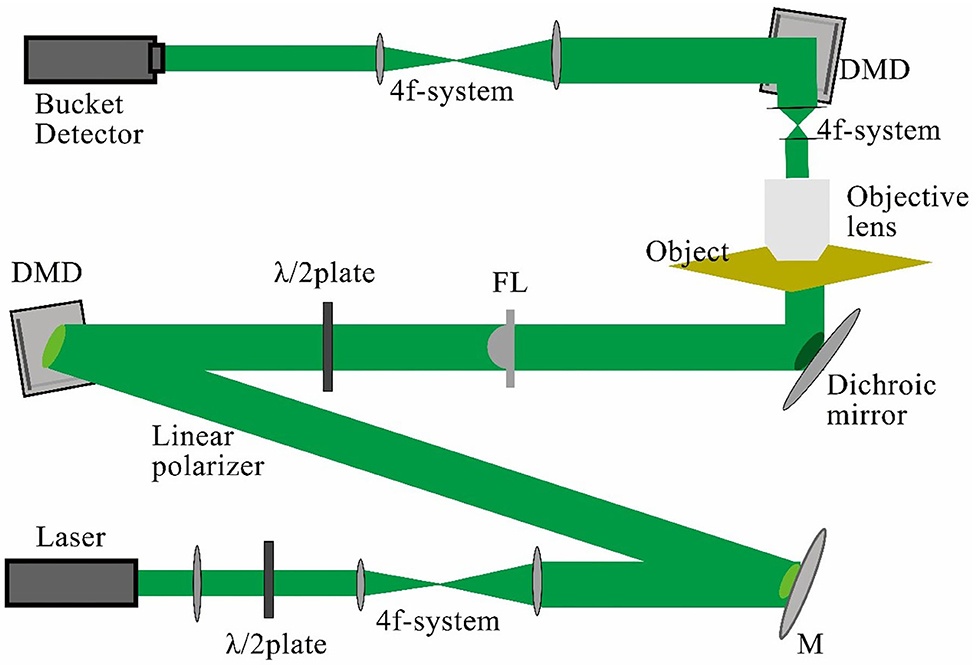
Figure 4. Schematic of ghost imaging based on plasmonic structure illumination microscopy (PSIM-GI) system.
The correlation function of PSIM-GI can be written as:
where {T} is the fusion of high- and low-frequency information in the image by the SIM algorithm.
Theory of Atmospheric Turbulence Channel Model
The ghost imaging system propagates by light and is inevitably affected by atmospheric turbulence when it is transmitted in the atmosphere. It is of great practical significance to study the influence of atmospheric turbulence on the error performance of the ghost imaging system. The atmospheric turbulence occurs because of the changes in the upper atmosphere's pressure and temperature, which are influenced by wind and other factors, which causes the intensity fluctuations of the received signal. In a ghost imaging system, the total intensity of the transmission image is received by the bucket detector, so the phase of each pixel in the image is not a concern. Therefore, we apply the intensity distribution model to simulate turbulence. The gamma–gamma model is a classical model to describe light-intensity distribution. It is suitable for a broad range of turbulences (from weak to strong). In addition, both large- and small-scale intensity fluctuations can be described by a gamma–gamma distribution. The gamma–gamma distribution is given as [44].
where I refers to the intensity of the channel output, under the intensity of the channel output value being 1.
In Equation (14), k = 2π/λ is the optical wave number, λ is the wavelength, d is the transmission distance, and is the refractive-index structure parameter that describes the degree of atmospheric refractive-index fluctuation.
According to the H–V model of International Telecommunication Union (ITU)-R, the relationship between and altitude h can be expressed in Equation (15) [45, 46].
In Equation (15), the conditions are set as follows: the root mean square on the vertical path vRMS = {11, 21, 31} and the refractive-index structure parameter near the ground plane . When h is lower than 4,000 m, we find that is approximately invariant with vRMS; in this case, is considered constant. The values of under different degrees of the turbulence are as follows:
= 10−17 for weak turbulence
= 10−15 for moderate turbulence
= 10−13 for strong turbulence
When gamma–gamma turbulence is added, the received light intensity formula, in Equation (1), of ghost imaging becomes:
where ϑi (x, y) is multiplicative noise with a gamma–gamma distribution.
Simulation and Results
We simulated the PSIM-GI system according to the above principles. We used PSNR and symbol-error rate (SER) to measure the quality of the reconstructed image and the error performance of the system.
PSNR is the most common objective evaluation index that is an objective evaluation indicator for image quality. PSNR is typically used for comparison of the maximum of the signal to the background noise. The larger the PSNR value, the less the distortion, and the better the quality of the image. PSNR can be calculated using the following equations
Here, MSE is the mean square error between the compared image and the original image, and , indicating the maximum value of the image's color; for grayscale images, k is 8 bits.
SER is also an indicator of the accuracy and reliability of a transmission system. It is defined by the percentage of misclassified symbols [47] expressed as
In this article, Equation (19) is specified as
NOUTxy−INxy is the number of input and output pixels with a nonzero difference; n is the difference between pixels. When the difference between output and input is less than n, we define output to be equal to the input. c*r is the total number of pixels.
Simulation and Results of PSIM-GI
The finite difference time domain (FDTD) method is utilized to simulate the excitation of the SPPs. The diagram of the SPP excitation is shown in Figure 5: the simulation area is indicated by (A); the silver film with the thickness of 120 nm is indicated by (B); two slits etched on the silver film are indicated by (D); and the layer of Al2O3 with thickness of 50 nm is indicated by (C). Two excitation sources with horizontally polarization directions and wavelength of 633 nm are indicated by (E). The excitation sources are used to illuminate two slits normally from the front side, respectively. An SPP standing wave is generated by the interference of two counter-propagating SPPs at the center of the structure. A linear monitor at 20 nm above the silver surface with length of 3 μm is used to obtain the electromagnetic field distribution of the SPP standing wave. The intensity distribution of the SPP standing wave from −1.5 to 1.5 μm is shown in Figure 6. It can be calculated that the full width at half maximum (FWHM) of the standing wave is 133 nm, which demonstrated that the wavelength of the SPPs is shorter than the excitation sources. The SIM uses a dynamically controllable DMD instead of the grating to generate horizontal and vertical modulation fringes, as shown in Figure 7A. The modulated structured light irradiates and modulates the object, encodes the high-frequency information of the object in the spatial domain, and uses the moire fringes formed by the structured light frequency and object frequency components to improve the resolution and achieve structure illumination microscopy imaging. The light passing through the object after modulation is shown in Figure 7B. The schematic diagram of the wave vector space of imaging is shown in Figure 8A. The object that we used in this study is a grayscale image of negative-stained 2019-nCoV particles [48], as shown in Figure 8B. Then, high-frequency information is calculated and extracted to achieve super-resolution imaging. Finally, super-resolution imaging is achieved. The resolution is increased to three to four times of the diffraction limit frequency.
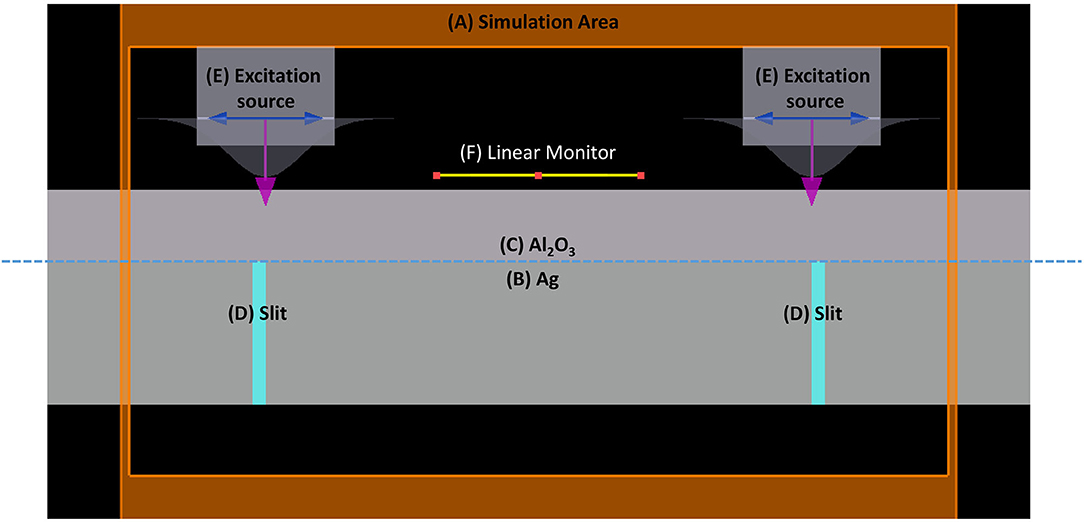
Figure 5. The diagram of surface plasmon polaritons (SPPs) excitation by two slits structure: (A) simulation area, (B) Ag film, (C) layer of Al2O3, (D) slits, (E) excitation sources, and (F) linear monitor.
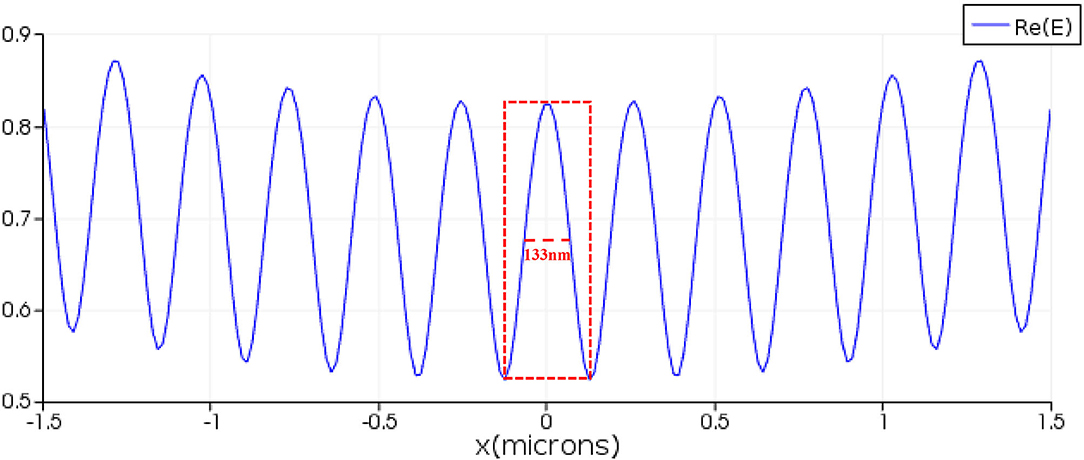
Figure 6. The electromagnetic field distribution of the surface plasmon polariton (SPP) standing wave.
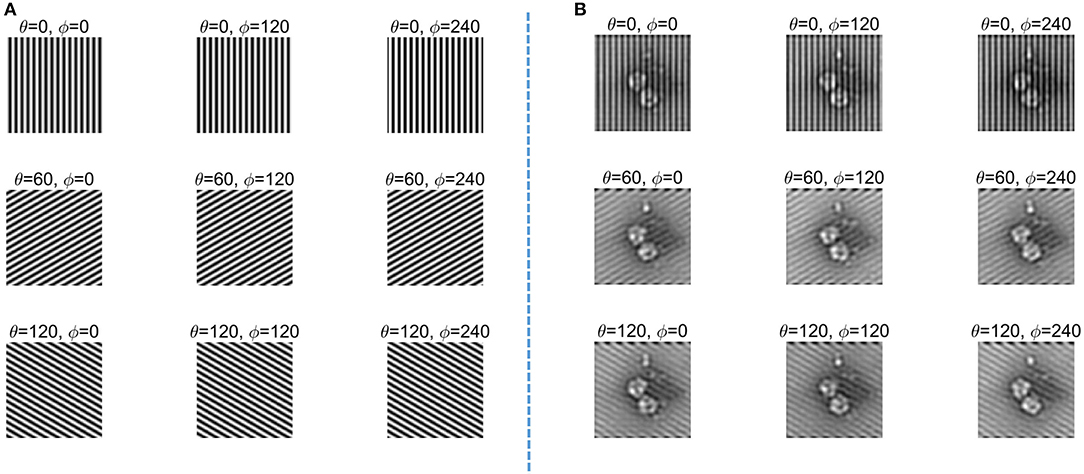
Figure 7. (A) Structure illumination microscopy (SIM) modulation fringes. (B) Modulated object image.
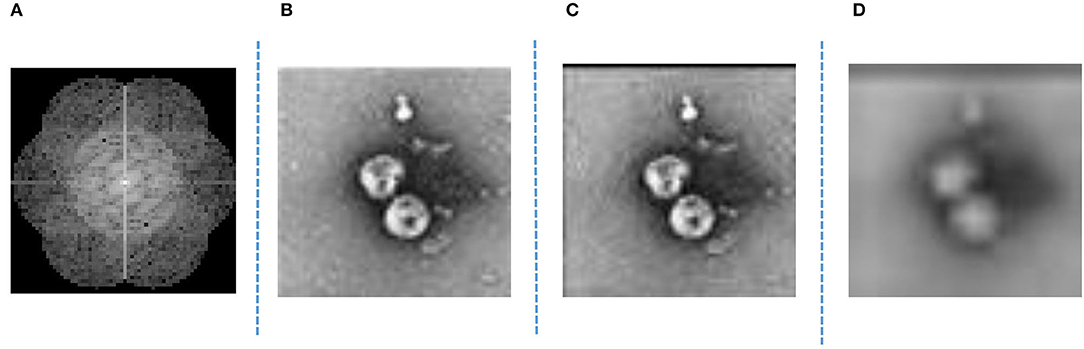
Figure 8. (A) Schematic of imaged wave vector space. (B) Object. (C) Ghost imaging (GI) with plasmonic structure illumination microscopy (PSIM). (D) GI without PSIM.
As shown in Figure 4, the light after passing through the PSIM system enters the GI system, that is, the light is modulated on the DMD, and the emitted light is finally received by the bucket detector. The image is restored after demodulation and reconstruction, as shown in Figure 8C. For comparison, we present the results without PSIM (reference system), as shown in Figure 8D; more results after ghost imaging system without PSIM are shown in Tables 2, 3. Then, the reconstructed image is analyzed, and PSNR and SER indexes are calculated to measure the reconstructed image. The PSNR is 30.09. When n is 17–23, SER is 10−3; when n is 24–26, SER is 10−4; when n is >27, SER is almost 0.
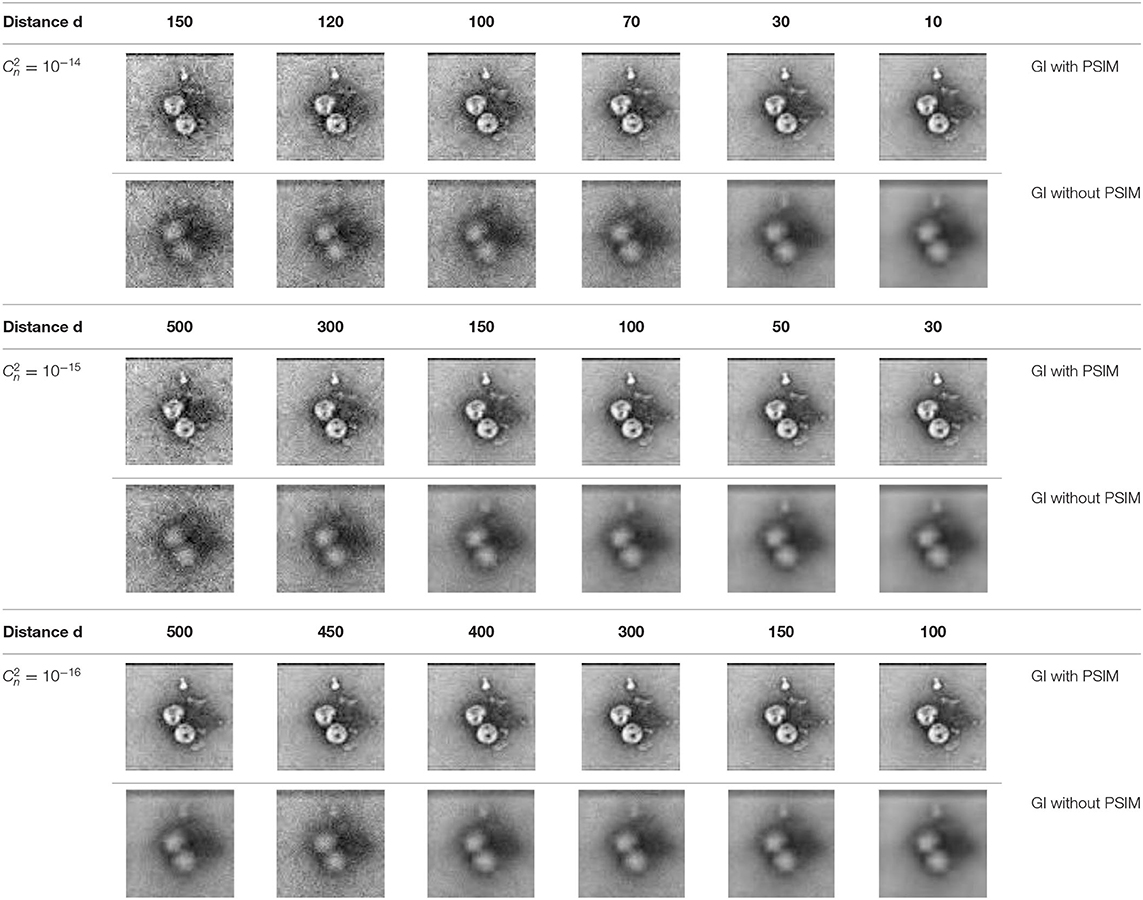
Table 2. Imaging effects for different transmission distances (in meters).
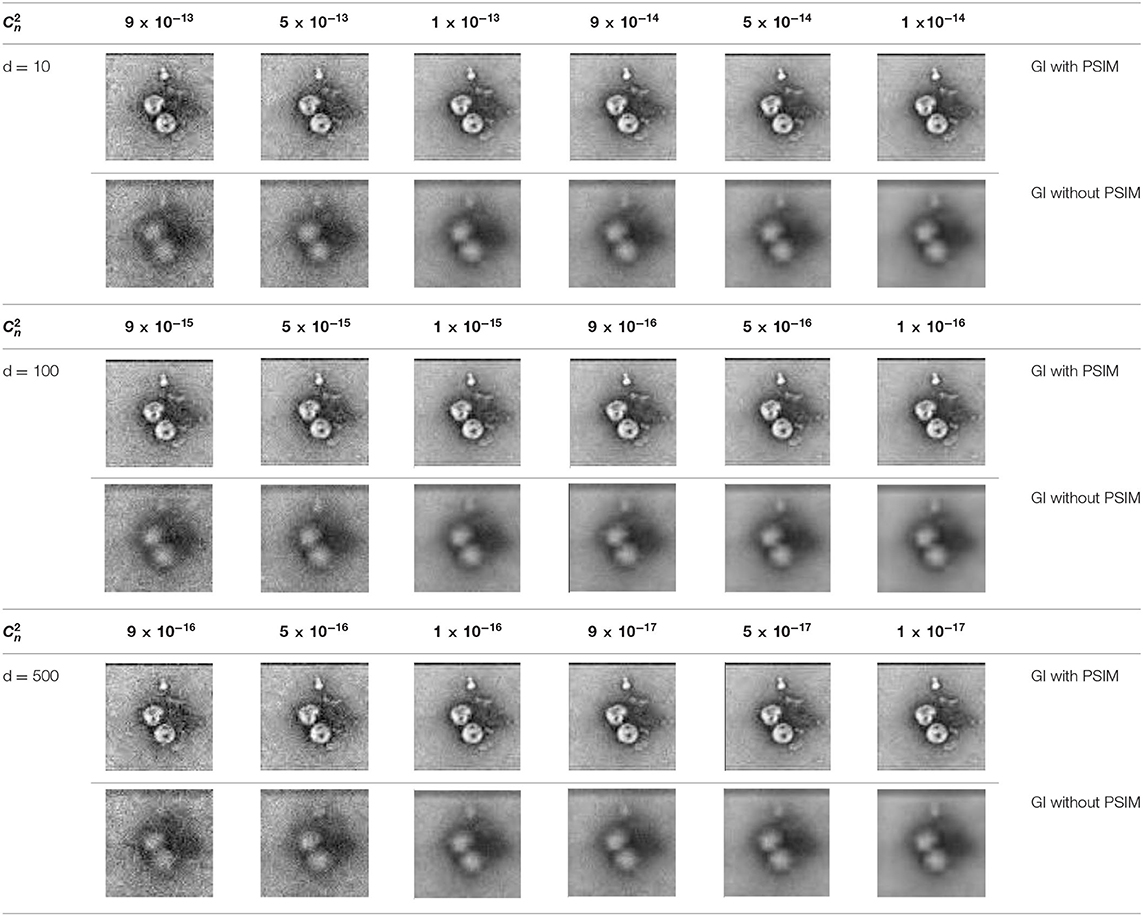
Table 3. Imaging effects for different values of the refractive-index structure parameter .
The relationship between the PSNR and the SER of a PSIM-GI system with turbulence is shown in Figure 9. N of the system is set to full pixel numbers of the image to eliminate the inherent error of the ghost imaging. Changing the refractive-index structure parameter and transmission distance d, the value of PSNR and SER under different situations are recorded. We selected the value of PSNR closest to the integer and calculated the corresponding SER to obtain the graph of PSNR and SER. Figure 9 shows that SER decreases with increasing PSNR. For PSNR values between 22 and 27 dB, the SER remains high (> 10−2). When the PSNR is >27 dB, the SER decreases sharply. The SER decreases by one order of magnitude, while the PSNR only increases by 3 dB, and it has dropped below 10−3 when the PSNR is over 30 dB.
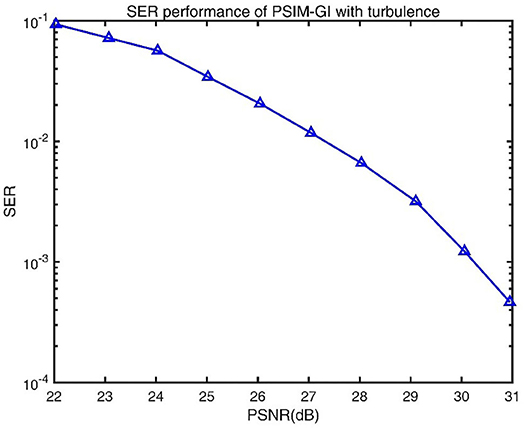
Figure 9. Symbol-error rate (SER) performance of ghost imaging based on plasmonic structure illumination microscopy (PSIM-GI) with turbulence.
Analysis of the Influence Under Different Conditions of Transmission Distance
When analyzing the influence of transmission distances, the refractive-index structure parameter is taken as 10−14, 10−15, and 10−16; the distance between the transmitter and the receiver d is set to a series of values according to the different values of ; N is set to the full pixel numbers of the image. The results of ghost imaging at different d are presented in Table 2.
When , the imaging performance significantly changes from fine to coarse, while the value of d changes from 10 to 150 m. Similar trends in imaging performance are observed for with d ranging from 30 to 500 m and for with d ranging from 100 to 500 m. PSNR and SER performance with d are shown in Figure 10.
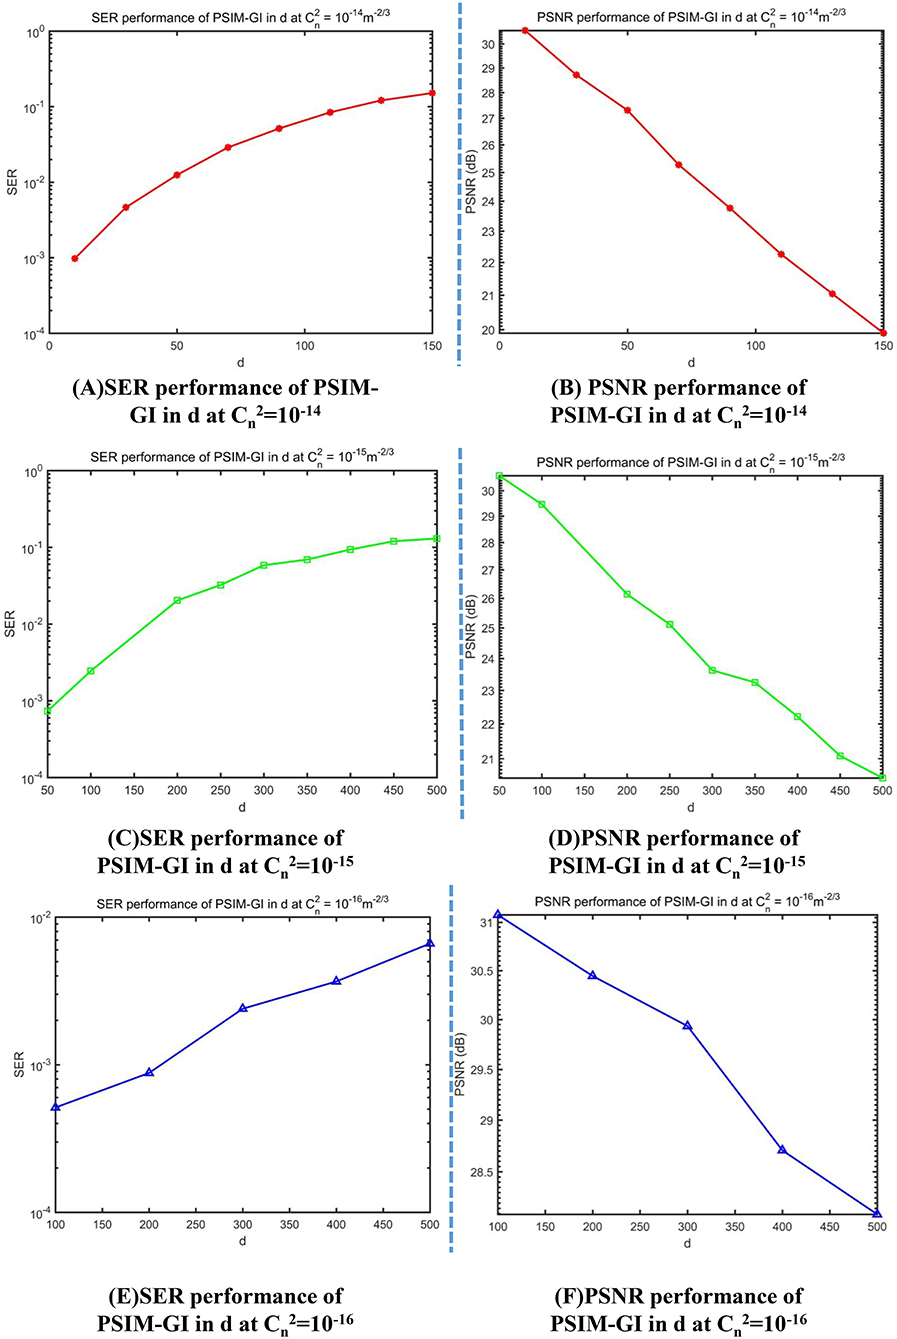
Figure 10. Symbol-error rate (SER) and peak signal-to-noise ratio (PSNR) curves for various transmission distances. (A) SER performance of PSIM-GI in d at = 10−14. (B) PSNR performance of PSIM-GI in d at = 10−14 (C) SER performance of PSIM-GI in d at = 10−15. (D) SER performance of PSIM-GI in d at = 10−15. (E) SER performance of PSIM-GI in d at = 10−16. (F) SER performance of PSIM-GI in d at = 10−16.
Notably, PSNR declines and SER increases with increasing d. Both tend to stabilize when d increases to a specific value, which varies with .
Analysis of the Influence Under Different Conditions of Refractive-Index Structure Parameter
Similarly, when analyzing the influence of , the transmission distance d is set to 10, 100, and 500 m, respectively; is set to a series of values according to the different values of d; N is also set to 100%. Imaging effects for different d are presented in Table 3.
When d = 10 m, the imaging performance significantly changes from fine to coarse while the range of changes from 1 × 10⁻¹⁴ to 9 × 10⁻¹³. Similar trends in imaging performance are observed for d = 100 m with ranging from 1 × 10⁻¹⁶ to 9 × 10⁻¹⁵ and for d = 500 m with ranging from 1 × 10⁻¹⁷ to 9 × 10⁻¹⁶. PSNR and SER performance with varying are shown in Figure 11.
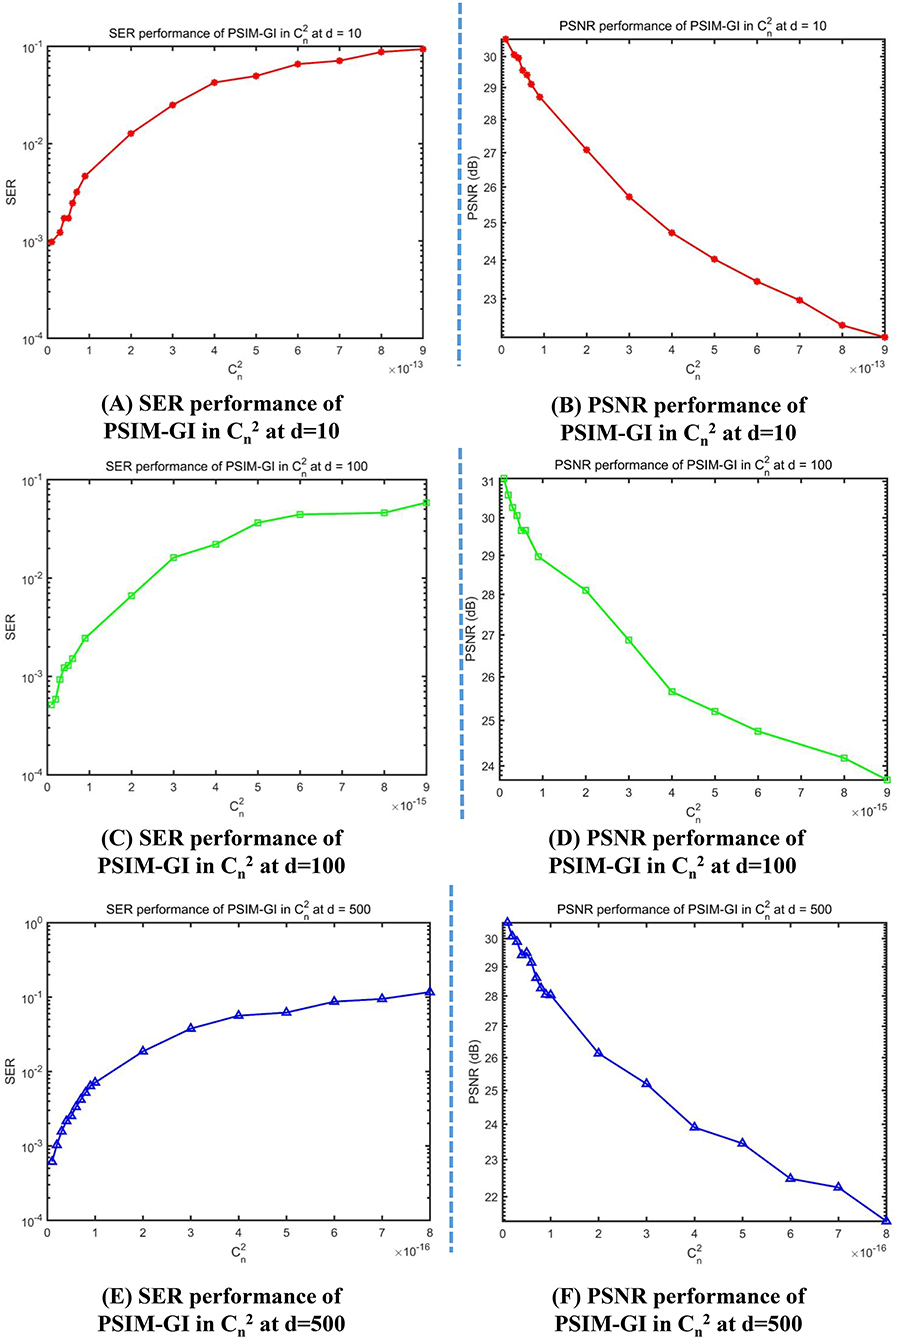
Figure 11. Symbol-error rate (SER) and peak signal-to-noise ratio (PSNR) curves for different values of the refractive-index structure parameter. (A) SER performance of PSIM-GI in at d = 10. (B) PSNR performance of PSIM-GI in at d = 10. (C) SER performance of PSIM-GI in at d = 100. (D) PSNR performance of PSIM-GI in at d = 100. (E) SER performance of PSIM-GI in at d = 500. (F) PSNR performance of PSIM-GI in at d = 500.
The trend in Figure 11 is the same as Figure 10: PSNR declines and SER increases with increasing . Both tend to stabilize when increases to a specific value that varies with d.
Conclusion
In this study, plasmonic structure illumination microscopy is applied io ghost imaging, and a PIM-GI imaging method is proposed. Using SPPs and SIM to enhance the resolution, super-resolution imaging is achieved. Using the FDTD software, two pairs of orthogonal slits are designed on the surface of the silver film to realize the excitation of SPPs. The SIM and GI algorithms are used to encode, transmit, receive, reconstruct, and finally obtain a clear image. The final resolution can reach three to four times the diffraction limit. The PSNR and SER of the PSIM-GI system are also calculated to measure the quality of the reconstructed image and simultaneously meet the sharpness of actual needs. The method proposed in this study has great research and application value in biomedical fields such as microimaging and endoscopy.
Furthermore, the influence of gamma–gamma turbulence to ghost imaging has also been simulated and analyzed. The intensity influence is mediated by two key parameters; they are refractive-index structure parameter and transmission distance d. According to results and analyses, both these parameters are negatively correlated with PSNR and positively correlated with SER. When or d increases sufficiently, the PSNR and SER nearly become constants and remain stable. This work provides a basis for a theoretical model and reference for a practical ghost-imaging system transmitting through an atmospheric turbulence channel.
Data Availability Statement
All datasets presented in this study are included in the article/supplementary material.
Author Contributions
KW contributed to the present and design the system. ZW, CB, HY, YZ, and ZZ contributed to simulation. XH and TX contributed to drawing. LZ, BD, MX, JH, XX, and DZ contributed to modification and suggestion in this paper. All authors contributed to the article and approved the submitted version.
Funding
This work was supported by the National Natural Science Foundation of China (Grant Nos. 61805144, 61875125, 61405115, and 61775140), the Shanghai Rising-Star Program (Grant No. 20QA1407000), Natural Science Foundation of Shanghai (Grant Nos. 18ZR1425800 and 14ZR1428400), and Shanghai Sailing Program (Grant No. 17YF1429400).
Conflict of Interest
The authors declare that the research was conducted in the absence of any commercial or financial relationships that could be construed as a potential conflict of interest.
Acknowledgments
We would like to thank Editage (www.editage.com) for English language editing.
References
1. Pittman TB, Shih YH, Strekalov DV, Sergienko AV. Optical imaging by means of two-photon quantum entanglement. Phys Rev A. (1995) 52:R3429–32. doi: 10.1103/PhysRevA.52.R3429
2. Lei Z, Wang C, Zhang D, Wang L, Gong W. Second-order intensity-correlated imaging through the scattering medium. IEEE Photonics J. (2017) 9:7500207. doi: 10.1109/JPHOT.2017.2772265
3. Li Z, Zhao Q, Gong W. Experimental investigation of ghost imaging in background light environments. J Opt. (2020) 22:025201. doi: 10.1088/2040-8986/ab613e
4. Leihong Z, Zhisheng Z, Yi K. Research on double-layers optical information encryption based on ghost imaging. Opt Commun. (2019) 455:124585. doi: 10.1016/j.optcom.2019.124585
5. Meyers RE, Deacon KS. Quantum ghost imaging experiments at ARL. Proc SPIE. (2010) 815:78150I. doi: 10.1117/12.864270
6. Shapiro JH. Computational ghost imaging. Phys Rev A. (2008) 78:061802. doi: 10.1103/PhysRevA.78.061802
7. Bai X, Li YQ, Zhao SM. Differential compressive correlated imaging. Acta Phys Sin. (2013) 62:44209. doi: 10.7498/aps.62.044209
8. Ferri F, Magatti D, Lugiato LA, Gatti A. Differential ghost imaging. Phys Rev Lett. (2010) 104:253603. doi: 10.1103/PhysRevLett.104.253603
9. Ermeydan ES, Çankaya I, Sahin AB. Super-resolution algorithm applied to images acquired at millimeter wave frequency in single pixel and computational ghost imaging configurations. J Electromag Waves Appl. (2019) 33:2328–40. doi: 10.1080/09205071.2019.1678525
10. Yu WK. Super sub-nyquist single-pixel imaging by means of cake-cutting hadamard basis sort. Sensors. (2019) 19:4122. doi: 10.3390/s19194122
11. Barbastathis G, Ozcan A, Situ G. On the use of deep learning for computational imaging. Optica. (2019) 6:000921. doi: 10.1364/OPTICA.6.000921
12. Karmakar S. Super-resolution noninvasive confocal quantum microscope. Optik. (2019) 198:163209. doi: 10.1016/j.ijleo.2019.163209
13. Wang Q, Bu J, Tan PS, Yuan GH, Teng JH, Wang H, et al. Subwavelength-sized plasmonic structures for wide-field optical microscopic imaging with super-resolution. Plasmonics. (2012) 7:427–33. doi: 10.1007/s11468-011-9324-2
14. Cao S, Wang T, Yang J, Hu B, Levy U, Yu W. Numerical analysis of wide-field optical imaging with a sub-20 nm resolution based on a meta-sandwich structure. Sci Rep. (2017) 7:1328. doi: 10.1038/s41598-017-01521-w
15. Ertsgaard CT, Mckoskey RM, Rich IS, Lindquist NC. Dynamic placement of plasmonic hotspots for super-resolution surface-enhanced raman scattering. ACS Nano. (2014) 8:10941–6. doi: 10.1021/nn504776b
16. Erkmen BI, Shapiro JH. Unified theory of ghost imaging with gaussian-state light. Phys Rev A. (2008) 77:043809. doi: 10.1103/PhysRevA.77.043809
17. Bromberg Y, Katz O, Silberberg Y. Ghost imaging with a single detector. Phys Rev A. (2009) 79:053840. doi: 10.1103/PhysRevA.79.053840
18. Duarte MF, Davenport MA, Takhar D, Laska JN, Sun T, Kelly KF, et al. Single-pixel imaging via compressive sampling. IEEE Signal Process Mag. (2008) 25:83–91. doi: 10.1109/MSP.2007.914730
19. Tian-Yi M, Qian C, Wei-Ji H, Jia-Yan Z, Yun-Hao Z, Dong-Hui D, et al. Optical communication in turbid and turbulent atmosphere. Acta Phys Sin. (2016) 65:084207. doi: 10.7498/aps.65.084207
20. Leihong Z, Ye H, Dawei Z. Study on the key technology of image transmission mechanism based on channel coding ghost imaging. IEEE Photonics J. (2018) 10:1–13. doi: 10.1109/JPHOT.2018.2858823
21. Salomon L, Bassou G, Aourag H, Dufour JP, de Fornel F, Carcenac F, et al. Local excitation of surface plasmon polaritons at discontinuities of a metal film: theoretical analysis and optical near-field measurements. Phys Rev B. (2002) 65:125409. doi: 10.1103/PhysRevB.65.125409
22. Chen L, Liao DG, Guo XG, Zhao JY, Zhu YM, Zhuang SL. Terahertz time-domain spectroscopy and micro-cavity components for probing samples: a review. Front Inform Technol Electron Eng. (2019) 20:591–607. doi: 10.1631/FITEE.1800633
23. Raether H. Surface Plasmons on Smooth and Rough Surfaces and on Gratings. Berlin: Springer-Verlag Press (1986).
24. Kretschmann E, Raether H. Notizen: radiative decay of non radiative surface plasmons excited by light. Zeitschrift für Naturforschung A. (1968) 23:2135–6. doi: 10.1515/zna-1968-1247
25. Hecht B, Bielefeldt H, Novotny L, Inouye Y, Pohl DW. Local excitation, scattering, and interference of surface plasmons. Phys Rev Lett. (1996) 77:1889–92. doi: 10.1103/PhysRevLett.77.1889
26. Kano H, Mizuguchi S, Kawata S. Excitation of surface-plasmon polaritons by a focused laser beam. J Opt Soc Am B. (1998) 15:1381–6. doi: 10.1364/JOSAB.15.001381
27. Nash DJ, Cotter NPK, Wood EL, Bradberry GW, Sambles JR. Examination of the +1, −1 surface plasmon mini-gap on a gold grating. Opt Acta Int J Opt. (1995) 42:243–8. doi: 10.1080/09500349514550191
28. Chang SH, Gray S, Schatz G. Surface plasmon generation and light transmission by isolated nanoholes and arrays of nanoholes in thin metal films. Opt Express. (2005) 13:3150–65. doi: 10.1364/OPEX.13.003150
29. Yang J, Xiao X, Hu C, Zhang WW, Zhou SX, Zhang JS. Broadband surface plasmon polariton directional coupling. Nano Lett. (2014) 14:704–9. doi: 10.1021/nl403954h
30. Kuo CF, Chu SC. Dynamic control of the interference pattern of surface plasmon polaritons and its application to particle manipulation. Opt Express. (2018) 26:19123–36. doi: 10.1364/OE.26.019123
31. Bai CY, Chen J, Zhang YX, Zhang DW, Zhan QW. Dynamic tailoring of an optical skyrmion lattice in surface plasmon polaritons. Opt Express. (2020) 28:10320–8. doi: 10.1364/OE.384718
32. Betzig E, Patterson GH, Sougrat R, Lindwasser OW, Olenych S, Bonifacino JS, et al. Imaging intracellular fluorescent proteins at nanometer resolution. Science. (2006) 313:1642–5. doi: 10.1126/science.1127344
33. Tan PS, Yuan XC, Yuan GH, Wang Q. High-resolution wide-field standing-wave surface plasmon resonance fluorescence microscopy with optical vortices. Appl Phys Lett. (2010) 97:241109. doi: 10.1063/1.3525173
34. Wei S, Lei T, Du L, Zhang C, Chen H, Yang Y, et al. Sub-100nm resolution PSIM by utilizing modified optical vortices with fractional topological charges for precise phase shifting. Opt Express. (2015) 23:30143–8. doi: 10.1364/OE.23.030143
35. Zhang C, Min C, Du L, Yuan XC. Perfect optical vortex enhanced surface plasmon excitation for plasmonic structured illumination microscopy imaging. Appl Phys Lett. (2016) 108:201601. doi: 10.1063/1.4948249
36. Dan D, Lei M, Yao B, Wang W, Winterhalder M, Zumbusch A, et al. DMD-based LED-illumination Super-resolution and optical sectioning microscopy. Sci Rep. (2013) 3:1116. doi: 10.1038/srep01116
37. Rego EH, Shao L, Macklin JJ, Winoto L, Johansson GA, Kamps-Hughes N, et al. Nonlinear structured-illumination microscopy with a photoswitchable protein reveals cellular structures at 50-nm resolution. Proc Nat Acad Sci USA. (2012) 109:E135–43. doi: 10.1073/pnas.1107547108
38. Chakrova N, Rieger B, Stallinga S. Deconvolution methods for structured illumination microscopy. J Opt Soc Am A. (2016) 33:B12–20. doi: 10.1364/JOSAA.33.000B12
39. Lal A, Shan C, Xi P. Structured illumination microscopy image reconstruction algorithm. IEEE J Select Top Quantum Electron. (2016) 22:50–63. doi: 10.1109/JSTQE.2016.2521542
40. Wei F, Liu Z. Plasmonic structured illumination microscopy. Nano Lett. (2010) 10:2531–6. doi: 10.1021/nl1011068
41. Wei F, Lu D, Shen H, Wan W, Ponsetto JL, Huang E, et al. Wide field super-resolution surface imaging through plasmonic structured illumination microscopy. Nano Lett. (2014) 14:4634–9. doi: 10.1021/nl501695c
42. Fernández-Domínguez AI, Liu Z, Pendry JB. Coherent four-fold super-resolution imaging with composite photonic–plasmonic structured illumination. ACS Photonics. (2015) 2:341–8. doi: 10.1021/ph500342g
43. Ponsetto JL, Wei F, Liu Z. Localized plasmon assisted structured illumination microscopy for wide-field high-speed dispersion-independent super resolution imaging. Nanoscale. (2014) 6:5807–12. doi: 10.1039/C4NR00443D
44. Al-Habash A, Andrews LC, Phillips RL. Mathematical model for the irradiance probability density function of a laser beam propagating through turbulent media. Opt Eng. (2001) 40:1554–63. doi: 10.1117/1.1386641
45. Ghassemlooy Z, Popoola W, Rajbhandari S. Optical Wireless Communications System and Channel Modelling with MATLAB. New York, NY: CRC Press (2012).
46. ITU-R. P.618: Propagation Data and Prediction Methods Required for the Design of Earth-space Telecommunication Systems (Internationnal Telecommunication Union, 2017). (2017). Available online at: https://www.itu.int/rec/R-REC-P.618-13-201712-I/en (accessed February 16, 2020).
47. Hou YS, Xia GQ, Jayaprasath E, Yue DZ, Wu ZM. Parallel information processing using a reservoir computing system based on mutually coupled semiconductor lasers. Phys Rev B. (2020) 126:40. doi: 10.1007/s00340-019-7351-4
Keywords: surface plasmon polaritons, structure illumination microscopy, ghost imaging, super-resolution, atmospheric turbulence, gamma-gamma model
Citation: Wang K, Wang Z, Bai C, Zhang L, Dai B, Zhang Y, Ye H, Zhang Z, Han X, Xue T, Xu M, Hu J, Xin X and Zhang D (2020) Influence of Atmospheric Turbulence Channel on a Super-Resolution Ghost Imaging Transmission System Based on Plasmonic Structure Illumination Microscopy. Front. Phys. 8:546528. doi: 10.3389/fphy.2020.546528
Received: 28 March 2020; Accepted: 25 August 2020;
Published: 08 October 2020.
Edited by:
Wei E. I. Sha, Zhejiang University, ChinaReviewed by:
Jianming Wen, Kennesaw State University, United StatesNirmal Mazumder, Manipal Academy of Higher Education, India
Copyright © 2020 Wang, Wang, Bai, Zhang, Dai, Zhang, Ye, Zhang, Han, Xue, Xu, Hu, Xin and Zhang. This is an open-access article distributed under the terms of the Creative Commons Attribution License (CC BY). The use, distribution or reproduction in other forums is permitted, provided the original author(s) and the copyright owner(s) are credited and that the original publication in this journal is cited, in accordance with accepted academic practice. No use, distribution or reproduction is permitted which does not comply with these terms.
*Correspondence: Dawei Zhang, ZHd6aGFuZ0B1c3N0LmVkdS5jbg==