 Lena Bäuml1†
 Thomas Schnappinger
 Regina de Vivie-Riedle
- 1Department of Chemistry, Ludwig-Maximilians-University Munich, Munich, Germany
- 2Max Planck Institute of Quantum Optics, Garching, Germany
- 3Department of Physics, Ludwig-Maximilians-University Munich, Garching, Germany
Photo-initiated processes in molecules often involve complex situations where the induced dynamics is characterized by the interplay of nuclear and electronic degrees of freedom. The interaction of the molecule with an ultrashort laser pulse or the coupling at a conical intersection (CoIn) induces coherent electron dynamics which is subsequently modified by the nuclear motion. The nuclear dynamics typically leads to a fast electronic decoherence but also, depending on the system, enables the reappearance of the coherent electron dynamics. We study this situation for the photo-induced nuclear and electron dynamics in the nucleobase uracil. The simulations are performed with our ansatz for the coupled description of the nuclear and electron dynamics in molecular systems (NEMol). After photo-excitation uracil exhibits an ultrafast relaxation mechanism mediated by CoIn's. Both processes, the excitation by a laser pulse and the non-adiabatic relaxation, are explicitly simulated and the coherent electron dynamics is monitored using our quantum mechanical NEMol approach. The electronic coherence induced by the CoIn is observable for a long time scale due to the delocalized nature of the nuclear wavepacket.
1. Introduction
The interaction of molecular systems with light induces numerous chemical processes which can be natural, such as vision [1–3] and photosynthesis [4–7], or artificial like organic photovoltaics [8–12] and photocatalysis [13, 14]. In these processes a molecule often absorbs light with a wavelength in the visible or ultraviolet range where electrons are promoted from the molecular ground state to higher electronic states. The excited molecule can undergo radiative or non-radiative decay processes. Only the non-radiative processes can lead to photo-chemical reactions which are often mediated by non-adiabatic transitions [15]. The necessary non-adiabatic couplings (NACs) between the states involved are only present in the vicinity of a conical intersection (CoIn) [16–18] or an avoided crossing. Depending on the number of degrees of freedom these CoIn's are extraordinary points, seams or even higher dimensional crossing spaces. Besides the possibility of non-radiative relaxation they lead to the breakdown of the adiabatic separation between nuclear and electronic motion and equalize the time scales of their dynamics. Overall the excitation process and the non-adiabatic transitions are complex situation where both nuclear and electronic motion and their interaction play a key role. In order to simulate these situations a theoretical approach is needed that can describe the coupled nuclear and electron dynamics in a molecular system.
Most methods which can describe the electron dynamics are often modified versions of their well-known quantum-chemical counter parts and neglect the influence of the nuclear motion [19–23] or treat it classically [24–27]. One of the possibilities to treat both the nuclear and the electron dynamics in a molecular systems is the quantum-mechanical NEMol ansatz [28–32]. Within this ansatz the electronic wavefunctions are propagated in the eigenstate basis and coupled to the nuclear wavepacket propagated on coupled potential surfaces. Compared to similar but more expensive approaches based on the coupled propagation of the nuclear and electronic wavefunction on a single time-dependent potential energy surface [33–36], in NEMol the feedback of the electron motion to the nuclear dynamics is less directly included. In the beginning we give a brief introduction to the NEMol ansatz and how we determine the time-dependent electron density. This density is used to distinguish the Born-Oppenheimer part of the dynamics from the coherent electron dynamics. With the help of the NEMol ansatz the electron and nuclear dynamics along a photo-induced relaxation process in molecular systems can be simulated, including both interaction with a laser pulse and non-adiabatic events.
In the main part of this paper we apply NEMol to derive photo-induced dynamics in uracil which is one of the four nucleobases in RNA. Like all other nucleobases uracil absorbs mainly in the UV range due to an accessible π → π* transition [37, 38]. After the excitation uracil can undergo harmful chemical modifications, such as methylation or base alteration [39–41]. The altered structures and the subsequent changed base pairings can lead to mutations, genomic instability and cancer [37, 40, 42]. To prevent potential mutations in advance, the inherent photostability of the nucleobases is a key factor, assuring that the vast majority of photoexcitations do not lead to harmful modifications [37]. The photostability of all nucleobases is due to the presence of fast relaxation mechanisms back to the ground state. Uracil exhibits an ultrafast relaxation mechanism with experimentally observed relaxation times between 50 fs and 2.4 ps [37, 43–46]. The relaxation is mediated via CoIn's between the first two excited states and has been well-studied using quantum-dynamics on two-dimensional surfaces [47, 48], as well as semi-classical approaches allowing for all degrees of freedom [38, 49–51]. As already demonstrated [52] the coherence induced by these CoIn's is long-lived since the non-adiabatic transition is rather a continuous process due to the delocalized nature of the nuclear wavepacket. We are following the photoinduced dynamics in uracil starting with the explicit simulation of the excitation processes via a laser pulse up to the relaxation via CoIn's. During the whole process NEMol is used to monitor the temporal evolution of the electron dynamics. The simulations demonstrate that the electron dynamics even in large molecular systems reflect coherence, decoherence, and reappearance due to nuclear motion. In previous work the effect of decoherence has been discussed from the nuclear dynamics side [53–55], and the reappearance has been reported for small molecular systems [56–58].
2. Coupled Nuclear and Electron Dynamics in Molecules (NEMol)
To describe the coupled nuclear and electron dynamics it is necessary to determine the temporal evolution of the total molecular wavefunction. This is realized with our NEMol ansatz [28–30]. In a system with multiple electronic states the total wavefunction Ψtot(r, R, t) can be expressed as a sum over the products consisting of the electronic wavefunctions φ(r, t; R) and the wavefunctions of the nuclei χ(R, t) (see Equation 1), with the nuclear and electronic coordinates R and r and the time t. In this ansatz both the electronic and the nuclear wavefunctions are explicitly time-dependent.
The electronic wavefunctions φi are parametrically depending on the nuclear coordinates R and define a multi-dimensional vector comprising the electronic states involved. Analogously, the total nuclear wavefunction χtot is given by a multi-dimensional vector composed of the nuclear wavefunctions χi residing in the i potential surfaces. Its temporal evolution is simulated on coupled potential energy surfaces (PES), for details see Supplementary Section I. Multiplying Ψtot(r, R, t) from the left with χtot and the subsequent integration over the nuclear coordinates results in an expression of the coupled total electronic wavefunction [28–30].
The individual components Φj of this vector are defined by the following equation:
The time-dependent populations Ajj(t) and the time-dependent nuclear overlap terms Ajk(t) are determined by the nuclear quantum-dynamics simulation. The overlap terms specify the degree of coherence induced between two states j and k. If the coupling between the electronic states is weak, the nuclear wavefunctions propagate independently and the overlap term becomes zero. In this case, the coupled electronic wavefunctions Φj in Equation (3) become equivalent to the uncoupled electronic wavefunction φj. All electronic wavefunctions coupled and uncoupled are parametrically depending on the time-dependent expected value of the position 〈R〉(t). This means that the coupled electronic wavefunctions are evaluated at one single nuclear geometry which changes with time. The time evolution of the φj(r, t; 〈R〉(t)) is determined by the deformation of the electronic structure induced by the nuclear motion and the propagation in the electronic phase space [28–30].
Here the φj(r; 〈R〉(t)) are the real-valued electronic wavefunctions of the relevant electronic states and ξj(t) is the electronic phase factor computed by numerical integration of the electronic eigenenergies Ej(〈R〉(t)) over time.
In practice the calculation of ξj(t) has to be done recursively to retain the memory of the progressing electronic phase since Ej(〈R〉(t)) changes with propagation time
Thereby the propagation velocity of the phase in the complex plane changes smoothly in time while the nuclear wavepacket propagates. Within the original NEMol a much smaller time step must be used for the calculation of the phase term ξj(t). The coupled total electronic wavefunction is used to determine the coupled one-electron density ρ(r, t; 〈R〉(t)) [28–30].
The first summation consists of the state specific electronic density ρjj(r; 〈R〉(t)) weighted with the corresponding time-dependent population Ajj(t). The second summation defines the coherent contribution to the coupled electron density and consists of the time-dependent overlap Ajk(t), the one-electron transition density ρjk(r; 〈R〉(t)) and its pure electronic phase ξjk(t) defined by the energy difference ΔEjk between the electronic states involved. This coherent part of the density can be induced by an interaction with a laser pulse or by non-adiabatic coupling events. For non-dissociative molecular dynamics like in uracil the time-dependent overlap determines the disappearance and especially the potential reappearance of the coherent electron dynamics.
To go beyond this single geometry approximation we introduced the NEMol-grid [32] where the full nuclear coordinate space is split up into segments for which partial densities are calculated. In the limit the NEMol-grid is equal to the grid for the nuclear wavepacket propagation, but in practice we choose a coarser one. The partial densities ρml(r, t; Rml) are defined by:
The population terms and the overlap terms are calculated by integration over the wavepackets within the boundaries of the segments. At the center Rml of each segment the state specific electronic densities ρjj(r; Rml), the one-electron transition densities ρjk(r; Rml), and the pure electronic phase are determined. Since the positions Rml do not vary with time the time step for the calculation of the phase term can be chosen larger than for the original NEMol. In this work a time step of 1 a.u. is used. To obtain the total coupled electron density the individual contributions for each segment are summed up.
This total coupled one-electron density ρ(r, t; R) (also called full electron density in the following) contains the information of all partial densities determined at multiple grid points weighted with the corresponding population and overlap terms. This is a significant difference from the original NEMol where the electronic structure was only considered at one geometry. To visualize the coupled one-electron density the weighted average R of all Rml is formed. The NEMol-grid extension is used to sample the nuclear wavefunction to improve the resolution of the spatial dependence of the electronic phase term. This is crucial for situations where the nuclear wavepacket is delocalized and only parts of the wavepacket induce coherence in the system. As this is increasingly the case for two and more dimensional systems, the expected value of the position 〈R〉(t) is no longer appropriate to capture the electron the electron dynamics. Since uracil is such case we apply the NEMol-grid for all calculations in this work. To study the electron dynamics the induced dipole moment vector is calculated using the coupled one-electron density:
If the entire dynamics or at least parts of it can be described by two coupled states, it is possible to obtain a simplified description of the electron density in the one-electron-two-orbital (1e-2o) picture, which was derived and successfully applied in reference [32]. Based on the assumption that the two states are described by two Slater determinants, which only differ in the occupation of one spin orbital θ, it is possible to condense the coupled dynamics in a simple 1e-2o-density. The following Equation (14) is based on the original NEMol ansatz (see Equation 8), but the 1e-2o-density can also be determined in combination with the NEMol-grid.
Neglecting the contributions of the equally occupied orbitals, the first two terms represent the remaining two orbitals weighted with their respective population Ajj(t). The third term denotes the coherence between the states characterized by the product of the two orbitals.
3. Photo-Induced Dynamics of Uracil
In this work we investigate the photo-induced nuclear and electron dynamics of the nucleobase uracil with NEMol. The geometry of uracil at the Franck-Condon (FC) point is depicted in Figure 1. Uracil is characterized by an ultrafast photo-relaxation channel starting in the second excited state (S2) which is mediated by CoIn's. As shown in previous studies [47, 48], the photo-excitation and the initial steps of the subsequent relaxation can be well-described on two-dimensional PES. We adopt these adiabatic PES, which were first reported by Keefer et al. [47] and later modified [52, 59]. The underlying two-dimensional coordinate space spanned by the vectors q1 and q2 includes all relevant structures, the FC point, the S2 minimum, the optimized S2/S1 CoIn and also parts of the associated CoIn seam. Both vectors are depicted on the right side of Figure 2. The resulting PES for the bright S2 state is shown on the left of Figure 2. The potential surface exhibits a double-well structure with a small barrier separating the S2 minimum on the top left from the CoIn seam on the bottom right (black). Further information about the simulations can be found in the Supplementary Section I. The molecular orientation within the laboratory frame is chosen in such a way that the molecular plane is equal to the xy-plane at the FC point and the center of mass defines the origin of the laboratory frame (see Figure 1). To initiate the dynamics and promote the system from the electronic ground state to the S2 state we use a Gaussian shaped pulse. Its parameters were adapted from a previous work [47]. The pulse has a central frequency ω0 of 6.12 eV, a full width at half maximum (FWHM) of 30 fs and a maximum field strength of 0.036 GV cm-1. This maximum is reached after 40 fs simulation time. The light-matter interaction is treated within the dipole approximation. We assume that the electric component of the pulse is optimally aligned with the transition dipole moment whose absolute value is used. The complete temporal evolution of the population of all three states is shown in Figure 3. The excitation pulse is active in the time period between 10 and 75 fs and leads to an S2 population yield close to 90%. The motion of the wavepacket in the S2 state is indicated in white in Figure 2. The wavepacket evolves from the FC point toward the S2 minimum and oscillates back near the FC region. After this first oscillation period (about 80 fs) a part of the wavepacket splits and travels toward the CoIn seam. At around 100 fs the population of the S2 state starts to decay. During the following oscillations this behavior continues leading to a rather continuous flow of population into the S1 state.
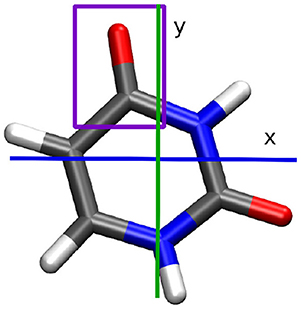
Figure 1. Uracil molecule at the Franck-Condon point. The studied carbonyl group is indicated in purple. Carbon atoms are shown in gray, hydrogen in white, oxygen in red, and nitrogen in blue.
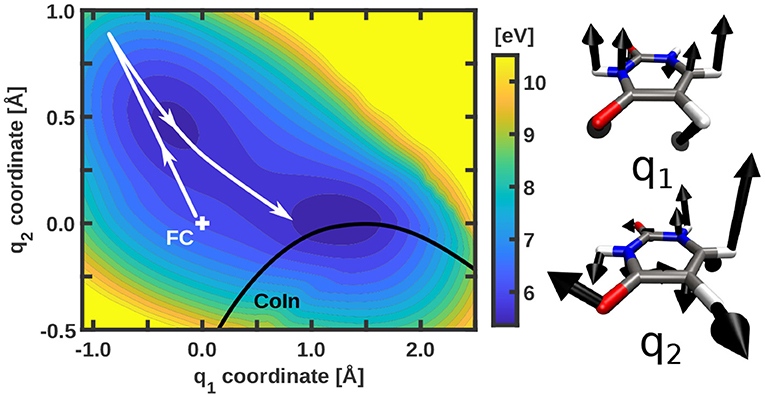
Figure 2. Potential energy surface of the bright S2 state of uracil with indicated CoIn seam (black) and a schematic representation of the path of the wavepacket (white). The energy scale is given with respect to the global minimum of the S0 potential energy surface. The two coordinate vectors defining the two-dimensional coordinate space are shown on the right. Only contributions larger than 0.3 Å are depicted.
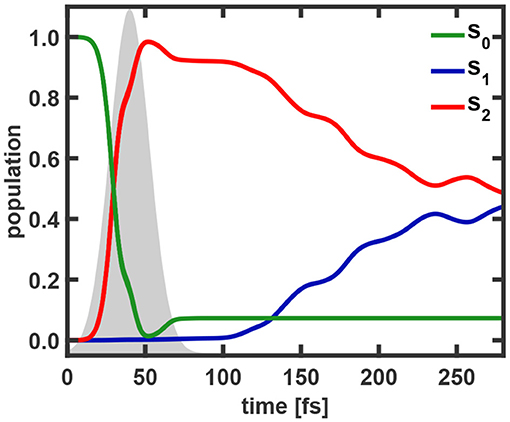
Figure 3. Populations of the S0, S1, and S2 state as a function of the simulation time. The envelope of the excitation pulse is indicated in gray.
The NEMol simulations are used to monitor the coupled nuclear and electron dynamics of uracil during the first 200 fs. We assume that the coherent part of the electron dynamics is only active during the laser pulse excitation and when the wavepacket is interacting with the CoIn seam. Since these two events are spatially and temporally separated from each other we split our simulation into two parts. Within the interval of the excitation process (0–75 fs) we calculate the coupled electron density including only the properties (densities, population and overlap) of the S0 and S2 states. In the second part (75–200 fs), characterized by the relaxation via the CoIn seam, we include only the properties of the S1 and S2 states. For both cases we use a NEMol-grid of 14 × 10 segments equally distributed between −0.37 and 1.57 Å in the q1 coordinate and from −0.57 to 0.86 Å in the q2 coordinate, shown in Supplementary Figure 1. For each of these segments the population terms and the overlap terms of the involved states were determined. The population outside the NEMol-grid was added to the nearest segment on the edge of the grid. For the detailed analysis of the electron dynamics we focus on two quantities, the induced dipole moment and the temporal evolution of the local density at the upper carbonyl group (marked in purple in Figure 1). Both are observables, e.g., the fluctuations in the local density could be probed by transient X-ray absorption spectroscopy [60, 61]. Both observables show qualitatively very similar features. The results for the induced dipole moment are presented and discussed in the manuscript, while the ones for the local density are shown in the Supplementary Material. We should note that for the excitation dynamics it is important to ensure that the phase information of the laser pulse is solely imprinted on the electronic wavefunction and not also on the nuclear wavefunctions. In our previous work [62, 63], this was realized by calculating the dynamics in the rotating-wave-approximation to describe the laser-induced coupling between the molecular states. In this work we have chosen to remove the phase information of the laser pulse from the nuclear overlap terms.
3.1. Excitation-Pulse Induced Dynamics
The dynamics induced by the laser pulse excitation is basically characterized by the excitation of one electron from a bonding π orbital into an anti-bonding π* orbital. This process is illustrated in Figure 4. For the following analysis we calculate the full coupled electron density according to Equation (12).
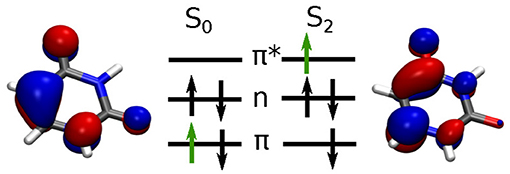
Figure 4. Molecular orbital schemes for the S0 → S2 excitation with the active electron indicated in green and corresponding orbitals at the Franck-Condon point. Orbitals are shown with an isovalue of 0.05.
Snapshots of the full coupled electron density are depicted in Figure 5. The excitation process follows with slight delay the profile of the resonant light pulse (Figure 3). Close to its maximum we observe a slight backtransfer from S2 to S0. Thereafter the S2 population smoothly further increases up to nearly 100% reached at 52 fs. Toward the end of the pulse (at 60–70 fs) about 5% of the population is transferred back to the ground state. In total, 92% of the population was promoted into the S2 state. With the naked eye nearly no variation is visible in the temporal evolution of the full electron density (top row Figure 5). However, studying the difference in density (bottom row) recorded with respect to the one at t= 0 fs the change in the bonding/anti-bonding pattern of the π-system becomes observable. In addition the deplanarization of the molecule leads to changes in the σ-system. The corresponding snapshots of the 1e-2o-density can be found in Supplementary Figure 4.
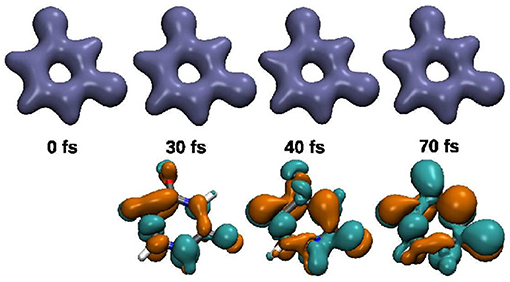
Figure 5. Snapshots of the electron density and the difference in density relative to the density at t = 0 fs (green electron-loss, orange electron-gain) for the excitation-pulse induced dynamics between 0 and 75 fs. The isovalues used are 0.08, respectively ±0.003.
The temporal evolution of the induced dipole moment (DM) is determined with and without the coherent part of the coupled electron density included. The difference ΔDM is used to monitor the part of the dipole moment which is induced by the coherent electron dynamics. The DM components, the ΔDM along the x- and y-coordinate and their Fourier transforms are shown in Figure 6. In addition also the comparison of the y–ΔDM signal and the laser field is depicted. In the beginning of the excitation process the wavepacket mostly remains near the FC point and the molecular geometry stays planar in the xy-plane. Therefore, up to 30 fs the z-component of the induced dipole moment stays zero. After this period the wavepacket movement toward the S2 minimum breaks up the planar structure and small modulations of the z-component are observed. Compared to the other two components it does not change significantly and is neglected for the further analysis. Regarding the x- and y-components of the DM, two main features are apparent. There is an overall increase (y-component), respectively decrease (x-component) in the DM which is modulated by a slow oscillation with a period of about 40 fs caused by the initial nuclear wavepacket motion around the S2 minimum. The second feature is an extremely fast oscillation which is especially dominant in the range of 10–45 fs. With the help of the ΔDM components (Figure 6B) these fast oscillations can be attributed to the coherent electron dynamics. Close to the pulse maximum a pronounced destructive interference appears around 35 fs which coincides with the slight backtransfer of the population (Figure 3). The Fourier transforms (Figure 6C) of the two ΔDM signals clearly reveal that both components share the same main frequencies at 6.18 eV. These frequencies agree very well with the excitation frequency of 6.12 eV. A table of all observed frequencies with an intensity larger than 0.1 can be found in Supplementary Table 1. If we now compare the time evolution of the electric field of the pulse with the evolution of y–ΔDM (Figure 6D) this good agreement is confirmed and furthermore a maximum phase shift of about 0.5π between the field and the coherent part of the induced dipole moment can be recognized as expected [62, 63]. That means there is a briefly delayed response of the electron dynamics to the laser pulse. Also the beginning of the destructive interference of the electron wavefunctions at 33 fs is visible. In a final step of the analysis we have used a time-windowed Fourier transform of the y–ΔDM signal to determine the time at which the observed frequencies occur. In Figure 7 the result of the time-windowed Fourier transform is shown applying a Gaussian window function with a width of 120 data points corresponding to a time of 2.9 fs.
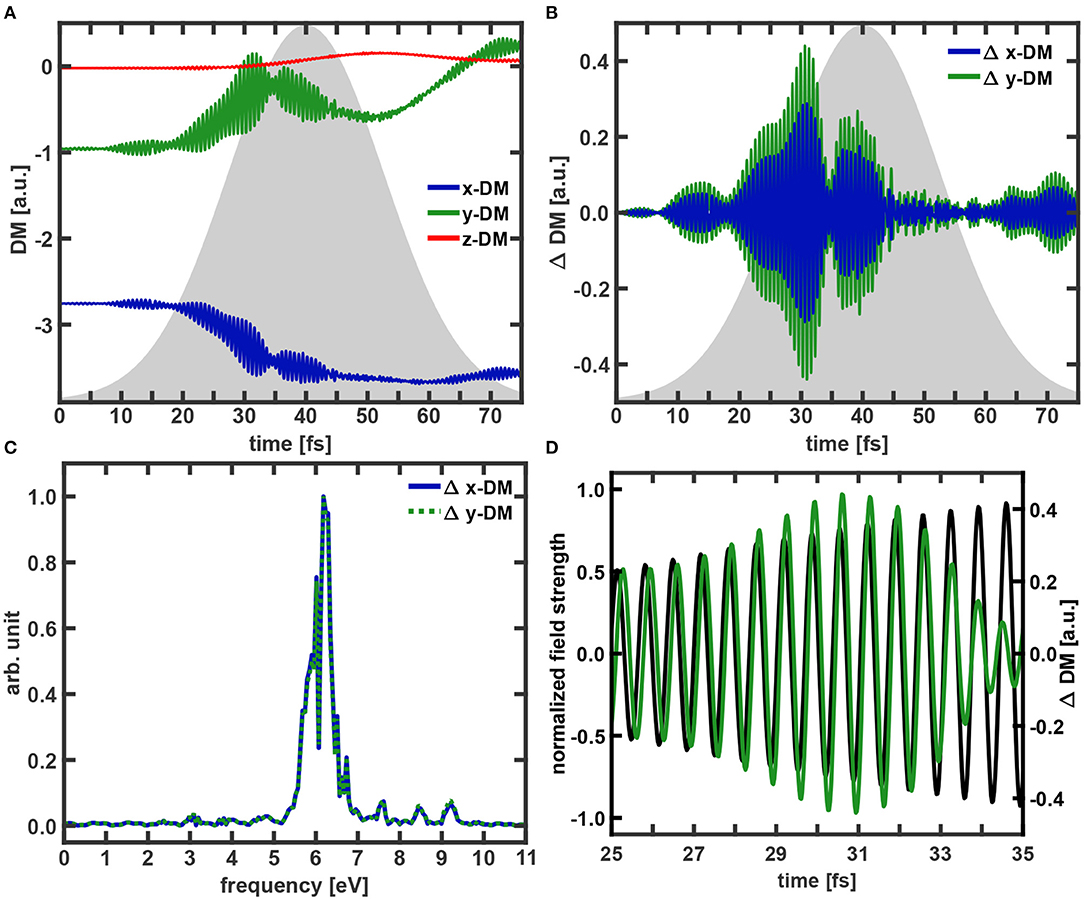
Figure 6. Temporal evolution of the dipole moment components for (A) the calculation with the full density and (B) for the difference (ΔDM) between the dipole moment calculated with and without the coherence term included. The ΔDM are only shown for the for x- and y-components. The envelope of the excitation pulse is indicated in gray. (C) Fourier spectra of x-ΔDM and y–ΔDM. All spectra are normalized to one. (D) Comparison of y–ΔDM (green) and the electric field of the excitation pulse (black).
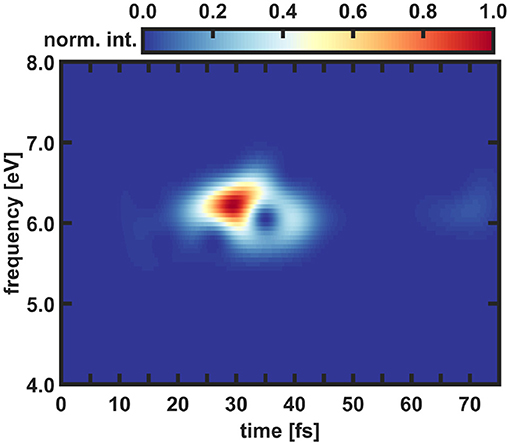
Figure 7. Time-windowed Fourier transform of the y-component of ΔDM. The Fourier spectrogram is normalized and a Gaussian window function with a width of 120 data points corresponding to a time of 2.9 fs is used.
In the spectrogram only frequencies in an energy window between 5.5 and 7 eV are visible. During the simulation these frequencies are occurring twice, once between 10 and 45 fs with the maximum being located between 25 and 35 fs, and a second time much weaker from 60 fs onward. The first one is directly induced by the laser pulse and the starting point of this signal matches with the beginning of the population transfer into S2 state. The second occurrence takes place at the end of the excitation pulse. Until then parts of the wavepacket traveled back to the FC area and are again resonant with the excitation pulse. This enables backtransfer from the S2 state to the ground state creating again non-zero nuclear overlap terms in Equation (10) and thus coherent electron dynamics. As described in the theory section instead of using the total coupled electron density it is also possible to perform the calculations in the 1e-2o picture (see Equation 14). Besides small deviations, the results in the 1e-2o picture are quite similar and can be found in the Supplementary Material. A complete summary of all performed analyses of the coupled electron density can be found in Supplementary Section IIIA. In summary, the laser pulse builds up electronic coherence in the molecule. The subsequent nuclear movement leads to decoherence within 10 fs, but about 40 fs later a weak reappearance of the signal due to laser coupling is observed.
3.2. Conical Intersection Induced Dynamics
Since the coupled dynamics of the excitation process is well-described in the 1e-2o picture, we also performed the simulation for the conical intersection induced dynamics in this picture. The two active orbitals which are required to describe the NEMol-dynamics according to Equation (14) are shown in Figure 8 at the FC point. In this simplified picture the CoIn dynamics is characterized by the transfer of one electron from a non-bonding orbital into a bonding π orbital.
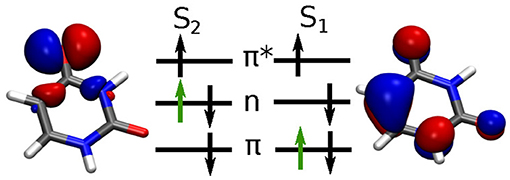
Figure 8. Molecular orbital schemes for the S2 → S1 relaxation with the active electron indicated in green and corresponding orbitals at the Franck-Condon point. Orbitals are shown with an isovalue of 0.05.
The population dynamics in the time window from 75 to 200 fs and snapshots of the coupled electron density in the 1e-2o picture are depicted in Figure 9. The corresponding snapshots obtained with the full electron density are show in Supplementary Figure 11. A slow but steady decay of the S2 population indicating two shallow steps (from 110 to 160 fs and from 170 to 200 fs) is visible. This rather continuous relaxation process is due to the delocalized nature of the nuclear wavepacket. In the 1e-2o picture the variation in the temporal evolution of the electron density is clearly visible (top row Figure 9B). For illustration also the difference in density with respect to the one at t= 75 fs is depicted. The snapshots reveal a transition from an exclusive non-bonding character at 75 fs to a mixed non-bonding and π character at 195 fs. Over the observed time the majority of the density is located at the upper oxygen atom, but the two left carbon atoms gain more and more density and a π-bond is formed.
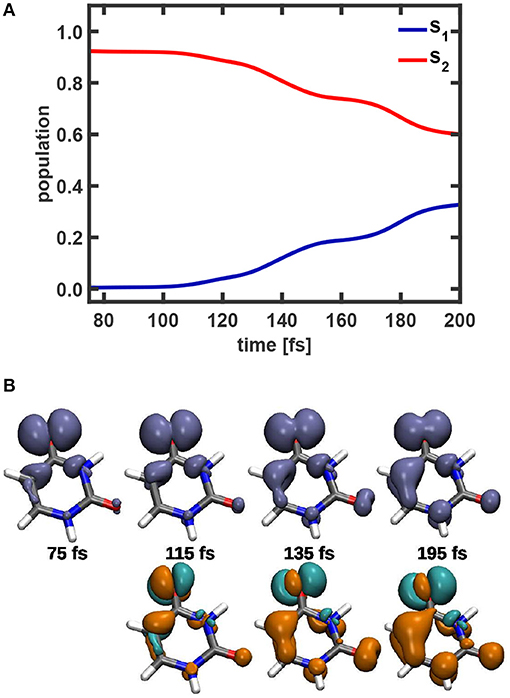
Figure 9. (A) Temporal evolution of the population of the S1 and S2 state during the time period between 75 and 200 fs. (B) Snapshots of the 1e-2o electron density and the difference in density relative to the density at t = 75 fs (green electron-loss, orange electron-gain) in the 1e-2o picture.The isovalues used are 0.002, respectively ±0.0008.
For further analysis the temporal evolution of the induced dipole moment calculated with and without the coherent part of the electron density included was determined. The resulting DM components, the ΔDM of the x- and y-components and their Fourier transforms are shown in Figure 10. In addition the time-windowed Fourier transform of the y–ΔDM signal is depicted there, applying a Gaussian window function with a width of 2.9 fs. As for the excitation dynamics, the z-component of the induced dipole moment does not play a major role and is neglected also in the discussion of the CoIn induced dynamics. In the overall picture the x-component exhibits a slow and rather small increase, only the y-component shows significant changes and decreases step-wise analogously to the population in S2. Since the electron density moves mainly along the y-coordinate (see Figure 9B), it is logical that this component changes most. Superimposed weak and fast oscillations can be recognized for the y-DM signal and to some extent also for the x-DM signal. As in the previous analysis of the laser induced dynamics these oscillations can be assigned to the coherent electron dynamics. Using the ΔDM components (see Figure 10B), intervals with fast oscillations and with slow oscillations can be identified. For the y-component the fast ones appear in the range from 75 to 100 fs, around 120 and 180 fs while the slow ones have larger amplitudes and appear from 100 to 120 fs, 130 to 170 fs, and after 180 fs. Correspondingly two prominent frequency bands occur in the Fourier transforms (Figure 10C) of these two ΔDM signals. For the y-component, e.g., the stronger band is centered in a range from 0.25 to 0.75 eV and a weaker band is located between 0.9 and 1.25 eV. A table of all observed frequencies with an intensity larger than 0.1 can be found in Supplementary Table 3. Again, as final step of the analysis we performed a time-windowed Fourier transform of the y–ΔDM signal using a Gaussian window function with a width of 2.9 fs. Compared to the case of the laser induced ΔDM (see Figure 7) the spectrogram (Figure 10D) shows significantly more structured signals. We observe two main peaks in an energy range from 0 to 0.75 eV at 170 and 195 fs and additionally many weaker signals in the same energy region, as well as for higher frequencies (1.0–1.25 eV). The frequencies appearing at early times (75–100 fs) origin from the first parts of the nuclear wavepacket reaching the coupling region but not actually the CoIn seam. This explains the higher energy reflecting the actual energy gap ΔE. Later at 100 fs also lower frequencies appear as the wavepacket now hits the CoIn seam and the energy gap between the states closes. From now on parts of the moving nuclear wavepacket can be found close to the CoIn or in its environment. The intense signals at 170 and 195 fs correlate with the efficient transitions through the CoIn (see Figure 9A). The same simulations were also performed to obtain the total coupled electron density according to Equation (12). Comparing the results of the full and the 1e-2o density, the same frequencies and pattern are observed in the electron dynamics. However, the intensities for the higher frequencies are dominant for full density. The results for the full density can be found in the Supplementary Material. A complete summary of all performed analyses of the total coupled electron density can be found in Supplementary Section IIIB.
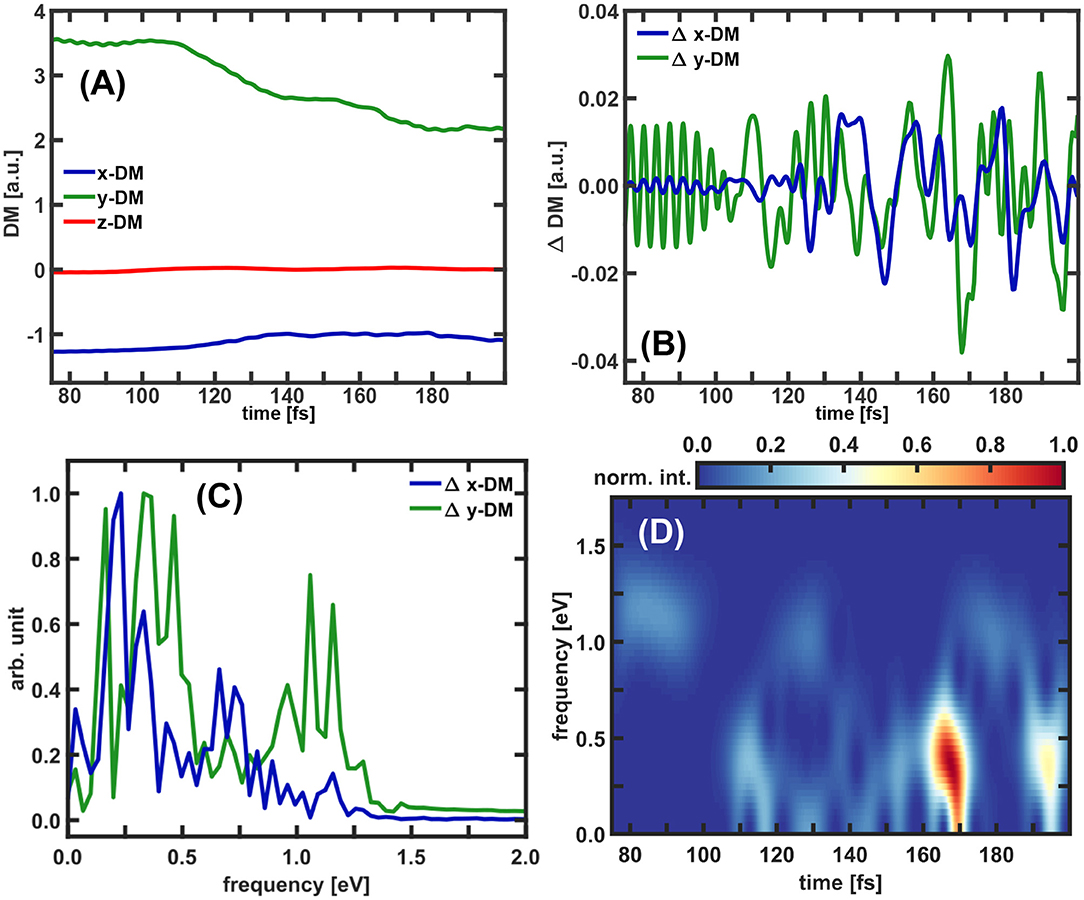
Figure 10. Temporal evolution of the dipole moment for (A) the calculation with the 1e-2o picture density and (B) for the difference between the dipole moment calculated with and without the coherence term included. The ΔDM are only shown for the for x- and y-components. (C) Fourier spectra of x-ΔDM and y–ΔDM. All spectra are normalized to one. (D) Time-windowed Fourier transform of the y-component of ΔDM. The Fourier spectrogram is normalized and a Gaussian window function with a width of 120 data points corresponding to a time of 2.9 fs is used.
In summary, two observations can be made from our NEMol simulation of the conical intersection induced dynamics. The first one is, that the CoIn induces coherent electron dynamics which slows down the closer the system approaches the CoIn. This is expected since CoIn's equalize the time scales of the electron and nuclear dynamics [16, 17]. The second aspect is the longevity of the observed coherence. Due to the delocalized character of the nuclear wavepacket parts of it induce almost continuously coherence in the vicinity of the CoIn leading to a long lived observable signal. This is in good agreement with recently published simulations [52] of TRUECARS signals (transient redistribution of ultrafast electronic coherences in attosecond Raman signals) of the uracil S2/S1 CoIn. There, the long lived signal of coherence is also observed and the time-resolved vibronic frequency maps are in the same energy region.
4. Conclusion
In this paper, we applied our ansatz for the calculation of the coupled electron and nuclear dynamics in molecular systems (NEMol) [28–32] to the nucleobase uracil. We use the recently formulated extended version [32] operating on the NEMol-grid. As the interplay between nuclear and electron dynamics plays a crucial role in excitation processes as well as during non-adiabatic transitions both situations were studied. The NEMol ansatz treats the nuclear and the electron dynamics both quantum-mechanically. The electronic wavefunctions are propagated in the eigenstate bases and coupled to the nuclear dynamics simulated on coupled potential energy surfaces. With a simple approximation it was possible to simplify the description of the excitation and relaxation processes by expressing the total electron density in the one-electron-two-orbital (1e-2o) picture [32]. In this work, both, the total coupled electron density and the simplified 1e-2o picture, were applied.
The NEMol simulations were used to study the photo-excitation and the CoIn mediated relaxation in uracil. By the choice of ultrashort light pulses these two processes are temporally and spatially separated and can be treated separately. During the excitation one electron is promoted from a bonding π orbital into an anti-bonding π* orbital. This general change is clearly visible in the NEMol dynamics but it also enables us to analyze the excitation process in greater depth. As a possible observable in an experiment we choose to focus on the induced dipole moment. Studying its temporal evolution, fast oscillations are observed which could be directly attributed to the coherent electron dynamics. Their frequencies are close to the central frequency of the excitation pulse. The coherent dynamics is induced by the laser pulse and subsequent nuclear movement leads to decoherence. A partial reappearance is induced at the end of the laser pulse when the S2 wavepacket has reentered the FC area. The good agreement between the results obtained with the total electron density and that of the 1e-2o picture supports that the simplified 1e-2o picture can be sufficient to describe the coupled electron dynamics. This 1e-2o picture was used to monitor the coupled electron dynamics induced by the S2/S1 conical intersection. The electronic coherence is induced by parts of the rather delocalized nuclear wavepacket and its recurrences at the CoIn and thus can be observed for long times. The frequencies in the induced dipole moment are now rather small, as expected since at the CoIn's the electron dynamics slows down [16–18]. A distinct modulation of these frequencies is observed in the time-windowed Fourier transform reflecting the movement of the nuclear wavepacket around the CoIn seam. Both the longevity and the modulation of the coherence by the nuclear motion is in good agreement with the recent simulation of the TRUECARS signal of the uracil S2/S1 CoIn [52]. Here, we demonstrated the capability of the NEMol ansatz to describe the coupled nuclear and electron dynamics in a complex molecular system like uracil. We were able to investigate the electronic coherence that is built up by the laser excitation and modulated by the subsequent nuclear motion. The following relaxation via a conical intersection induces again electronic coherence in the system, which is also treated within the NEMol approach. The verified 1e-2o picture will allow to simulate even larger system.
Data Availability Statement
The raw data supporting the conclusions of this article are available from the corresponding author upon reasonable request.
Author Contributions
TS, MK, and RV-R initiated the project. LB performed the calculations. LB, TS, and RV-R analyzed and interpreted the results. All authors contributed to the final version of the manuscript.
Conflict of Interest
The authors declare that the research was conducted in the absence of any commercial or financial relationships that could be construed as a potential conflict of interest.
Acknowledgments
The authors gratefully acknowledge the support by the German Research Foundation via VI 144/9-1 and KL-1439/11-1 and the center of excellence Munich Centre of Advanced Photonics (MAP).
Supplementary Material
The Supplementary Material for this article can be found online at: https://www.frontiersin.org/articles/10.3389/fphy.2021.674573/full#supplementary-material
See the Supplementary Material for the details of the wavepacket simulation setup and additional figures and tables for the analyses of the NEMol-dynamics. Animations of the coupled electron density in the 1e-2o picture and the ones using the full density for dynamics induced by the excitation pulse and the CoIn are also shown in the Supplementary Material.
Supplementary Data Sheet 1. Movie_electron dynamics at CoIn.
Supplementary Data Sheet 2. Movie of electron dynamics during excitation.
References
1. Khorana HG. Rhodopsin, photoreceptor of the rod cell–an emerging pattern for structure and function. J Biol Chem. (1992) 267:1–4. doi: 10.1016/S0021-9258(18)48444-X
2. Send R, Sundholm D. Stairway to the conical intersection: a computational study of the retinal isomerization. J Phys Chem A. (2007) 111:8766–73. doi: 10.1021/jp073908l
3. Polli D, Altoè P, Weingart O, Spillane KM, Manzoni C, Brida D, et al. Conical intersection dynamics of the primary photoisomerization event in vision. Nature. (2010) 467:440–3. doi: 10.1038/nature09346
4. Webber AN, Lubitz W. P700: the primary electron donor of photosystem I. Biochim Biophys Acta. (2001) 1507:61–79. doi: 10.1016/S0005-2728(01)00198-0
5. Mirkovic T, Ostroumov EE, Anna JM, van Grondelle R, Govindjee Scholes GD. Light absorption and energy transfer in the antenna complexes of photosynthetic organisms. Chem Rev. (2017) 117:249–93. doi: 10.1021/acs.chemrev.6b00002
6. Loll B, Kern J, Saenger W, Zouni A, Biesiadka J. Towards complete cofactor arrangement in the 3.0 angstrom resolution structure of photosystem II. Nature. (2005) 438:1040–4. doi: 10.1038/nature04224
7. Scholes GD, Fleming GR, Olaya-Castro A, van Grondelle R. Lessons from nature about solar light harvesting. Nat Chem. (2011) 3:763–74. doi: 10.1038/nchem.1145
8. Collings AF, Critchley C. Artificial Photosynthesis: From Basic Biology to Industrial Application. London: Wiley (2005). doi: 10.1002/3527606742
9. Andrea Rozzi C, Maria Falke S, Spallanzani N, Rubio A, Molinari E, Brida D, et al. Quantum coherence controls the charge separation in a prototypical artificial light-harvesting system. Nat Commun. (2013) 4:1602. doi: 10.1038/ncomms2603
10. Roncali J, Leriche P, Blanchard P. Molecular materials for organic photovoltaics: small is beautiful. Adv Mater. (2014) 26:3821–38. doi: 10.1002/adma.201305999
11. Mazzio KA, Luscombe CK. The future of organic photovoltaics. Chem Soc Rev. (2015) 44:78–90. doi: 10.1039/C4CS00227J
12. Pelzer KM, Darling SB. Charge generation in organic photovoltaics: a review of theory and computation. Mol Syst Des Eng. (2016) 1:10–24. doi: 10.1039/C6ME00005C
13. Ismail AA, Bahnemann DW. Photochemical splitting of water for hydrogen production by photocatalysis: a review. Solar Energy Mater Solar Cells. (2014) 128:85–101. doi: 10.1016/j.solmat.2014.04.037
14. Wenderich K, Mul G. Methods, mechanism, and applications of photodeposition in photocatalysis: a review. Chem Rev. (2016) 116:14587–619. doi: 10.1021/acs.chemrev.6b00327
15. Nelson TR, White AJ, Bjorgaard JA, Sifain AE, Zhang Y, Nebgen B, et al. Non-adiabatic excited-state molecular dynamics: theory and applications for modeling photophysics in extended molecular materials. Chem Rev. (2020) 120:2215–87. doi: 10.1021/acs.chemrev.9b00447
16. Yarkony DR. Diabolical conical intersections. Rev Mod Phys. (1996) 68:985–1013. doi: 10.1103/RevModPhys.68.985
17. Baer M. Introduction to the theory of electronic non-adiabatic coupling terms in molecular systems. Phys Rep. (2002) 358:75–142. doi: 10.1016/S0370-1573(01)00052-7
18. Domcke W, Yarkony D, Köppel H. Conical Intersections: Electronic Structure, Dynamics and Spectroscopy. Vol. 15. Singapore: World Scientific (2004). doi: 10.1142/5406
19. Runge E, Gross EKU. Density-functional theory for time-dependent systems. Phys Rev Lett. (1984) 52:997–1000. doi: 10.1103/PhysRevLett.52.997
20. Klamroth T. Laser-driven electron transfer through metal-insulator-metal contacts: time-dependent configuration interaction singles calculations for a Jellium model. Phys Rev B. (2003) 68:245421. doi: 10.1103/PhysRevB.68.245421
21. Rohringer N, Gordon A, Santra R. Configuration-interaction-based time-dependent orbital approach for ab initio treatment of electronic dynamics in a strong optical laser field. Phys Rev A. (2006) 74:043420. doi: 10.1103/PhysRevA.74.043420
22. Skeidsvoll AS, Balbi A, Koch H. Time-dependent coupled-cluster theory for ultrafast transient-absorption spectroscopy. Phys Rev A. (2020) 102:023115. doi: 10.1103/PhysRevA.102.023115
23. Vila FD, Rehr JJ, Kas JJ, Kowalski K, Peng B. Real-time coupled-cluster approach for the cumulant Green's function. J Chem Theory Comput. (2020) 16:6983–92. doi: 10.1021/acs.jctc.0c00639
24. Ojanperä A, Havu V, Lehtovaara L, Puska M. Nonadiabatic Ehrenfest molecular dynamics within the projector augmented-wave method. J Chem Phys. (2012) 136:144103. doi: 10.1063/1.3700800
25. Alonso JL, Castro A, Echenique P, Rubio A. In: Marques MAL, Maitra NT, Nogueira FMS, Gross EKU, Rubio A, editors. On the combination of TDDFT with molecular dynamics: new developments. In: Fundamentals of Time-Dependent Density Functional Theory. Berlin; Heidelberg: Springer Berlin Heidelberg (2012). p. 301–15. doi: 10.1007/978-3-642-23518-4_15
26. Takatsuka K. Theory of molecular nonadiabatic electron dynamics in condensed phases. J Chem Phys. (2017) 147:174102. doi: 10.1063/1.4993240
27. Takatsuka K. Nuclear wavepackets along quantum paths in nonadiabatic electron wavepacket dynamics. Chem Phys. (2018) 515:52–9. doi: 10.1016/j.chemphys.2018.07.006
28. Geppert D, von den Hoff P, de Vivie-Riedle R. Electron dynamics in molecules: a new combination of nuclear quantum dynamics and electronic structure theory. J Phys B Atomic Mol Opt Phys. (2008) 41:074006. doi: 10.1088/0953-4075/41/7/074006
29. von den Hoff P, Znakovskaya I, Kling MF, de Vivie-Riedle R. Attosecond control of the dissociative ionization via electron localization: a comparison between D2 and CO. Chem Phys. (2009) 366:139–47. doi: 10.1016/j.chemphys.2009.09.021
30. Znakovskaya I, von den Hoff P, Zherebtsov S, Wirth A, Herrwerth O, Vrakking MJJ, et al. Attosecond control of electron dynamics in carbon monoxide. Phys Rev Lett. (2009) 103:103002. doi: 10.1103/PhysRevLett.103.103002
31. Kling MF, von den Hoff P, Znakovskaya I, de Vivie-Riedle R. (Sub-)femtosecond control of molecular reactions via tailoring the electric field of light. Phys Chem Chem Phys. (2013) 15:9448–67. doi: 10.1039/c3cp50591j
32. Schnappinger T, de Vivie-Riedle R. Coupled nuclear and electron dynamics in the vicinity of a conical intersection. J Chem Phys. (2021) 154:134306. doi: 10.1063/5.0041365
33. Cederbaum LS. Born–Oppenheimer approximation and beyond for time-dependent electronic processes. J Chem Phys. (2008) 128:124101. doi: 10.1063/1.2895043
34. Abedi A, Maitra NT, Gross EKU. Exact factorization of the time-dependent electron-nuclear wave function. Phys Rev Lett. (2010) 105:123002. doi: 10.1103/PhysRevLett.105.123002
35. Abedi A, Maitra NT, Gross EKU. Correlated electron-nuclear dynamics: exact factorization of the molecular wavefunction. J Chem Phys. (2012) 137:22A530. doi: 10.1063/1.4745836
36. Chiang YC, Klaiman S, Otto F, Cederbaum LS. The exact wavefunction factorization of a vibronic coupling system. J Chem Phys. (2014) 140:054104. doi: 10.1063/1.4863315
37. Middleton CT, de La Harpe K, Su C, Law YK, Crespo-Hernández CE, Kohler B. DNA excited-state dynamics: from single bases to the double helix. Annu Rev Phys Chem. (2009) 60:217–39. doi: 10.1146/annurev.physchem.59.032607.093719
38. Barbatti M, Aquino AJA, Lischka H. The UV absorption of nucleobases: semi-classical ab initio spectra simulations. Phys Chem Chem Phys. (2010) 12:4959–67. doi: 10.1039/b924956g
39. Esposito L, Banyasz A, Douki T, Perron M, Markovitsi D, Improta R. Effect of C5-methylation of cytosine on the photoreactivity of DNA: a joint experimental and computational study of TCG trinucleotides. J Am Chem Soc. (2014) 136:10838–41. doi: 10.1021/ja5040478
40. Tommasi S, Denissenko MF, Pfeifer GP. Sunlight induces pyrimidine dimers preferentially at 5-methylcytosine bases. Cancer Res. (1997) 57:4727–30.
41. Pfeifer GP, You YH, Besaratinia A. Mutations induced by ultraviolet light. Mutat Res Fundam Mol Mech Mutagen. (2005) 571:19–31. doi: 10.1016/j.mrfmmm.2004.06.057
42. de Gruijl FR. Skin cancer and solar UV radiation. Eur J Cancer. (1999) 35:2003–9. doi: 10.1016/S0959-8049(99)00283-X
43. He YG, Wu CY, Kong W. Decay pathways of thymine and methyl-substituted uracil and thymine in the gas phase. J Phys Chem A. (2003) 107:5145–8. doi: 10.1021/jp034733s
44. Kang H, Lee KT, Jung B, Ko YJ, Kim SK. Intrinsic lifetimes of the excited state of DNA and RNA bases. J Am Chem Soc. (2002) 124:12958–9. doi: 10.1021/ja027627x
45. Crespo-Hernandez CE, Cohen B, Hare PM, Kohler B. Ultrafast excited-state dynamics in nucleic acids. Chem Rev. (2004) 104:1977–2019. doi: 10.1021/cr0206770
46. Ullrich S, Schultz T, Zgierski MZ, Stolow A. Electronic relaxation dynamics in DNA and RNA bases studied by time-resolved photoelectron spectroscopy. Phys Chem Chem Phys. (2004) 6:2796–801. doi: 10.1039/b316324e
47. Keefer D, Thallmair S, Matsika S, de Vivie-Riedle R. Controlling photorelaxation in uracil with shaped laser pulses: a theoretical assessment. J Am Chem Soc. (2017) 139:5061–6. doi: 10.1021/jacs.6b12033
48. Reiter S, Keefer D, de Vivie-Riedle R. RNA environment is responsible for decreased photostability of uracil. J Am Chem Soc. (2018) 140:8714–20. doi: 10.1021/jacs.8b02962
49. Hudock HR, Levine BG, Thompson AL, Satzger H, Townsend D, Gador N, et al. Ab initio molecular dynamics and time-resolved photoelectron spectroscopy of electronically excited uracil and thymine. J Phys Chem A. (2007) 111:8500–8. doi: 10.1021/jp0723665
50. Richter M, Mai S, Marquetand P, Leticia Gonzalez L. Ultrafast intersystem crossing dynamics in uracil unravelled by ab initio molecular dynamics. Phys Chem Chem Phys. (2014) 16:24423–36. doi: 10.1039/C4CP04158E
51. Fingerhut BP, Dorfman KE, Mukamel SJ. Probing the conical intersection dynamics of the RNA base uracil by UV-pump stimulated-Raman-probe signals; ab initio simulations. J Chem Theory Comput. (2014) 10:1172–88. doi: 10.1021/ct401012u
52. Keefer D, Schnappinger T, de Vivie-Riedle R, Mukamel S. Visualizing conical intersection passages via vibronic coherence maps generated by stimulated ultrafast X-ray Raman signals. Proc Natl Acad Sci USA. (2020) 117:24069–75. doi: 10.1073/pnas.2015988117
53. Vacher M, Mendive-Tapia D, Bearpark MJ, Robb MA. Electron dynamics upon ionization: control of the timescale through chemical substitution and effect of nuclear motion. J Chem Phys. (2015) 142:094105. doi: 10.1063/1.4913515
54. Jenkins AJ, Vacher M, Twidale RM, Bearpark MJ, Robb MA. Charge migration in polycyclic norbornadiene cations: winning the race against decoherence. J Chem Phys. (2016) 145:164103. doi: 10.1063/1.4965436
55. Arnold C, Vendrell O, Santra R. Electronic decoherence following photoionization: full quantum-dynamical treatment of the influence of nuclear motion. Phys Rev A. (2017) 95:033425. doi: 10.1103/PhysRevA.95.033425
56. von den Hoff P, Siemering R, Kowalewski M, de Vivie-Riedle R. Electron dynamics and its control in molecules: from diatomics to larger molecular systems. IEEE J Select Top Quantum Electron. (2012) 18:119–29. doi: 10.1109/JSTQE.2011.2107893
57. Nikodem A, Levine RD, Remacle F. Quantum nuclear dynamics pumped and probed by ultrafast polarization controlled steering of a coherent electronic state in LiH. J Phys Chem A. (2016) 120:3343–52. doi: 10.1021/acs.jpca.6b00140
58. Jia D, Manz J, Yang Y. Timing the recoherences of attosecond electronic charge migration by quantum control of femtosecond nuclear dynamics: a case study for HCCI+. J Chem Phys. (2019) 151:244306. doi: 10.1063/1.5134665
59. Schüppel F, Schnappinger T, Bäuml L, de Vivie-Riedle R. Waveform control of molecular dynamics close to a conical intersection. J Chem Phys. (2020) 153:224307. doi: 10.1063/5.0031398
60. Bhattacherjee A, Leone SR. Ultrafast X-ray transient absorption spectroscopy of gas-phase photochemical reactions: a new universal probe of photoinduced molecular dynamics. Acc Chem Res. (2018) 51:3203–11. doi: 10.1021/acs.accounts.8b00462
61. Zinchenko KS, Ardana-Lamas F, Seidu I, Neville SP, van der Veen J, Lanfaloni VU, et al. Sub-7-femtosecond conical-intersection dynamics probed at the carbon K-edge. Science. (2021) 371:489–94. doi: 10.1126/science.abf1656
62. Bayer T, Braun H, Sarpe C, Siemering R, von den Hoff P, de Vivie-Riedle R, et al. Charge oscillation controlled molecular excitation. Phys Rev Lett. (2013) 110:123003. doi: 10.1103/PhysRevLett.110.123003
Keywords: quantum dynamics, coupled nuclear and electron dynamics, electronic coherence, conical intersection, photo-excitation, uracil
Citation: Bäuml L, Schnappinger T, Kling MF and de Vivie-Riedle R (2021) Photo-Induced Coupled Nuclear and Electron Dynamics in the Nucleobase Uracil. Front. Phys. 9:674573. doi: 10.3389/fphy.2021.674573
Received: 01 March 2021; Accepted: 19 April 2021;
Published: 20 May 2021.
Edited by:
Tamar Seideman, Northwestern University, United StatesReviewed by:
Burkhard Schmidt, Freie Universität Berlin, GermanyJiri Pittner, J. Heyrovsky Institute of Physical Chemistry (ASCR), Czechia
Copyright © 2021 Bäuml, Schnappinger, Kling and de Vivie-Riedle. This is an open-access article distributed under the terms of the Creative Commons Attribution License (CC BY). The use, distribution or reproduction in other forums is permitted, provided the original author(s) and the copyright owner(s) are credited and that the original publication in this journal is cited, in accordance with accepted academic practice. No use, distribution or reproduction is permitted which does not comply with these terms.
*Correspondence: Regina de Vivie-Riedle, UmVnaW5hLmRlX1ZpdmllQGN1cA==.uni-muenchen.de
†These authors have contributed equally to this work and share first authorship