 Robin J. Schneider
 Kelly L. Roe
 Colleen M. Hansel
 Bettina M. Voelker
- 1Department of Chemistry, St. John's University, New York, NY, USA
- 2Department of Chemistry and Geochemistry, Colorado School of Mines, Golden, CO, USA
- 3Department of Marine Chemistry and Geochemistry, Woods Hole Oceanographic Institution, Woods Hole, MA, USA
Biological production and decay of the reactive oxygen species (ROS) hydrogen peroxide (H2O2) and superoxide (O) likely have significant effects on the cycling of trace metals and carbon in marine systems. In this study, extracellular production rates of H2O2 and O were determined for five species of marine diatoms in the presence and absence of light. Production of both ROS was measured in parallel by suspending cells on filters and measuring the ROS downstream using chemiluminescence probes. In addition, the ability of these organisms to break down O and H2O2 was examined by measuring recovery of O and H2O2 added to the influent medium. O production rates ranged from undetectable to 7.3 × 10⁻¹⁶ mol cell−1 h−1, while H2O2 production rates ranged from undetectable to 3.4 × 10⁻¹⁶ mol cell−1 h−1. Results suggest that extracellular ROS production occurs through a variety of pathways even amongst organisms of the same genus. Thalassiosira spp. produced more O in light than dark, even when the organisms were killed, indicating that O is produced via a passive photochemical process on the cell surface. The ratio of H2O2 to O production rates was consistent with production of H2O2 solely through dismutation of O for T. oceanica, while T. pseudonana made much more H2O2 than O. T. weissflogii only produced H2O2 when stressed or killed. P. tricornutum cells did not make cell-associated ROS, but did secrete H2O2-producing substances into the growth medium. In all organisms, recovery rates for killed cultures (94–100% H2O2; 10–80% O) were consistently higher than those for live cultures (65–95% H2O2; 10–50% O). While recovery rates for killed cultures in H2O2 indicate that nearly all H2O2 was degraded by active cell processes, O decay appeared to occur via a combination of active and passive processes. Overall, this study shows that the rates and pathways for ROS production and decay vary greatly among diatom species, even between those that are closely related, and as a function of light conditions.
Introduction
The reactive oxygen species (ROS), superoxide radical (O), hydrogen peroxide (H2O2), and hydroxyl radical (OH) are intermediates in the sequential one-electron reduction of oxygen to water, and are important to the biogeochemical cycling of trace metals and carbon.
Photochemical production of O in the marine environment has been well-studied, and occurs when photo-excited chromophoric dissolved organic matter (CDOM) transfers an electron to dissolved O2 to generate O (Cooper et al., 1988; Shaked et al., 2010). Biological production of O also occurs in marine environments, but is less well-understood than photochemical production (Rose et al., 2010). The typical removal pathways for O are by a dismutation reaction (Cooper and Zika, 1983; Zafiriou, 1990) and by redox reactions with trace metals and organic matter (Goldstone and Voelker, 2000; Wuttig et al., 2013).
H2O2 is produced through dismutation and reduction of O; it therefore has the same photochemical and biological sources as O (Zhang et al., 2012). In addition, H2O2 can be produced biologically without O as a precursor (Palenik et al., 1987). H2O2 can decompose through reaction with reduced metals to form OH; however, in marine environments, the predominant method of decay is likely to be enzymatic destruction (Petasne and Zika, 1997; Herut et al., 1998; Yuan and Shiller, 2001).
Field studies have shown that particle-associated production of ROS occurs in the ocean (Avery et al., 2005; Rose et al., 2008; Hansard et al., 2010) and that this production can be slowed by biological inhibitors (Moffett and Zafiriou, 1990; Rose et al., 2010), indicating that it is of biological origin. Recent studies by Vermilyea et al. (2010) and Roe et al. (2016) show that dark production of H2O2 in the Gulf of Alaska and at Station ALOHA is significant compared to photochemical production, indicating that biological ROS production may impact biogeochemical cycles in the ocean. Thus, it is important to consider which organisms produce ROS, how they do so, and why.
Most culture studies of biological extracellular ROS production have been performed on ichthyotoxic organisms that negatively impact the fishing industry. Chattonella marina, in particular, along with other raphidophyte species, have been studied intensively (see list in Marshall et al., 2002). However, from a global perspective, it is interesting to consider the more common phytoplankton—diatoms, coccolithophores, and cyanobacteria—which are more likely to influence biological production of ROS in the majority of the ocean. Extracellular production rates have been quantified in only a few species to date (see Table 1 and references cited therein): the diatoms Thalassiosira pseudonana and T. weissflogii, coccolithophore Pleurochrysis carterae, and cyanobacteria Synechococcus sp., Lyngbya majuscula and Anacystis nidulans. Compared to raphidophytes, these species of phytoplankton have cell normalized O and H2O2 production rates that are up to five orders of magnitude lower (Table 1).
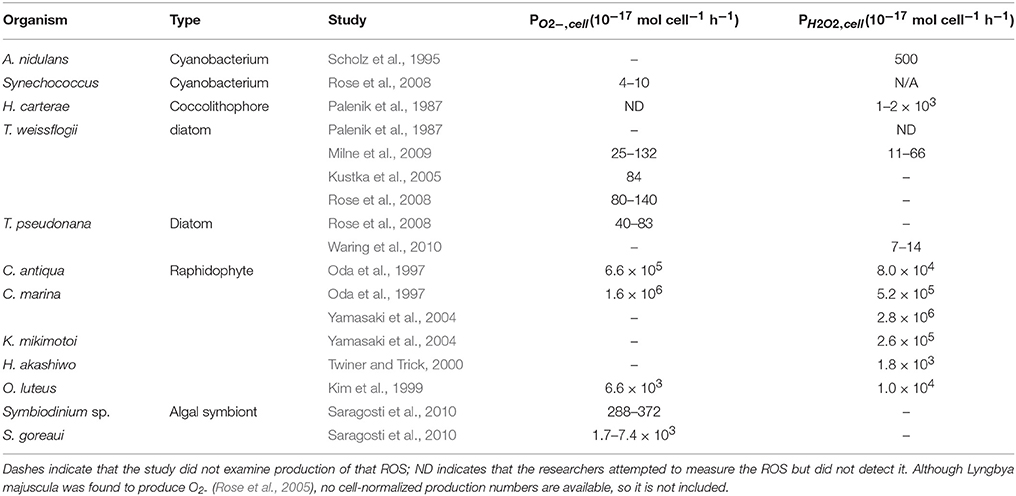
Table 1. Previously published phytoplankton studies showing cell-normalized production of superoxide (PO2−, cell) and hydrogen peroxide (PH22, cell).
Previous studies suggest that ROS production may occur for different reasons in different organisms. Palenik and Morel (1990) showed that H. carterae produced H2O2 as a byproduct of uptake of organic nitrogen sources. Two organisms, Trichodesmium (Roe and Barbeau, 2014) and Lyngbya majuscula (Rose et al., 2005) have been postulated to use O as a reductant to facilitate biological uptake of iron. In contrast, production of superoxide was not beneficial for iron uptake by T. weissflogii (Kustka et al., 2005); an alternative explanation for superoxide production by T. weissflogii has not been proposed. Alternatively, O has also been proposed as a cell signal and autocrine growth promoter in C. marina and Prymnesium parum that is required for cell proliferation (Oda et al., 1995; Marshall et al., 2005).
Extracellular H2O2 could be produced simply via dismutation or reduction of biologically produced O, or due to direct production by a separate mechanism. Thus, one way to gain a better understanding of H2O2 production mechanisms is to determine the relationship between extracellular O and H2O2 production rates. Of the previous studies on ROS production by non-raphidophytes, only two (Palenik et al., 1987; Milne et al., 2009) measured both species directly. In the first study, P. carterae produced H2O2 without measurable O during uptake of organic nitrogen (Palenik et al., 1987). By contrast, the ratio between O and H2O2 production by T. weissflogii under high light conditions was around the 2:1 ratio expected for production of H2O2 via the superoxide dismutation pathway (Milne et al., 2009).
Direct comparisons of rates of biological production of both O and H2O2 under light and dark conditions are important for better understanding factors that stimulate production, determining links between production and photosynthesis, and identifying possible sources of ROS to the dark ocean. Milne et al. (2009) showed increased extracellular production of O by T. weissflogii under high light conditions (150–500 μmol photons m−2 s−1), and Waring et al. (2010) showed increased H2O2 production by T. pseudonana under high light (1000 μmol photons m−2 s−1). Nevertheless, enhanced O production cannot be a direct byproduct of photosynthesis, as O cannot pass the cell membrane (Seaver and Imlay, 2001). Instead, stimulated photosynthetic activity would lead to increased intracellular NADPH pools that could serve as a source of reducing equivalents to transmembrane NADPH oxidoreductases proposed to be involved in extracellular superoxide production (see for instance, Kawano et al., 1996). Another possibility that has not been examined is that light-induced ROS production is due to a passive biological mechanism (e.g., outer membrane proteins and/or pigments) on the cell surface; if so, ROS production in the light could continue even after cell death.
Finally, ROS production rates are typically reported as net production rates, which do not take into account the contribution of decay to ROS concentrations. Diaz et al. (2013) showed that net O production rates by heterotrophic bacteria could be significantly affected by decay. Thus, to obtain gross production rates, decay, and production rates should be addressed in conjunction with each other. In addition, although Wong et al. (2003) found that killed organisms decompose substantially less H2O2 than live ones, no study has yet determined whether there is a similar effect on O decomposition.
The goals of this study were to measure O and H2O2 production by common phytoplankton, to examine whether there is a link between the two ROS, and to determine the influence of light and active metabolism on their production and decay rates. We focused on five species of diatoms, three of which were in the same genus. Production of both ROS was measured in parallel by both live and killed cultures under light and dark conditions. In addition to measuring production rates, we also determined recoveries of the ROS during measurement. This not only allowed us to quantify gross, rather than net, production, but also served as a measurement of the relative ability of these organisms to break down ROS under different conditions.
Materials and Methods
Organisms: Growth and Experimental Conditions
Five marine diatom species were used in this study: Thalassiosira pseudonana (CCMP 1335), Phaeodactylum tricornutum, Cyclotella cryptica (CCMP 332), Thalassiosira oceanica (CCMP 1005), and Thalassiosira weissflogii (CCMP 1336). Axenic cultures were obtained from the National Center for Marine Algae (NCMA) and from the Hildebrand lab at Scripps Institute of Oceanography. Maintenance cultures were grown in acid-washed polycarbonate flasks in Guillard's F/2 medium (Sigma) under grow lights at 20°C at 100 μmol photons m−2s−1 (as measured by a LI-COR LI-250 light meter and LI-190 Quantum/PAR sensor) with a 12 h light:dark cycle. Maintenance cultures were transferred to fresh medium every 2 weeks. An aliquot was taken from the maintenance culture during exponential growth to start the experimental culture, which was grown to mid-exponential phase under the same conditions in F/2 medium before being harvested for the experiment. On the day of the experiment, an aliquot of experimental culture was removed for measuring cell density on a Beckman Z2 Coulter counter, and all cultures were checked for purity with marine purity broth (Saito et al., 2002) or, for P. tricornutum, by making slides of DAPI-stained cultures.
Cells were harvested for each experimental run by removing an aliquot (~5 mL to get ~106 cells) of the experimental culture from the light and loading it directly onto an acid-washed (0.1 M HCl) 25-mm 0.45-μm cellulose acetate syringe filter (VWR) as described below. The total number of cells on each filter was estimated based on multiplying the cell density per mL by the volume of culture loaded. The filter disk was positioned parallel to the floor for the whole experiment. For H2O2 measurements, cells were generally loaded onto the filter using a peristaltic pump (0.6 mL min−1). In a few experiments, cells were gently loaded using a syringe (~5 mL/min). For O measurements, the culture was loaded onto the filter using a peristaltic pump at 3 mL min−1, and the pump was briefly stopped (<2 s) while the tubing was moved from the ASW bottle to the culture bottle to avoid trapping air on the filter.
For both O and H2O2 measurements, the entire experimental run was either conducted under light conditions (from a small grow light emitting 75 μmol photons m−2 s−1 as measured by a LI-COR LI-250 light meter and LI-190 Quantum/PAR sensor held directly adjacent to the filter) or in the dark (wrapped in foil). The analytical medium was an artificial seawater (hereafter referred to as ASW) based on a modified Aquil medium (Price et al., 1989) where only the major salts were added and chelexed, adjusted to pH 8, and amended with 10 μM of the chelator diethylenetriaminepentaacetic acid (DTPA) (Sigma), which was added to prevent rapid loss of O via reactions with trace metals.
A 4% formaldehyde killed control was allowed to incubate for ~2 h before the cells were rinsed on a 2.0 μm filter and resuspended in fresh F/2 medium. The killed culture was then placed back in the growing conditions for ~1 h before being harvested for the experiment. A second killed control was maintained in the growth conditions for a week to ensure that this procedure successfully killed each organism.
Each organism was analyzed on two separate days, and on each day, six experimental runs were performed: two runs with live organisms kept in the dark; two runs with live organisms in the light; and one run each with killed organisms in the light and in the dark.
O Detection
O was detected with a flow injection system (FeLume Mini, Waterville Analytical) with the use of the MCLA chemiluminescence probe (Godrant et al., 2009) using the experimental set-up described in Section S1.1 (Figure S1).
Calibration of the instrument was completed at the start of each experimental day using ASW. An acid-washed 25-mm 0.45-μm cellulose acetate filter was used during calibration to mimic runs in the presence of cells as closely as possible. Briefly, primary O stock solutions were prepared with KO2 and calibrated spectrophotometrically. These were then diluted to make working stock solutions, which were added to the ASW (see Section S1.2 for details). The output signal was then monitored as a function of time and fit to:
where Rt is the measured response at time t, RBL is the baseline response, Rt = 0 is the baseline corrected response at t = 0, and kloss, O2− is the pseudo-first order decay constant in the analytical medium. The sensitivity (S, counts nM−1) of the response was determined as:
An average of four S measurements was used for each calibration. [O]spike generally ranged from 0.207 to 1.079 nM. No dependence of S on [O]spike was observed and all of the decay curves were well-described by first-order kinetics.
Calculation of O Production and Percent Recovery from Cultures
An experimental run consisted of the following steps: measuring the steady-state signal RASW from running ASW past an empty filter, loading cells on the filter, measuring the steady-state signal Rcell from running ASW past the cells on the filter, observing the signal response to a known O spike to determine the recovery of O in the presence of cells, and finally measuring the steady-state background signal from MCLA autooxidation, RSOD, after addition of ~0.24 U mL −1 (~1.6 nM) SOD to the ASW (Section S1.3, Figure S2).
Recovery RecO2− was determined by fitting the spike data to Equation (1), with RBLfixed to the measured value of Rcell. The recovery (RecO2−) was then calculated from:
where Expected Rt = 0 was calculated as the product of sensitivity S and the concentration of the added O spike.
The increase in O concentration due to production by the cells, [O]cell (nM), was calculated from:
where the first term represents the O concentration measured in the presence of cells and the second term, [O]ASW, is the background concentration of O in the ASW. [O]ASW was calculated according to:
The cell-normalized production rate PO2−, cell (nmol cell−1 h−1) was determined by:
where Q is the flow rate (L s−1) and N is the total number of cells on the filter.
Our calculations of [O]cell and [O]ASW above assume that the difference between RASW and RSOD is due only to a background concentration of O in the ASW. We have tested this assumption in another work (Roe, unpublished data), where we observed that small (<0.1 nM) additions of SOD to the ASW bottle decreased RASW proportionally to the resulting increase in O decay rate. This gradual decrease in RASW-RSOD with increasing SOD concentration can therefore be attributed to a “bottle blank” created by a constant background production rate of O in the ASW bottle, which could be due to compounds entering from the atmosphere or to redox reactions occurring at the bottle wall or in the ASW. The final large addition of SOD to the ASW bottle to establish RSOD caused an additional small decrease in signal, indicating that there is another effect of SOD beyond eliminating the “bottle blank” O, which we will call a method blank. By not accounting for the method blank separately, we are essentially assuming that it will be affected by the decreased recovery in the presence of cells the same way that the O bottle blank is affected. However, because the method blank is small, this assumption does not add much uncertainty to our reported measurements. The method blank in DTPA-amended ASW corresponded to a contribution to [O]ASW (as defined by Equation 5) of 0.015 ± 0.006 nM (n = 7) (Roe, unpublished data). If the method blank in the present study is similar to that measured by Roe et al., but not affected by recovery, our reported values of [O]cell would represent an overestimate of 6 ± 4%.
We define the detection limit for each run as five times the standard deviation of the baseline signal. Detection limits converted to concentration by dividing by S ranged from 0.013 to 0.092 nM. In several samples, the signal from the spike did not give a detectable offset from Rcell. In these cases, RecO2−, [O]cell, and PO2− could not be determined.
H2O2 Detection and Calibration
H2O2 was measured by flow injection analysis using a Waterville Analytical FeLume system and the base-catalyzed chemiluminescent reaction with acridinium ester as described by Cooper et al. (2000) and King et al. (2007). Briefly, a slug (~0.5 mL) of sample was pushed into the system by a stream consisting of an artificial seawater (ASW) (Price et al., 1989) treated with 10 U/mL catalase. The sample then combined with the acridinium ester reagent (10 μM, pH 3) in a mixing tee. Next the sample/acridinium ester mixture entered a flow cell, where it mixed with carbonate buffer (0.02 M, pH 11.2). The photons produced by the reaction were measured by a photomultiplier tube (Section S2, Figure S3).
A calibration curve was created at the beginning of each experimental day by standard additions of H2O2 stock to aliquots of ASW. H2O2 stock solutions were prepared immediately before calibration by dilution of a ~3 mM primary stock solution that was stored in the refrigerator. The concentration of the primary stock solution was determined approximately every 2 months by measuring its absorbance at 240 nM, at which the molar absorptivity of H2O2 is 38.1 ± 1.4 M−1 cm−1 (Miller and Kester, 1988). The loss of H2O2 in the primary stock solution over the course of the study was less than 1%.
Calculation of Production Rates and Percent Recovery for H2O2
For each experimental run, filter-sterilized ASW flowed through a peristaltic pump at 0.6 mL min−1 over an empty acid-washed (0.1 M HCl) filter and directly into the FeLume system until a steady-state concentration of H2O2, representing a background concentration, was detected ([H2O2]unspiked, direct). Next, the cells were loaded onto the filter as described above, and the H2O2 was again monitored until a steady state was reached ([H2O2]unspiked, cells). Then the ASW was spiked with additional H2O2 and flowed over the cells and measured ([H2O2]spiked, direct). Finally, the filter was disconnected from the ASW stream and the H2O2 of the spiked ASW was quantified ([H2O2]spiked, direct). An example of a typical experimental run is shown in Figure S4.
Recovery (RecH2O2) for each experimental run was calculated by dividing the increase in [H2O2] in the medium due to the addition of the H2O2 spike by the measured increase in the presence of cells:
Calculation of recovery in this manner assumes that the cells on the filter break down the same fraction of H2O2 from both the spiked and unspiked medium, i.e., that the decomposition is first order in H2O2.
The increase in [H2O2] due to cell production, [H2O2]cell (nmol L−1) for a given experimental run was then calculated with the equation:
A cell-normalized production rate PH2O2 (nmol cell−1 h−1) was then calculated with the equation:
where Q is the flow rate (L h−1) and N is the number of cells on the filter, calculated from the measured cell density in the experimental culture and the volume of culture loaded onto the filter.
Spiked Batch Incubations with Spent Culture Medium
The ability of spent culture medium from P. tricornutum to produce and break down ROS was assessed by using spiked batch incubation methodology, as described in Vermilyea et al. (2010). Briefly, mid-exponential P. tricornutum cultures were filtered using 0.22 μm PES syringe filters (Millipore) at approximately 10 mL min−1, changing the syringe filters after every 10 mL of culture. The filtrate was collected in two 60-mL syringes (Kendell Mono-ject), one of which was then spiked with additional H2O2 to determine whether simultaneous H2O2 decay took place. The syringes were then incubated at room temperature in the dark and [H2O2] was monitored over a period of several hours to determine production and decay rates.
If the production rate in the medium, P'H2O2 (nM h−1) is constant per unit volume, and decay is first-order with respect to [H2O2], the change in [H2O2] over time is given by the equation:
where k'loss, H2O2 (h−1) is the pseudo-first order rate coefficient of H2O2 decay. Time and concentration data from each spiked batch incubation were fitted to the solution to differential Equation 10:
using the Microsoft Excel Solver function with the initial [H2O2], [H2O2]0, of each incubation and global P and k'loss, H2O2 values for both incubations as fitting parameters.
Replicates and Measurement Uncertainties
Dark and light live production rates for O and H2O2 were measured in duplicate on a given experimental day, while single measurements of killed dark and light production rates were measured each day. Data for each condition from two separate experimental cultures, examined on different days, were pooled for each organism except as noted.
Statistical significance for all results was assessed using a two-tailed t-test with the minimum level for significance at p = 0.05. Reported uncertainties in figures and text represent one standard deviation. Detection limits for PO2 and PH2O2 are a function of the size of the analytical and background signals, the recovery, and the cell density, and therefore varied from run to run. For the purposes of this work, we treat any set of replicate results whose average was not significantly greater than zero (using a t-test and p = 0.05) as below detection limit.
Results
Thalassiosira Culture ROS Production
O
Successful measurements of PO2− were performed in cultures of all three Thalassiosira spp. under all four conditions (Figure 1). T. oceanica and T. pseudonana had similar live PO2−, with both dark and light live conditions giving production rates significantly greater than zero. T. oceanica had an average PO2− of 18.0 ± 3.9 × 10⁻¹⁷ mol cell−1 h−1 in the light and 6.0 ± 0.8 × 10⁻¹⁷ mol cell−1 h−1 in the dark (n = 4). T. pseudonana had an average PO2− of 13.9 ± 5.1 × 10⁻¹⁷ mol cell−1 h−1 in the light and 7.5 ± 1.5 × 10⁻¹⁷ mol cell−1 h−1 in the dark (n = 4). For both of these organisms, the live PO2− values were also considerably greater (~2–5 times) than the corresponding killed production rates, with the difference being statistically significant for the dark values. T. weissflogii had much greater production rates than the other two species, 72.7 ± 2.3 × 10⁻¹⁷ mol cell−1 h−1 in the light and 25.2 ± 7.6 × 10⁻¹⁷ mol cell−1 h−1 in the dark (n = 2). However, T. weissflogii is also the largest of the three organisms, and its production rates look similar to those of T. oceanica and T. pseudonana when normalized to surface area (Section S4, Figure S6). Because of the lower number of replicates for T. weissflogii analyses, the measurement uncertainties for this species were high (the spike signal was undetectable in the replicate analysis, so RecO2− and PO2− could not be determined). As a result, only the light live PO2− is significantly greater than zero for this organism.
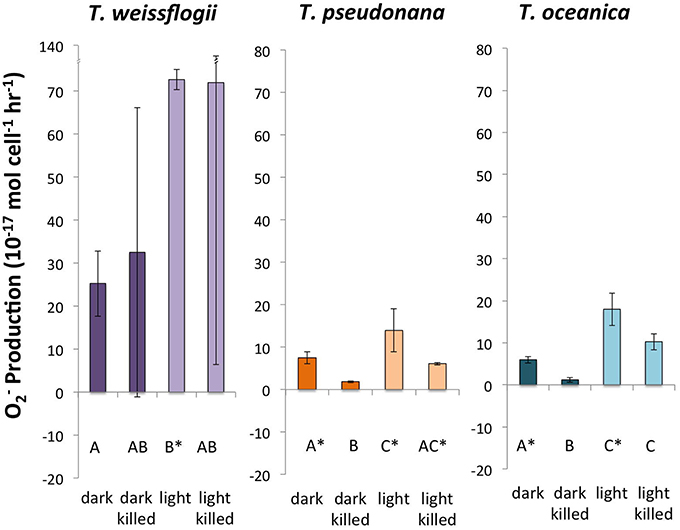
Figure 1. Calculated O production rates in genus Thalassiosira. Error bars represent one standard deviation. Letters designate rates significantly different from each other within each panel. Asterisks designate PO2− values significantly different from zero.
The light treatments had a greater PO2− than the dark treatments (~2–8 times more) for all three organisms, and the differences were statistically significant for both live and killed T. oceanica and T. pseudonana, and live T. weissflogii. The light-induced increase in live cultures did not differ significantly from the light-induced increase in killed cultures for any of the three organisms (Figure 2). These findings are summarized in Table 2.
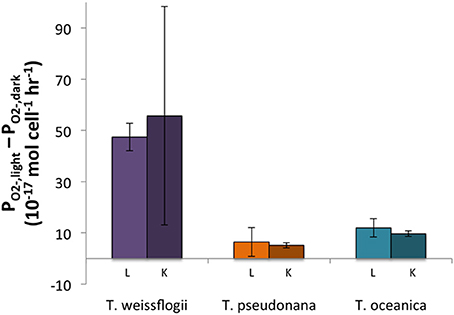
Figure 2. Differences between light and dark PO2− for both live (L) and killed (K) cultures in Thalassiosira spp. Error bars represent one standard deviation.
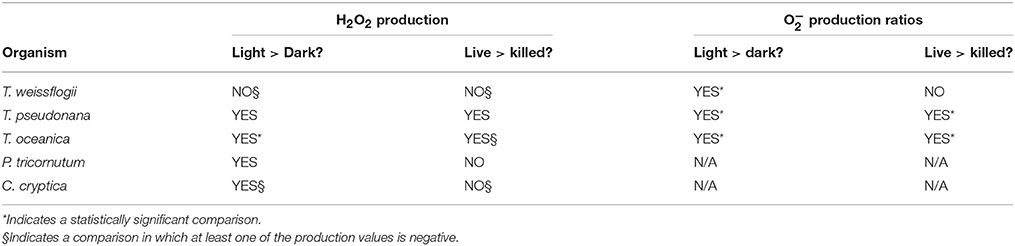
Table 2. Summary of light vs. dark and live vs. killed comparison for H2O2 and O production rates.
H2O2
Of the three species of Thalassiosira studied, only live cultures of T. oceanica produced significantly more H2O2 in light than in dark conditions, 10.5 ± 4.6 × 10⁻¹⁷ mol cell−1 h−1 (n = 4) as opposed to 2.1 ± 2.1 × 10⁻¹⁷ mol cell−1 h−1 (n = 4) (Figure 3). T. pseudonana appeared to produce slightly, but not significantly, more H2O2 in light than in dark conditions: 22.4 ± 11.9 × 10⁻¹⁷ mol cell−1 h−1 (n = 4) vs. 18.9 ± 7.2 × 10⁻¹⁷ mol cell−1 h−1 (n = 4). By contrast, live cultures of T. weissflogii had H2O2 production rates statistically indistinguishable from zero in both dark (n = 3 with one statistical outlier, with a large negative production rate, removed) and light (n = 4) experiments. Killed cultures of both T. pseudonana and T. oceanica had H2O2 production rates indistinguishable from zero, whereas H2O2 production by killed cultures of T. weissflogii was relatively high, 34.5 ± 29.8 × 10⁻¹⁷ mol cell−1 h−1 in the dark (n = 2) and 26.1 ± 7.6 × 10⁻¹⁷ mol cell−1 h−1 in the light (Figure 3). Normalized to cell surface area, T. pseudonana produced much more H2O2 than the other two organisms (Section S4, Figure S7).
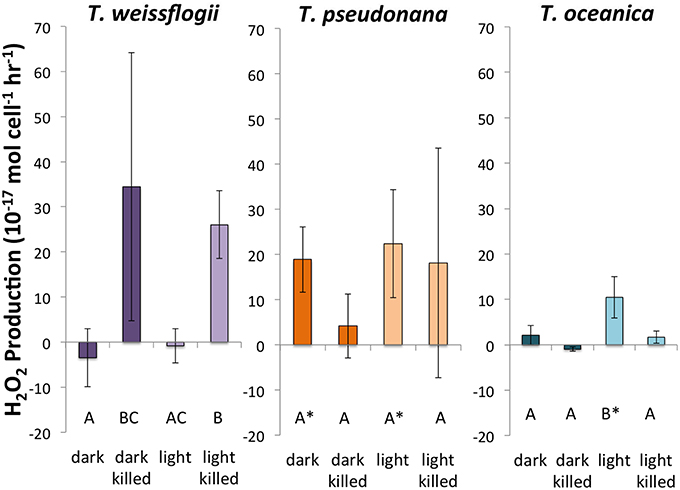
Figure 3. Calculated H2O2 production rates in Thalassiosira spp. Error bars represent one standard deviation. Letters designate rates significantly different from each other within each panel. Asterisks represent H2O2 production rates that are significantly different from zero.
ROS Production in Other Axenic Diatom Cultures
O
Live cultures of both Phaeodactylum tricornutum and Cyclotella cryptica were observed to produce a O signal that could be detected above the ASW medium. However, a PO2− could not be calculated since RecO2 could not be determined. For P. tricornutum the detection limit was 0.054 ± 0.024 nM or a RecO2− <12%. For C. cryptica the detection limit was 0.033 ± 0.012 nM or a RecO2− <5%.
H2O2
In both live and killed cultures of both organisms, H2O2 production rates were generally indistinguishable from zero (Section S3, Figure S5).
Although P. tricornutum cells did not appear to make much H2O2 on the filter, high [H2O2] in the growth medium was observed when cells were first loaded onto the filter, suggesting that the cells secreted ROS-producing small molecules or enzymes. Using the methodology described in the Section titled Spiked Batch Incubations with Spent Culture Medium, we observed that cell-free spent culture medium had a H2O2 decay rate below detection limit and an H2O2 production rate P'H2O2 that remained constant at 36.9 ± 9.1 nM h−1 (n = 2) over the course of 5 h. Taking into account the original cell densities, this would equate to a cell-normalized production rate, PH2O2, of 50 × 10−17 mol cell−1 h−1. By contrast, sterile F/2 medium had decay of 0.2 h−1 and production of 0.3 nM h−1 (n = 1) (Figure 4). Although high [O] in the medium was also observed during cell loading, it was not possible to quantify O production rates in the spent medium with a similar methodology, due to the fast O decay rates.
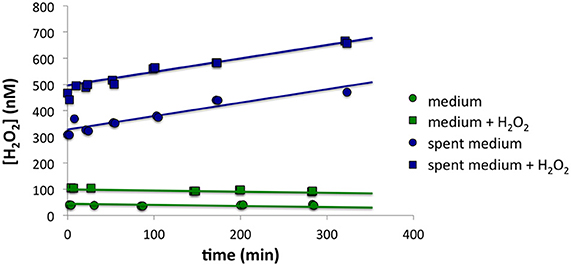
Figure 4. Spiked batch incubations for (top) spent growth medium from P. tricornutum and (bottom) sterile F/2 medium. The circles indicate unaltered medium, while the squares indicate medium that has been spiked with additional H2O2.
ROS Recoveries
O Recoveries
The O standard addition spike could be detected in all Thalassiosira cultures except for one of the replicate live T. weissflogii cultures. Each Thalassiosira species decreased the signal observed from the spike, with all the live cultures degrading significantly more O (indicated by lower RecO2−) than the killed cultures (P < 0.05), except for T. weissflogii. The average live RecO2− were 18.2 ± 5.4% (n = 8), 21.3 ± 10.8% (n = 8), and 9.1 ± 1.3% (n = 4) for T. pseudonana, T. oceanica, and T. weissflogii, respectively. The average killed RecO2− were 43.4 ± 5.0% (n = 4), 46.8 ± 21.7% (n = 4), and 16.9 ± 6.9% (n = 4) for T. pseudonana, T. oceanica, and T. weissflogii, respectively. There were no significant differences in the RecO2− for the light and dark treatments for both T. weissflogii cultures and the live T. pseudonana cultures (P > 0.05) but differences were observed for killed T. pseudonana cultures and both T. oceanica cultures (P < 0.05) (Figure 5). Recovery values can be converted to surface-area-normalized O decay coefficients for a more direct comparison of these different organisms' ability to degrade O. These calculations show that even on a surface-area normalized basis, T. weissflogii will degrade O more rapidly than the other two organisms (Section S5, Figure S8). The O spikes could not be detected in the presence of C. cryptica and P. tricornutum, meaning that RecO2− could not be determined.
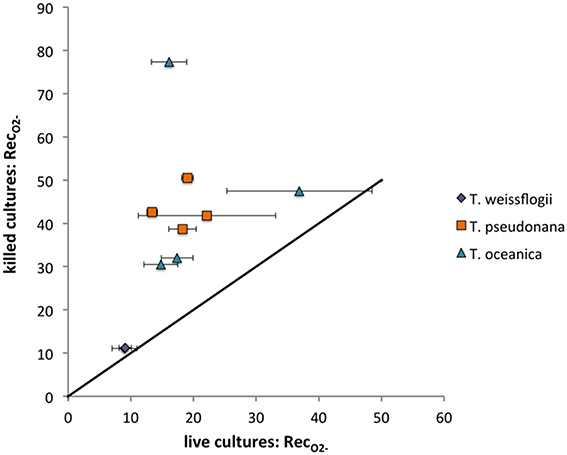
Figure 5. O recoveries (%) for Thalassiosira cultures examined. Live values shown are averages and standard deviations from duplicate measurements on the same day. The line represents a 1:1 relationship.
H2O2 Recoveries
All of the species in the present study decayed H2O2 (Figure 6), though the recoveries were always higher than for O (indicating less decay) under the same conditions (compare Figure 5 and Figure 6). Live T. weissflogii degraded significantly more H2O2 than the other organisms, with recovery rates of 66 ± 3% (n = 7), as opposed to rates ranging from 84 ± 5% in P. tricornutum (n = 8) to 93 ± 2% in C. cryptica (n = 8). Even on a cell-surface area normalized basis, T. weissflogii's ability to degrade H2O2 was greater than those of the other organisms (Figure S9). H2O2 recoveries were statistically indistinguishable from 100% in killed organisms. Of the cultures studied, only C. cryptica had a value of RecH2O2 for killed cultures (99 ± 5%, n = 4) that was not significantly different from that for live cultures. H2O2 recovery rates were not determined for killed cultures of P. tricornutum.
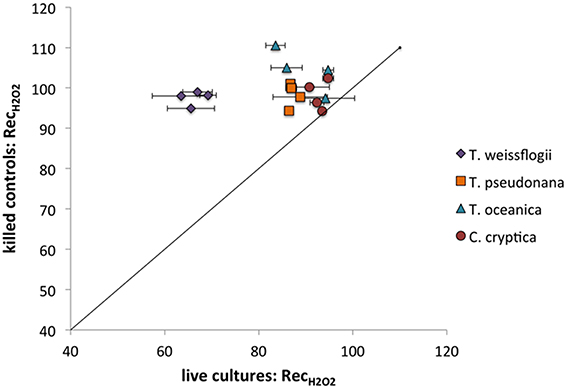
Figure 6. H2O2 recovery percentages for live vs. killed organisms for T. weissflogii, T. pseudonana, T. oceanica, and C. cryptica. The line represents a 1:1 relationship.
H2O2 Production in Cultures Loaded on the Filter by Syringe
In early H2O2 experiments, aliquots of culture were loaded on the filter using a syringe. Differences between the syringe-loaded and pump-loaded live cultures were compared in two diatom species, T. oceanica and T. weissflogii (Figure 7). For purposes of this section, both light and dark measurements are pooled.
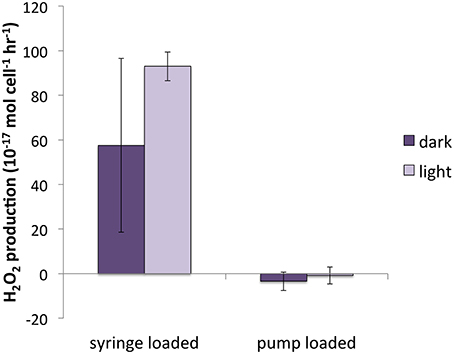
Figure 7. H2O2 production for pump-loaded vs. syringe loaded cultures of T. weissflogii.
There was no significant difference between syringe-loaded cultures and pump-loaded cultures for T. oceanica. PH2O2 was 7.1 ± 5.5 × 10⁻¹⁷ mol cell−1 h−1 for pump-loaded cultures (n = 8) and 10.7 ± 4.0 × 10⁻¹⁷ mol cell−1 h−1 for syringe-loaded cultures (n = 9); recovery percentages were 88 ± 5 and 86 ± 3%, respectively. While recovery rates were also statistically indistinguishable for T. weissflogii (66 ± 4% and 63 ± 6% for pump-loaded cultures vs. syringe loaded cultures, respectively), production rates were substantially different: in pump-loaded cultures (n = 7), H2O2 production rates were statistically indistinguishable from zero, while in syringe-loaded cultures (n = 4), they were significantly higher at 80.3 ± 22.1 × 10⁻¹⁷ mol cell−1 h−1.
Discussion
Diatom O Production
The O values reported in the present study compare well to the previously published values (Kustka et al., 2005; Rose et al., 2008; Milne et al., 2009) for T. weissflogii (Table 3). Both Milne et al. (2009) and the present study found that light enhances PO2−, though killed cultures were not examined in the former. It appears that the light response can also occur in low light since Milne et al. (2009) found increased PO2− with as little as 30 μmol photons m−2 s−1 light intensity while 75 μmol photons m−2 s−1 was used in the present study. In the case of T. pseudonana, the present study reports values ~six times lower than Rose et al. (2008) who examined PO2− under different conditions (Fe stress and different growth phases) than tested here.
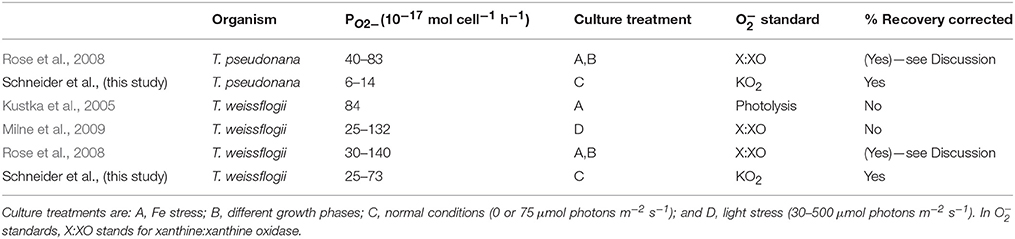
Table 3. Comparison of published diatom PO2− and methods.
Despite the similar results between the present study and the other three studies listed in Table 3, especially for T. weissflogii, there were several important methodological differences. Milne et al. (2009) and Rose et al. (2008) used the xanthine:xanthine oxidase system to generate O for calibration, while the present study used KO2 and Kustka et al. (2005) used photochemically generated O stock solutions. The poor stability of the xanthine:xanthine oxidase system, as well as its tendency to generate less O than the manufacturer's specifications of the enzyme's activity, have been noted in a previous study (Rose et al., 2008; Rose, 2012). Both Milne et al. (2009) and Rose et al. (2008) took these issues into account. However, Milne et al. (2009) also based their calibration on an assumed half-life of 100 s for O in seawater instead of directly measuring the half-life of O in their assay medium (a natural seawater sampled using a CTD). Because decay rates can vary widely depending on where the water was sampled (Rose et al., 2008, 2010; Hansard et al., 2010; Heller and Croot, 2010) and are also highly sensitive to trace metal contamination, the actual half-life of O could have been much lower than the value they assumed.
Another consideration is how the cells are influencing the O signal detected by the photomultiplier tube. The present study examined this effect using a known O spike and determined that the diatom cells which were immobilized on the filter (both live and killed) drastically reduced the O signal. Milne et al. (2009) and Kustka et al. (2005) also measured O production by cells immobilized on a filter, but did not correct the signal for this effect. In contrast, Rose et al. (2008) added MCLA directly to cell cultures and compared the resulting chemiluminescence signal to the signal from cultures with xanthine/xanthine oxidase added in addition to MCLA. While this technique did not explicitly measure “recovery” values, it would have automatically corrected for the effect of cells on the signal. However, their reported signal would have also included any O generated by cell exudates in the medium.
A final difference in these studies is the value assigned as the “baseline” signal. In Rose et al. (2008) the baseline was defined as a cell culture with MCLA and SOD added. Kustka et al. (2005) did not directly state what they used as a baseline signal, but implied that it is also the SOD-added signal. This means any background superoxide generated by the medium or the container would have also been included in both of these studies' reported measurements. Milne et al. (2009) used the signal measured in the absence of light as their baseline, so their reported values only measure the enhancement caused by light.
Given these substantial methodological differences, the correspondence of the results of previous studies with each other and the present study could be fortuitous. However, the present study is the only study that attempted to correct for both recovery effects and background signal.
H2O2 Production
A previous investigation of H2O2 production rates (Milne et al., 2009) by T. weissflogii found a range of PH2O2 between 11 and 66 × 10−17 mol cell−1 h−1 for cultures loaded onto the filter by syringe, under a range of light intensity (30–500 μmol photons m−2 s−1) and quantified by a similar method to that employed in the present study, but without the correction for simultaneous decay (Milne et al., 2009). PH2O2 values for syringe-loaded cultures in the present study were similar in magnitude (80.3 ± 22.1 × 10⁻¹⁷ mol cell−1 h−1); however, T. weissflogii cultures loaded onto the filter by peristaltic pump had PH2O2 indistinguishable from zero; these values were therefore significantly lower than those for syringe-loaded cultures. Even gentle syringe loading results in considerably higher flow rates (~5 mL min−1) than loading by peristaltic pump (0.6 mL min−1). We suspect that suspending cells on a filter under the higher pressure that accompanies syringe loading induced stress-related H2O2 production, which would suggest that T. weissflogii only produces substantial H2O2 under stress conditions.
A previous investigation of H2O2 production by T. pseudonana (Waring et al., 2010) used the Amplex Red™ method, which quantifies gross H2O2 production, and therefore those rates were expected to be comparable to the present study. Although production was not reported numerically, it can be inferred from Figure 3D in Waring that low-light production is 7 × 10⁻⁷ mol μg chl a−1 over a 30 min period. Given the value of 4.45 × 10⁻⁸ μg chl a cell−1 (Table 2 in Waring), we calculated a much higher value of PH2O2 than seen in the present study, 7 × 10⁻¹⁴ mol cell−1 h−1. However, this discrepancy is the result of a calculation error (J. Waring, pers. comm.). The corrected H2O2 production rate is three orders of magnitude lower, meaning that their calculated value is not statistically different from the PH2O2 measured under light conditions in the present study.
H2O2 production by the other three species—T. oceanica, C. cryptica, and P. tricornutum—has not previously been studied.
O and H2O2 Recoveries
O recoveries in the presence of cells have only been quantified in one previous study. Diaz et al. (2013) observed that heterotrophic bacteria exhibited a range of O recovery, with values ranging from 1 to 100% depending on the bacterial species. By contrast, the present study shows that diatoms fall at the low end of this scale, with recoveries for live organisms ranging from < 5 to 50%. While the low O recoveries in the present study suggest that O decay by phytoplankton could potentially contribute to O decay in the environment, a recent field study saw no significant effect of filtering on decay rates in water samples from Station ALOHA and the California Current (Roe et al., 2016).
The low recoveries shown in the present study indicate that phytoplankton break down H2O2, which is consistent with previous findings (Wong et al., 2003). In addition, Wong et al. found that neither killed phytoplankton nor spent cell medium decayed H2O2. This aligns with the findings of the present study, in which recovery percentages for H2O2 were generally 100% for killed organisms, and in which very little decay occurred in spent growth medium from P. tricornutum. Overall this suggests that H2O2 decay occurs through an active cell process, whereby organisms ultimately control the H2O2 levels in their vicinity. Interestingly, H2O2 decay is not necessarily an absolute characteristic of all microorganisms; in fact, some symbiotic relationships between microbial consortia may be based, in part, on the need for catalase-deficient hosts to acquire H2O2-degrading symbionts (Morris et al., 2011).
While active cell processes seemed to be responsible for degradation of H2O2, the same cannot be said for decay of O. Although recovery rates for killed organisms were higher in live organisms (Figure 5), in no case did they ever reach 100%. Thus, while decomposition of O is likely to be mediated in part by active cell processes, at least some of it occurs through a passive process.
Controls on Biological ROS Production
Live T. pseudonana and T. oceanica appear to be actively producing O in the dark, since killing these organisms results in a significant decrease in PO2− (results for T. weissflogii are not definitive because of the uncertainties in the measured PO2− values for this species) (Table 2). This dark production corresponds with previous studies that link PO2− to light-independent activity of outer membrane and/or transmembrane NADPH oxidases (Kim et al., 2000; Kustka et al., 2005; Saragosti et al., 2010). Similar transmembrane NADPH oxidases are known to mediate a number of essential physiological processes, such as cell development, signaling, and defense, in various eukaryotes, including fungi, plants, and mammalian cells (Saran, 2003; Bedard et al., 2007; Tsukagoshi et al., 2010). The potential for a physiological role for superoxide in diatoms, including Thalassiosira, is currently unknown and requires further exploration.
As observed previously (Kim et al., 2004; Kustka et al., 2005; Saragosti et al., 2010), PO2− was enhanced for all three Thalassiosira species in the presence of light (Table 2). However, the magnitude of the enhancement appeared similar in live and killed cultures (Figure 2), so a passive photochemical source such as photo-oxidation of pigments present in the cell membrane cannot be ruled out as the additional source of superoxide. However, this is somewhat surprising given the low light levels used.
For the Thalassiosira spp, it is possible to compare the ratio of PH2O2 to PO2− to determine how much, if any, of the H2O2 could be produced via O. The ratio of H2O2 formation from O can vary anywhere from 0, if all of the O is oxidized, to 0.5, if dismutation occurs, to 1, if all of the O is reduced. The relationship between PO2− and PH2O2 is shown in Figure 8. For T. oceanica, the data cluster around the 2:1 PO2−:PH2O2 line, suggesting that most or all of the H2O2 is produced via O dismutation. By contrast, PH2O2:PO2− data for T. pseudonana plot far under the same line, signifying H2O2 production in excess of what could be produced from O dismutation, or even reduction, alone.
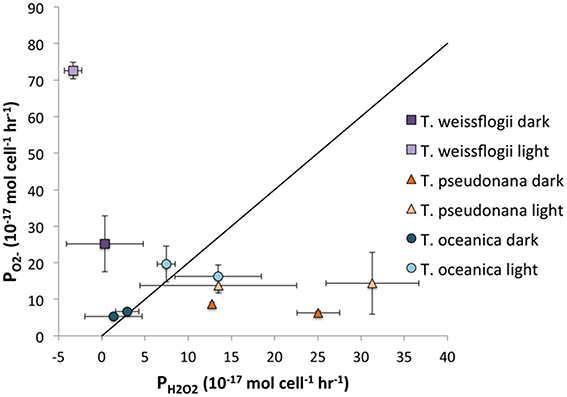
Figure 8. Representation of the PO2−:PH2O2 ratio. The diagonal line indicates the 2:1 ratio that would be obtained if all H2O2 was produced through dismutation of O.
One source of this surplus H2O2 might be diffusion of intracellular H2O2 through the cell membrane. H2O2 can diffuse across the lipid bilayer to a small extent (Seaver and Imlay, 2001), but a larger quantity simply passes through aquaporins (Halliwell and Gutteridge, 2007). Extracellular H2O2 production is often thought to represent cell leakage of photosynthetically reduced oxygen under high light conditions (Suggett et al., 2008; Waring et al., 2010). In the absence of light, leakage of intracellular hydrogen peroxide formed from oxygen reduction at other electron transport chains is also probable (Forman and and Boveris, 1982). Indeed, most H2O2 production by C. marina is believed to originate from intracellular processes, which is magnified under cell stress and loss of membrane integrity (Kim et al., 2007). However, H2O2 can also be produced extracellularly. A previous study found that proteins on the cell surface of the coccolithophore P. carterae produced H2O2 without simultaneously producing O (Palenik et al., 1987) using a two-electron reduction of oxygen for nitrogen metabolism (Palenik and Morel, 1990). At present it is not clear whether the excess H2O2 produced by T. pseudonana originates from extracellular and/or intracellular sources.
By contrast with T. pseudonana, T. weissflogii produces far more than twice as much O as H2O2, indicating that not all O undergoes dismutation to form H2O2 but rather is destroyed by a different process, e.g., oxidation by organic matter. Alternatively, the higher flow rates in the O determination as compared to those in the H2O2 experiment might lead to higher ROS production overall; the present study clearly shows that T. weissflogii cells produce more H2O2 when subjected to higher flow rates, and this may also be true for O production.
This study shows that diatoms have a wide range of values for PH2O2 that hint at a diversity of biological pathways involved in production. Neither C. cryptica nor P. tricornutum produced measurable extracellular H2O2 under the tested conditions. Likewise, we cannot rule out that they produce O, but if they do, they decompose it so effectively that the present study could not quantify it. While significant production of ROS was not detected from P. tricornutum cells, they do exude substances into the growth medium that produce ROS. H2O2 production by cell exudates was not quantified for the other species because P. tricornutum is the only species for which unusually high ROS signals were observed during loading, when spent medium was passing through the filter. It is likely that P. tricornutum secretes enzymes that produce H2O2 and, possibly O (though the present study was unable to test the latter). In fact, secretion of extracellular enzymes that produce O has previously been observed for C. marina (Kim et al., 2000) and a bacteria within the Roseobacter clade (Learman et al., 2011). These enzymes have been identified as an animal heme peroxidase for the Roseobacter bacterium (Andeer et al., 2015) and a protein analogous to the neutrophil NADPH oxidase in C. marina (Kim et al., 2000).
Concluding Remarks
Previous field studies (Rose et al., 2008; Vermilyea et al., 2010; Roe et al., 2016) showed that dark biological production of ROS is significant in comparison with photochemical production. Assuming all large phytoplankton, such as diatoms, have ROS production rates of the same approximate magnitude as those in this study, and assuming cell counts of 104 (in oligotrophic waters such as Station ALOHA; Venrick, 1997) to 106 (in the Gulf of Alaska; Paul et al., 1991) cells L−1, the phytoplankton contribution to this dark biological production would be 1–100 pM h−1, a small fraction of the observed 1–8 nM h−1. It is likely that dark biological ROS production is usually driven by the more numerous cyanobacteria (as in Rose et al., 2008) and heterotrophic bacteria (Diaz et al., 2013). However, phytoplankton such as diatoms may make major contributions to steady state concentrations of O and H2O2 during blooms, when their abundance can increase 10-fold (Villareal et al., 2012); this corresponds to observations showing higher O concentrations in Trichodesmium blooms (Rose et al., 2010).
Although diatoms may not be the primary influence on ROS concentrations in the ocean, their ROS production is likely an essential physiological process. In fact, previous studies have shown that O production is linked to Fe uptake in Trichodesmium (Roe and Barbeau, 2014) and Lyngbya majuscula (Rose et al., 2008) and cell growth/signaling in C. marina (Oda et al., 1995; Marshall et al., 2005), and that H2O2 may be a byproduct of nitrogen metabolism in P. carterae (Palenik et al., 1987). Given that similar species of diatoms produce ROS via different pathways, it is likely a suite of physiological benefits are conferred through ROS production that vary with species and, likely, environmental conditions.
Author Contributions
BV: Directed the research. RS: Designed experiments, cultured algae, conducted hydrogen peroxide measurements. KR: Designed experiments, cultured algae, conducted superoxide measurements. CH: Aided in design and interpretation of experiments.
Conflict of Interest Statement
The authors declare that the research was conducted in the absence of any commercial or financial relationships that could be construed as a potential conflict of interest.
Acknowledgments
The authors would like to thank Mak Saito for his input on culture purity and undergraduates Lauren Leavitt and Shannon Pollmiller for help with methods testing. We would like to thank the Hildebrand lab at Scripps Institute of Oceanography for the P. tricornutum. This research was supported by NSF grant OCE-1131734/1246174 to BV and CH.
Supplementary Material
The Supplementary Material for this article can be found online at: http://journal.frontiersin.org/article/10.3389/fchem.2016.00005
References
Andeer, P. F., Learman, D. R., McIlvin, M., Dunn, J. A., and Hansel, C. M. (2015). Extracellular heme peroxidases mediate Mn (II) oxidation in a marine Roseobacter bacterium via superoxide production. Environ. Microbiol. 17, 3925–3936. doi: 10.1111/1462-2920.12893
Avery, G. B. Jr., Cooper, W. J., Kieber, R. J., and Willey, J. D. (2005). Hydrogen peroxide at the Bermuda Atlantic Time Series Station: temporal variability of seawater hydrogen peroxide. Mar. Chem. 97, 236–244. doi: 10.1016/j.marchem.2005.03.006
Bedard, K., Lardy, B., and Krause, K. H. (2007). NOX family NADPH oxidases: not just in mammals. Biochimie 89, 1107–1112. doi: 10.1016/j.biochi.2007.01.012
Cooper, W. J., Moegling, J. K., Kieber, R. J., and Kiddle, J. J. (2000). A chemiluminescence method for the analysis of H2O2 in natural waters. Mar. Chem. 70, 191–200. doi: 10.1063/1.555739
Cooper, W. J., and Zika, R. G. (1983). Photochemical formation of hydrogen peroxide in surface and ground waters exposed to sunlight. Science 220, 711–712.
Cooper, W. J., Zika, R. G., Petasne, R. G., and Plane, J. M. C. (1988). Photochemical formation of H2O2 in natural waters exposed to sunlight. Environ. Sci. Technol. 22, 1156–1160.
Diaz, J. M., Hansel, C. M., Voelker, B. M., Mendes, C. M., Andeer, P. F., and Zhang, T. (2013). Widespread production of extracellular superoxide by heterotrophic bacteria. Science 340, 1223–1226. doi: 10.1126/science.1237331
Forman, H. J., and and Boveris, A. (1982). “Superoxide radical and hydrogen peroxide in mitochondria,” in Free radicals in biology, ed W. Pryor (New York, NY: Academic) 65–90.
Godrant, A., Rose, A. L., Sarthou, G., and Waite, T. D. (2009). New method for the determination of extracellular production of superoxide by marine phytoplankton using the chemiluminescence probes MCLA and red-CLA. Limnol. Oceanogr. Meth. 7, 682–692. doi: 10.4319/lom.2009.7.682
Goldstone, J. V., and Voelker, B. M. (2000). Chemistry of superoxide radical in seawater: CDOM associated sink of superoxide in coastal waters. Environ. Sci. Technol. 34, 1043–1048. doi: 10.1021/es9905445
Halliwell, B., and Gutteridge, J. M. C. (2007). Free Radicals in Biology and Medicine, 4 Edn. Oxford: Oxford University Press.
Hansard, S. P., Vermilyea, A. W., and Voelker, B. M. (2010). Measurements of superoxide radical concentration and decay kinetics in the Gulf of Alaska. Deep Sea Res. Pt. I 57, 1111–1119. doi: 10.1016/j.dsr.2010.05.007
Heller, M. I., and Croot, P. L. (2010). Superoxide decay kinetics in the southern ocean. Environ. Sci. Technol. 44, 191–196. doi: 10.1021/es901766r
Herut, B., Shoham-Frider, E., Kress, N., and Angel, D. (1998). Hydrogen peroxide production rates in clean and polluted coastal marinewaters of the mediterranean, red and baltic seas. Mar. Pollut. Bull. 36, 994–1003.
Kawano, I., Oda, T., Ishimatsu, A., and Muramatsu, T. (1996). Inhibitory effects of the iron chelator desferrioxamine (Desferal) on the generation of activated oxygen spcies of Chattonella marina. Mar. Biol. 126, 765–771. doi: 10.1007/BF00351343
Kim, D., Nakamura, A., Okamoto, T., Komatsu, N., Oda, T., Iida, T., et al. (2000). Mechanism of superoxide anion generation in the toxic red tide phytoplankton Chattonella marina: possible involvement of NAD(P)H oxidase. BBA 1524, 1–8. doi: 10.1016/s0304-4165(00)00161-6
Kim, D., Nakamura, A., Okamoto, T., Komatsu, N., Oda, T., Ishimatsu, A., et al. (1999). Toxic potential of the raphidophyte Olisthodiscus luteus: mediation by reactive oxygen species. J. Plankton Res. 21, 1017–1027.
Kim, D., Nakashima, T., Matsuyama, Y., Niwano, Y., Yamaguchi, K., and Oda, T. (2007). Presence of the distinct systems responsible for superoxide anion and hydrogen peroxide generation in red tide phytoplankton Chattonella marina and Chattonella ovata. J. Plankton Res. 29, 241–247. doi: 10.1093/plankt/fbm011
Kim, D., Watanabe, M., Nakayasu, Y., and Kohata, K. (2004). Production of superoxide anion and hydrogen peroxide associated with cell growth of Chattonella antiqua. Aquat. Microb. Ecol. 35, 57–64. doi: 10.3354/ame035057
King, D. W., Cooper, W. J., Rusak, S. A., Peake, B. M., Kiddle, J. J., O'sullivan, D. W., et al. (2007). Flow injection analysis of H 2O 2in natural waters using acridinium ester chemiluminescence: method development and optimization using a kinetic model. Anal. Chem. 79, 4169–4176. doi: 10.1021/ac062228w
Kustka, Adam, B., Shaked, Y., Milligan, A. J., King, D. W., and Morel, F. M. M. (2005). Extracellular production of superoxide by marine diatoms: contrasting effects on iron redox chemistry and bioavailability. Limnol. Oceanogr. 50, 1172–1180. doi: 10.4319/lo.2005.50.4.1172
Learman, D. R., Voelker, B. M., Vazquez-Rodriguez, A. I., and Hansel, C. M. (2011). Formation of manganese oxides by bacterially generated superoxide. Nat. Geosci. 4, 95–98. doi: 10.1038/ngeo1055
Marshall, J.-A., Hovenden, M., Oda, T., and Hallegraeff, G. M. (2002). SHORT COMMUNICATION Photosynthesis does influence superoxide production in the ichthyotoxic alga Chattonella marina (Raphidophyceae). J. Plankton Res. 24, 1231–1236. doi: 10.1093/plankt/24.11.1231
Marshall, J. A., Ross, T., Pyecroft, S., and Hallegraeff, G. (2005). Superoxide production by marine microalgae—II. Towards understanding ecological consequences and possible functions. Mar. Biol. 147, 541–549. doi: 10.1007/s00227-005-1597-6
Miller, W. L., and Kester, D. R. (1988). Hydrogen peroxide measurement in seawater by (para-hydroxylphenyl) acetic acid dimerization. Anal. Chem. 60, 2711–2715.
Milne, A., Davey, M. S., Worsfold, P. J., Achterberg, E. P., and Taylor, A. R. (2009). Real-time detection of reactive oxygen species generation by marine phytoplankton using flow injection–chemiluminescence. Limnol. Oceanogr. 7, 706–715. doi: 10.4319/lom.2009.7.706
Moffett, J. W., and Zafiriou, O. C. (1990). An investigation of hydrogen peroxide chemistry in surface waters of Vineyard Sound with HO2 and 18O2. Limnol Oceanogr. 35, 1221–1229.
Morris, J. J., Johnson, Z. I., Szul, M. J., Keller, M., and Zinser, E. R. (2011). Dependence of the cyanobacterium Prochlorococcus on hydrogen peroxide scavenging microbes for growth at the ocean's surface. PLoS ONE 6:e16805. doi: 10.1371/journal.pone.0016805
Oda, T., Moritomi, J., Kawano, I., Hamaguchi, S., Ishimatsu, A., and Muramatsu, T. (1995). Catalase- and superoxide dismutase-induced morphological changes and growth inhibition in the red tide phytoplankton Chattonella marina. Biosci. Biotech. Biochem. 59, 2044–2048.
Oda, T., Nakamura, A., Shikayama, M., Kawano, I., Ishimatsu, A., and Muramatsu, T. (1997). Generation of reactive oxygen species by raphidophycean phytoplankton. Biosci. Biotechnol. Biochem. 61, 1658–1662.
Palenik, B., and Morel, F. M. M. (1990). Amino acid utilization by marine phytoplankton: a novel mechanism. Limnol. Oceanogr. 35, 260–269. doi: 10.4319/lo.1990.35.2.0260
Palenik, B., Zafiriou, O. C., and Morel, F. M. M. (1987). Hydrogen peroxide production by a marine phytoplankter. Limnol. Oceanogr. 32, 1365–1369.
Paul, A. J., Paul, J. M., Coyle, K., and Smith, R. (1991). Phytoplankton, Zooplankton, and Ichthyoplankton in Resurrection Bay, Northern Gulf of Alaska in 1988. Fairbanks, AK: Alaska Sea Grant College Program.
Petasne, R. G., and Zika, R. G. (1997). Hydrogen peroxide lifetimes in south Florida coastal and offshore waters. Mar. Chem. 56, 215–225.
Price, N. M., Harrison, G. L., Hering, J. G., Hudson, R. J., Nirel, P. M. V., Palenik, B., et al. (1989). Preparation and chemistry of the artificial algal culture medium aquil. Biol. Oceanogr. 6, 443–461. doi: 10.1080/01965581.1988.10749544
Roe, K. L., and Barbeau, K. A. (2014). Uptake mechanisms for inorganic iron and ferric citrate in Trichodesmium erythraeum IMS 101. Metallomics 6, 2042–2051. doi: 10.1039/C4MT00026A
Roe, K. L., Schneider, R. J., Hansel, C. M., and Voelker, B. M. (2016). Measurement of dark, particle-generated superoxide and hydrogen peroxide in the subtropical and temperate North Pacific Ocean. Deep Sea Res. Pt I 107, 59–69. doi: 10.1016/j.dsr.2015.10.012
Rose, A. L. (2012). The influence of extracellular superoxide on iron redox chemistry and bioavailability to aquatic microorganisms. Front. Microbiol. 124, 1–21. doi: 10.3389/fmicb.2012.00124
Rose, A. L., Godrant, A., Furnas, M., and Waite, T. D. (2010). Dynamics of nonphotochemical superoxide production in the Great Barrier Reef lagoon. Limnol. Oceanogr. 55, 1521–1536. doi: 10.4319/lo.2010.55.4.1521
Rose, A. L., Moffett, J. W., and Waite, T. D. (2008). Determination of superoxide in seawater using 2-methyl-6-(4-methoxyphenyl)-3,7-dihydroimidazo[1,2-a]pyrazin-3(7H)-one chemiluminescence. Anal. Chem. 80, 1215–1227. doi: 10.1021/ac7018975
Rose, A. L., Salmon, T. P., Lukondeh, T., Neilan, B. A., and Waite, T. D. (2005). Use of superoxide as an electron shuttle for iron acquisition by the marine cyanobacterium Lyngbya majuscula. Environ. Sci. Technol. 39, 3708–3715. doi: 10.1021/es048766c
Rose, A. L., Webb, E. A., Waite, T. D., and Moffett, J. W. (2008). Measurement and implications of nonphotochemically generated superoxide in the equatorial Pacific ocean. Environ. Sci. Technol. 42, 2387–2393. doi: 10.1021/es7024609
Saito, M. A., Moffett, J. W., Chisholm, S. W., and Waterbury, J. B. (2002). Cobalt limitation and uptake in Prochlorococcus. Limnol. Oceanogr. 47, 1629–1636. doi: 10.4319/lo.2002.47.6.1629
Saragosti, E., Tchernov, D., Katsir, A., and Shaked, Y. (2010). Extracellular production and degradation of superoxide in the coral Stylophora pistillata and cultured Symbiodinium. PLoS ONE 5:e12508. doi: 10.1371/journal.pone.0012508
Saran, M. (2003). To what end does nature produce superoxide? NADPH oxidase as an autocrine modifier of membrane phospholipids generating paracrine lipid messengers. Free Radic. Res. 37, 1045–1059. doi: 10.1080/10715760310001594631
Scholz, W., Galvan, F., and de la Rosa, F. F. (1995). The microalga Chlamydomonas reinhardtii CW-15 as a solar cell for hydrogen peroxide photoproduction: comparison between free and immobilized cells and thylakoids for energy conversion efficiency. Sol. Ener. Mater. Sol. Cells 39, 61–69.
Seaver, L. C., and Imlay, J. A. (2001). Hydrogen peroxide fluxes and compartmentalization inside growing Escherichia coli. J. Bacteriol. 183, 7182–7189. doi: 10.1128/JB.183.24.7182-7189.2001
Shaked, Y., Harris, R., and Klein-Kedem, N. (2010). Hydrogen peroxide photocycling in the gulf of aqaba, red sea. Environ. Sci. Technol. 44, 3238–3244. doi: 10.1021/es902343y
Suggett, D. J., Warner, M. E., Smith, D. J., Davey, P., Hennige, S., and Baker, N. R. (2008). Photosynthesis and production of hydrogen peroxide by Symbiodinium (Pyrrhophyta) phylotypes with different thermal tolerances. J. Phycol. 44, 948–956. doi: 10.1111/j.1529-8817.2008.00537.x
Tsukagoshi, H., Busch, W., and Benfey, P. N. (2010). Transcriptional regulation of ROS controls transition from proliferation to differentiation in the root. Cell 143, 606–616. doi: 10.1016/j.cell.2010.10.020
Twiner, M. J., and Trick, C. G. (2000). Possible physiological mechanisms for production of hydrogen peroxide by the ichthyotoxic flagellate Heterosigma akashiwo. J. Plankton Res. 22, 1961–1975. doi: 10.1093/plankt/22.10.1961
Venrick, E. L. (1997). Comparison of the phytoplankton species composition and structure in the Climax area (1973–1985) with that of station ALOHA (1994). Limnol. Oceanogr. 42, 1643–1648.
Vermilyea, A. W., Hansard, S. P., and Voelker, B. M. (2010). Dark production of hydrogen peroxide in the Gulf of Alaska. Limnol. Oceanogr. 55, 580–588. doi: 10.4319/lo.2009.55.2.0580
Villareal, T. A., Brown, C. G., Brzezinski, M. A., Krause, J. W., and Wilson, C. (2012). Summer diatom blooms in the North Pacific subtropical gyre: 2008–2009. PLoS ONE 7, e33109–e33115. doi: 10.1371/journal.pone.0033109
Waring, J., Klenell, M., Bechtold, U., Underwood, G. J. C., and Baker, N. R. (2010). Light-induced responses of oxygen photoreduction, reactive oxygen species production and scavenging in two diatom species. J. Phycol. 46, 1206–1217. doi: 10.1111/j.1529-8817.2010.00919.x
Wong, G. T. F., Dunstan, W. M., and Kim, D.-B. (2003). The decomposition of hydrogen peroxide by marine phytoplankton. Oceanol. Acta 26, 191–198. doi: 10.1016/S0399-1784(02)00006-3
Wuttig, K., Heller, M. I., and Croot, P. L. (2013). Pathways of superoxide (O) decay in the Eastern tropical North Atlantic. Environ. Sci. Technol. 47, 10249–10256. doi: 10.1021/es401658t
Yamasaki, Y., Kim, D.-I., Matsuyama, Y., Oda, T., and Honjo, T. (2004). Production of superoxide anion and hydrogen peroxide by the red tide dinoflagellate Karenia mikimotoi. J. Biosci. Bioeng. 97, 212–215. doi: 10.1016/S1389-1723(04)70193-0
Yuan, J., and Shiller, A. M. (2001). The distribution of hydrogen peroxide in the southern and central Atlantic ocean. Deep Sea Res. Pt II 48, 2947–2970. doi: 10.1016/S0967-0645(01)00026-1
Zafiriou, O. C. (1990). Chemistry of superoxide ion-radical (O) in seawater. I. pKa,sw* (HOO) and uncatalyzed dismutation kinetics studied by pulse radiolysis. Mar. Chem. 30, 31–43.
Keywords: reactive oxygen species, superoxide, hydrogen peroxide, diatoms, culture
Citation: Schneider RJ, Roe KL, Hansel CM and Voelker BM (2016) Species-Level Variability in Extracellular Production Rates of Reactive Oxygen Species by Diatoms. Front. Chem. 4:5. doi: 10.3389/fchem.2016.00005
Received: 02 October 2015; Accepted: 18 January 2016;
Published: 30 March 2016.
Edited by:
William Sunda, National Oceanic and Atmospheric Administration, USAReviewed by:
Yeala Shaked, Hebrew University of Jerusalem, IsraelAndrew Rose, Hebrew University of Jerusalem, Israel
Copyright © 2016 Schneider, Roe, Hansel and Voelker. This is an open-access article distributed under the terms of the Creative Commons Attribution License (CC BY). The use, distribution or reproduction in other forums is permitted, provided the original author(s) or licensor are credited and that the original publication in this journal is cited, in accordance with accepted academic practice. No use, distribution or reproduction is permitted which does not comply with these terms.
*Correspondence: Bettina M. Voelker, dm9lbGtlckBtaW5lcy5lZHU=