 Yitao Liao
 Tao Liu2
- 1College of Chemistry and Chemical Engineering, Northwest Normal University, Lanzhou, China
- 2Lanzhou Petrochemical Research Center, Petrochemical Research Institute, PetroChina, Lanzhou, China
The effects of different iron contamination content on the formation of iron nodules and the performance of FCC catalysts have been studied by cyclic deactivation treatment using iron naphthenate. The catalysts were characterized by X-ray diffraction, N2 adsorption-desorption, and SEM. The catalysts’ performance was evaluated by the Advanced Cracking Evaluation device. It has been found that there will be obvious nodulation on the catalyst when the iron concentration exceeds 7,400 μg/g. With the iron deposition from 53 μg/g to 11,690 μg/g, the crystal structure of zeolite will not be destroyed by iron. The surface area and pore volume of the catalyst decreased significantly; the surface area decreased from 125.3 m2/g to 91.0 m2/g, and the pore volume decreased from 0.21 cm3/g to 0.16 cm3/g. The studies also showed that the increase of iron deposition will lead to the decrease of catalytic reaction efficiency. With the iron deposition from 53 μg/g to 11,690 μg/g, the conversion decreased by 4.83%. Under the same 78 wt.% conversion, bottoms yield and coke yield increased by 2.15% and 1.31%, while gasoline yield and LCO yield decreased by 2.59% and 2.16%, respectively. The real state of the industrial iron contaminated equilibrium catalyst can be mimicked by using the cyclic deactivation method.
Introduction
Fluid catalytic cracking (FCC) technology is one of the most important conversion processes for efficient residue processing, and it plays an important role in the oil refining field (Harding et al., 2001; Mehla et al., 2019). The FCC catalyst is widely used in the oil refining industry, and its performance affects the unit operation and the economic benefits of the refinery. Nickel, vanadium, iron, calcium, sodium, copper, and other metals exist in heavy crude oil in the form of porphyrin complexes, naphthenates, or inorganic compounds, which have toxic effects on the catalysts. With the increasing trend of heavy and poor quality of FCC feed stock, the influence of heavy metal deposition especially iron on the catalyst performance has gradually increased (Escobar et al., 2008; Liu et al., 2015; Souza et al., 2019). One common indicator of iron contamination is the advent of a particular type of particle morphology change, often referred to as “nodulation” (Rainer et al., 2003). According to the analysis of FCC unit operation, the increase of iron loading will lead to the decrease of apparent bulk density, the increase of slurry yield, and the deterioration of product distribution (Bai et al., 2018; Brandt et al., 2019; Zhou et al., 2020). Therefore, the study of iron deposition and its effect on catalytic cracking reaction is very important for continuous improvement of the FCC catalyst and guidance of industrial production.
In order to simulate the distribution of iron on the FCC catalyst and its effect on catalyst performance, it has been reported that iron deposition can be realized by the impregnating catalyst with iron compounds solution or by means of an improved fixed bed micro reactivity test (MAT) device (Lappas et al., 2001; Yaluris et al., 2004; Mathieu et al., 2014; Zhu et al., 2007). However, it is difficult to accurately simulate the state of the industrial iron contaminated equilibrium catalyst, which makes larger deviations from the experiment results to actual data.
The multi cyclic deactivation (MCD) unit can realize the deposition of heavy metals on the catalyst surface through multiple reaction and regeneration cycles so that the heavy metals deposited catalyst obtained in the laboratory can simulate the state of industrial equilibrium catalyst. The study of nickel and vanadium contamination by cyclic deactivation method has been reported elsewhere (Lappas et al., 2001; Long et al., 2005; Tangstad et al., 2008; Etim et al., 2016; Souza et al., 2018), but the report on the effect of iron contamination on the catalyst is less. The formation of iron nodules on the catalyst surface has not been successfully simulated in the existing reports, so it is difficult to truly reflect the actual effect of iron contamination (Rainer et al., 2003; Rainer et al., 2004; Jiang et al., 2018).
In this paper, iron deposition on the catalyst was realized by using the MCD unit. Effect of different amounts of iron deposition on the formation of iron nodules and physicochemical properties of FCC catalysts were investigated, which provided theoretical basis and experimental reference for further study of iron contamination reaction mechanism.
Experimental
Laboratory Deactivation
In this research, a commercial equilibrium catalyst (CAT-BASE see Table 1) was used to simulate iron contamination. In order to simulate the actual state of the iron contaminated equilibrium catalyst in FCC unit, different amounts of iron deposition and appropriate conditions have been selected to carry out cyclic deactivation method. Iron naphthenate (6% Fe) produced by Strem Chemicals Company was used as iron precursors.
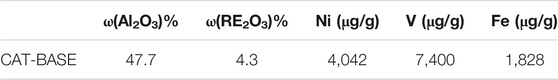
TABLE 1. Characteristics of CAT-BASE.
Cyclic Deactivation
The catalyst was deactivated in MCDU, described in detail elsewhere (Tangstad et al., 2000; Luo et al., 2007; Psarras et al., 2007; Almas et al., 2019). The vacuum gas oil (VGO) spiked with iron naphthenate was prepared according to the target iron deposition amount. Then, 200 g catalyst was added to the quartz reactor to carry out iron cyclic deposition. The deactivated catalyst was treated through 200 cycles of cracking, stripping, regeneration, and cooling processes in the MCD unit. The cracking step was performed at a reaction temperature of 530°C and the regeneration step at 780°C. According to the different amounts of iron naphthenate spiked in the feed, the deactivated catalysts were labeled as LE-0 (Fe added in feed = 0 μg/g), LE-1 (Fe added in feed = 376 μg/g), LE-2 (Fe added in feed = 564 μg/g), LE-3 (Fe added in feed = 752 μg/g), and LE-4 (Fe added in feed = 1,128 μg/g).
Catalyst Characterization
The metal content was determined by ZSX PrimusⅡX-ray fluorescence (XRF) instrument produced by Japan Science and Technology Company (Tokyo). X-ray tube voltage is 50 kV, tube current is 50 mA, and diaphragm aperture is 20 mm.
The catalyst phase structure was determined by D/max-3C X-ray diffractometer (XRD) produced by Japan Science Corporation (Tokyo) with the following settings: Cu target, Kα radiation, tube voltage 40 kV, tube current 20 mA, scanning range: 5°–50°, and scanning speed 4°/min.
The specific surface area and pore volume of the catalyst were measured by Micromeritics ASAP 3000 automatic physical adsorption instrument produced by Micromeritics Instruments Corporation (Norcross, GA, USA). The surface area was deduced from the adsorption isotherms using the BET equation. The samples were degassed at 300°C for 4 h (residual pressure value was 0.13 Pa), and then nitrogen physical adsorption was determined at -196°C.
The catalyst surface morphology was observed by ULTRA PLUS thermal field emission scanning electron microscopy produced by Zeiss optical instruments (Oberkochen, Germany). Secondary electron resolution was 1.0 nm (15 kV) 1.9 nm (1 kV); electron gun: LaB6 thermal field emission electron gun; acceleration voltage: 0.1–30 kV; magnification: ×12 ∼ X10,000.
Catalyst Cracking Activity and Selectivity
Cracking performance of different catalysts was tested in an Advance Cracking Evaluation (ACE) unit developed by Kayser Technology Inc. Company, USA. Reaction conditions were the following: the amount of catalyst added was 9 g. The reaction and regeneration temperature were 530 °C and 715°C, respectively. Gaseous products were analyzed using a GC-3000 online chromatograph produced by INFICON Company (New York, USA) according to the UOP method 539. GC-3000 used four chromatographic modules for detection, and the work temperature was 0°C–50°C. The carrier gases used were helium, hydrogen, nitrogen, and argon. Simulated distillation of liquid products was carried out using a7890B chromatograph produced by Agilent Technologies Inc. (California, USA) according to the SH/T 0558 procedure. The working environmental temperature of Agilent 7890B was 15°C–35°C. Retention time repeatability was <0.0008 min. Carrier and makeup gas settings were selectable for helium, hydrogen, nitrogen, and argon/methane. Coke deposited on the catalyst was quantified with a CO2 analyzer produced by Servomex Group Co., Ltd (Sussex, England). The detection range of CO2 analyzer was 0–20%. When the detection value was lower than 0.4%, the regeneration step was considered to be completed. Conversion and yields of dry gas (H2 + C1 +C2), LPG (liquefied petroleum gas) (C3 +C4), gasoline (C5 < bp < 221°C), LCO (light cyclic oil) (221°C < bp < 343°C), HCO (heavy cyclic oil) (bp > 343°C), and coke were calculated.
Five different amounts of iron deposited catalysts were tested in the ACE unit. The adjustment of the catalyst to oil (C/O) ratio could be realized by changing the catalysts’ addition amounts under a fixed feed injection quantity. The conversion and product yield fitting curves were obtained on the basis of the evaluation data. The product selectivity of different iron deposited catalysts was compared under the same conversion.
Results and Discussion
Iron Deposition Rate on Catalyst
The amount of iron deposited on the catalyst was determined by XRF. Due to the existence of a certain amount of iron compounds in raw materials such as kaolin used in the preparation of the catalyst, the existing iron content in the catalyst should be deducted when calculating the iron deposition on the catalyst surface (Brandt et al., 2019). The results are shown in Table 2.
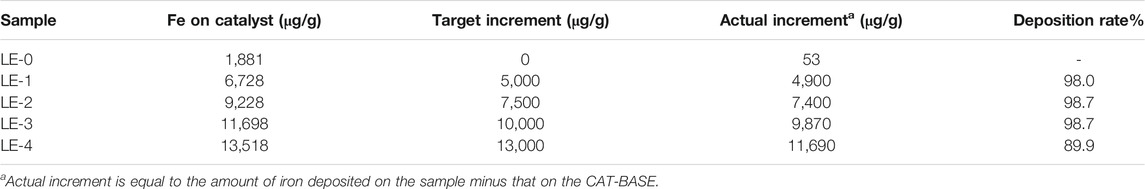
TABLE 2. Iron deposition of deactivated catalysts.
LE-0 is obtained by cyclic deactivation of feed oil without iron spiking. Since the iron content in the feed oil is 0.62 μg/g, the amount of iron on the catalyst increased slightly to 53 μg/g after 200 cycles of cracking reaction. When the target amount of iron deposition is less than 10,000 μg/g, the iron deposition rate on the catalyst is more than or equal to 98%. When the target amount of iron deposition is 13,000 μg/g, the iron deposition rate on the catalyst decreased to less than 90%. Due to the high content of iron naphthenate in the feed oil (1,128 μg/g), some of the iron naphthenate may have been decomposed at the reaction temperature of 530°C before participating in the cracking reaction on the catalyst surface.
Effect of Iron Deposition on Phase Structure of Catalyst
The phase structure of the catalyst with different amounts of iron deposition was studied by XRD. The results are shown in Figure 1.
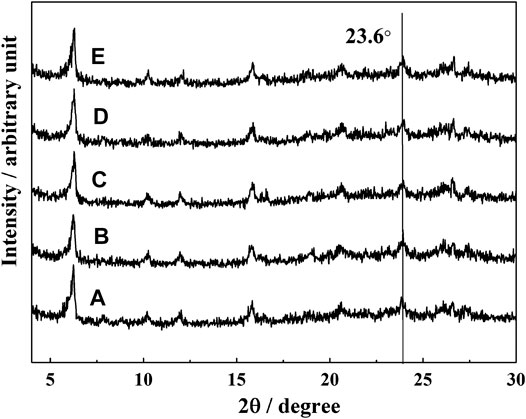
FIGURE 1. XRD patterns of catalysts with different iron content: (A) LE-0, (B) LE-1, (C) LE-2, (D) LE-3, and (E) LE-4.
There were diffraction peaks at 2θ values of 6.2°,18.7°,20.3°, 23.6°, and 26.9°, which correspond to the characteristic peaks of (111), (331), (333), (533), and (642) of FAU zeolite (Lahnafi et al., 2020). With the increase of iron deposition on the catalyst, the position and peak intensity of each diffraction peak, especially the typical characteristic peak of Y zeolite at 2θ value of 23.6°, did not change significantly. This indicates that the iron deposited on the catalyst did not damage the crystal structure of Y zeolite.
Surface Area and Pore Volume
In order to investigate the effect of different iron loading on the surface area and pore volume of the catalyst, the pore structure properties of the samples were analyzed by automatic physical adsorption instrument. The results are shown in Table 3.

TABLE 3. Surface area and pore volume of catalysts with different iron content.
The surface area and pore volume decreased with the increase of iron deposition. When the iron deposition increased from LE-0 to LE-4, the surface area and pore volume decreased by 34.3 m2/g and 0.05 m2/g, respectively. When the iron deposition increased from LE-0 to LE-1, the surface area and pore volume of the catalyst were not affected significantly. The surface area decreased by only 1.5 m2/g, and the pore volume did not change. However, when the iron deposition was more than 7,400 μg/g, the surface area decreased by 27.4 m2/g, and the pore volume decreased significantly.
According to the surface area data of zeolite and matrix in Table 3, the matrix was more seriously affected by iron contamination. Compared with LE-0, the zeolite surface area retention of LE-4 was 86.1%, and the matrix surface area retention of LE-4 was 49.7%. This indicates that the pore closing effect of iron deposition on the catalyst is mainly reflected in the influence on the matrix.
Within the industrial FCC unit, the metals were deposited on the equilibrium catalyst usually with different deposition profiles. For example, nickel is known to deposit on the outer part of the catalyst (Meirer et al., 2015). Vanadium mainly diffuses from the outside to the inside (Cristiano-Torres et al., 2008; Pan et al., 2015). Iron does not migrate to the interior of the catalyst but exists in the depth of 1–5 μm (Yaluris et al., 2004; Wise et al., 2016; Ihli et al., 2017). Iron is mixed with silicon, calcium, sodium, and other elements to form a low melting point phase, which blocks the pore structure of the catalyst and forms the so-called iron nodules (Yaluris et al., 2004). The increase of iron nodules is the main reason for the decrease of surface area and pore volume of iron contaminated catalyst.
Iron Contaminated Catalysts Morphology
The surface morphology of the catalysts with different iron deposition amounts was characterized by SEM, and the process of iron nodules on the catalyst surface with the increase of iron deposition was clearly observed. The details are shown in Figure 2.
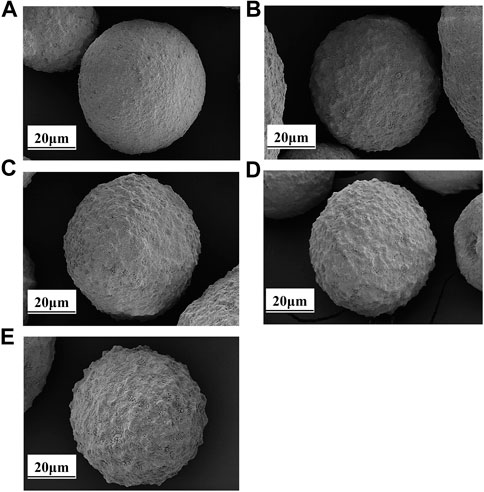
FIGURE 2. SEM of catalysts with different iron content: (A) LE-0; (B) LE-1; (C) LE-2; (D) LE-3; (E) LE-4.
Although 1,828 μg/g iron deposition can be detected on the catalyst LE-0, iron nodules were not observed on the surface of the catalyst because the iron was dispersed in kaolin during the preparation of the catalyst (Brandt et al., 2019).
More iron nodules can be observed with the increase of iron deposition on the catalyst. When the amount of iron deposition was 4,900 μg/g, a few nodules were formed on the surface of catalyst LE-1. The morphology of the catalyst was relatively complete. When the amount of iron deposition was 7,400 μg/g, the number of iron nodules on catalyst LE-2 increased more obvious. The surface area and pore volume of the catalyst LE-2 began to decrease to a certain extent due to the pore closing effect of iron nodules. When the amount of iron deposition reached 9,870 μg/g, the iron nodules on the surface of catalyst LE-3 were quite obvious and cover the whole catalyst.
When the amount of iron deposition reached 11,690 μg/g, the surface morphology of catalyst LE-4 was damaged most seriously by iron. Compared with the point distribution of iron nodules on the surface of catalyst LE-3, the nodules on catalyst LE-4 showed a block distribution. This may be due to the interweaving of high and low melting point phases on the catalyst surface, and the low melting point phases continued to collapse with the increase of iron deposition, resulting in the aggregation of high melting point phases in the adjacent region and then forming the distribution of iron nodules (Yaluris et al., 2004). The pore structure of the catalyst was seriously blocked under this amount of iron deposition. This conclusion can also be confirmed by the influence of different iron deposition on the surface area and pore volume of the catalyst, as shown in Table 3.
Iron Effects on Catalyst Product Yields
The performance of different iron deposition catalysts was evaluated by ACE unit. The conversion curves are shown in Figure 3.
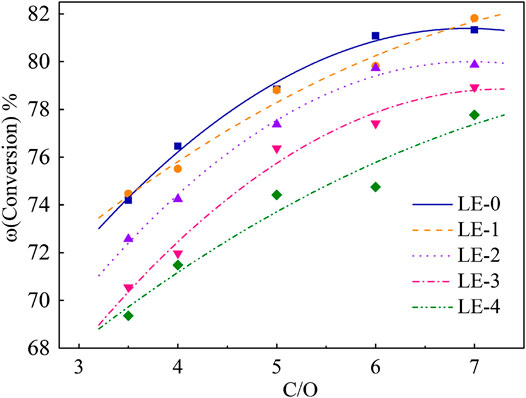
FIGURE 3. Conversion changes of catalysts with different iron content.
C/O rate was chosen as 3.5, 4.0, 5.0, 6.0, and 7.0. It can be seen from Figure 3 that the increase of iron deposition leads to the decrease of conversion in the same range of C/O rate. The conversion of LE-1 decreased by 0.31% on average compared with LE-0, which indicated that the low iron deposition had little effect on the catalyst. The conversion of LE-4 decreased by 4.83% on average, which means that high iron deposition had the most significant contamination effect on the catalyst.
In order to investigate the effect of different iron deposition on the catalyst performance, the product yield at fixed conversion was obtained by fitting curve. The results are shown in Figure 4 and Figure 5.
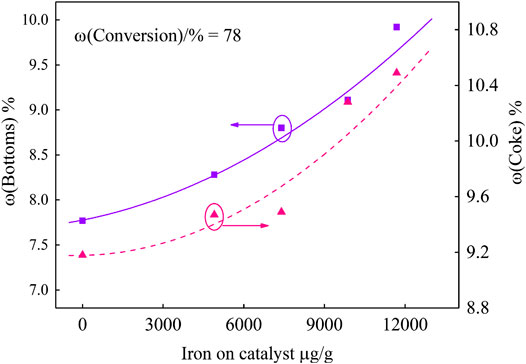
FIGURE 4. Bottoms and coke yields of catalysts with different iron content.
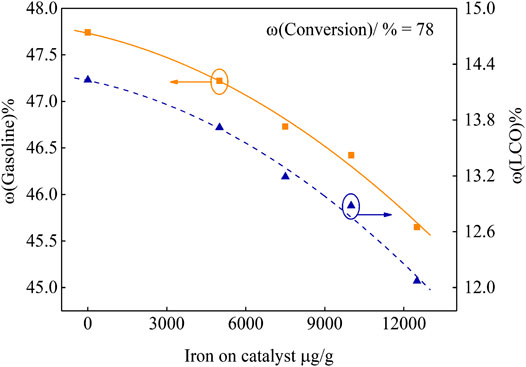
FIGURE 5. Gasoline and LCO yield of catalysts with different iron content.
It can be seen from Figure 4 that, under the same 78 wt.% conversion, more and more iron deposits lead to higher yields of bottoms and coke. When the iron deposition increased from 53 μg/g to 11,690 μg/g, the bottoms yields increased by 2.15%. The iron nodules covered on the catalyst surface and the catalyst pores were partly blocked, which led to the decrease of the catalyst bottoms cracking capacity. Bottom molecules were difficult to be further cracked, which resulted in the increase of bottoms yield. According to the coke yield curve, coke increased by 1.31%. On the one hand, this is due to the iron deposition on the catalyst surface, resulting in dehydrogenation and condensation reactions. On the other hand, in the FCC unit, it is critical that, during the time the feed molecules spend in the riser, they diffuse inside the particle and the products diffuse out. Closing of pores by the iron nodules on the catalyst restricts the diffusion of feed molecules, which leads to excessive cracking reactions, and secondary reactions such as hydrogen transfer and condensation occur in the pore, which eventually results in the increase of coke yield (Meyers 2015; Chen and Xu, 2018).
It can be seen from Figure 5 that, under the same 78 wt.% conversion, more iron deposition leads to the decrease of gasoline and LCO yields, and their selectivity all becomes poor. When the iron deposition on the catalyst reached 11,690 μg/g, the gasoline and LCO yields decreased by 2.59% and 2.16%, respectively.
The special pore structure in the catalyst has a great influence on the yield of gasoline and LCO. When there are enough zeolite pores (about 0.75 nm) in the catalyst, and the pores are unobstructed and have good accessibility, gasoline selectivity will increase. When the number of secondary pores (>2 nm) in the catalyst is abundant, it can not only be used to crack larger molecules, but also provide pores for molecules to enter zeolite pores for re-cracking, so the LCO selectivity is increased (Chen and Xu, 2018). According to the analysis of the influence of iron deposition on the catalyst pore structure, with the increase of iron deposition, the catalyst surface is gradually covered by iron nodules. The pore structure which is beneficial to the formation of gasoline and LCO is destroyed, which results in the decrease of gasoline and LCO yields.
Conclusion
The iron deposited on the catalyst did not damage the crystal structure of Y zeolite. The surface area and pore volume of the catalyst decreased with the increase of the amount of iron deposition. Part of the matrix pores was closed resulting in poor catalytic reaction performance. When the amount of iron deposited on the catalyst was more than 7,400 μg/g, iron nodules could be observed by SEM.
The increase of iron deposition on the catalyst will lead to the decrease of catalytic activity. When the iron deposition increased from 53 μg/g to 11,690 μg/g, the average conversion decreased by 4.83%. Under the same 78 wt.% conversion, the yields of bottoms and coke increased by 2.15% and 1.31%, respectively; the yields of gasoline and LCO decreased by 2.59% and 2.16%, respectively.
The iron nodules on the catalyst surface were simulated by using the cyclic deactivation method with multiple reaction and regeneration steps, which can reflect the real state of industrial iron contaminated equilibrium catalyst. It provides theoretical basis and experimental reference for further study of reaction mechanism. The product distribution evaluation based on cyclic deactivated catalyst is more accurate.
In our next research work, the iron contamination of FCC catalysts with different Si/Al ratios or different pore structures will be studied. With the help of cyclic deactivation method, we can understand the influence of iron on different catalysts more clearly.
Data Availability Statement
The original contributions presented in the study are included in the article/Supplementary Material. Further inquiries can be directed to the corresponding author.
Author Contributions
YL worked on the experimental setup. All the authors listed have made contribution to drafting and writing the manuscript.
Funding
The experimental method research and operation maintenance of catalytic reaction were carried out under the Key Laboratory project of the Ministry of Science and Technology Management of PetroChina (2019D-5006-59).
Conflict of Interest
Author YL was employed by the company PetroChina.
The remaining authors declare that the research was conducted in the absence of any commercial or financial relationships that could be construed as a potential conflict of interest.
Acknowledgments
The authors thank Ms. L. Zhang for kind assistance in SEM experiments and Mr. Z.S. Pan for kind help in XRD analysis.
References
Almas, Q., Naeem, M. A., Baldanza, M. A. S., Solomon, J., Kenvin, J. C., Müller, Christoph. R., et al. (2019). Transformations of FCC catalysts and carbonaceous deposits during repeated reaction-regeneration cycles. Catal. Technol. 9 (24), 6977–6992. doi:10.1039/C9CY01680E
Bai, P., Etim, U. J., Yan, Z., Mintova, S., Zhang, Z., Zhong, Z., et al. (2018). Fluid catalytic cracking technology: current status and recent discoveries on catalyst contamination. Catal. Rev. 61 333–405. doi:10.1080/01614940.2018.1549011
Brandt, S., Knöll, J., Jiang, H., Saar, J., and Fougret, C. (2019). The role of magnetic susceptibility in detecting iron poisoning in FCC equilibrium catalyst samples and its combination with other macroscopic bulk analysis techniques. Ind. Eng. Chem. Res. 58, 20528–20535. doi:10.1021/acs.iecr.9b03076
Chen, J. W., and Xu, Y. H. (2018). Fluid catalytic cracking process and engineering. Beijing: Sinopec press.
Cristiano-Torres, D. V., Osorio-Pérez, Y., Palomeque-Forero, L. A., Sandoval-Dı´az, L. E., and Trujillo, C. A. (2008). The action of vanadium over Y zeolite in oxidant and dry atmosphere. Appl. Catal. A Gen. 346, 104–111. doi:10.1016/j.apcata.2008.05.006
Escobar, A. S., Pereira, M. M., and Cerqueira, H. S. (2008). Effect of iron and calcium over USY coke formation. Appl. Catal. A Gen. 339 (1), 61–67. doi:10.1016/j.apcata.2008.01.008
Etim, U. J., Xu, B., Bai, P., Ullah, R., and Yan, Z. (2016). Role of nickel on vanadium poisoned fcc catalyst: a study of physiochemical properties. J. Energ. Chem. 25 (4), 667–676. doi:10.1016/j.jechem.2016.04.001
Harding, R. H., Peters, A. W., and Nee, J. R. D. (2001). New developments in FCC catalyst technology. Appl. Catal. A: Gen. 221, 389–396. doi:10.1016/S0926-860X(01)00814-6
Ihli, J., Ferreira Sanchez, D., Rosh, J., Cuartero, V., Mathon, O., Krumeich, F., et al. (2017). Localization and speciation of iron impurities within a fluid catalytic cracking catalyst. Angew. Chem. 56, 14031–14035. doi:10.1002/anie.201707154
Jiang, H., Livi, K. J., Kundu, S., and Cheng, W. C. (2018). Characterization of iron contamination on equilibrium fluid catalytic cracking catalyst particles. J. Catal. 361, 126–134. doi:10.1016/j.jcat.2018.02.025
Lahnafi, A., Elgamouz, A., Tijani, N., and Shehadi, I. (2020). Hydrothermal synthesis of zeolite A and Y membrane layers on clay flat disc support and their potential use in the decontamination of water polluted with toxic heavy metals. Desalination Water Treat. 182, 175–186. doi:10.5004/dwt.2020.25173
Lappas, A. A., Nalbandian, L., Iatridis, D. K., Voutetakis, S. S., and Vasalos, I. A. (2001). Effect of metals poisoning on FCC products yields: studies in an FCC short contact time pilot plant unit. Catal. Today 65 (2), 233–240. doi:10.1016/S0920-5861(00)00588-5
Liu, Z., Zhang, Z., Liu, P., Zhai, J., and Yang, C. (2015). Iron contamination mechanism and reaction performance research on FCC catalyst. J. Nanotechnology 2015 (2), 1–6. doi:10.1155/2015/273859
Long, J., Zhu, Y. X., Liu, Y. J., Da, Z. J., and Zhou, H. (2005). Effects of vanadium oxidation number on desulfurization performance of FCC catalyst. Appl. Catal. A Gen. 282 (1–2), 295–301. doi:10.1007/978-1-4419-7371-9_1
Luo, L., Rainer, D., and Gonzalez, J. A. (2007). Laboratory deactivation testing for the stability of FCC CO combustion promoters. Appl. Catal. B 72 (3–4), 212–217. doi:10.1016/j.apcatb.2006.10.010
Mathieu, Y., Corma, A., EchardI, M., and Bories, M. (2014). Single and combined fluidized catalytic cracking (FCC) catalyst deactivation by iron and calcium metal–organic contaminants. Appl. Catal. A Gen. 469, 451–465. doi:10.1016/j.apcata.2013.10.007
Mehla, S., Kukade, S., Kumar, P., Rao, P. V. C., Sriganesh, G., and Ravishankar, R. (2019). Fine tuning h-transfer and β-scission reactions in VGO FCC using metal promoted dual functional ZSM-5. Fuel 242, 487–495. doi:10.1016/j.fuel.2019.01.065
Meirer, F., Morris, D. T., Kalirai, S., Liu, Y., Andrews, J. C., and Weckhuysen, B. M. (2015). Mapping metals incorporation of a whole single catalyst particle using element specific X-ray nanotomography. J. Am. Chem. Soc. 137 (1), 102–105. doi:10.1021/ja511503d
Pan, S. S., Lin, L. T. X., Komvokis, V., Spann, A., Clough, M., and Yilmaz, B. (2015). Nanomaterials fueling the world. in Nanomaterials for sustainable energy. Washington, DC, United States: American Chemical Society, 1213, 3–18. doi:10.1021/bk-2015-1213.ch001
Psarras, A. C., Iliopoulou, E. F., Nalbandian, L., Lappas, A. A., and Pouwels, C. (2007). Study of the accessibility effect on the irreversible deactivation of FCC catalysts from contaminant feed metals. Catal. Today 127 (1–4), 44–53. doi:10.1016/j.cattod.2007.05.021
Rainer, D. R., Rautiainen, E., and Imhof, P. (2003). Novel lab-scale deactivation method for FCC catalyst: inducing realistic accessibility responses to iron poisoning. Appl. Catal. A Gen. 249 (1), 69–80. doi:10.1016/S0926-860X(03)00203-5
Rainer, D. R., Rautiainen, E., Nelissen, B., Imhof, P., and Vadovic, C. (2004). Simulating iron-induced FCC accessibility losses in lab-scale deactivation. Stud. Surf. Sci. Catal. 149, 165–176. doi:10.1016/S0167-2991(04)80761-4
Souza, N. L. A., Tkach, I., Morgado, E., and Krambrock, K. (2018). Vanadium poisoning of FCC catalysts: a quantitative analysis of impregnated and real equilibrium catalysts. Appl. Catal. A. Gen. 560, 206–214. doi:10.1016/j.apcata.2018.05.003
Souza, N. L., Paniago, R., Ardisson, J. D., Morgado, E., and Krambrock, K. (2019). Iron contamination of FCC catalysts: quantification of different crystalline phases and valence states. Appl. Catal. A: Gen. 569, 57–65. doi:10.1016/j.apcata.2018.10.019
Tangstad, E., Andersen, A., Myhrvold, E. M., and Myrstad, T. (2008). Catalytic behaviour of nickel and iron metal contaminants of an FCC catalyst after oxidative and reductive thermal treatments. Appl. Catal. A Gen. 346 (1–2), 194–199. doi:10.1016/j.apcata.2008.05.022
Tangstad, E., Myhrvold, E. M., and Myrstad, T. (2000). A study on the effect of sodium chloride deposition on an FCC catalyst in a cyclic deactivation unit. Appl. Catal. A Gen. 193 (1), 113–122. doi:10.1016/S0926-860X(99)00414-7
Wise, A. M., Weker, J. N., Kalirai, S., Farmand, M., Shapiro, D. A., Meirer, F., et al. (2016). Nanoscale chemical imaging of an individual catalyst particle with soft x-ray ptychography. Acs Catal. 6 (4), 2178–2181. doi:10.1021/acscatal.6b00221
Yaluris, G., Cheng, W. C., Peters, M., Mcdowell, L. T., and Hunt, L. (2004). Mechanism of fluid cracking catalysts deactivation by Fe. Stud. Surf. Sci. Catal. 149 (4), 139–163. doi:10.1016/S0167-2991(04)80760-2
Zhou, Q., Qi, Y., Liu, Q., Ren, F., and Zhang, L. (2020). A detailed speciation of iron on FCC catalysts based on an integrated use of advanced characterisation methods and thermodynamic equilibrium simulation. Appl. Catal. A: Gen. 599, 117597. doi:10.1016/j.apcata.2020.117597
Keywords: fluid catalytic cracking, iron contamination, nodulation, cyclic deactivation, iron naphthenate
Citation: Liao Y, Liu T, Du X and Gao X (2021) Distribution of Iron on FCC Catalyst and Its Effect on Catalyst Performance. Front. Chem. 9:640413. doi: 10.3389/fchem.2021.640413
Received: 11 December 2020; Accepted: 21 January 2021;
Published: 08 March 2021.
Edited by:
Jiaxu Liu, Dalian University of Technology, ChinaReviewed by:
Zifeng Yan, China University of Petroleum (Huadong), ChinaWang Gang, China University of Petroleum, China
Copyright © 2021 Liao, Liu, Du and Gao. This is an open-access article distributed under the terms of the Creative Commons Attribution License (CC BY). The use, distribution or reproduction in other forums is permitted, provided the original author(s) and the copyright owner(s) are credited and that the original publication in this journal is cited, in accordance with accepted academic practice. No use, distribution or reproduction is permitted which does not comply with these terms.
*Correspondence: Xionghou Gao, Z2FveGlvbmdob3VAcGV0cm9jaGluYS5jb20uY24=