Abstract
Macrophages have crucial roles in the pathogenesis of rheumatoid arthritis (RA). We aimed to elucidate the temporal profile of macrophage infiltration in synovitis in RA rat models using PET (positron emission tomography) imaging based a new generation of TSPO (Translocator protein, 18 kDa)-PET ligand, 18F-VUIIS1008 {2-[5,7-Diethyl-2-{4-[2-(18F)fluoroethoxy]phenyl}pyrazolo(1,5-a)pyri-midin-3-yl]-N, N-diethylacetamide}. In vitro and in vivo studies were conducted using RAW264.7 macrophage cells and a rat model of RA induced by Complete Freund’s Adjuvant (CFA). Our results showed 18F-VUIIS1008 showed excellent stability in vitro and binding specificity to RAW264.7 cells, and rapid accumulation in the left inflammatory ankles. PET studies revealed that 18F-VUIIS1008 could clearly identify the left inflammatory ankles with good contrast at 30–120 min post-injection. The uptake of 18F-VUIIS1008 of left inflammatory ankles was a wiggle trace with two peaks on day 7 and 29, and then, the highest peak uptake was seen on day 29 (3.00% ± 0.08%ID/g) at 60 min after injection. Tracer uptakes could be inhibited by PK11195 or VUIIS1008. Immunohistochemistry and immunofluorescence tests showed that elevated TSPO expression and infiltrated macrophages were found in the left inflammation ankles. 18F-VUIIS1008 as a novel PET imaging agent showed great potential to identify temporal profile of macrophage infiltration in synovitis in RA, and deliver accurate non-invasive diagnosis and real-time monitoring of RA development.
1 Introduction
Rheumatoid arthritis (RA) is a chronic systemic autoimmune inflammatory disease primarily characterized by chronic joint inflammation, cartilage destruction and bone erosion, leading to severe progressive joint damage, functional disability, morbidity, and increased mortality (Calabrò et al., 2016). RA is approximately three-times more common in women than in men and affects 0.5%–1.0% of the world’s population (De Cata et al., 2014). The main objective of RA treatment is to stop inflammation, relieve symptoms, prevent joint and organ damage, improve physical function and reduce long-term complications (Jalil et al., 2016). The common treatment method is anti-inflammation early in the disease course as soon as the diagnostic has been established, suggesting that the early diagnosis is a key for the therapy and prognosis of RA.
Although the pathogenesis of RA is not yet completely understood, it is considered as a complex, multi-factorial etiology, including genetic sensitivity, and environment factors and autoimmune responses, which collectively trigger the onset and persistence of inflammatory circumstance (Firestein, 2003). Mounting data of evidence have shown that the degree of macrophage infiltration into the synovium is correlated with the degree of bone erosion in the affected joints in RA (Soler Palacios et al., 2015; Udalova et al., 2016), since pro-inflammatory cytokines from activated macrophage, such as tumor necrosis factor-α (TNF-α), interleukin-1 (IL-1), and interleukin-6 (IL-6), contribute to synovial inflammation in early stages of RA (Arthur and Ley, 2013). The abundance of synovial tissue macrophages is an early RA hallmark (Kurowska-Stolarska and Alivernini, 2022). Therefore, the imaging using a specific probe targeted activated macrophage possibly enable an earlier detection of RA. Recently, specific ligands targeting macrophage receptors such as CD20 receptor, interleukin-1 (IL-1) receptor, etc., have been investigated in the patients with RA using 99mTc-anti-CD20, 123I-IL-1ra and 124I-anti-CD20 illustrating the interest for molecular imaging in this type of pathology (Barrera et al., 2000; Tran et al., 2011; Malviya et al., 2012). The drawbacks of probes with antibodies severely hamper their clinical applications due to their large size resulting in slow inflammation accumulation and slow clearance from the circulation (Su et al., 2015).
The translocator protein 18 kDa (TSPO), previously known as the peripheral-type benzodiazepine receptor (PBR), is located in the outer mitochondrial membrane, where involved in apoptosis, cell proliferation, anion transport, regulation of mitochondrial functions and immunomodulation (Papadopoulos et al., 2006). TSPO is a potential candidate for individualized approach to inflammation as its expression is enhanced in activated macrophage but it is low in the normal macrophage (Kanegawa et al., 2016). Thus, TSPO is regarded as a potential target for inflammatory diseases (Gatliff and CampanellaTSPO, 2016). It has been reported that positron emission tomography (PET) or single photon emission computed tomography (SPECT) study targeted TSPO probes, including 11C-(R)-PK11195, 11C-DPA-713, 18F-DPA-714 or 99mTc-DTPA-CB86, can visualize RA (Gent et al., 2014a; Gent et al., 2014b; Liu et al., 2020). However, to our knowledge, few studies on TSPO imaging in vivo assessing the complete time course of joint inflammation during complete Freund’s adjuvant (CFA)-induced RA have been reported. Establishing such data may be important for the subsequent development of image-guided anti-inflammation interventions. Compared with 11C and 99mTc, 18F may improve imaging of TSPO-expression and is more suitable for clinical application. In addition, a novel TSPO ligand (2-(5,7-diethyl-2-(4-(3-fluoro- 2-methylpropoxy)phenyl)pyrazolo[1,5-a]pyrimidin-3-yl)-N,N-diethylacetamide, VUI- IS1008), has been proved a 36-fold enhancement in binding affinity (Ki = 0.3 ± 0.14 nM) compared to DPA-714 (Ki = 10.9 ± 0.39 nM) (Tang et al., 2014). Furthermore, Kwon YD, et al., have reported that in a rat lipopolysaccharide (LPS)-induced neuroinflammation model, the uptake ratio of 18F-VUIIS1008 between the neuroinflammation ipsilateral and contralateral regions in the brain was 18% higher than that of 18F-DPA-714, suggesting that 18F-VUIIS1008 has better PET imaging tracer’s features for identifying neuroinflammation in brain than that of 18F-DPA-714 (Kwon et al., 2018). Accordingly, in the present study, we aimed to elucidate the potential role of longitudinal 18F-VUIIS1008 PET imaging in an experimental RA.
2 Materials and methods
2.1 General
VUIIS1008, a new TSPO agent, was presented by Professor Shoufa Han (College of Chemistry and Chemical Engineering, Xiamen University) according to the previous study by Kwon YD (Kwon et al., 2018). No-carrier-added 18F-fluoride was kindly provided by the First Affiliated Hospital of Xiamen University. Freund’s Adjuvant and anti-TSPO antibodies were purchased from Sigma-Aldrich Shanghai Trading Co Ltd. (Shanghai, China). Goat anti-mouse IgG antibody was from Santa Cruz Biotechnology Inc. (Santa Cruz, California, United States). WIZARD 2480 gamma counter from Perkin-Elmer Inc. (Waltham, MA, United States). CRC-25R Dose Calibrator from Capintec Inc. (Ramsey, New Jersey, United States). Mouse macrophage RAW264.7 cell lines were obtained from the Cell Culture Center of Institute of Basic Medical Sciences of Chinese Academy of Medical Sciences (Beijing, China). Male Wistar rats, aged 6–8 weeks (200–300 g), were purchased from the Experimental Animal Center of Xiamen University (Xiamen, China). Small animal PET/CT imaging studies were performed using a micro-PET/CT scanner (Inveon, Siemens Medical Solutions United States, Inc.).
2.2 Chemistry and radiochemistry
The synthesis of radiotracers 2-(5,7-diethyl-2-(4-(2-fluoroethoxy) phenyl) pyrazolo [1,5-a] pyrimidin-3-yl)-N, N-diethylacetamide (18F-VUIIS1008) were prepared from its corresponding tosylate precursors via manual synthesis according to previously reported procedures (Tang et al., 2013; Kwon et al., 2018). Briefly, aqueous 18F-fluoride (5–15 mCi; 0.2∼0.6 GBq) was eluted from the cartridge with a solution of Kryptofix K2.2.2 to form the complexation mixture. This complex was then reacted with appropriate tosylate precursor VUIIS1008 (4.0 mg) in dimethylsulfoxide (0.7 mL) at 100°C for 15min. The reaction crude was purified using semi-preparative HPLC (C18, Dynamax 250 × 10 mm; Varian), eluting with 10 mM NaH2PO4 buffer (pH 6.7) and methanol (30/70, v/v) at 3.0 mL/min. The product (18F-VUIIS1008) was collected directly into 140 ml of water (deionized), passed through a C-18 September-Pak Plus (Waters, Milford, MA, United States of America), and eluted with 200 proof ethanol (1.0 mL) then saline (0.9%) into a sterile vial.
2.3 Lipophilicity test of 18F-VUIIS1008
According to our previous report (Liu et al., 2020), the lipophilicity of 18F-VUIIS1008 was analysed by the n-octanol/water mixture containing 200 μL 18F-VUIIS1008 and 1 mL phosphate-buffered saline (pH = 7.4). The solution was centrifuged at 6,000 rpm for 5 min, and separated and then they were counted in a γ counter, respectively. The radioactivity were used to calculate the log p values. The lipophilicity of 18F-VUIIS1008 was determined as (cpm in organic phase)/ (cpm in water phase).
2.4 Stability studies
Based on our previous report (Liu et al., 2020), the stability of the complex containing 500 μL (3.7 MBq) 18F-VUIIS1008 and phosphate-buffered saline (PBS, pH = 7.4) or mouse serum was evaluated by performing the complex at 37°C for 30、60、120、and 240 min. The radioactivity of 18F-VUIIS1008 was measured at various time points by a HPLC.
2.5 Cell tests
The RAW264.7 cell lines were conducted cell uptake, and efflux tests in accordance with our previous study (Liu et al., 2020).
2.5.1 Cell uptake tests
The RAW264.7 cell lines were cultured at 37°C for 15, 30, 60 and 120 min in the complex containing 0.5 mL serum-free DMEM medium and 7.4 × 10⁻³ MBq 100 μL 18F-VUIIS1008 with/without 10.0 μg unlabeled VUIIS1008, and then were lysed with 1 mL 1 M NaOH. The radioactivity of the lysates was measured at various time points by a γ counter.
2.5.2 Cell efflux tests
The RAW264.7 cells were cultured at 37°C for 120, 135, 150 and 180, 240 min in the culture medium with 1.11 × 10⁻² MBq 100 μL 18F-VUIIS1008 and then were lysed with 1 mL 1 M NaOH. The radioactivity of the lysates was measured at various time points by a γ counter.
2.6 Rat models with RA
The animal study protocol was carried out according to the principles outlines by the Institutional Animal Care and Use Committee of Zhongshan Hospital Xiamen University. The left inflammatory ankles were induced in male Wistar rats in accordance with our previous study (Liu et al., 2020). Briefly, 0.1 mL of Complete Freund’s Adjuvant (CFA) with Mycobacterium butyricum 1% suspension in mineral oil was injected into the left ankle of each rat (day 0). The severity of RA was monitored daily by two observers. The left inflammatory ankles were estimated by the number swollen joints. When the left inflammatory ankles grew to swell in two to three joints, the RA rats were subject to in vivo biodistribution and PET studies.
2.7 Biodistribution analysis
The biodistribution analysis were induced on day 3 after CFA injection. RA rats were administrated with 18F-VUIIS1008 (3.7 MBq, 100 μL) via tail vein. At 30, 60, and 120 min post-injection, the left inflammatory ankles and normal tissues of interest were removed and determined their radioactivity with a γ counter. For in vivo specificity study, RA rats were injected with 18F-VUIIS1008 and unlabeled PK11195 (500 μg), and biodistribution studies were performed at 60 min post-injection. The radioactivity ratios of the left inflammatory ankle to blood (LIA/B) and the left inflammatory ankle to muscle (LIA/M) were calculated. Biodistribution data are expressed as %ID/g values by dividing counts per gram per minute by the injected dose.
2.8 Micro-PET studies
PET imaging studies were performed using a micro-PET scanner (Siemens Medical Solutions United States, Inc.). Static PET imaging was performed at 30, 60, and 120 min post-injection of 3.7 MBq 100 μL 18F-VUIIS1008 via tail vein on day 3, 7, 12, 15, 19, 24, 29, 35, 38, and 45 after CFA injection. For blocking imaging, unlabeled PK11195 (500 μg) or VUIIS1008 (500 μg) was co-injected with 18F-VUIIS1008 (3.7 MBq 100 μ) on day seven. The RA rat were anesthetized with 2% isoflurane and positioned prone in micro-PET bed. Micro-PET images were reconstructed using an 3D OSEM scatter corrected reconstruction algorithm. Regions of interest (ROIs) were placed on the left inflammatory ankles. Micro-PET data are expressed as %ID/g values by dividing counts per gram per minute by the injected dose.
2.9 Histological studies
According to routine protocols, Hematoxylin and Eosin (HE staining), immunohistochemistry (IHC) tests and immunofluorescence staining were carried out in the tissues of left inflammatory ankles, contralateral normal ankles on day 3 after CFA injection. For HE tests, 5 𝜇m longitudinal sections were stained with hematoxylin and Eosin solution for 5 and 3 min at 25°C, respectively, and then analysed using an Olympus BX53 fluorescence microscope (Tokyo, Japan). For immunohistochemical analyses, the slices successively incubated with rabbit anti-rat TSPO antibodies (1:100, Abcam) and goat anti-rat secondary antibodies (1:1,000; Sigma) for 2 h at 25°C, and then analysed using an Olympus BX53 fluorescence microscope. For immunofluorescence staining, according to a standard protocol (Capaccione et al., 2020). The slides successively incubated with rabbit anti-rat TSPO antibodies (1:100, Abcam), anti-mouse CB68 antibodies (1:100, Abcam), and goat anti-rat FITC-IgG secondary antibodies (1:200; Sigma), goat anti-mouse TRITC-IgG secondary antibodies (1:200; Sigma), respectively, for 2 h at 25°C, and then stained using 200–300 μL 10 μg/mL of DAPI. After then, These slides were analysed using an Olympus BX53 fluorescence microscope.
2.10 Statistical analysis
The experimental data are presented as mean ± standard deviation. Statistical calculations were determined using the Student’s t-test and p < .05 was statistically significant.
3 Results and discussion
3.1 Radiosynthesis of 18F-VUIIS1008 and log P determination
18F-VUIIS1008 was successfully radiosynthesized (Figure1). Under radio-HPLC conditions described above, 18F-VUIIS1008 displayed a retention time of 11.8 min. The radiochemical purity of the radiopharmaceutical exceeded 98.00%, and the specific activity of the purified 18F-VUIIS1008 was 1.52 × 10⁸ MBq/mmol. The lipid-water partition coefficient (log P) of 18F-VUIIS1008 is 1.58 ± 0.03, indicating 18F-VUIIS1008 is a fat-soluble compound.
FIGURE 1

Synthetic scheme of 18F-VUIIS1008.
3.2 Stability studies
18F-VUIIS1008 displayed excellent stability in the PBS (Figure 2) or mouse serum (Figure 3). It showed that defluorination of 18F-VUIIS1008 was not obviously found, and the percentage of intact probes remained more than 90% during 30–240 min of incubation in the PBS or mouse serum.
FIGURE 2

Prep-HPLC chromatogrm (A) and HPLC radiochromatograms of purified 18F-VUIIS1008 (B) and radiola-beled probe after 30 min (C), 60 min (D), 120 min (E) and 240 min (F) of incubation with PBS.
FIGURE 3

Prep-HPLC chromatogrm (A) and HPLC radiochromatograms of purified 18F-VUIIS1008 (B) and radiola-beled probe after 30 min (C), 60 min (D), 120 min (E) and 240 min (F) of incubation with mouse serum.
3.3 Cell assays
Cell uptake ratios of 18F-VUIIS1008 were shown in Figure 4A. The level of 18F-VUIIS1008 in RAW264.7 cells was 12.00 ± 0.10%, 13.00 ± 1.00%, 14.00 ± 0.30% and 23.00 ± 0.60% at 15, 30, 60, and 120 min, respectively. When the probe was incubated with large excesses of non-radioactive VUIIS1008, its uptake levels in RAW264.7cells was significantly inhibited (p <0.05) at all incubation time points. Moreover, cell efflux studies (Figure 4B) indicated 18F-VUIIS1008 has excellent cell retention in RAW264.7 cells, which 18F-VUIIS1008 efflux was 6.74% (reduction from 16.50 ± 0.002% to 9.76 ± 0.001% of total input radioactivity) from 120 min to 240 min incubation. In general, the results demonstrated that 18F-VUIIS1008 maintained high affinity to TSPO to further study in vivo TSPOtargeted imaging.
FIGURE 4

Uptake (A), and efflux assay (B) of 18F-VUIIS1008 in RAW264.7 cells.
3.4 Biodistribution studies
The biodistribution studies were conducted on day 3 after CFA injection. At 30, 60, and 120 min post-injection, the biodistribution characteristics of 18F-VUIIS1008 was shown in Figure 5. 18F-VUIIS1008 displayed high radioactivity uptake in the left inflammatory ankle. At 30, 60, and 120 min, the left inflammatory ankle uptake was 1.08% ± 0.08% ID/g, 1.33% ± 0.02% ID/g, 0.99% ± 0.1 3% ID/g, respectively, lower than that in the liver, kidney, intestine, stomach, lungs, bone, and spleen, whereas it was higher than blood, muscle, and brain. Furthermore, 18F-VUIIS1008 showed high levels of the left inflammatory ankle to muscle (LIA/M) and left inflammatory ankle to blood (LIA/B) (Figure 6). At 60 min, the ratio of LIA/M and LIA/B was 1.65 ± 0.07 and 4.40 ± 0.22, respectively, and higher than that at 30 and 120 min.
FIGURE 5
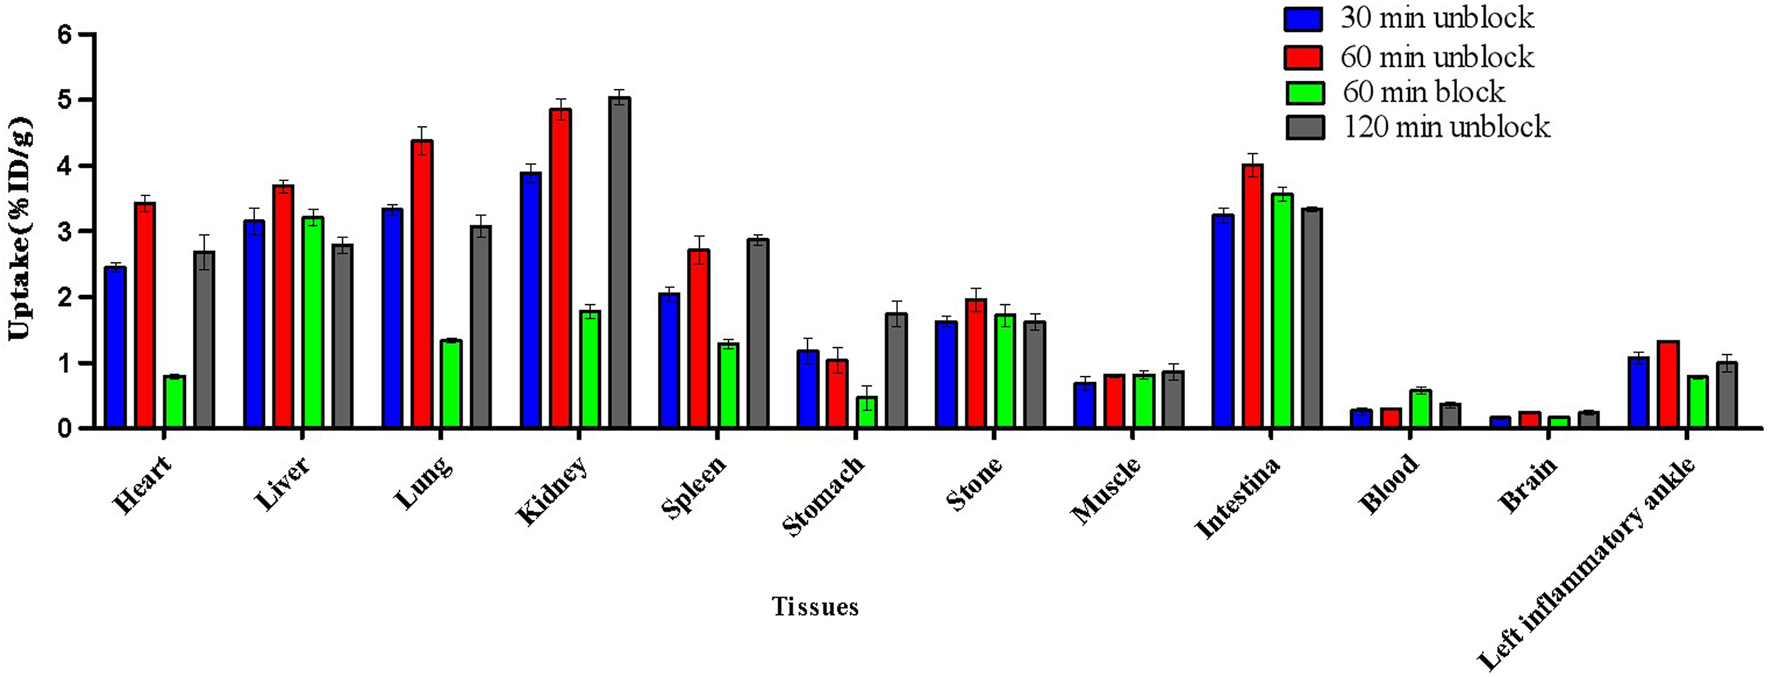
Biodistribution results for 18F-VUIIS1008 on day 3 after CFA injection. Data are presented as %ID/g at various times post-injection of 18F-VUIIS1008.
FIGURE 6
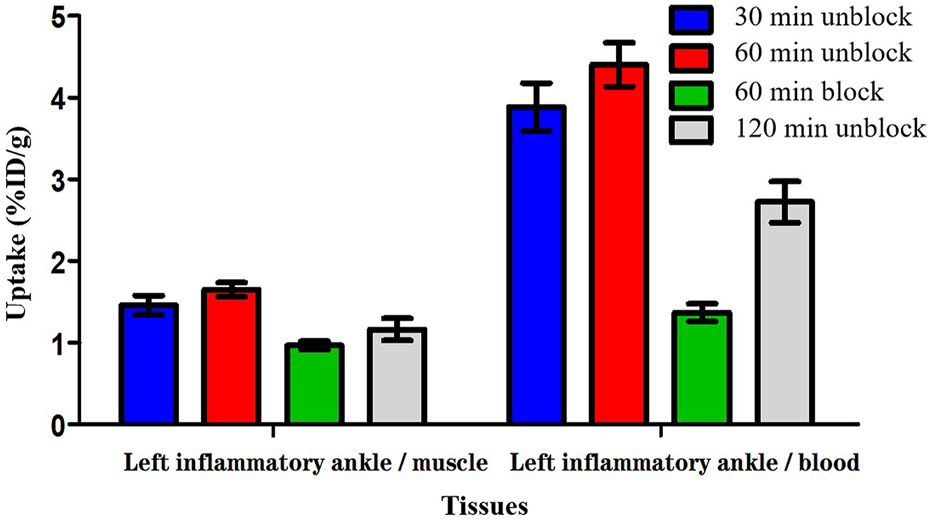
The radioactivity ratios of the left inflammatory ankle to blood (LIA/B) and the left inflammatory ankle to muscle (LIA/M) at various times post-injection based on biodistribution results of 18F-VUIIS1008.
In order to investigate the specificity of 18F-VUIIS1008, an excess of PK11195 (500 μg) was coinjected with 18F-VUIIS1008 into RA rats to saturate endogenous and overexpressed TSPO in some normal tissues. PK11195 decreased significantly the accumulations of 18F-VUIIS1008 in the left inflammatory ankle and many tissues, such as liver, lung, heart, kidney, stomach, and intestine (p <.05), whereas it did not decreased those in the blood, muscle, and bone (p >.05).
3.5 Longitudinal PET/CT imaging studies
Longitudinal small animal PET/CT studies were performed at 30, 60, and 120 min after injection of 18F-VUIIS1008 on day 3, 7, 12, 15, 19, 24, 29, 35, 38, and 45 after CFA injection. As shown in Figure 7, 18F-VUIIS1008 highly accumulated in the left inflammatory ankles at 30 min compared with the collateral ankles, and exhibited a gradual increasing uptake during 60–120 min post-injection. The left inflammatory ankles were clearly visible with good inflammatory to background contrast. During day 3–45 after CFA injection, the uptake of left inflammatory ankles was a wiggle trace with two peaks on day 7 and 29, and then the uptake on day 29 was the highest (60 min (3.00% ± 0.08% ID/g) (p <.05) (Figures 8–10). Importantly, there was an inflection point on day 15, and after day 15, the uptake gradually increased along with time till day 29, then dropped slowly along with time till day 45, when the uptake was the lowest, and still higher than that in collateral muscle. Furthermore, when co-injected with unlabeled PK11195 (500 μg) or VUIIS1008 (500 μg), the left inflammatory ankles were barely visible on PET images at 60 min post-injection (Figure 11), while the contralateral normal muscle stayed at the low uptake level, affected slightly by PK11195 or VUIIS1008 injection. Regions of interest (ROIs) analysis of PET showed a high ratio of the left inflammatory ankle in RA rats injected unblocking dose compared to with 500 μg blocking dose at 60 min post-injection (Figure 12) (p <.05).
FIGURE 7

18F-VUIIS1008 PET imaging of RA rat model at 30, 60, and 120 min post-injection on day 3, 7, 29, 35 after CFA injection. Red arrow indicate left inflammatory ankles.
FIGURE 8

18F-VUIIS1008 PET imaging of RA rat model at 60 min post-injection on day 3, 7, 12, 15, 19, 24, 29, 35, 38, and 45 after CFA injection. Red arrow indicate left inflammatory ankles.
FIGURE 9
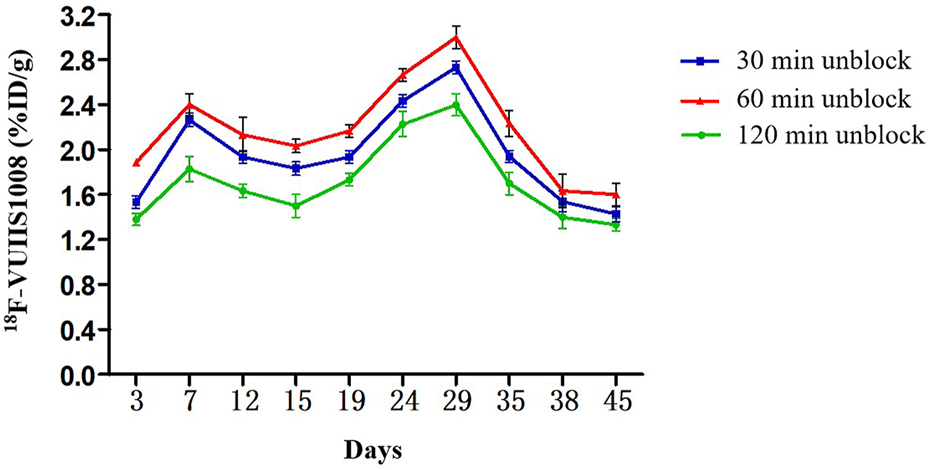
Quantitative analysis of 18F-VUIIS1008 uptake in the left inflammatory ankles at different time post-injection on different day based on PET imaging. Peak uptake was found on day 29.
FIGURE 10

Quantitative analysis of 18F-VUIIS1008 uptake in the left inflammatory ankles on day 3, 29, 45 based on PET imaging.
FIGURE 11

Representative PET images of 18F-VUIIS1008 uptake in the left inflammatory ankles without and with cold PK11195 or VUIIS1008 blocking. Red arrow indicate left inflammatory ankles.
FIGURE 12

Quantification of 18F-VUIIS1008 uptake in the left inflammatory ankles without and with cold PK11195 or VUIIS1008 blocking.
3.6 Histological results
For HE tests, it found that synovial hyperplasia and infiltration of inflammatory cells (such as lymphocaytes and macrophages) were identified in the left inflammatory ankles, while they were not observed in the normal contralateral ankles (Figure 13A). For immunohistochemistry (IHC) analysis, there found positive staining of TSPO in the left inflammatory ankles, while negative expression of TSPO in the normal contralateral normal ankles (Figure 13B). Moreover, for immunofluore-scence analysis, it showed the positive staining of TSPO and macrophage (CD68) could be detected in the left inflammatory ankles, whereas they were not found in the normal contralateral normal ankles (Figure 14).
FIGURE 13

(A) HE staining of the left inflammatory ankles and contralateral normal ankles (×100). (B) The expression of TSPO on the left inflammatory ankles and contralateral normal ankles by immunohistochemical analysis (×100).
FIGURE 14
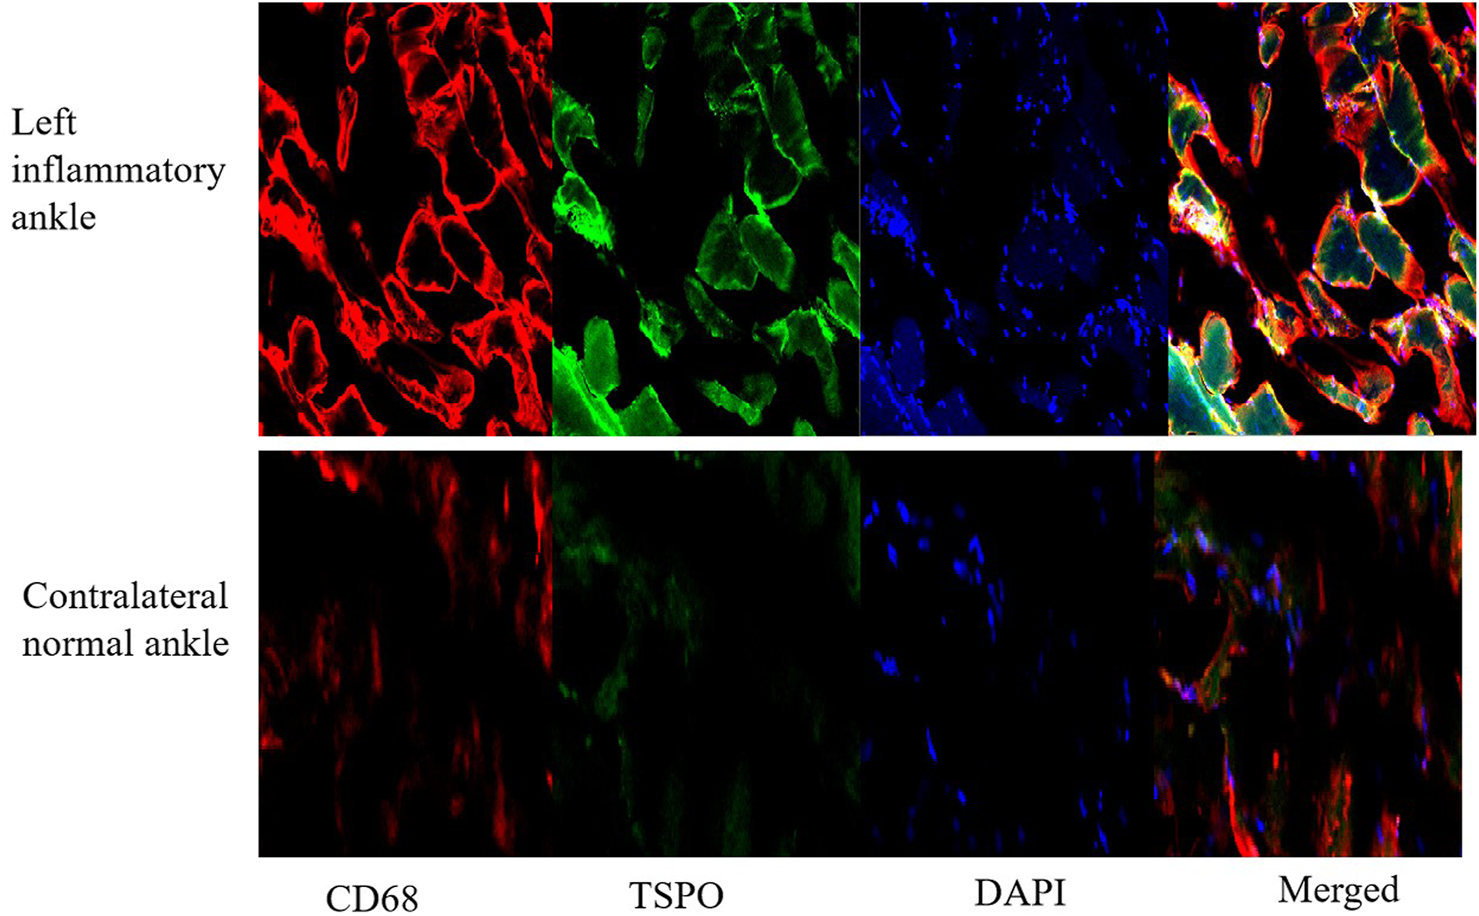
The expression of TSPO and CD68 on contralateral normal ankles by immunofluorescence staining (×100).
4 Conclusion
In this study, we performed longitudinal 18F-VUIIS1008 PET imaging to defined the temporal profile of macrophage infiltration in synovitis in rat models of rheumatoid arthritis. The results supported the feasibility of 18F-VUIIS1008 PET imaging to identify the dynamics of macrophage activation and infiltration in different stages of synovitis in RA rat models, suggesting 18F-VUIIS1008 PET imaging could be used to be a non-invasive imaging technique for clinical management of RA.
Statements
Data availability statement
The original contributions presented in the study are included in the article/Supplementary Materials, further inquiries can be directed to the corresponding author.
Ethics statement
The animal study was reviewed and approved by the animal procedures were performed according to a protocol approved by the Institutional Animal Care and Use Committee of Zhongshan Hospital Xiamen University.
Author contributions
XS designed, wrote, and funded the study, LW and RY conducted all the experiments and prepared the figures, ZG participated in the discussion. All authors approved the final version.
Funding
This work was supported by grants from the National Natural Science Foundation of China (NSFC) (82071965), Fujian medical innovation project (2019-CXB-32), National Natural Science Foundation of Fujian province (2020J011210), and Huadong Medicine Joint Funds of the Zhejiang Provincial Natural Science Foundation of China (LHDMZ22H300010).
Conflict of interest
The authors declare that the research was conducted in the absence of any commercial or financial relationships that could be construed as a potential conflict of interest.
Publisher’s note
All claims expressed in this article are solely those of the authors and do not necessarily represent those of their affiliated organizations, or those of the publisher, the editors and the reviewers. Any product that may be evaluated in this article, or claim that may be made by its manufacturer, is not guaranteed or endorsed by the publisher.
Abbreviations
RA, rheumatoid arthritis; TSPO, translocator protein, 18 kDa; PET, positron emission tomography; SPECT, single-photon emission computed tomography; VUIIS1008, 2-(5,7-diethyl-2-(4-(2-flfluoroethoxy)phenyl)pyrazolo[1,5-a]pyrimidin-3 -yl)-N,N-di- ethylacetamide); 18F, fluorine-18; CFA, Complete Freund’s Adjuvant; DMSO, dimethyl sulfoxide; DMEM, Dulbecco’s modifified Eagle’s medium; RAW264.7, mouse macrophage cell lines; PBS, phosphate-buffered saline; LIA/M, the ratio of the left inflflammatory ankle to muscle; LIA/B, the ratio of the left inflammatory ankle to blood; ROI, regions of interest; %ID/g, percentage of the injected radioactivity per gram of tissue.
References
1
Arthur J. S. Ley S. C. (2013). Mitogen-activated protein kinases in innate immunity. Nat. Rev. Immunol.13 (9), 679–692. 10.1038/nri3495
2
Barrera P. van der Laken C. J. Boerman O. C. Oyen W. J. van de Ven M. T. van Lent P. L. et al (2000). Radiolabelled interleukin‐1 receptor antagonist for detection of synovitis in patients with rheumatoid arthritis. Rheumatolog- (Oxford)39 (8), 870–874. 10.1093/rheumatology/39.8.870
3
Calabrò A. Caterino A. L. Elefante E. Valentini V. Vitale A. Talarico R. et al (2016). One year in review 2016: Novelties in the treatment of rheumatoid arthritis.novelties in the treatment of rheumatoid arthritis. Clin. Exp. Rheumatol.34 (3), 357–372.
4
Capaccione K. M. Doubrovin M. Bhatt N. Mintz A. Molotkov A. (2020). Granzyme B PET imaging of the innate immune response. Molecules25 (13), 3102. 10.3390/molecules25133102
5
De Cata A. D'Agruma L. Tarquini R. Mazzoccoli G. (2014). Rheumatoid arthritis and the biological clock. Expert Rev. Clin. Immunol.10 (5), 687–695. 10.1586/1744666x.2014.899904
6
Firestein G. S. (2003). Evolving concepts of rheumatoid arthritis. Nature423 (6937), 356–361. 10.1038/nature01661
7
Gatliff J. CampanellaTSPO M. (2016). Tspo: Kaleidoscopic 18-kDa amid biochemical pharmacology, control and targeting of mitochondria. Biochem. J.473 (2), 107–121. 10.1042/bj20150899
8
Gent Y. Y. Ahmadi N. Voskuyl A. E. Hoetjes N. van Kuijk C. Britsemmer K. et al (2014). Detection of subclinical syno- vitis with macrophage targeting and positron emission tomography in patients with rheumatoid arthritis without clinical arthritis. J. Rheumatol.41 (11), 21 45–2152. 10.3899/jrheum.140059
9
Gent Y. Y. Weijers K. Molthoff C. F. Windhorst A. D. Huisman M. C. Kassiou M. et al (2014). Promising potential of new genera- tion translocator protein tracers providing enhanced contrast of arthritis imag- ing by positron emission tomography in a rat model of arthritis. Arthritis Res. Ther.16 (2), R70. 10.1186/ar4509
10
Jalil S. F. Arshad M. Bhatti A. Ahmad J. Akbar F. Ali S. et al (2016). Rheumatoid arthritis: What have we learned about the causing factors?Pak J. Pharm. Sci.29 (2), 629–645.
11
Kanegawa N. Collste K. Forsberg A. Schain M. Arakawa R. Jucaite A. et al (2016). In vivo evidence of a functional association between immune cells in blood and brain in healthy human subjects. Brain Behav. Immun.54, 149–157. 10.1016/j.bbi.2016.01.019
12
Kurowska-Stolarska M. Alivernini S. (2022). Synovial tissue macrophages in joint homeostasis, rheumatoid arthritis and disease remission. Nat. Rev. Rheumatol.18 (7), 384–397. 10.1038/s41584-022-00790-8
13
Kwon Y. D. Kang S. Park H. Cheong I. K. Chang K. A. Lee S. Y. et al (2018). Novel potential pyrazolopyrimidine based translocator protein ligands for the evaluation of neuroinflammation with PET. Eur. J. Med. Chem.159, 292–306. 10.1016/j.ejmech.2018.09.069
14
Liu P. Wang T. Yang R. Dong W. Wang Q. Guo Z. et al (2020). Preclinical evaluation of a novel 99mTc-labeled CB86 for rheumatoid arthritis imaging. ACS Omega5 (49), 31657–31664. 10.1021/acsomega.0c04066
15
Malviya G. Anzola K. L. Podestà E. Laganà B. Del Mastro C. Dierckx R. A. et al (2012). (99m)Tc-labeled rituximab for imaging B lymphocyte infiltration in inflammatory autoimmune disease patients. Mol. Imaging Biol.14 (5), 637–646. 10.1007/s11307-011-0527-x
16
Papadopoulos V. Baraldi M. Guilarte T. R. Knudsen T. B. Lacapère J. J. Lindemann P. et al (2006). Translocator prot- ein (18kDa): New nomenclature for the peripheral-type benzodiazepine receptor based on its structure and molecular function. Trends Pharmacol. Sci.27 (8), 402–409. 10.1016/j.tips.2006.06.005
17
Soler Palacios B. Estrada-Capetillo L. Izquierdo E. Criado G. Nieto C. Municio C. et al (2015). Macrophages from the synovium of active rheumatoid arthritis exhibit an activin A-dependent pro-inflammatory profile. J. Pathol.235 (3), 515–526. 10.1002/path.4466
18
Su X. Cheng K. Liu Y. Hu X. Meng S. Cheng Z. (2015). PET imaging of insulin-like growth factor type 1 receptor expression with a 64Cu-labeled Affibody molecule. Amino Acids47 (7), 1409–1419. 10.1007/s00726-015-1975-4
19
Tang D. McKinley E. T. Hight M. R. Uddin M. I. Harp J. M. Fu A. et al (2013). Synthesis and structure-activity relationships of 5, 6, 7-subst- ituted pyrazolopyrimidines: Discovery of a novel TSPO PET ligand for cancer imaging. J. Med. Chem.56 (8), 3429–3433. 10.1021/jm4001874
20
Tang D. Nickels M. L. Tantawy M. N. Buck J. R. Manning H. C. (2014). Preclinical imaging evaluation of novel TSPO-PET ligand 2-(5, 7-Diethyl-2-(4-(2-[(18)F]fluoroethoxy) phenyl)pyrazolo[1, 5-a]pyrimidin-3-yl)-N, N-diethylacetamide ([ (18)F]VUIIS1008) in glioma. Mol. Imaging Biol.16 (6), 813–820. 10.1007/s11307-014-0743-2
21
Tran L. Huitema A. D. van Rijswijk M. H. Dinant H. J. Baars J. W. Beijnen J. H. et al (2011). CD20 antigen imaging with 124I-rituximab PET/CT in patients with rheumatoid arthritis. Hum. Antibodies20 (1-2), 29–35. 10.3233/hab-2011-0239
22
Udalova I. A. Mantovani A. Feldmann M. (2016). Macrophage heterogeneity in the con- text of rheumatoid arthritis. Nat. Rev. Rheumatol.12 (8), 472–485. 10.1038/nrrheum.2016.91
Summary
Keywords
18F-VUIIS1008, PET, rheumatoid arthritis, TSPO 18 kDa, macrophages
Citation
Su X, Wang L, Yang R and Guo Z (2022) Longitudinal 18F-VUIIS1008 PET imaging in a rat model of rheumatoid arthritis. Front. Chem. 10:1064518. doi: 10.3389/fchem.2022.1064518
Received
08 October 2022
Accepted
09 December 2022
Published
23 December 2022
Volume
10 - 2022
Edited by
Xuetao Xu, Wuyi University, China
Reviewed by
Sridhar Goud Nerella, National Institutes of Health (NIH), United States
Carsten Höltke, University Hospital Münster, Germany
Updates
Copyright
© 2022 Su, Wang, Yang and Guo.
This is an open-access article distributed under the terms of the Creative Commons Attribution License (CC BY). The use, distribution or reproduction in other forums is permitted, provided the original author(s) and the copyright owner(s) are credited and that the original publication in this journal is cited, in accordance with accepted academic practice. No use, distribution or reproduction is permitted which does not comply with these terms.
*Correspondence: Xinhui Su, suxinhui@zju.edu.cn
†These authors have contributed equally to this work
This article was submitted to Medicinal and Pharmaceutical Chemistry, a section of the journal Frontiers in Chemistry
Disclaimer
All claims expressed in this article are solely those of the authors and do not necessarily represent those of their affiliated organizations, or those of the publisher, the editors and the reviewers. Any product that may be evaluated in this article or claim that may be made by its manufacturer is not guaranteed or endorsed by the publisher.