 Anke Hering1†
 Beverly Jieu
 Markus Muttenthaler
- 1Institute for Molecular Bioscience, The University of Queensland, Brisbane, QLD, Australia
- 2Institute of Biological Chemistry, Faculty of Chemistry, University of Vienna, Vienna, Austria
The neuropeptide oxytocin (OT) regulates several peripheral and central functions and is a molecule of interest in psychiatric diseases such as autism spectrum disorder, schizophrenia, anxiety and depression. The study of OT in human serum samples is however hampered by inconsistent sample preparation and analysis as well as low endogenous blood concentration (1–10 pM). This results in varying reports on OT’s blood levels and interpretation of OT’s role in different (patho)physiological states. Quantitative mass spectrometry (MS) is a highly promising technology to address this problem but still requires large sample volumes to achieve adequate sensitivity and reliability for the quantitation of compounds at low concentrations. We therefore systematically evaluated sample preparation methods for MS to achieve a reliable sample preparation protocol with good peptide recovery, minimal matrix effects and good overall method efficiency in line with FDA guidelines for bioanalytic method development and validation. Additionally, we investigated a strategy to improve the ionization efficiency of OT by adding charged and/or hydrophobic moieties to OT to improve the lower limit of quantitation. Optimized sample preparation in combination with OT modification with a quaternary pyridinium ion improved the sensitivity of OT by ∼40-fold on a tandem triple quadrupole mass spectrometer (API4000 QTRAP), resulting in a lower limit of quantitation of 5 pM in water (linear range 5 pM – 1 mM) and 2 nM in human serum (linear range 2 nM – 1 mM) compared to 200 pM in water and 86 nM in serum with unmodified OT. This approach and protocol provide a solid foundation towards method development for OT quantitation using MS, which should be of high value for fundamental research as well as clinical monitoring of OT upon drug treatments.
Introduction
Oxytocin (OT) is an important neuropeptide and peptide hormone mediating several physiological functions. These range from peripheral functions like muscle contractions in the uterus during birth (Gimpl and Fahrenholz, 2001; Leng et al., 2008; Jurek and Neumann, 2018), ejaculation (Hib, 1974a; Hib, 1974b; Hib, 1977) and milk-ejection (McNeilly et al., 1983; Nishimori et al., 1996; Erickson et al., 2020), as well as anti-inflammatory effects in the cardiovascular (Jovanovic et al., 2019; Meusel et al., 2021) and gastrointestinal systems (Pfister et al., 2005; Welch et al., 2009; Welch et al., 2014; Tang et al., 2019), to central nervous system functions such as maternal care, pair-bonding, empathy, memory and learning (Heinrichs et al., 2009; Rasie Abdullahi et al., 2018; Salighedar et al., 2019). OT holds therapeutic potential for a wide variety of diseases including breast cancer (Ariana et al., 2018; Khori et al., 2018; Liu et al., 2020), cardiovascular disease (Merz et al., 2020), diabetes (Garrido-Urbani et al., 2018; Szeto et al., 2020; Yuan et al., 2020) and neurological disorders such as autism and schizophrenia (Green et al., 2001; Cyranowski et al., 2008; Goldman et al., 2008; Kéri et al., 2009; Feifel et al., 2010; Guastella et al., 2010; Bartholomeusz et al., 2015; Feifel et al., 2016; Alvares et al., 2017; Bradley and Woolley, 2017; Ooi et al., 2017). OT has also been studied for its potential as a biomarker, but progress has been hampered by inconsistent analysis methods and difficulties with reliably measuring the low levels of endogenous OT in the blood (1–10 pM) (Kagerbauer et al., 2013; Leng and Sabatier, 2016), resulting in contradicting measurements and rendering data interpretation difficult (Glovinsky et al., 1994; Bell et al., 2006; Jansen et al., 2006; Ozsoy et al., 2009; Miller et al., 2013; Strauss et al., 2015; Saxbe et al., 2019).
Radio- and enzyme-linked immunoassays are the most commonly used methods for OT analysis in biological samples, but they have been questioned for their lack of sensitivity and specificity as well as for their inconsistent sample preparation protocols (Szeto et al., 2011; McCullough et al., 2013; Robinson et al., 2014; Leng and Sabatier, 2016). Mass spectrometry (MS) is a promising alternative since it is a sensitive and mass-specific analytical method that can quantify a target analyte by its defined mass and fragmentation pattern, thereby excluding any metabolites that might still give a signal using immunoassays (McCullough et al., 2013). MS methods have been developed for OT quantitation using triple quadrupole (Zhang et al., 2011; Brandtzaeg et al., 2016) or orbitrap (Franke et al., 2019) mass spectrometers. However, achieving the required lower limit of quantitation (LLOQ) to reliably measure OT in the range of 1–10 pM remains challenging. We therefore set out to develop improved MS-based strategies and protocols towards the detection and quantitation of OT in biological samples.
The first challenge, one often overlooked, is that MS is susceptible to sample matrix interferences that cause ion suppression or enhancement, known as matrix effects (Mei et al., 2003; Panuwet et al., 2016). Matrix effects and their impact on analyte ionization depend on ionization type, biological matrix, chromatographic conditions, and sample preparation (Dams et al., 2003; Panuwet et al., 2016). Appropriate sample preparation is particularly important in reducing matrix effects as it removes impurities and matrix interferences (Szeto et al., 2011; Christensen et al., 2014; Robinson et al., 2014; Lefevre et al., 2017). Most sample preparation protocols developed for OT analysis unfortunately do not evaluate such matrix effects and lack adequate characterization according to the US Food and Drug Administration (FDA) guidelines for bioanalytical method development (Kramer et al., 2004; Brandtzaeg et al., 2016; Franke et al., 2019). The second challenge is that MS sensitivity is still not good enough to reliably quantify OT’s low endogenous levels, requiring large sample volumes to achieve adequate sensitivity or specialized equipment not available in most laboratories (e.g., 2D LC-MS/MS) (Dams et al., 2003; Zhang et al., 2011; Liu et al., 2019). When using electrospray ionization MS (ESI-MS), the sensitivity relies heavily on the analyte’s ionization efficiency and ion transmission (Kebarle and Tang, 1993; Page et al., 2007). These factors can be improved by introducing derivatizations to the peptide such as hydrophobic and charged amino acids, as well as quaternary ammonium, phosphonium, imidazolium and pyridinium salts (Bąchor et al., 2014; Qiao et al., 2014; Qiao et al., 2015; Waliczek et al., 2016).
Here, we describe the development of a robust sample preparation protocol following FDA guidelines in terms of LLOQ (Administration, U.F.A.D., 2018) and an OT derivatization method to improve OT’s ionization efficiency with the aim to improve the overall sensitivity of detecting and quantifying OT in biological samples.
Results
Method Development
OT was synthesized by manual Fmoc solid phase peptide synthesis (Kremsmayr and Muttenthaler, 2022). The exact concentration and purity of the peptide was determined via RP-HPLC (Supplementary Table S1) and compared against two peptide standards of known concentration.
Analyte Adsorption to HPLC Inserts
Adsorption of the analyte to sample preparation materials (e.g., HPLC inserts) can result in inconsistent and inaccurate measurements (Goebel-Stengel et al., 2011). Addition of organic solvent (e.g., ACN) can prevent this adsorption and improve ionization during MS analysis (Sterner et al., 2000; Gosetti et al., 2010). We therefore prepared OT standards (10 µM) with different ACN concentrations (H2O, 25, 50, 75% ACN) and analyzed them in plastic polypropylene or silanized glass HPLC inserts in three independent experiments every hour for 24 h. An API4000 QTRAP MS instrument tuned to OT and equipped with an Agilent C18 column was used for this study (Supplementary Table S2). The OT MS signal (peak area) was twice as large in glass inserts than in plastic inserts (10 µM OT in H2O/0.1% formic acid, FA) (Figure 1A). The use of ACN as the organic co-solvent enhanced the MS signal for OT 3–4-fold in both plastic and glass inserts, with no significant differences between plastic and glass inserts. The best signal was obtained in 50% ACNaq/0.1% FA, which was selected for the rest of the study.
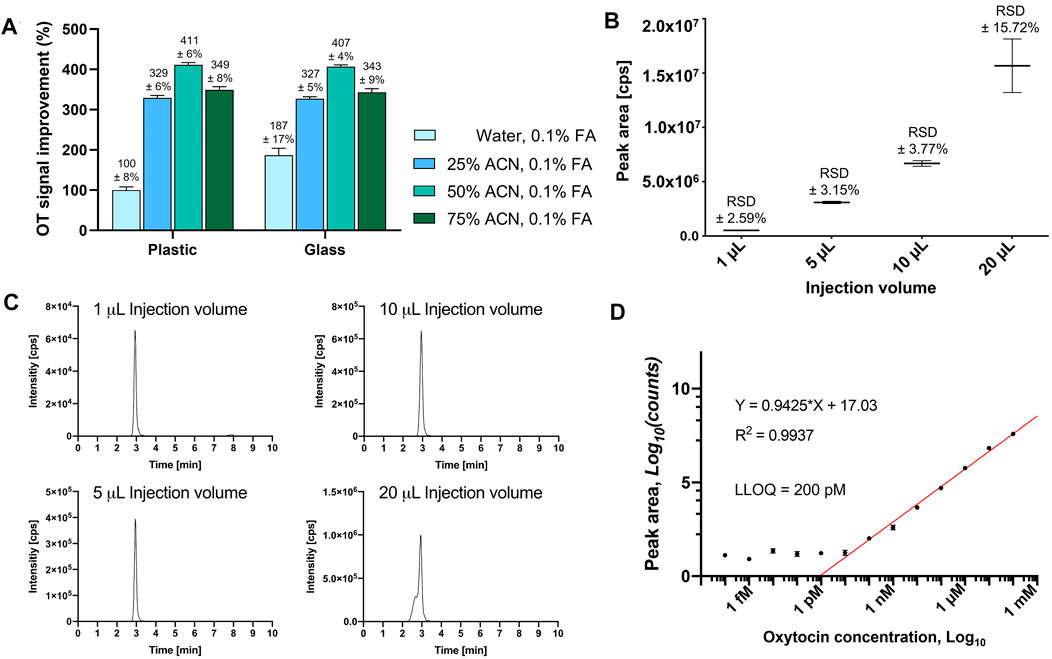
FIGURE 1. Evaluation of HPLC vial adsorption, optimal injection volume and LLOQ of OT on an API4000 QTRAP. (A) OT MS peak area signal improvement of a 10 µM OT solution with different ACN concentrations from either plastic or glass HPLC inserts after 24 h, normalized to the signal of the OT solution in water, 0.1% FA, from a plastic HPLC insert. Results are presented as the mean percentage improvement ±SD; n = 3. (B) Evaluation of different injection volumes (1, 5, 10, and 20 μL) of an OT standard solution (10 μM in 50% ACNaq/0.1% FA). The values are presented as mean ± RSD of four consecutive injections (n = 4). (C) Representative LCMS traces for the injection volumes to visualize peak shapes. (D) OT standard curve to determine LLOQ.
Injection Volume
We evaluated 1, 5, 10, and 20 µL injection volumes of a standard OT solution (10 μM, 50% ACNaq/0.1% FA) by LC-MS/MS (Figure 1B). Injection volumes of 1–10 µL had sharp peaks, high signal-to-noise ratio, and low variability (relative standard deviation (RSD) ± 2.59–3.77%), while injection volumes of 20 µL displayed broader peaks with a shoulder and higher variability (RSD ±15.72%) (Figure 1C). A 10 µL injection volume was therefore used for the rest of this study.
Standard Curve and Lower Limit of Quantitation
The linear range was determined by the maximum number of points that could be included for the R2 coefficient to remain ≥0.9. LLOQ was determined by visual evaluation of the calibration curve (smallest value on the linear range, before the plateau) and should be at least ≥ ×5 of the blank signal (Supplementary Figure S2) (Shrivastava and Gupta, 2011). A dilution series of OT ranging from 0.1 mM to 0.1 fM in 50% ACNaq/0.1% FA was prepared and analyzed on an API4000 QTRAP (Figure 1D). The calibration curve displayed a plateau from 0.1 fM to 100 pM OT and formed a linear range from 1 nM to 0.1 mM (R2 = 0.9971). 200 pM was the lowest value lying on the linear range before the plateau and thus determined as the LLOQ of OT.
Sample Preparation Methods and Parameters
Sample preparation is a critical step to reduce sample matrix interferences that affect the accuracy, precision and robustness of MS analysis (Panuwet et al., 2016). Six different sample preparation protocols (Table 1) were designed and evaluated regarding the matrix effect (MX), peptide recovery (RE), and overall method efficiency (ME) via the pre- and post-spike method (Matuszewski et al., 2003) by spiking serum at three OT concentrations (0.1, 10, and 50 µM) to give a final OT concentration of 4.5 µM, 0.91 µM and 9.09 nM. Briefly, the pre-and post-spike method involves (A) spiking a blank solution (50% ACNaq/0.1% FA) with an OT standard, (B) spiking a serum sample with OT before sample preparation, and (C) spiking a serum sample with OT after sample preparation. Samples were injected (10 µL) into the API4000 QTRAP and peak areas were analyzed. The calculation of the RE, MX, and ME values and the overview of the sample preparation are described in Figure 2.
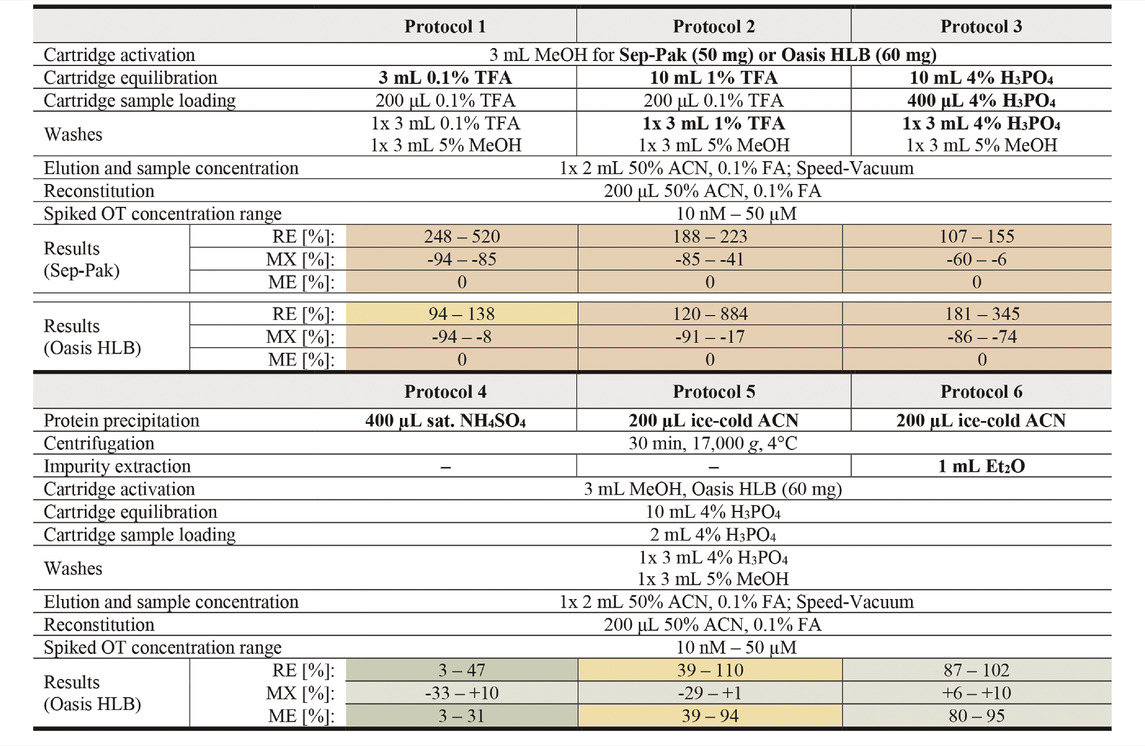
TABLE 1. Overview of tested sample preparation protocols for OT analysis in human serum. Modified protocol parameters are bolded. RE values >115% were set to 0 for ME calculations. Results for protocols are presented qualitatively as a heat map with green, yellow and red representing good, average and poor values respectively. Exact values with errors and cut-off ranges can be found in Supplementary Table S3.
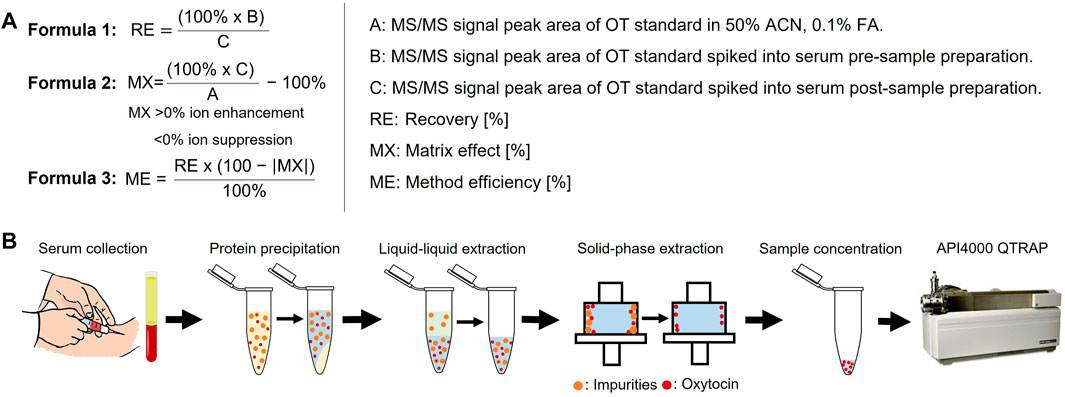
FIGURE 2. Sample preparation flowchart and analysis. (A) Calculation of peptide recovery (RE), matrix effects (MX) and overall method efficiency (ME). RE provides information on the peptide recovery of the sample preparation protocol (from protein precipitation to sample concentration). MX provides information on observed matrix effects, with positive values indicating ion enhancement and negative values indicating ion suppression effects. ME combines RE and MX values to provide comparative information on the overall method efficiency. RE values >115% and MX values >±100% were set to zero for the ME calculation to exclude methods based on false positives. MS/MS signal peak areas are taken as log10 (counts). (B) Overview of the sample preparation steps that were optimized.
With Protocols 1, 2, and 3, we evaluated two acids commonly used for solid phase extraction, namely TFA (trifluoroacetic acid, 0.1 and 1%) and H3PO4 (phosphoric acid, 4%). We evaluated these protocols on two solid phase extraction cartridges, the Sep-Pak (50 mg) and Oasis Hydrophilic-Lipophilic-Balanced (HLB, 60 mg) cartridges (Table 1). A continuous pressure increase on the LC-MS/MS (API4000 QTRAP) was observed during analysis of samples prepared with Sep-Pak cartridges, indicating incomplete sample clean-up and a consequent accumulation of impurities on the HPLC column. Oasis HLB cartridges were therefore selected for the sample preparation step. Of the three protocols tested on Oasis HLB cartridges, Protocol 3 was selected for further method development since the MX values were the most consistent across the measured OT concentrations (Supplementary Table S3).
To improve sample clean-up and reduce matrix effects, an additional sample clean-up step prior to solid phase extraction was introduced. A saturated NH4SO4 solution (Protocol 4) or ice-cold ACN (Protocol 5 and 6) were used to precipitate larger serum proteins, leaving OT in the supernatant (Protocol 4: 1.25 µM–2.5 nM OT in 400 µL NH4SO4 solution; Protocol 5 & 6: 2.5 µM–5 nM OT in 200 µL ACN). The precipitated impurities were centrifuged into a pellet and removed. An additional liquid-liquid extraction step was introduced in Protocol 6 to further remove hydrophobic compounds. In this step, ice-cold diethyl ether (Et2O) was mixed with the supernatant after centrifugation, extracting hydrophobic molecules into the ether phase, leaving OT in the aqueous phase.
Protein precipitation with saturated NH4SO4 (Protocol 4) resulted in low OT recovery (3–47%), possibly due to co-precipitation of OT and serum proteins. Precipitation with cold ACN (Protocol 5) or cold ACN combined with Et2O liquid-liquid extraction (Protocol 6) worked well with OT recoveries in the 39–110% and 87–102% range, respectively. Particularly the ACN precipitation with Et2O liquid-liquid extraction resulted in substantial reduction of matrix effects across all concentration tested (MX <±12%). The resulting ME for Protocols 4, 5 and 6 were 3–31%, 39–94%, and 82–95% across the tested concentrations, and Protocol 6 was therefore selected for further characterization.
Evaluation of Reconstitution Volume of Sample Preparation Protocol
Decreasing the reconstitution volume increases the analyte’s concentration and thereby its detection limits, but this can also lead to more pronounced matrix effects. To determine the RE, MX, and ME of different reconstitution volumes, serum samples were spiked with 50 µM OT via the pre- and post-spike method and prepared using Protocol 6. Samples were reconstituted in four different volumes (40, 60, 80, and 100 μL; 50% ACNaq/0.1% FA) and evaluated compared to the initial reconstitution volume of 200 µL. Changing the reconstitution volume also affects the analyte’s concentration, thus altering the LLOQ of the method. Hence, human serum samples were spiked with OT standards (0.1 pM–1 mM), prepared using Protocol 6, and reconstituted in 40, 60, 80 or 100 μL; 50% ACNaq/0.1% FA). Samples were analyzed in the API4000 QTRAP and a standard curve was determined for each reconstitution volume. While reconstitution volumes of both 60 and 200 µL had good RE, MX, and ME results, a 60 µL reconstitution volume yielded a ∼2-fold improvement in LLOQ as compared to the initially used 200 µL (Supplementary Table S4). 60 µL reconstitution volume was thus chosen for the final protocol (Protocol 6′). RE, MX, and ME of the final Protocol 6′ was determined via the pre- and post-spike method with three OT concentrations (50 , 10 and 0.1 µM). This gave a MX of -16–-10%, 81–87% RE, 71–77% ME and a LLOQ of 86 ± 17 nM in human serum (Supplementary Figure S3, Supplementary Table S5). Protocol 6′ was used for further method validation.
Method Validation: Precision and Accuracy
To determine precision and accuracy of the method, human serum was spiked with OT standard to give final serum OT concentrations of 1.5, 10 and 40 µM. The spiked human serum samples were purified with Protocol 6’ and analyzed. The LCMS peak areas of these samples were compared against the OT standard curve to calculate the expected concentration present in serum (n = 5). Precision is expressed as a percentage of standard deviation from the mean value and accuracy as percentage error from the theoretical concentration. The intraday precision for the quantitation of OT in human serum was 6.4–7.6% and the intraday accuracy was -7.0–15.7% (Supplementary Table S6). The method therefore fulfills largely the FDA acceptance criteria for precision (±15%) and accuracy (±15%) for bioanalytical method validation (except for one intraday accuracy measurement of 15.7%) (Administration, U.F.A.D., 2018).
Improving Sensitivity
To increase the sensitivity of our analytical method, we investigated different MS instruments and strategies to improve OT’s ionization efficiency.
Protocol Evaluation Across Other Mass Spectrometry Instruments
A dilution series of OT (1 fM to 0.1 mM in 50% ACNaq/0.1% FA) was analyzed across four quadrupole time-of-flight flight (QTOF) mass spectrometers (TripleTOF 6600, TripleTOF 5600, ×500R, QstarElite) and two triple quadrupole instruments (API4000 QTRAP, QTRAP6500) (Supplementary Figure S4). The sensitivity of each instrument was determined using the LLOQ of OT (50% ACNaq/0.1% FA). The triple quadrupole mass spectrometers, API4000 QTRAP (LLOQ: 100 ± 12 pM) and QTRAP6500 (LLOQ: 40 ± 3 pM) had greater sensitivity for OT compared to the TOF instruments. The superior sensitivity of triple quadrupoles over QTOF instruments was expected due to their additional quadrupole, allowing them to be tuned to a specific potential for detection of one specific ion. However, it also highlighted that further improvement is necessary before being able to quantitatively measure OT out of complex biological samples. We continued with the method development on the API4000 QTRAP due to limited access to the QTRAP6500.
Improving the Analyte’s Ionization Efficiency Through Derivatization
MS analyte detection sensitivity in ESI-MS can also be enhanced by improving the ionization efficiency of the analyte through modifications of its hydrophobicity and/or charge state (Konermann et al., 2013). During ionization in ESI-MS, hydrophobic analytes tend to sit on the outside of the ionization droplet, resulting in easier and more efficient ionization. Analytes with high proton affinity (e.g., Arg-containing peptides) also increase signal intensity in ESI-MS due to formation of pre-charged species.
We investigated two strategies: 1) addition of either charged or hydrophobic amino acids, and 2) addition of positively charged small molecule moieties. The API4000 QTRAP was tuned for the detection of the new peptide analogues and a calibration curve in water was prepared for each (Table 2). Removing the stabilizing disulfide bond on OT might also improve ionization; we therefore assessed the oxidized and reduced form of the new analogues. The hydrophobicity and charge of each analogue, oxidized and reduced, was compared against that of native OT (Table 2).
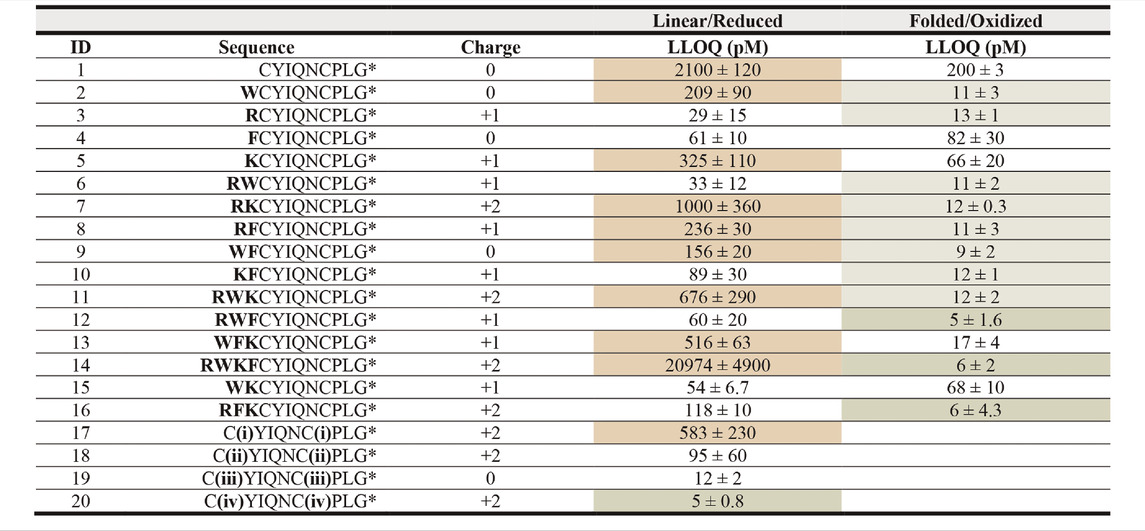
TABLE 2. LLOQ values of OT analogues in 50% ACNaq/0.1% FA. A dilution series of each peptide ranging from 1 fM to 1 mM in 50% ACNaq/0.1% FA was measured (n = 3) on the API4000 QTRAP. LLOQ was determined by visual examination of the calibration curve and ensuring the signal was ≥5x the blank. LLOQ values < 20 pM (more sensitive than OT) are highlighted in green, >200 pM in red, values between 20 and 200 pM in grey and the four sequences with the lowest LLOQ values in a darker shade of green. (i) 4-bromo-N,N,N-triethylbutan-1-amminium, (ii) 3-(4-bromobutyl)-1-butyl-1H-imidazol-3-ium, (iii) iodoacetamide, (iv) 1-(4-bromobutyl)-4-methylpyridin-1-ium, * indicates C-terminal amide.
In the first strategy, Arg, Lys, Trp, and Phe were added in different combinations to the N-terminus of reduced and folded/oxidized OT (Table 2, compounds 1–16). The addition of single amino acids Arg, Lys, Trp and Phe yielded improved sensitivity (LLOQ of 13, 66, 11, and 82 pM respectively) compared to unmodified OT (200 pM); oxidized analogues generally yielded better sensitivity (Figure 3C). In particular, the Arg analogue (R-OT 3, 13 pM) and Trp analogue (W-OT 2, 11 pM) improved LLOQ in ESI-MS by 13–15-fold.
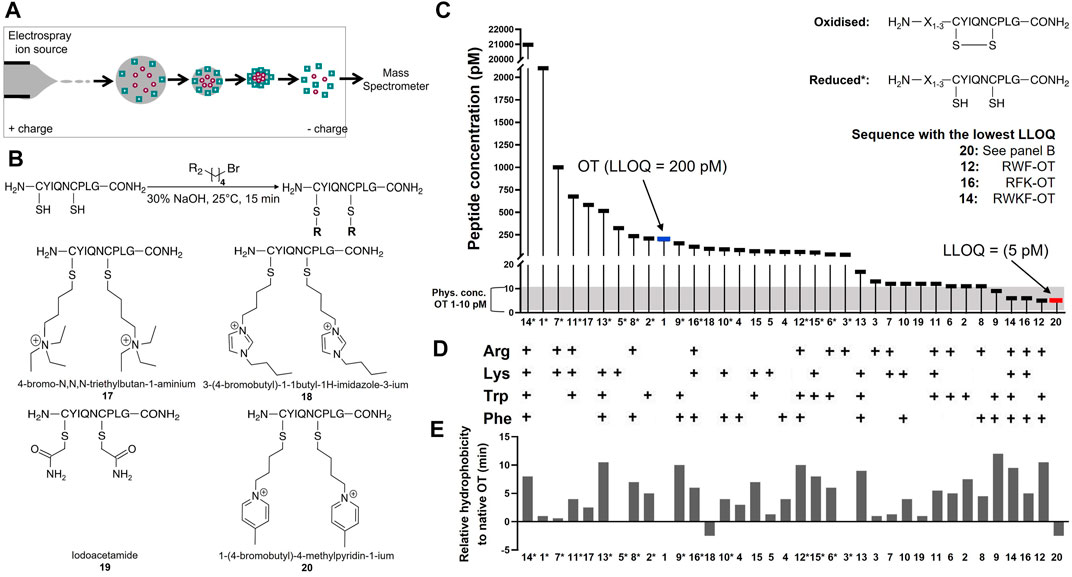
FIGURE 3. Improving MS sensitivity by modifying OT’s hydrophobicity and charge state. (A) Analytes form spherical droplets upon electrospray ionization in an ESI-MS. Hydrophilic analytes tend to remain more in the center of the ionization droplets, resulting in less efficient ionization compared to more hydrophobic analytes that tend to remain on the surface of the droplets. (B) Derivatization of OT with positively charged small molecule moieties. (C) LLOQs of synthesized and derivatized OT analogues. *Indicates reduced peptides. (D) Presence of amino acids Arg, Lys, Trp, and Phe in studied OT analogues. (E) Relative hydrophobicity on a C18-RP HPLC column compared to OT. Values > 0 indicate more hydrophobic peptides (longer retention time), while <0 indicate more hydrophilic peptides (shorter retention time) than OT.
Addition of two amino acids to OT allowed the study of combinations of charged (Arg and Lys) and hydrophobic (Trp and Phe) amino acids. The addition of two charged or two hydrophobic residues did however not necessarily result in lower LLOQs than OT derivatives with a single residue addition. For example, WK-OT 15 (68 pM) had a relatively high LLOQ, and RK-OT 7 (12 pM) had a LLOQ similar to W-OT 2 (11 pM) and R-OT 3 (13 pM). In line with the results of the single residue derivatives, the combination of a charged amino acid (Arg/Lys) with a hydrophobic (Trp/Phe) improved the LLOQ in oxidized analogues but less so in reduced analogues. Overall, the addition of two amino acids improved the LLOQ by 13–16-fold for the oxidized analogues, with WF-OT 9 (9 pM) having the best sensitivity. These improvements were similar to the improvements of single amino acid derivatives, i.e., R-OT 3 (13 pM) and W-OT 2 (11 pM).
The addition of three amino acids allowed us to combine a charged residue with two hydrophobic residues and vice versa. The trend of the oxidized forms having better sensitivity than their reduced counterparts continued with these derivatives. Two of the best performing analogues, were RWF-OT 12 (5 pM) and RFK-OT 16 (6 pM). The addition of all four amino acids, RWKF-OT 14 (6 pM), resulted in a more hydrophobic peptide than native OT 1 (100 pM). From all analogues tested, the modifications RWF-OT 12 (5 pM), RFK-OT 16 (6 pM) and RWKF-OT 14 (6 pM) had the biggest impact on sensitivity, resulting in 20–25-fold improvement compared to the LLOQ of OT. Also, R-OT 3 (13 pM) and W-OT 2 (11 pM) should be mentioned since they are in a similar LLOQ range through the N-terminal addition of just a single amino acid.
For the second strategy, three small molecules, 2-bromo-N, N, N,-triethylethan-1-aminium (quaternary ammonium ion), 3-(4-bromobutyl)-1-butyl-1H-imidazol-3-ium (imidazolium ion) and 1-(4-bromobtyl)-4-methylpyridin-1-ium (pyridinium ion) were synthesized (Figure 3B) and used to derivatize the free Cys thiol groups of reduced OT (Figure 3B; ID 17–20) Iodoacetamide was also added to the free Cys thiol of reduced OT as another analogue. The LLOQ for the resulting OT analogues alkylated by (i) 4-bromo-N, N, N,-triethylbutan-1-aminium, (ii) 3-(4-bromobutyl)-1-butyl-1H-imidazol-3-ium, (iii) iodoacetamide and (iv) 1-(4-bromobutyl)-4-methylpyridin-1-ium were 583, 95, 12 and 5 pM respectively. The LLOQ of [1-(4-bromobutyl)-4-methylpyridin-1-ium)2-OT (20) was 25-fold lower than the LLOQ of OT and was also the lowest LLOQ of all modified peptides. It was thus chosen for further evaluation in human serum.
To determine the LLOQ of [1-(4-bromobutyl)-4-methylpyridin-1-ium]2-OT 20 in human serum, a dilution series of peptide 20 was prepared in 50% ACNaq/0.1% FA ranging from 1 mM–1 fM. Sample preparation was performed according to Protocol 6′ and samples were analyzed on the API4000 QTRAP. The LLOQ was determined by spiking 100 µL human serum samples with 10 µL peptide 20 standards (1 mM–1 fM). This yielded an LLOQ of 2 nM, representing a 43-fold improvement compared to human serum samples spiked with OT (LLOQ 86 nM).
Discussion
A MS method that can reliably monitor endogenous peptide hormone levels in human blood would enable a wide range of studies including fundamental (patho) physiological state studies as well as biomarker studies for clinical trials measuring treatment response or identifying patients with abnormal endogenous peptide levels. In the process of developing such a method, we focused on OT as it is one of the most studied neuropeptide/peptide hormone (including hundreds of clinical trials) due to its high relevance in social behavior and reproductive functions and its involvement in disorders such as autisms spectrum disorders, schizophrenia, anxiety and depression (Feifel et al., 2010; Alvares et al., 2017; Ooi et al., 2017). MS has the advantage that it identifies and quantifies analytes by their mass, therefore removing the possibility of detecting metabolites or similar recognition motifs, as it is often the case with immunoassays (McCullough et al., 2013). However, measuring low peptide concentrations in biological samples by MS remains challenging, with several contradicting results regarding the endogenous concentration of OT in blood (Zhang et al., 2011; Brandtzaeg et al., 2016), likely due to uncharacterized matrix effects.
In this work, we highlight the importance of sample preparation for OT analysis and investigated several strategies to improve the quantitation of OT in human serum by MS. This resulted in a robust sample preparation protocol and the introduction of novel derivatization strategies to improve the ionization efficiency of the analyte and thereby the LLOQ towards physiological levels of OT.
Our optimized sample preparation Protocol 6′ (Table 3) displayed good peptide recovery (81–87%), low matrix effects (±16%) and excellent overall method efficiency (71–77%) in human serum OT quantitation using the pre- and post-spike method (50 , 10 and 0.1 µM). Method precision (6.4–7.6%) and accuracy (−7.0–15.7%) were within or close to FDA guidelines (±15%). The optimized sample preparation includes an organic solvent (ice-cold ACN) protein precipitation step, followed by a liquid-liquid extraction with Et2O step and solid-phase extraction on an Oasis HLB column (60 mg), before injection into an ESI-MS instrument. The advantage of this protocol lies in its simplicity and ability to provide consistent results over the observed OT concentration range (pM–µM). The protocol was developed on a common MS instrument (API4000 QTRAP) available in many laboratories, and the LLOQ can be pushed further with more sensitive instruments (Supplementary Figure S4), indicating that it is just a matter of time until we will have reached the threshold of reliable quantifying endogenous OT and other peptide hormone levels in blood or other biological samples (e.g., urine, cerebrospinal fluid).
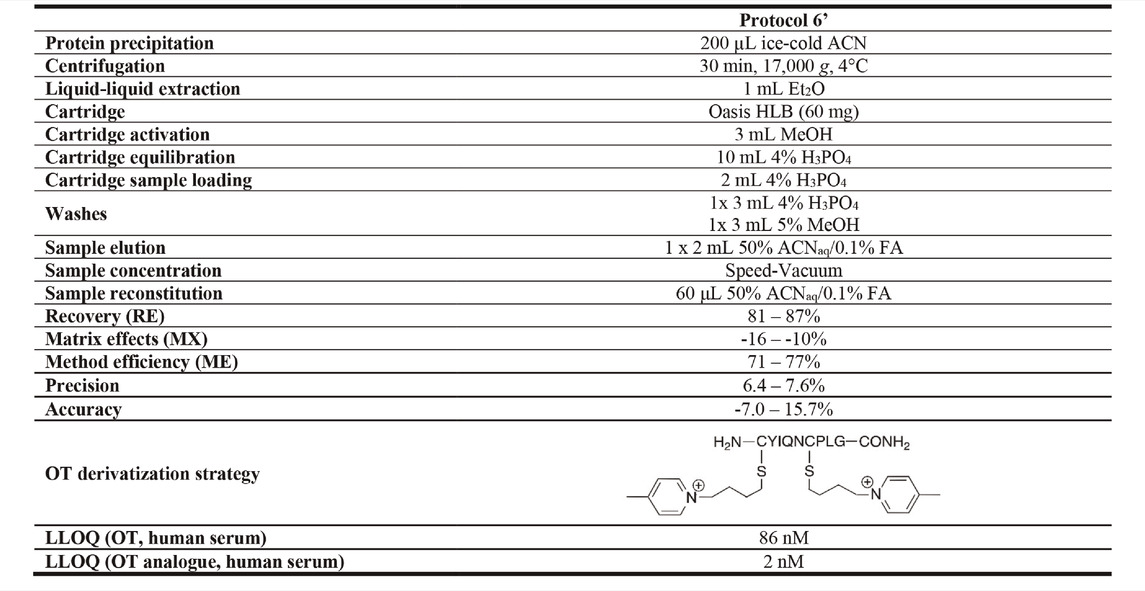
TABLE 3. Optimized sample preparation Protocol 6’. RE, MX, and ME for optimized Protocol 6’ were evaluated in human serum via the pre- and post-spike method (50 μM, 10 µM, 0.1 µM). Precision and accuracy were determined by spiking samples with 40, 10 and 1.5 µM OT. The OT analogue derivatized with 1-(4-bromobutyl)-4-methylpyridin-1-ium had the lowest LLOQ when evaluated in human serum.
Since the optimized sample preparation method per se was not able to provide a low enough LLOQ for the quantitation of endogenous OT in human serum, we explored an OT derivatization strategy that resulted in another ∼40-fold improvement of the LLOQ from 86 to 2 nM in human serum. The derivatization strategies are based on the hypothesis that sensitivity is affected by the analyte’s ionization efficiency, which is directly linked to its physicochemical properties such as charge and hydrophobicity (Wahl et al., 1993; Page et al., 2007). However, no direct correlation between sensitivity and retention time nor overall charge was observed. However, there was a clear trend between oxidized vs. reduced OT analogues, with oxidized analogues yielding better sensitivity. A likely explanation for this is that the thiol groups of the reduced peptide interact with water molecules through hydrogen bonding leading to the formation of a hydration shell around the peptide. Higher energy is then needed to evaporate the solvent and hydration shell, resulting in poorer ionization and sensitivity.
Given the trajectory of technological development in the MS space, we will continue to see substantial advances pushing the limits of sensitivity and quantitation, as already seen with the more sensitive QTRAP6500. The ability to detect specific masses by MS provides a clear advantage over the commonly used immunoassays that are often prone to specificity issues and false positives. Additionally, MS has a huge potential for further advancements, making it the technique of choice for future bioanalytical studies.
In conclusion, we have achieved the development of an optimized sample preparation protocol and introduced and evaluated new and promising derivatization strategies to improve the sensitivity of detecting OT in biological samples. This provides a solid foundation for a standardized and accessible MS method to quantitate OT levels in biological samples, valuable for OT biomarker studies supporting fundamental research, patient blood screens, treatment monitoring and clinical trials.
Data Availability Statement
The original contributions presented in the study are included in the article/Supplementary Material, further inquiries can be directed to the corresponding author.
Author Contributions
AH designed and synthesized OT and OT analogues. AH and BJ designed and performed the experiments. AJ advised on experiment design. MM conceived and supervised the project. The manuscript was drafted by BJ and AH. BJ, AJ, and MM reviewed and edited the manuscript. All authors have read and agreed to the published version of the manuscript.
Funding
This research was supported by the European Research Council under the European Union’s Horizon 2020 research and innovation program (grant agreements no. 714366), by the Austrian Science Fund FWF (TAI 382-B), by Cancer Australia and Cancer Council Queensland (1146504) and by the Australian Research Council (DP190101667, FT210100266).
Conflict of Interest
The authors declare that the research was conducted in the absence of any commercial or financial relationships that could be construed as a potential conflict of interest.
Publisher’s Note
All claims expressed in this article are solely those of the authors and do not necessarily represent those of their affiliated organizations, or those of the publisher, the editors and the reviewers. Any product that may be evaluated in this article, or claim that may be made by its manufacturer, is not guaranteed or endorsed by the publisher.
Acknowledgments
We thank Aaron Poth for his advice on the pre- and post-spike methods, instrument tuning and standard curve design.
Supplementary Material
The Supplementary Material for this article can be found online at: https://www.frontiersin.org/articles/10.3389/fchem.2022.889154/full#supplementary-material
Abbreviations
ACN, Acetonitrile; HLB, Hydrophobic-lipophilic-balanced; HPLC, High-performance liquid chromatography; LCMS, Liquid chromatography-mass spectrometry; LC-MS/MS, Liquid chromatography-tandem mass spectrometry; LLOQ, Lower limit of quantitation; ME, Method efficiency; MX, Matrix effects; OT, Oxytocin; RE, Recovery.
References
Administration, U.F.A.D. (2018). Bioanalytical Method Validation Guidance for Industry. Rockville, MD: Food and Drug Administration.
Alvares, G. A., Quintana, D. S., and Whitehouse, A. J. O. (2017). Beyond the Hype and Hope: Critical Considerations for Intranasal Oxytocin Research in Autism Spectrum Disorder. Autism Res. 10, 25–41. doi:10.1002/aur.1692
Ariana, M., Pornour, M., Mehr, S. S., Vaseghi, H., Ganji, S. M., Alivand, M. R., et al. (2018). Preventive Effects of Oxytocin and Oxytocin Receptor in Breast Cancer Pathogenesis. Per Med. 16, 25–34. doi:10.2217/pme-2018-0009
Bąchor, R., Mielczarek, P., Rudowska, M., Silberring, J., and Szewczuk, Z. (2014). Sensitive Detection of Charge Derivatized Peptides at the Attomole Level Using Nano-LC-ESI–MRM Analysis. Int. J. Mass Spectrom. 362, 32–38. doi:10.1016/j.ijms.2014.02.018
Bartholomeusz, C. F., Ganella, E. P., Labuschagne, I., Bousman, C., and Pantelis, C. (2015). Effects of Oxytocin and Genetic Variants on Brain and Behaviour: Implications for Treatment in Schizophrenia. Schizophrenia Res. 168, 614–627. doi:10.1016/j.schres.2015.06.007
Bell, C. J., Nicholson, H., Mulder, R. T., Luty, S. E., and Joyce, P. R. (2006). Plasma Oxytocin Levels in Depression and Their Correlation with the Temperament Dimension of Reward Dependence. J. Psychopharmacol. 20, 656–660. doi:10.1177/0269881106060512
Bradley, E. R., and Woolley, J. D. (2017). Oxytocin Effects in Schizophrenia: Reconciling Mixed Findings and Moving Forward. Neurosci. Biobehav. Rev. 80, 36–56. doi:10.1016/j.neubiorev.2017.05.007
Brandtzaeg, O. K., Johnsen, E., Roberg-Larsen, H., Seip, K. F., Maclean, E. L., Gesquiere, L. R., et al. (2016). Proteomics Tools Reveal Startlingly High Amounts of Oxytocin in Plasma and Serum. Sci. Rep. 6, 31693. doi:10.1038/srep31693
Christensen, J. C., Shiyanov, P. A., Estepp, J. R., and Schlager, J. J. (2014). Lack of Association between Human Plasma Oxytocin and Interpersonal Trust in a Prisoner's Dilemma Paradigm. PLoS One 9, e116172. doi:10.1371/journal.pone.0116172
Cyranowski, J. M., Hofkens, T. L., Frank, E., Seltman, H., Cai, H.-M., and Amico, J. A. (2008). Evidence of Dysregulated Peripheral Oxytocin Release Among Depressed Women. Psychosom. Med. 70, 967–975. doi:10.1097/psy.0b013e318188ade4
Dams, R., Huestis, M. A., Lambert, W. E., and Murphy, C. M. (2003). Matrix Effect in Bio-Analysis of Illicit Drugs with LC-MS/MS: Influence of Ionization Type, Sample Preparation, and Biofluid. J. Am. Soc. Mass Spectrom. 14, 1290–1294. doi:10.1016/s1044-0305(03)00574-9
Erickson, E. N., Carter, C. S., and Emeis, C. L. (2020). Oxytocin, Vasopressin and Prolactin in New Breastfeeding Mothers: Relationship to Clinical Characteristics and Infant Weight Loss. J. Hum. Lact. 36, 136–145. doi:10.1177/0890334419838225
Feifel, D., Macdonald, K., Nguyen, A., Cobb, P., Warlan, H., Galangue, B., et al. (2010). Adjunctive Intranasal Oxytocin Reduces Symptoms in Schizophrenia Patients. Biol. Psychiatry 68, 678–680. doi:10.1016/j.biopsych.2010.04.039
Feifel, D., Shilling, P. D., and Macdonald, K. (2016). A Review of Oxytocin's Effects on the Positive, Negative, and Cognitive Domains of Schizophrenia. Biol. Psychiatry 79, 222–233. doi:10.1016/j.biopsych.2015.07.025
Franke, A. A., Li, X., Menden, A., Lee, M. R., and Lai, J. F. (2019). Oxytocin Analysis from Human Serum, Urine, and Saliva by Orbitrap Liquid Chromatography-Mass Spectrometry. Drug Test. Anal. 11, 119–128. doi:10.1002/dta.2475
Garrido-Urbani, S., Deblon, N., Poher, A. L., Caillon, A., Ropraz, P., Rohner-Jeanrenaud, F., et al. (2018). Inhibitory Role of Oxytocin on TNFα Expression Assessed In Vitro and In Vivo. Diabetes & Metabolism 44, 292–295. doi:10.1016/j.diabet.2017.10.004
Gimpl, G., and Fahrenholz, F. (2001). The Oxytocin Receptor System: Structure, Function, and Regulation. Physiol. Rev. 81, 629–683. doi:10.1152/physrev.2001.81.2.629
Glovinsky, D., Kalogeras, K., Kirch, D., Suddath, R., and Wyatt, R. (1994). Cerebrospinal Fluid Oxytocin Concentration in Schizophrenic Patients Does Not Differ from Control Subjects and Is Not Changed by Neuroleptic Medication. Schizophrenia Res. 11, 273–276. doi:10.1016/0920-9964(94)90021-3
Goebel-Stengel, M., Stengel, A., Taché, Y., and Reeve, J. R. (2011). The Importance of Using the Optimal Plasticware and Glassware in Studies Involving Peptides. Anal. Biochem. 414, 38–46. doi:10.1016/j.ab.2011.02.009
Goldman, M., Marlow-O'Connor, M., Torres, I., and Carter, C. S. (2008). Diminished Plasma Oxytocin in Schizophrenic Patients with Neuroendocrine Dysfunction and Emotional Deficits. Schizophrenia Res. 98, 247–255. doi:10.1016/j.schres.2007.09.019
Gosetti, F., Mazzucco, E., Zampieri, D., and Gennaro, M. C. (2010). Signal Suppression/enhancement in High-Performance Liquid Chromatography Tandem Mass Spectrometry. J. Chromatogr. A 1217, 3929–3937. doi:10.1016/j.chroma.2009.11.060
Green, L., Fein, D., Modahl, C., Feinstein, C., Waterhouse, L., and Morris, M. (2001). Oxytocin and Autistic Disorder: Alterations in Peptide Forms. Biol. Psychiatry 50, 609–613. doi:10.1016/s0006-3223(01)01139-8
Guastella, A. J., Einfeld, S. L., Gray, K. M., Rinehart, N. J., Tonge, B. J., Lambert, T. J., et al. (2010). Intranasal Oxytocin Improves Emotion Recognition for Youth with Autism Spectrum Disorders. Biol. Psychiatry 67, 692–694. doi:10.1016/j.biopsych.2009.09.020
Heinrichs, M., Von Dawans, B., and Domes, G. (2009). Oxytocin, Vasopressin, and Human Social Behavior. Front. Neuroendocrinol. 30, 548–557. doi:10.1016/j.yfrne.2009.05.005
Hib, J. (1977). The 'In Vivo' Effects of Oxytocin and Vasopressin on Spontaneous Contractility of the Rat Epididymis. Int. J. Fertil. 22, 63–64.
Hib, J. (1974a). The Contractility of the Cauda Epididymidis of the Mouse, its Spontaneous Activity In Vitro and the Effects of Oxytocin. Reproduction 36, 191–193. doi:10.1530/jrf.0.0360191
Hib, J. (1974b). The In Vitro Effects of Oxytocin and Vasopressin on Spontaneous Contractility of the Mouse Cauda Epididymidis. Biol. Reprod. 11, 436–439. doi:10.1095/biolreprod11.4.436
Jansen, L. M. C., Gispen-De Wied, C. C., Wiegant, V. M., Westenberg, H. G. M., Lahuis, B. E., and Van Engeland, H. (2006). Autonomic and Neuroendocrine Responses to a Psychosocial Stressor in Adults with Autistic Spectrum Disorder. J. Autism Dev. Disord. 36, 891–899. doi:10.1007/s10803-006-0124-z
Jovanovic, P., Spasojevic, N., Puskas, N., Stefanovic, B., and Dronjak, S. (2019). Oxytocin Modulates the Expression of Norepinephrine Transporter, β3-adrenoceptors and Muscarinic M2 Receptors in the Hearts of Socially Isolated Rats. Peptides 111, 132–141. doi:10.1016/j.peptides.2018.06.008
Jurek, B., and Neumann, I. D. (2018). The Oxytocin Receptor: From Intracellular Signaling to Behavior. Physiol. Rev. 98, 1805–1908. doi:10.1152/physrev.00031.2017
Kagerbauer, S. M., Martin, J., Schuster, T., Blobner, M., Kochs, E. F., and Landgraf, R. (2013). Plasma Oxytocin and Vasopressin Do Not Predict Neuropeptide Concentrations in Human Cerebrospinal Fluid. J. Neuroendocrinol. 25, 668–673. doi:10.1111/jne.12038
Kebarle, P., and Tang, L. (1993). From Ions in Solution to Ions in the Gas Phase - the Mechanism of Electrospray Mass Spectrometry. Anal. Chem. 65, 972A–986A. doi:10.1021/ac00070a001
Kéri, S., Kiss, I., and Kelemen, O. (2009). Sharing Secrets: Oxytocin and Trust in Schizophrenia. Soc. Neurosci. 4, 287–293. doi:10.1080/17470910802319710
Khori, V., Alizadeh, A. M., Khalighfard, S., Heidarian, Y., and Khodayari, H. (2018). Oxytocin Effects on the Inhibition of the NF-κB/miR195 Pathway in Mice Breast Cancer. Peptides 107, 54–60. doi:10.1016/j.peptides.2018.07.007
Konermann, L., Ahadi, E., Rodriguez, A. D., and Vahidi, S. (2013). Unraveling the Mechanism of Electrospray Ionization. Anal. Chem. 85, 2–9. doi:10.1021/ac302789c
Kramer, K. M., Cushing, B. S., Carter, C. S., Wu, J., and Ottinger, M. A. (2004). Sex and Species Differences in Plasma Oxytocin Using an Enzyme Immunoassay. Can. J. Zool. 82, 1194–1200. doi:10.1139/z04-098
Kremsmayr, T., and Muttenthaler, M. (2022). Fmoc Solid Phase Peptide Synthesis of Oxytocin and Analogues. Methods Mol. Biol. 2384, 175–199. doi:10.1007/978-1-0716-1759-5_11
Lefevre, A., Mottolese, R., Dirheimer, M., Mottolese, C., Duhamel, J.-R., and Sirigu, A. (2017). A Comparison of Methods to Measure Central and Peripheral Oxytocin Concentrations in Human and Non-human Primates. Sci. Rep. 7, 17222. doi:10.1038/s41598-017-17674-7
Leng, G., and Sabatier, N. (2016). Measuring Oxytocin and Vasopressin: Bioassays, Immunoassays and Random Numbers. J. Neuroendocrinol. 28 (10). doi:10.1111/jne.12413
Leng, G., Meddle, S., and Douglas, A. (2008). Oxytocin and the Maternal Brain. Curr. Opin. Pharmacol. 8, 731–734. doi:10.1016/j.coph.2008.07.001
Liu, D., Han, X., Liu, X., Cheng, M., He, M., Rainer, G., et al. (2019). Measurement of Ultra-trace Level of Intact Oxytocin in Plasma Using SALLE Combined with Nano-LC-MS. J. Pharm. Biomed. Analysis 173, 62–67. doi:10.1016/j.jpba.2019.04.023
Liu, H., Gruber, C. W., Alewood, P. F., Möller, A., and Muttenthaler, M. (2020). The Oxytocin Receptor Signalling System and Breast Cancer: a Critical Review. Oncogene 39, 5917–5932. doi:10.1038/s41388-020-01415-8
Matuszewski, B. K., Constanzer, M. L., and Chavez-Eng, C. M. (2003). Strategies for the Assessment of Matrix Effect in Quantitative Bioanalytical Methods Based on HPLC−MS/MS. Anal. Chem. 75, 3019–3030. doi:10.1021/ac020361s
Mccullough, M. E., Churchland, P. S., and Mendez, A. J. (2013). Problems with Measuring Peripheral Oxytocin: Can the Data on Oxytocin and Human Behavior Be Trusted? Neurosci. Biobehav. Rev. 37, 1485–1492. doi:10.1016/j.neubiorev.2013.04.018
Mcneilly, A. S., Robinson, I. C., Houston, M. J., and Howie, P. W. (1983). Release of Oxytocin and Prolactin in Response to Suckling. Bmj 286, 257–259. doi:10.1136/bmj.286.6361.257
Mei, H., Hsieh, Y., Nardo, C., Xu, X., Wang, S., Ng, K., et al. (2003). Investigation of Matrix Effects in Bioanalytical High-Performance Liquid Chromatography/tandem Mass Spectrometric Assays: Application to Drug Discovery. Rapid Commun. Mass Spectrom. 17, 97–103. doi:10.1002/rcm.876
Merz, T., Denoix, N., Wigger, D., Waller, C., Wepler, M., Vettorazzi, S., et al. (2020). The Role of Glucocorticoid Receptor and Oxytocin Receptor in the Septic Heart in a Clinically Relevant, Resuscitated Porcine Model with Underlying Atherosclerosis. Front. Endocrinol. 11, 299. doi:10.3389/fendo.2020.00299
Meusel, M., Herrmann, M., Machleidt, F., Franzen, K., Vonthein, R., and Sayk, F. (2021). Intranasal Oxytocin Has Sympathoexcitatory Effects on Vascular Tone in Healthy Males. Am. J. Physiology-Regulatory, Integr. Comp. Physiology 320, R162–R172. doi:10.1152/ajpregu.00062.2020
Miller, M., Bales, K. L., Taylor, S. L., Yoon, J., Hostetler, C. M., Carter, C. S., et al. (2013). Oxytocin and Vasopressin in Children and Adolescents with Autism Spectrum Disorders: Sex Differences and Associations with Symptoms. Autism Res. 6, 91–102. doi:10.1002/aur.1270
Nishimori, K., Young, L. J., Guo, Q., Wang, Z., Insel, T. R., and Matzuk, M. M. (1996). Oxytocin Is Required for Nursing but Is Not Essential for Parturition or Reproductive Behavior. Proc. Natl. Acad. Sci. U.S.A. 93, 11699–11704. doi:10.1073/pnas.93.21.11699
Ooi, Y. P., Weng, S. J., Kossowsky, J., Gerger, H., and Sung, M. (2017). Oxytocin and Autism Spectrum Disorders: A Systematic Review and Meta-Analysis of Randomized Controlled Trials. Pharmacopsychiatry 50, 5–13. doi:10.1055/s-0042-109400
Ozsoy, S., Esel, E., and Kula, M. (2009). Serum Oxytocin Levels in Patients with Depression and the Effects of Gender and Antidepressant Treatment. Psychiatry Res. 169, 249–252. doi:10.1016/j.psychres.2008.06.034
Page, J. S., Kelly, R. T., Tang, K., and Smith, R. D. (2007). Ionization and Transmission Efficiency in an Electrospray Ionization-Mass Spectrometry Interface. J. Am. Soc. Mass Spectrom. 18, 1582–1590. doi:10.1016/j.jasms.2007.05.018
Panuwet, P., Hunter, R. E., D'Souza, P. E., Chen, X., Radford, S. A., Cohen, J. R., et al. (2016). Biological Matrix Effects in Quantitative Tandem Mass Spectrometry-Based Analytical Methods: Advancing Biomonitoring. Crit. Rev. Anal. Chem. 46, 93–105. doi:10.1080/10408347.2014.980775
Pfister, O., Mouquet, F., Jain, M., Summer, R., Helmes, M., Fine, A., et al. (2005). CD31 − but Not CD31 + Cardiac Side Population Cells Exhibit Functional Cardiomyogenic Differentiation. Circulation Res. 97, 52–61. doi:10.1161/01.res.0000173297.53793.fa
Qiao, X., Wang, R., Yan, H., Wang, T., Zhao, Q., Zhang, L., et al. (2014). Development of a Novel Imidazolium-Based Aromatic Quaternary Ammonium Tag: Synthesis and Application to the Efficient Analysis of Cysteinyl-Peptides by Mass Spectrometry. Rapid Commun. Mass Spectrom. 28, 256–264. doi:10.1002/rcm.6785
Qiao, X., Yang, Y., Liu, S., Chen, S., Wang, X., Li, G., et al. (2015). Novel Pyridinium-Based Tags: Synthesis and Characterization for Highly Efficient Analysis of Thiol-Containing Peptides by Mass Spectrometry. Analyst 140, 407–413. doi:10.1039/c4an01802h
Rasie Abdullahi, P., Eskandarian, S., Ghanbari, A., and Rashidy-Pour, A. (2018). Oxytocin Receptor Antagonist Atosiban Impairs Consolidation, but Not Reconsolidation of Contextual Fear Memory in Rats. Brain Res. 1695, 31–36. doi:10.1016/j.brainres.2018.05.034
Robinson, K. J., Hazon, N., Lonergan, M., and Pomeroy, P. P. (2014). Validation of an Enzyme-Linked Immunoassay (ELISA) for Plasma Oxytocin in a Novel Mammal Species Reveals Potential Errors Induced by Sampling Procedure. J. Neurosci. Methods 226, 73–79. doi:10.1016/j.jneumeth.2014.01.019
Salighedar, R., Erfanparast, A., Tamaddonfard, E., and Soltanalinejad, F. (2019). Medial Prefrontal Cortex Oxytocin-Opioid Receptors Interaction in Spatial Memory Processing in Rats. Physiology Behav. 209, 112599. doi:10.1016/j.physbeh.2019.112599
Saxbe, D., Khaled, M., Horton, K. T., and Mendez, A. J. (2019). Maternal Prenatal Plasma Oxytocin Is Positively Associated with Prenatal Psychological Symptoms, but Method of Immunoassay Extraction May Affect Results. Biol. Psychol. 147, 107718. doi:10.1016/j.biopsycho.2019.107718
Shrivastava, A., and Gupta, V. (2011). Methods for the Determination of Limit of Detection and Limit of Quantitation of the Analytical Methods. Chron. Young Sci. 2, 21–25. doi:10.4103/2229-5186.79345
Sterner, J. L., Johnston, M. V., Nicol, G. R., and Ridge, D. P. (2000). Signal Suppression in Electrospray Ionization Fourier Transform Mass Spectrometry of Multi-Component Samples. J. Mass Spectrom. 35, 385–391. doi:10.1002/(sici)1096-9888(200003)35:3<385:aid-jms947>3.0.co;2-o
Strauss, G. P., Keller, W. R., Koenig, J. I., Gold, J. M., Ossenfort, K. L., and Buchanan, R. W. (2015). Plasma Oxytocin Levels Predict Olfactory Identification and Negative Symptoms in Individuals with Schizophrenia. Schizophrenia Res. 162, 57–61. doi:10.1016/j.schres.2014.12.023
Szeto, A., Cecati, M., Ahmed, R., Mccabe, P. M., and Mendez, A. J. (2020). Oxytocin Reduces Adipose Tissue Inflammation in Obese Mice. Lipids Health Dis. 19, 188–211. doi:10.1186/s12944-020-01364-x
Szeto, A., Mccabe, P. M., Nation, D. A., Tabak, B. A., Rossetti, M. A., Mccullough, M. E., et al. (2011). Evaluation of Enzyme Immunoassay and Radioimmunoassay Methods for the Measurement of Plasma Oxytocin. Psychosom. Med. 73, 393–400. doi:10.1097/psy.0b013e31821df0c2
Tang, Y., Shi, Y., Gao, Y., Xu, X., Han, T., Li, J., et al. (2019). Oxytocin System Alleviates Intestinal Inflammation by Regulating Macrophages Polarization in Experimental Colitis. Clin. Sci. 133, 1977–1992. doi:10.1042/cs20190756
Wahl, J. H., Goodlett, D. R., Udseth, H. R., and Smith, R. D. (1993). Use of Small-Diameter Capillaries for Increasing Peptide and Protein Detection Sensitivity in Capillary Electrophoresis-Mass Spectrometry. Electrophoresis 14, 448–457. doi:10.1002/elps.1150140170
Waliczek, M., Kijewska, M., Rudowska, M., Setner, B., Stefanowicz, P., and Szewczuk, Z. (2016). Peptides Labeled with Pyridinium Salts for Sensitive Detection and Sequencing by Electrospray Tandem Mass Spectrometry. Sci. Rep. 6, 37720. doi:10.1038/srep37720
Welch, M. G., Margolis, K. G., Li, Z., and Gershon, M. D. (2014). Oxytocin Regulates Gastrointestinal Motility, Inflammation, Macromolecular Permeability, and Mucosal Maintenance in Mice. Am. J. Physiology-Gastrointestinal Liver Physiology 307, G848–G862. doi:10.1152/ajpgi.00176.2014
Welch, M. G., Tamir, H., Gross, K. J., Chen, J., Anwar, M., and Gershon, M. D. (2009). Expression and Developmental Regulation of Oxytocin (OT) and Oxytocin Receptors (OTR) in the Enteric Nervous System (ENS) and Intestinal Epithelium. J. Comp. Neurol. 512, 256–270. doi:10.1002/cne.21872
Yuan, J., Zhang, R., Wu, R., Gu, Y., and Lu, Y. (2020). The Effects of Oxytocin to Rectify Metabolic Dysfunction in Obese Mice Are Associated with Increased Thermogenesis. Mol. Cell. Endocrinol. 514, 110903. doi:10.1016/j.mce.2020.110903
Keywords: oxytocin, LC-MS, neuropeptide, analytical method development, sample preparation
Citation: Hering A, Jieu B, Jones A and Muttenthaler M (2022) Approaches to Improve the Quantitation of Oxytocin in Human Serum by Mass Spectrometry. Front. Chem. 10:889154. doi: 10.3389/fchem.2022.889154
Received: 03 March 2022; Accepted: 03 May 2022;
Published: 09 June 2022.
Edited by:
John D. Wade, University of Melbourne, AustraliaReviewed by:
Edouard Nice, Monash University, AustraliaMarcin Poreba, Wrocław University of Science and Technology, Poland
Copyright © 2022 Hering, Jieu, Jones and Muttenthaler. This is an open-access article distributed under the terms of the Creative Commons Attribution License (CC BY). The use, distribution or reproduction in other forums is permitted, provided the original author(s) and the copyright owner(s) are credited and that the original publication in this journal is cited, in accordance with accepted academic practice. No use, distribution or reproduction is permitted which does not comply with these terms.
*Correspondence: Markus Muttenthaler, bS5tdXR0ZW50aGFsZXJAdXEuZWR1LmF1
†These authors have contributed equally to this work