 Qingzhu Cai1†
 Qiang Song2†
 Kunxia Jiang1
 Yao Lin1
 Ying Zhang1
 Jirong Zhang1
 Shuqing Lin1
 Lina Huang1
 Qihuang Xue3
 Zehao Huang1*
 Wen Xu1*
 Wei Xu1
 Mun Fei Yam1,4*
- 1College of Pharmacy, Fujian University of Traditional Chinese Medicine, Fuzhou, China
- 2Department of Pharmacy, Fujian Provincial Hospital, Shengli Clinical Medical College of Fujian Medical University, Fuzhou, China
- 3Fujian South Pharmaceutical Co., Ltd., Sanming, China
- 4Department of Pharmacology, School of Pharmaceutical Sciences, Universiti Sains Malaysia, Penang, Malaysia
Introduction: Taxus species are used as medicinal plants all over the world. The leaves of Taxus species are sustainable medicinal resources that are rich in taxoids and flavonoids. However, traditional identification methods cannot effectively identify Taxus species on the basis of leaces used as raw medicinal materials, because their appearance and morphological characteristics are almost the same, and the probability of error identification increases in accordance with the subjective consciousness of the experimenter. Moreover, although the leaves of different Taxus species have been widely used, their chemical components are similar and lack systematic comparative research. Such a situation is challenging for quality assessment.
Materials and methods: In this study, ultra-high-performance liquid chromatography coupled with triple quadrupole mass spectrometry combined with chemometrics was applied for the simultaneous determination of eight taxoids, four flavanols, five flavonols, two dihydroflavones, and five biflavones in the leaves of six Taxus species, namely, T. mairei, T. chinensis, T. yunnanensis, T. wallichiana, T. cuspidata, and T. media. Chemometric methods, including hierarchical cluster analysis, principal component analysis, orthogonal partial least squares-discriminate analysis, random forest iterative modeling, and fisher linear discriminant analysis, were utilized to differentiate and evaluate the six Taxus species.
Results: This proposed method exhibited good linearity (R2 = 0.9999–0.9972) with a lower quantification limits of 0.94–3.05 ng/mL for all analytes. The intra- and inter-day precisions were within 6.83%. Six compounds, namely, 7-xylosyl-10-deacetyltaxol, ginkgetin, rutin, aromadendrin, 10-deacetyl baccatin III, and epigallocatechin, were identified through chemometrics for the first time. These compounds can be used as important chemical markers to distinguish the above six Taxus species rapidly.
Conclusion: This study established a method for determination of the leaves of six Taxus species, and revealing the differences in the chemical components of these six Taxus species.
1 Introduction
Taxus species, also called yew, are evergreen arbors or shrubs that belong to family Taxaceae and genus Taxus (Zhang et al., 2021). The taxoids extracted from Taxus species, such as taxol, 10-deacetyl baccatin III (10-DAB), and 10-deacetyltaxol (10-DAT), play an important role as precious medicinal plant resources in cancer treatment (Hafezi et al., 2020). Moreover, Taxus species are rich in flavonoids, such as sciadopitysin (SDN), quercitrin (QC), and ginkgetin (GK), which can inhibit tumor metastasis and treat osteoporosis, diabetic osteopathy, and Alzheimer’s disease (Gu et al., 2013; Weng et al., 2018). In the long run, the extensive use of the bark or root of Taxus species for the extraction of active substances will lead to the destruction of Taxus resources (Zhao et al., 2016). The leaves of Taxus species are also abundant in taxoids and flavonoids, which can replace the bark or roots of trees such that Taxus resources can be recycled (Yang et al., 2016). However, when the leaves of Taxus species are used as raw medicinal materials, identifying their varieties with subjective consciousness is difficult owing to their similar appearances. Among Taxus species, T. chinensis, T. mairei, T. wallichiana, and T. cuspidata are employed as traditional Chinese medicine, and T. yunnanensis and T. media are applied for the extraction of medicinal materials (Sharma and Garg, 2015). Thus, how to identify raw medicinal materials effectively has become a problem. At present, the leaves of different Taxus species are used as raw medicinal materials. However, the similarities in their chemical components have not been systematically compared. Therefore, we need to evaluate the differences in chemical components in the leaces of different Taxus varieties systematically and establish a chemical model to distinguish six different Taxus species on the basis of chemical content data of leaves to lay a foundation for the sustainable development and utilization of Taxus.
Huang et al. established a high-performance liquid chromatography (HPLC) method to determine five flavonoids in T. mairei (Huang et al., 2018). Cui et al. utilized HPLC to determine seven taxoids from T. cuspidata, T. mairei, and T. media (Cui et al., 2022). Li et al. applied HPLC coupled with tandem mass spectrometry (HPLC–MS/MS) to determine seven taxoids in T. cuspidata, T. mairei, and T. media (Li et al., 2009). The above methods require long analysis times but have and low detection sensitivity. Ultra–high–performance liquid chromatography (UPLC) has developed with the maturation of analytical technology. It has faster speed, higher efficiency, and higher sensitivity than HPLC. Moreover, UPLC–MS/MS has a good separation effect for complex multicomponent systems and can quickly and accurately quantify complex components (Tan et al., 2018; Xu and HeZhong, 2021). Wang et al. used UPLC–electrospray ionization (ESI)–MS/MS to analyze the metabolic changes in flavonoids in the leaves of T. mairei and T. media (Wang T. et al., 2019). Gai et al. used UPLC–MS/MS to determine the changes in the contents of seven taxoids and seven flavonoids in different parts of T. cuspidata, T. mairei, and T. media simultaneously (Gai et al., 2020). Supplementary Table S1 compares the results of our present study with those works in accordance with sample type, quantitative analytes, method time, mobile phase solvent consumption, limit of detection (LOD), and limit of quantification (LOQ). No research has been reported on the evaluation of the comprehensive quality of Taxus by UPLC–MS/MS combined with chemometrics.
In this study, UPLC–MS/MS combined with chemometrics was used for the first time to evaluate the comprehensive quality of the leaves of six Taxus species. A UPLC–MS/MS method was established for the simultaneous determination of 24 components, including eight taxoids, four flavanols, five flavonols, two dihydroflavones, and five biflavones, in the leaves of six Taxus species. The chemical components screened by chemometric methods, such as hierarchical cluster analysis (HCA), principal component analysis (PCA), orthogonal partial least squares-discriminate analysis (OPLS-DA), random forest (RF) iterative modeling, and fisher linear discriminant analysis (FDA), can provide references for the identification and quality evaluation of the above six different Taxus species.
2 Materials and methods
2.1 Samples
Fifty-one leaf samples were collected from six Taxus species in China and stored at 4°C (S1–15: T. mairei, S16–20: T. chinensis, S21–25: T. yunnanensis, S26–30: T. wallichiana, S31–36: T. cuspidata, S37–42: T. media, S43–51: for the external validation of FDA models). The images and detailed information of the samples are shown in Supplementary Figure S1 and Table 1. The sources of all samples were identified by Professor ZH and MY from the Plant Identification Teaching and Research Office of the Fujian University of Traditional Chinese Medicine, Fujian Province, China. Voucher specimens were kept in the Comprehensive Medical Research Institute of Fujian University of Traditional Chinese Medicine.
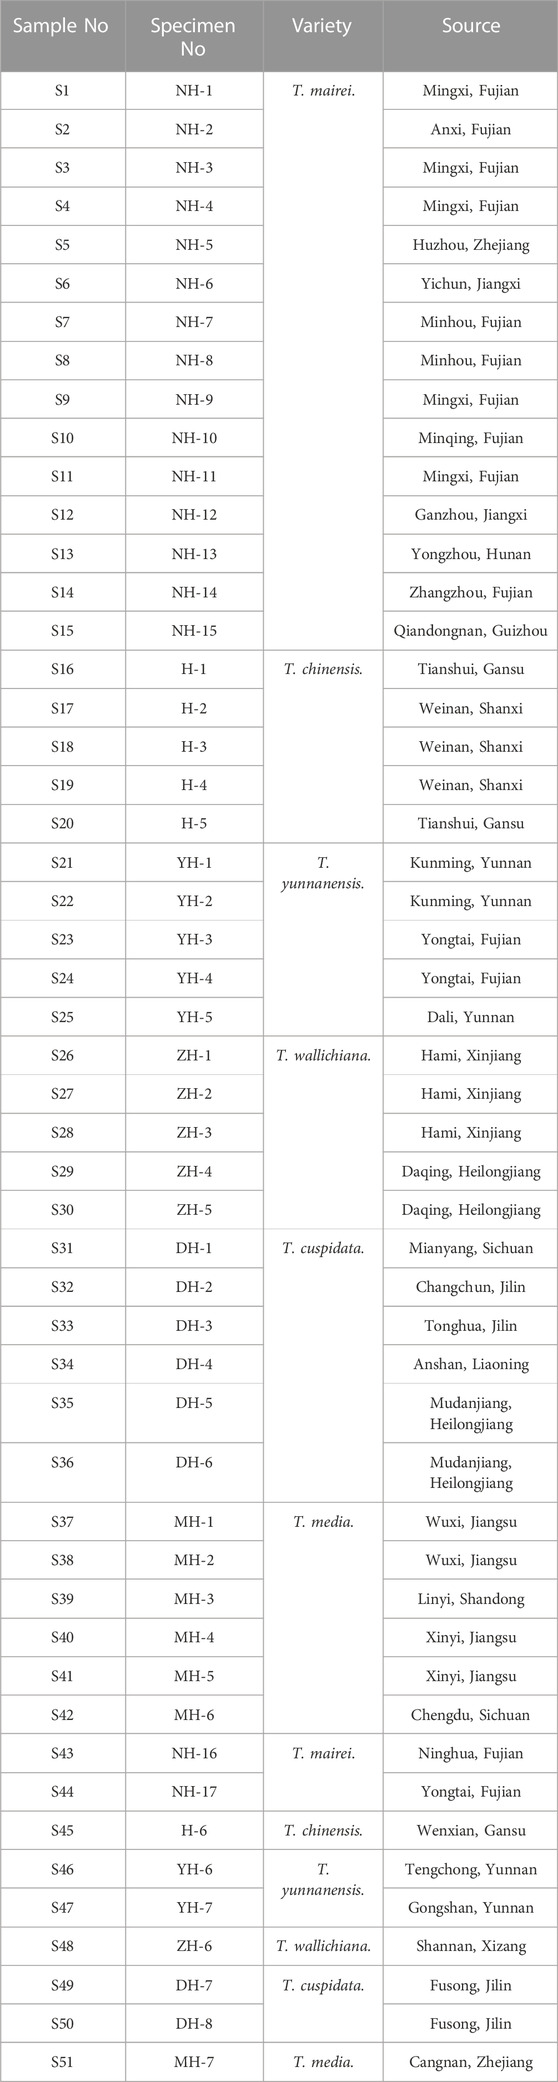
TABLE 1. Detailed information of 51 leaf samples from the six Taxus species.
2.2 Reagents and standards
Methanol, acetonitrile, and formic acid for UPLC analysis were purchased from Merck (Darmstadt, Germany). Deionized water was prepared daily by using a Millipore Milli-Q purification system (Millipore, Bedford, MA, United States). 10-DAB, baccatin III (BAC), 7-xylosyl-10-deacetyltaxol (7-xyl-10-DAT), 10-DAT, cephalomannine (CE), 7-epi-10-deacetyltaxol (7-epi-10-DAT), paclitaxel (TAXOL), 7-epi-paclitaxel (7-epi-TAXOL), gallocatechin (GC), catechin (C), isoquercitrin (IQC), nicotiflorin (NFR), and triptolide (IS1) were purchased from Chengdu Mansite Bio-Technology Co., Ltd. (Chengdu, China). Epigallocatechin (EGC), taxifolin (TAX), aromadendrin (ARO), amentoflavone (AF), 7-demethylginkgetin (DGK), GK, isoginkgetin (IGG), and SDN were purchased from Baoji Herbest Bio-Technology Co., Ltd. (Baoji, China). Epicatechin (EC), rutin (RT), QC, quercetin (QR), casticin (IS2), and liquiritin (IS3) with purities exceeding 98% (determined by HPLC) were purchased from the China National Institute for Food and Drug Control (Beijing, China), and their purity was more than 98% (determined by HPLC). Figure 1 shows the chemical structures of the 24 analytes and the three internal standards.
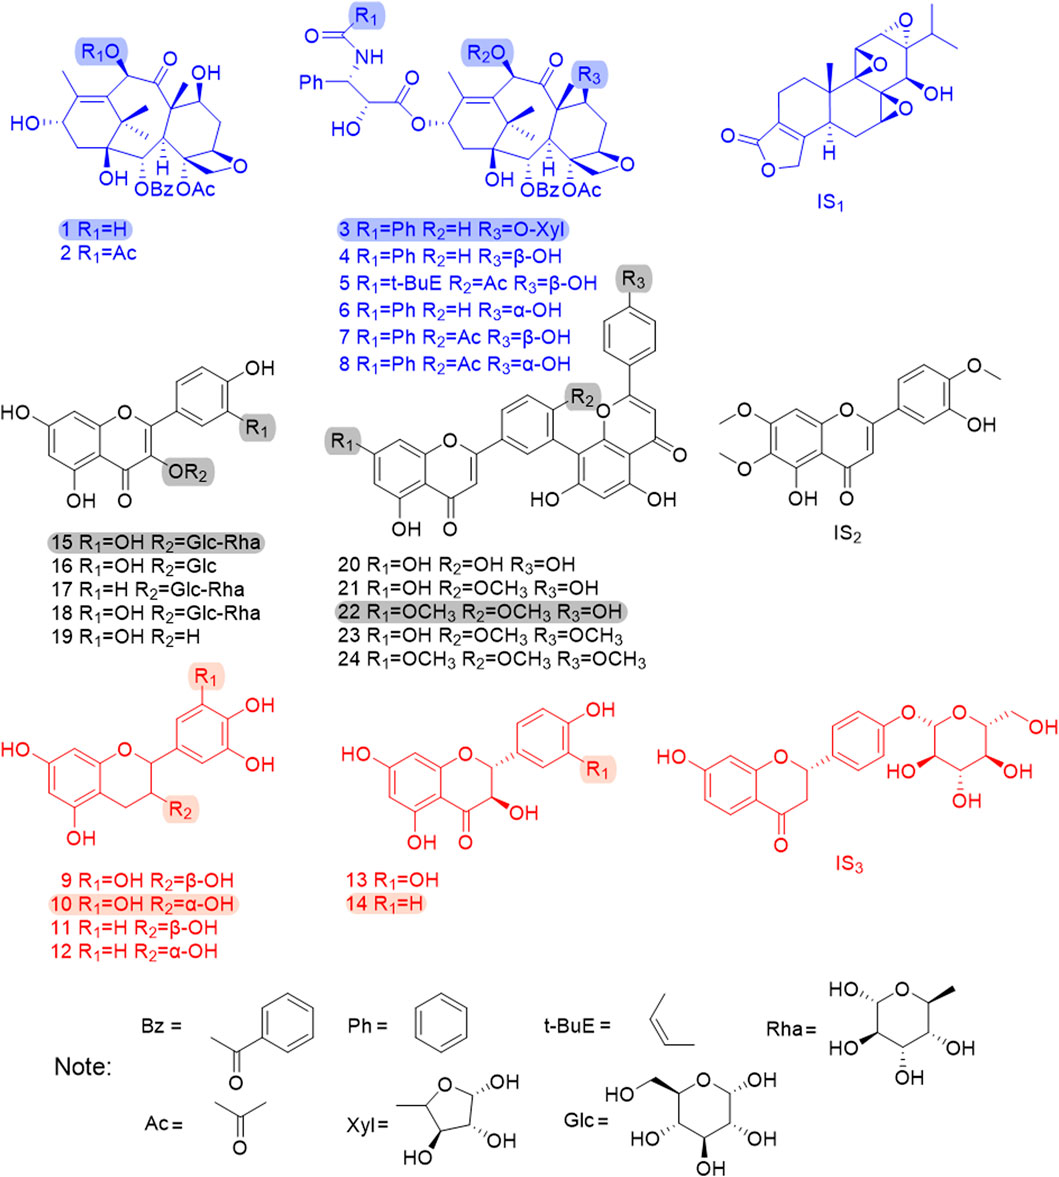
FIGURE 1. The chemical structures of 24 analytes and 3 internal standards. 1. 10-DAB, 2. BAC, 3. 7-xyl-10-DAT, 4. 10-DAT, 5. CE, 6. 7-epi-10-DAT, 7. TAXOL, 8. 7-epi-TAXOL, 9. GC, 10. EGC, 11. C, 12. EC, 13. TAX, 14. ARO, 15. RT, 16. IQC, 17. NFR, 18. QC, 19. QR, 20. AF, 21. DGK, 22. GK, 23. IGG, 24. SDN, IS1.TP, IS2.CAS, IS3.LIQ; The shadow area shows six chemical quality markers with distinguishing radical pharmacophores.
2.3 Preparation of samples and standard solution
Dried Taxus leaf samples were ground into 65 mesh powder, weighed accurately to 0.10 g, suspended in 25 mL of 80% methanol aqueous solution, accurately weighed in a 50 mL capped conical flask, and extracted in an ultrasonic bath with an output power of 300 W (40 kHz) for 30 min. The extract was added with 80% methanol to compensate for weight loss. The extract was centrifuged (12,000 r/min, 10 min) then passed through a 0.22 μm microporous membrane. The sample was diluted 5-fold by adding 800 μL of methanol solution to 200 μL of the sample solution. Then, the diluted sample was added to the internal standard mixed solution at a 1:1 v/v ratio. All samples were kept at 4°C.
The 24 standards were weighed separately and dissolved in methanol (UPLC–MS grade) to obtain single stock solutions with accurate concentrations. Each stock solution was rediluted and mixed with methanol to obtain a series of working standard solutions, and calibration curves were established by using the mixed working standard solution. All standard solutions were stored in brown glass bottles at 4°C.
Internal standards, namely, triptolide (IS1), casticin (IS2), and liquiritin (IS3), were dissolved in methanol to a concentration of approximately 1 mg/mL individually. Each stock solution was rediluted with methanol to prepare a mixed internal standard solution with 50 ng/mL IS1, 50 ng/mL IS3, and 100 ng/mL IS2. A total of 500 μL of the mixed internal standard was added to 500 μL of the mixed working standard solution or sample solution and filtered through a 0.22 μm micropore membrane before use.
2.4 Liquid chromatographic conditions
Chromatographic analysis was performed on a Waters UPLC system (Waters, United States). Twenty-four analytes were chromatographically separated on a Waters Cortecs C18 column (2.1 × 100 mm, 1.6 μm) through chromatographic separation. The column temperature was 45°C. The mobile phases consisted of 0.1% formic acid in water (A) and acetonitrile (B). The gradient elution program was as follows: 95% A at 0–0.5 min, 95%–55% A at 0.5–2.5 min, 55% A at 2.5–4.5 min, 55%–25% A at 4.5–8.5 min, 25%–95% A at 8.5–8.6 min, and 95% A at 8.6–10.5 min. The flow rate was 0.2 mL/min, and the volume of the injected sample was 2 μL.
2.5 Mass spectrum conditions
Mass spectrometry analysis was conducted with a Waters TQS triple quadrupole mass spectrometer in the switching mode of electrospray positive- and negative-ion modes of multiple reaction monitoring (MRM). The optimized MS conditions were fixed as follows: capillary voltage, 2.50 kV; desolvent gas flow, 800 L/h (N2); desolvent gas temperature, 500°C; ion source temperature, 150°C; secondary cone hole extraction voltage, 3.00 V; cone gas flow, 50 L/h (N2); collision gas, argon. The most suitable collision energy (COE) and cone voltage (CV) for each analyte was optimized. See Table 2 for the specific parameters.
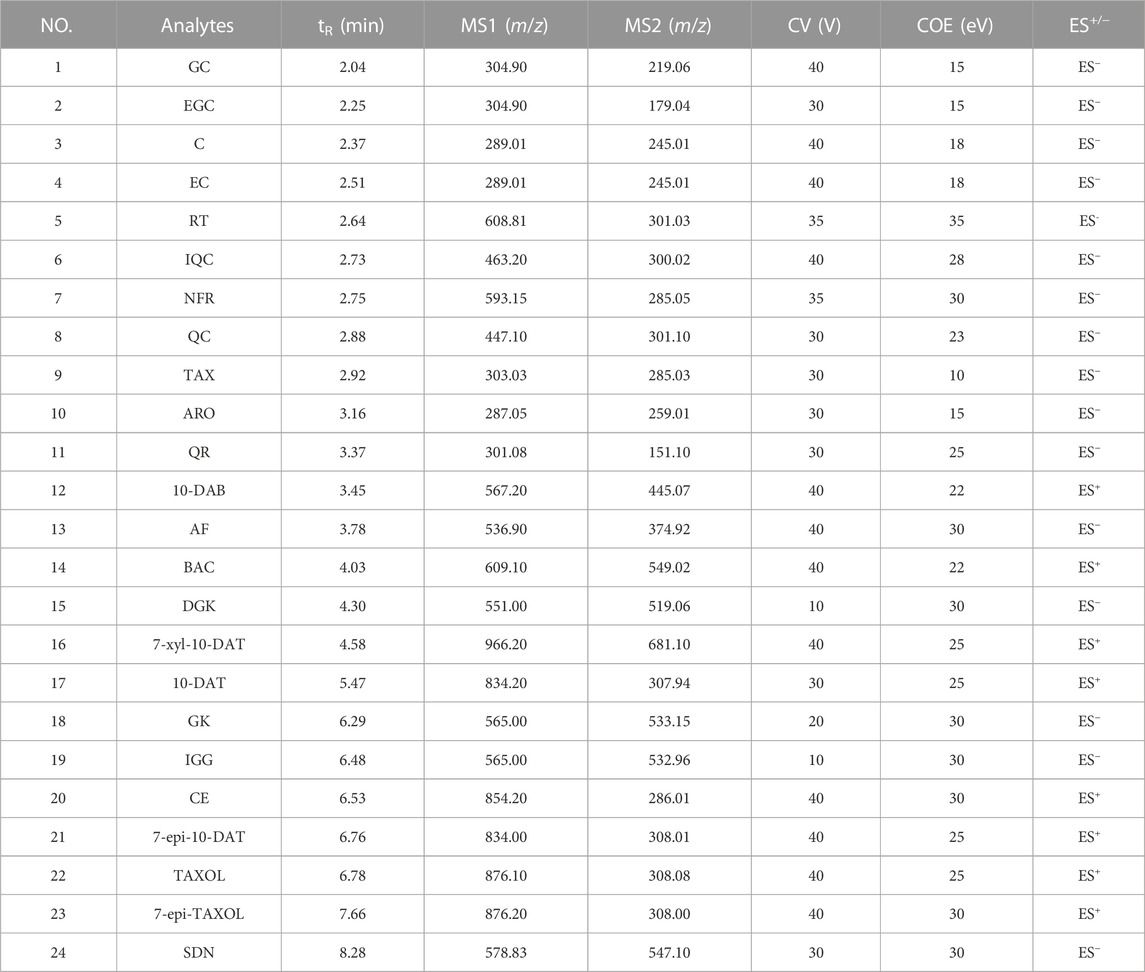
TABLE 2. The retention time (tR), precursor ions (MS1), product ions (MS2), CV, COE and ES+/− of the 24 analytes on UPLC-MS/MS.
2.6 Method validation
2.6.1 Calibration curves, LOD, and LOQ
In accordance with the relationship between the peak area ratio of each analyte to IS (Y) and the corresponding concentration (X) of each analyte in different mixed standard solutions, the established standard curve contained six different concentrations. The slope, intercept, and correlation coefficient (R2) of the curve of each analyte were calculated through linear regression analysis method. LOD is an indicators of the sensitivity of methods and instruments. LOQ is the minimum amount of analytes in a sample that can be quantitatively determined. It indicates that analytes with small contents can be accurately quantified through analysis. The LOD and LOQ of each analyte are the concentrations with signal–noise ratios equal to or greater than 3 and 10, respectively, in accordance with the serial dilution of mixed standard solutions.
2.6.2 Precision
The mixed standard solutions with four different concentrations (LOQ, low, middle, and high level) were measured three times a day and re-evaluated for 3 consecutive days. Intra- and interday changes were used as evaluation methods and instrument indicators. The precision changes in the 24 analytes were expressed as the percentage of relative standard deviation (RSD%).
2.6.3 Repeatability and stability
The same six samples of the S3 batch were prepared in accordance with the method described in Section 2.3. The analytes were analyzed by applying this method. The peak area of the 24 analytes was utilized as the evaluation index, and RSD% was used to evaluate repeatability. Moreover, the stability of the samples was studied.
2.6.4 Recovery
The recovery experiment was conducted by adding three standards with different concentrations (50%, 100%, and 150% of the sample) to a known number of samples (S3). The samples were prepared in accordance with the method in Section 2.3 and evaluated on the basis of RSD%.
2.7 Data analysis
The quantitative data of the analytes and FDA were statistically analyzed with SPSS statistical software 22.0 (SPSS Inc., Chicago, United States), and the difference was significant. Data were analyzed by Masslynx version 4.2. HCA was performed by using Heatmap Illustrator 1.0. PCA and OPLS-DA were conducted with SIMCA 14.1 software (Umetrics, Umea, Sweden). RF was established with the RF package (version 4.6–14) in the R environment (version 3.5.2).
3 Results and discussion
3.1 Optimization of chromatographic and mass spectrometry conditions
In this experiment, we selected methanol–water, methanol–0.1% formic acid water, acetonitrile–water, and acetonitrile–0.1% formic acid water as the candidate mobile phases and the chromatographic peak separation effect and peak shape as the evaluation indicators. Acetonitrile–0.1% formic acid water was selected on the basis of the optimized result. Our established method separated five isomeric compounds (GC and EGC, C and EC, GK and IGG, 10-DAT and 7-epi-10-DAT, and TAXOL and 7-epi-TAXOL) simultaneously for the first time. To develop a sensitive and accurate quantitative method, we studied the quantitative ion selection of analytes in the positive- and negative-ion ESI modes on the basis of the optimized CV and COE values by using manually optimized MRM parameters, as shown in Table 2. The chromatograms of the representative T. mairei sample (S3, methodological validation sample) and mixed standard solution are provided in Supplementary Figure S2 and Figure 2, respectively. Among the 24 analytes measured, we found that four different classes of flavonoids had the best response in the negative-ion mode. Eight taxoids had the best response in the positive-ion mode. IS1 was used as the internal standard of taxoids; IS2 was utilized as the internal standard of flavanols, flavonols, and biflavones; and IS3 was applied as the internal standard of dihydroflavones. ISs could be separated from the chromatographic peaks of the 24 analytes. This characteristic plays an important role in the accurate determination of complex components to ensure the accuracy of results. ISs and the analytes had similar chemical structures, which are indicated by the same color. IS1 and taxoids are marked with blue; IS2, flavonols, and biflavones are marked with black; and IS3, flavanols, and dihydroflavones are marked with red. Refer to Figure 1 for specific analyte results.
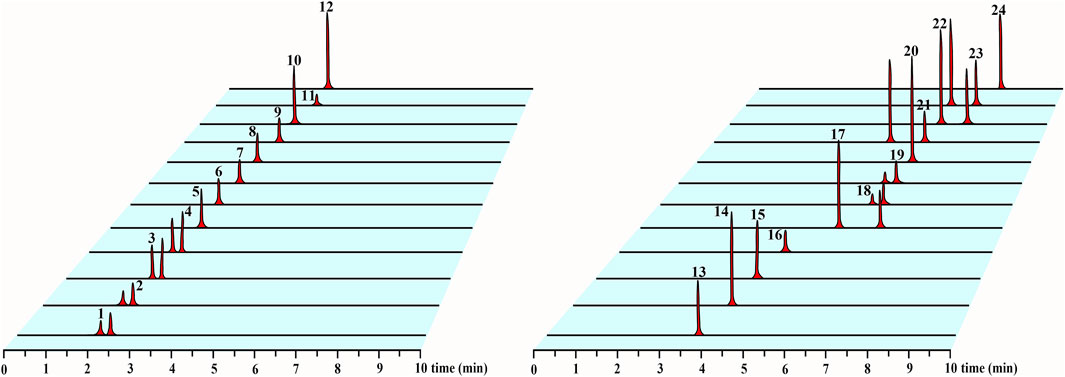
FIGURE 2. UPLC-MS/MS chromatograms of 24 analytes in mixed standard solution. The sequence of 24 analytes in the figure is consistent with the number in Table 1.
3.2 Identification of compounds with UPLC–MS/MS
We employed the established analytical method to identify the 24 compounds in six Taxus species. Structures were unambiguously assigned on the basis of the retention times and MS spectra of the reference standards (Supplementary Figure S4). The ESI mass spectra provided the characteristic quasi-molecular ions of GC [M–H]− at m/z 304.90; EGC [M–H]− at m/z 304.90; C [M–H]− at m/z 289.01; EC [M–H]− at m/z 289.01; RT [M–H]− at m/z 608.81; IQC [M–H]− at m/z 463.20; NFR [M–H]− at m/z 593.15; QC [M–H]− at m/z 447.10; QR [M–H]− at m/z 301.08; TAX [M–H]− at m/z 303.03; ARO [M–H]− at m/z 287.05; AF [M–H]− at m/z 536.90; DGK [M–H]− at m/z 551.00; GK [M–H]− at m/z 565.00; IGG [M–H]− at m/z 565.00; SDN [M–H]− at m/z 578.83; 10-DAB [M–H]− at m/z 567.20; BAC [M + Na]+ at m/z 609.10; 7-xyl-10-DAT [M + Na]+ at m/z 966.20; 10-DAT [M + Na]+ at m/z 834.20; CE [M + Na]+ at m/z 854.20; 7-epi-10-DAT [M + Na]+ at m/z 834.00; TAXOL [M + Na]+ at m/z 876.10; and 7-epi-TAXOL [M + Na]+ at m/z 876.20. Moreover, the characteristic fragmentation behaviors of the 24 compounds revealed by MS/MS analysis in our present study were identical to those in previous studies (Wang Y.-J. et al., 2019; Gai et al., 2020; Luo et al., 2020; Yi et al., 2020) and our previous pre-experimental HPLC–Q-TOF–MS/MS work (Supplementary Figure S3; Supplementary Table S2): m/z 305→219→179→125 for GC and EGC; 289→245→203→151→125 for C and EC; m/z 609→301→257→151 for RT; m/z 463→300→179→151 for IQC; m/z 593→285→151 for NFR; m/z 447→301→179→151 for QC; m/z 303→285→151→107 for TAX, m/z 287→259→243→201 for ARO; m/z 301→273→179→151→107 for QR; m/z 567→531→445 for 10-DAB; m/z 537→443→417→399→375 for AF; m/z 609→549→427→367 for BAC; m/z 551→519→475→457→389 for DGK; m/z 966→681→308 for 7-xyl-10-DAT; m/z 834→549→308 for 10-DAT and 7-epi-10-DAT; m/z 565→533→389→374 for GK and IGG, m/z 854→591→286 for CE; m/z 876→591→533→308 for TAXAL and 7-epi-TAXOL; m/z 579→547→403→165 for SDN, and GC, RT, TAX, SDN, and TAXOL were used as examples to depict the detailed identification processes of flavanols, flavonols, dihydroflavones, biflavones, and taxoids in Figures 3A–E, respectively.
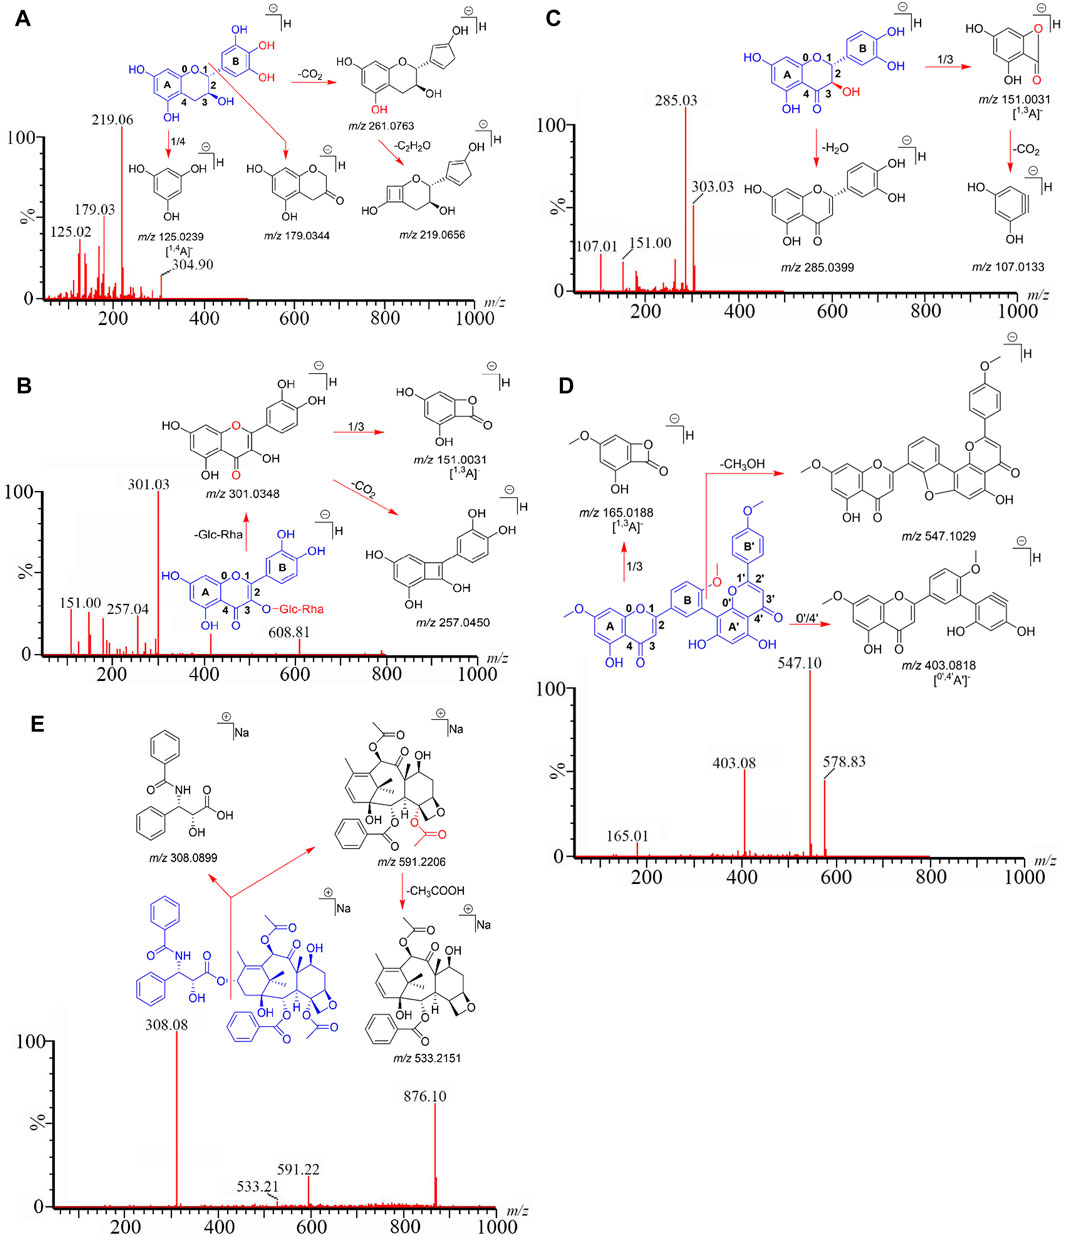
FIGURE 3. GC (A), RT (B), TAX (C), SDN (D), and TAXOL (E) are used as examples to clarify the detailed identification processes of flavanols, flavonols, dihydroflavones, biflavones, and taxoids.
3.3 Method validation
3.3.1 Calibration curves, LOD, and LOQ
The regression equation, R2, linear range, LOD, and LOQ data of the 24 analytes are shown in Table 3. The calibration curve presented good linearity, and the concentration ranges of the 24 analytes in the samples were within the linear range of the calibration curve. The correlation coefficient (R2 = 0.9999–0.9972) of the linear equation was linear. The LOD and LOQ values of the 24 analytes were within the ranges of 0.47–1.53 and 0.94–3.05 ng/mL, respectively.
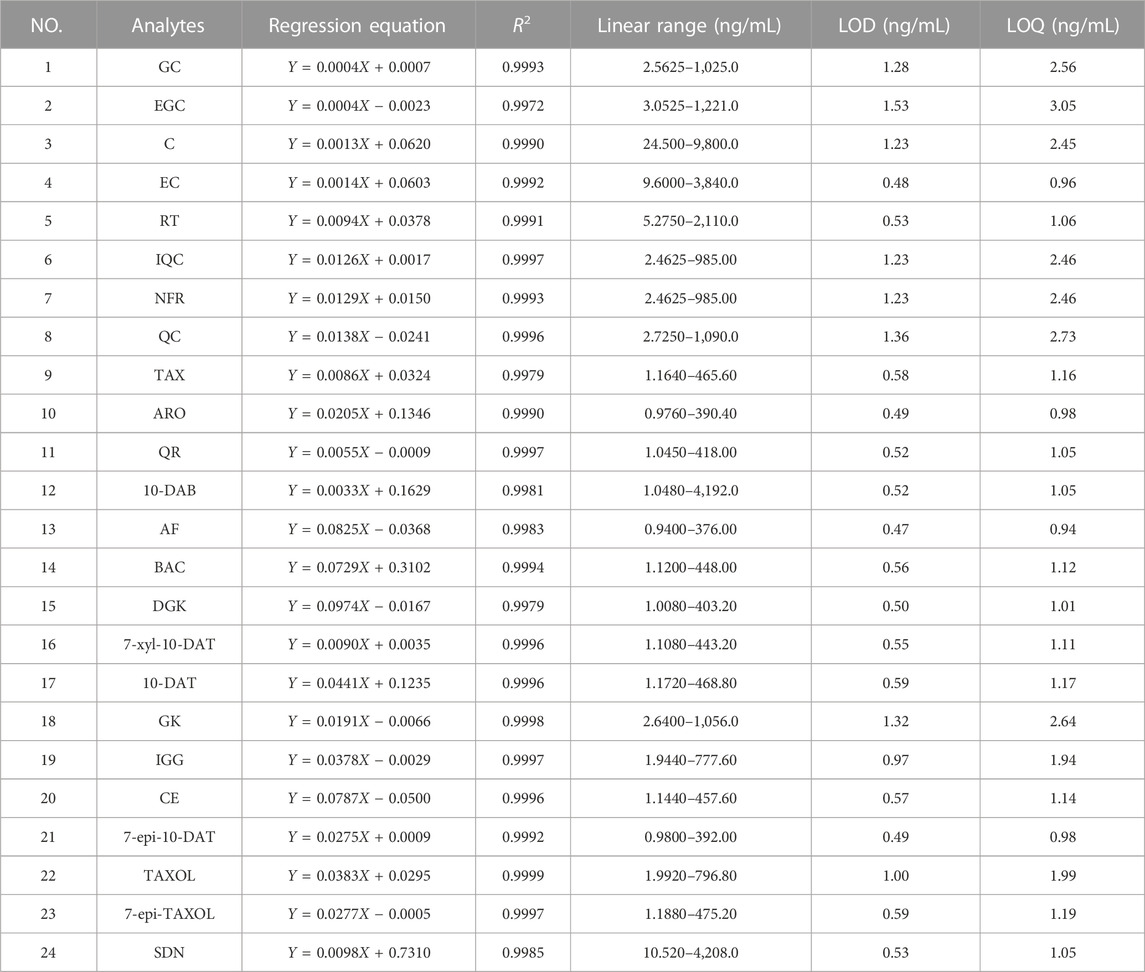
TABLE 3. The linear regression data, LOD and LOQ of the 24 analytes on UPLC-MS/MS.
3.3.2 Precision, repeatability, and stability
The intra- and interday RSD% values of the peak areas of the 24 analytes were less than 6.72% (n = 3) and 6.83% (n = 3) respectively, as presented in Table 4. The RSD% values of repeatability and stability were 1.93%–7.58% (n = 6) and 1.98%–5.30% (n = 6), respectively, as shown in Table 5. The results show that the proposed method and instrument in our present work have better accuracy than those in previous studies.
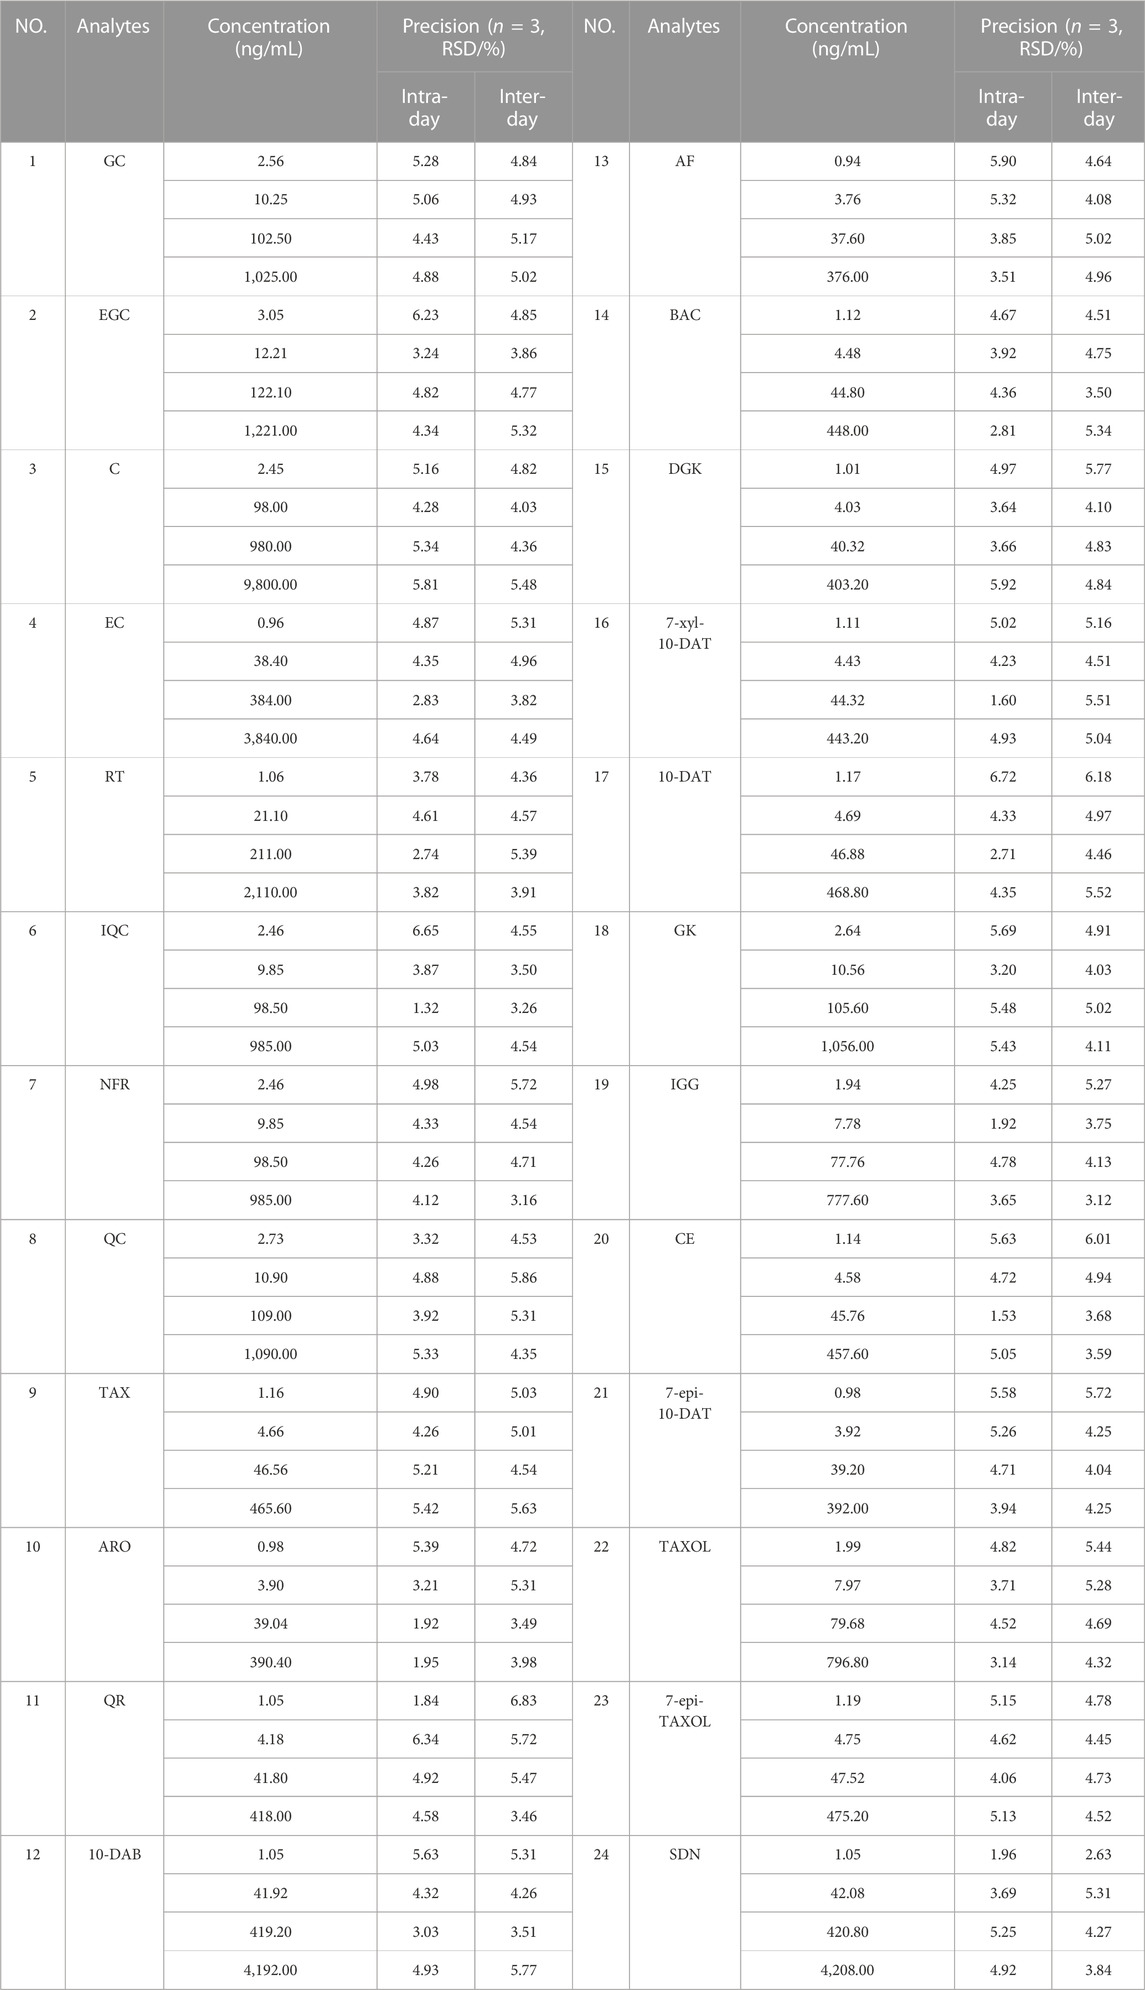
TABLE 4. Precision and accuracy for the 24 analytes.
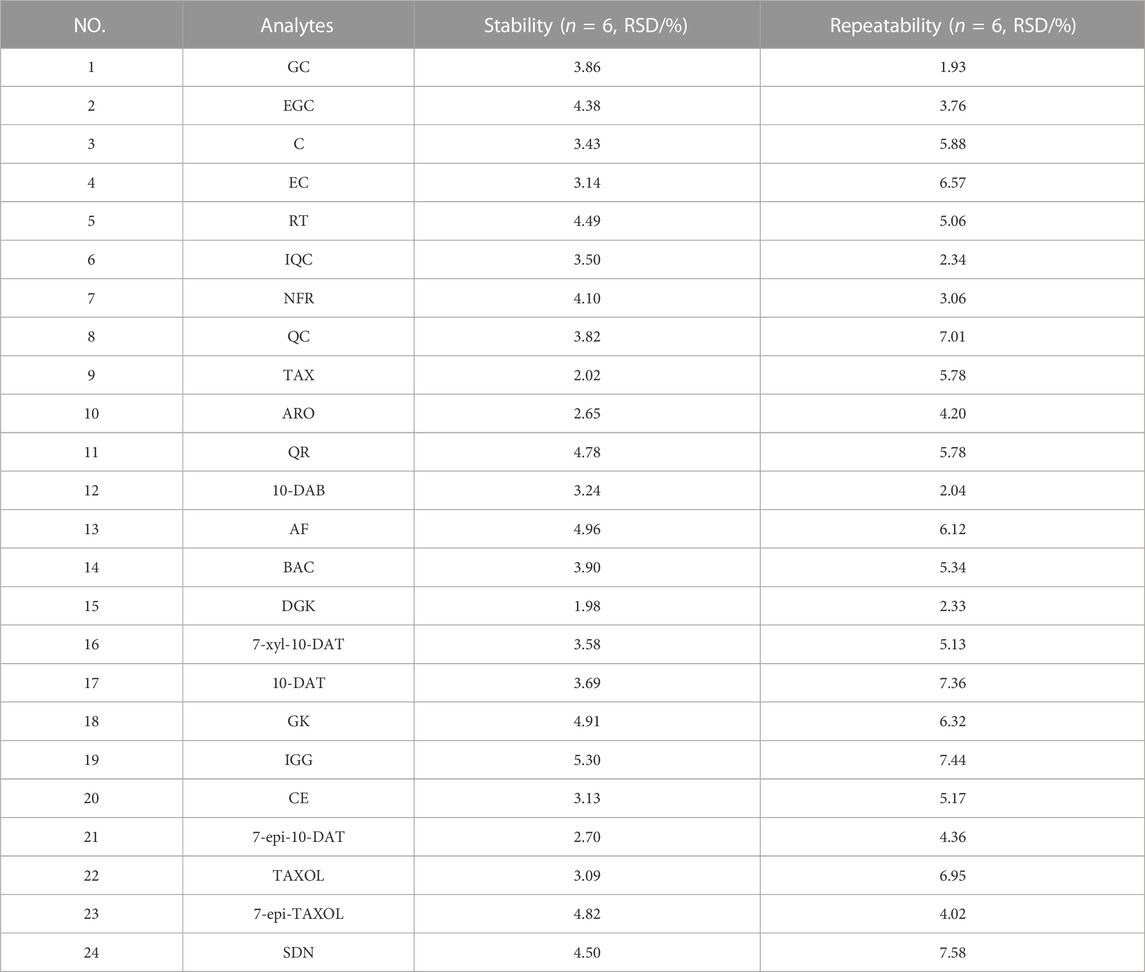
TABLE 5. Stability and repeatability for the 24 analytes in the leaves of Taxus species.
3.3.3 Recovery
As shown in Table 6, the average recoveries of the 24 analytes at three different concentration levels ranged from 89.11% ± 4.37%–105.29% ± 2.78% with the RSD% of 1.03%–9.92% (n = 3). These results demonstrate that our method has good recovery.
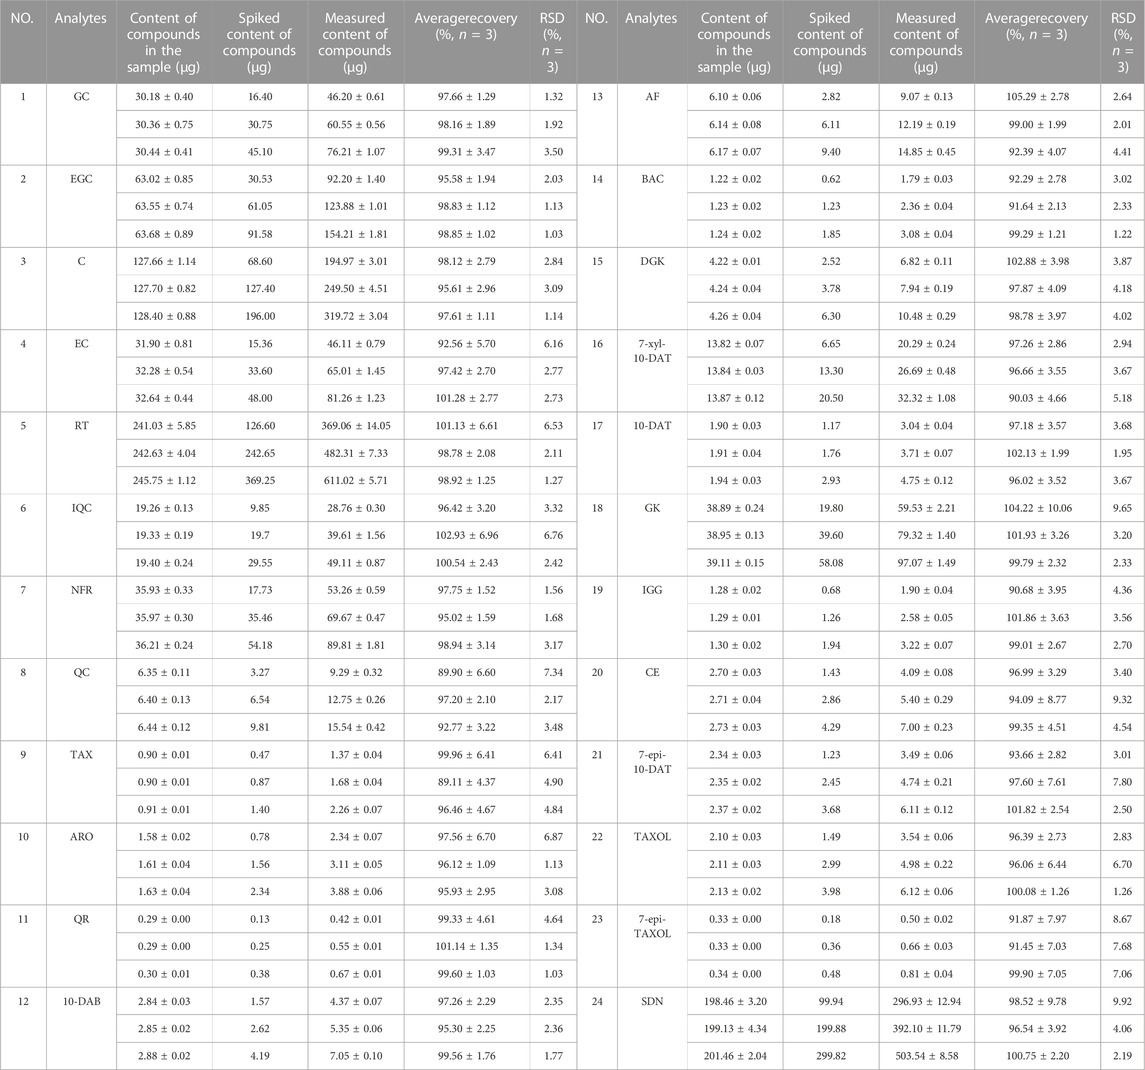
TABLE 6. Recovery for the 24 analytes.
The 24 analytes presented a good linear relationship in the tested concentration range, and their detection limits, precision, accuracy, stability, repeatability, and recovery met the requirements.
3.4 Quantification of the 24 analytes in the leaves of Taxus species samples
Eight taxoids, four flavanols, five flavonols, two dihydroflavones, and five biflavones in 42 leaf samples from Taxus species were determined and analyzed by UPLC–MS/MS after method validation (See Figure 4; 1: T. mairei, 2: T. chinensis, 3: T. yunnanensis, 4: T. wallichiana, 5: T. cuspidata, 6: T. media). Under the UPLC–MS/MS condition, all analytes can be detected in the leaves of the different Taxus species. The contents of chemical components in different Taxus species were obviously different. We first discuss toxoids. In T. wallichiana, the amount of 7-Epi-TAXOL was less than the LOQ. Among the eight taxoids, 10-DAB, BAC, 7-xyl-10-DAT, 10-DAT, and TAXOL were higher in T. yunnanensis than in the other five Taxus species; CE, TAXOL, and 7-epi-TAXOL were higher in T. cuspidata than in the other five Taxus species; and 7-epi-10-DAT was higher in T. chinensis than in the other five Taxus species. The eight other taxoids were abundant in T. yunnanensis and had low abundance in T. wallichiana (T. yunnanensis > T. cuspidate > T. chinensis > T. media > T. mairei > T. wallichiana). Therefore, T. yunnanensis was used as a plant material for taxoid extraction. Second, we discuss flavanols. We found that among the four flavanols, GC was higher in T. yunnanensis than in the other Taxus species, and EGC, C, and EC were higher in T. mairei, T. chinensis, and T. media than in the other three Taxus species. Third, we found that among the five flavonols, QR was present at low levels in the six Taxus species. RT, IQC, NFR, and QC were higher in T. maireis, T. chinensis, and T. media than in the other Taxus species. Fourth, we discovered that of the two dihydroflavones, TAX and ARO were higher in T. cuspidata and T. media than in the other Taxus species. Fifth, among the five biflavones, AF was higher in T. mairei, T. chinensis, and T. media than in the other Taxus species. DGK was higher in T. cuspidata, GK was higher in T. chinensis, IGG was higher in T. wallichiana, and SDN was higher in T. mairei than in the other Taxus species. The components in the leaves of different Taxus species were different, and quantitative analysis could aid the effective use of the leaves of different Taxus varieties. Moreover, we comparatively analyzed the quantitative results of 24 analytes from the six Taxus species on the basis of their mean ± SDs in Figure 4, and the content determination results are provided in Table 7.
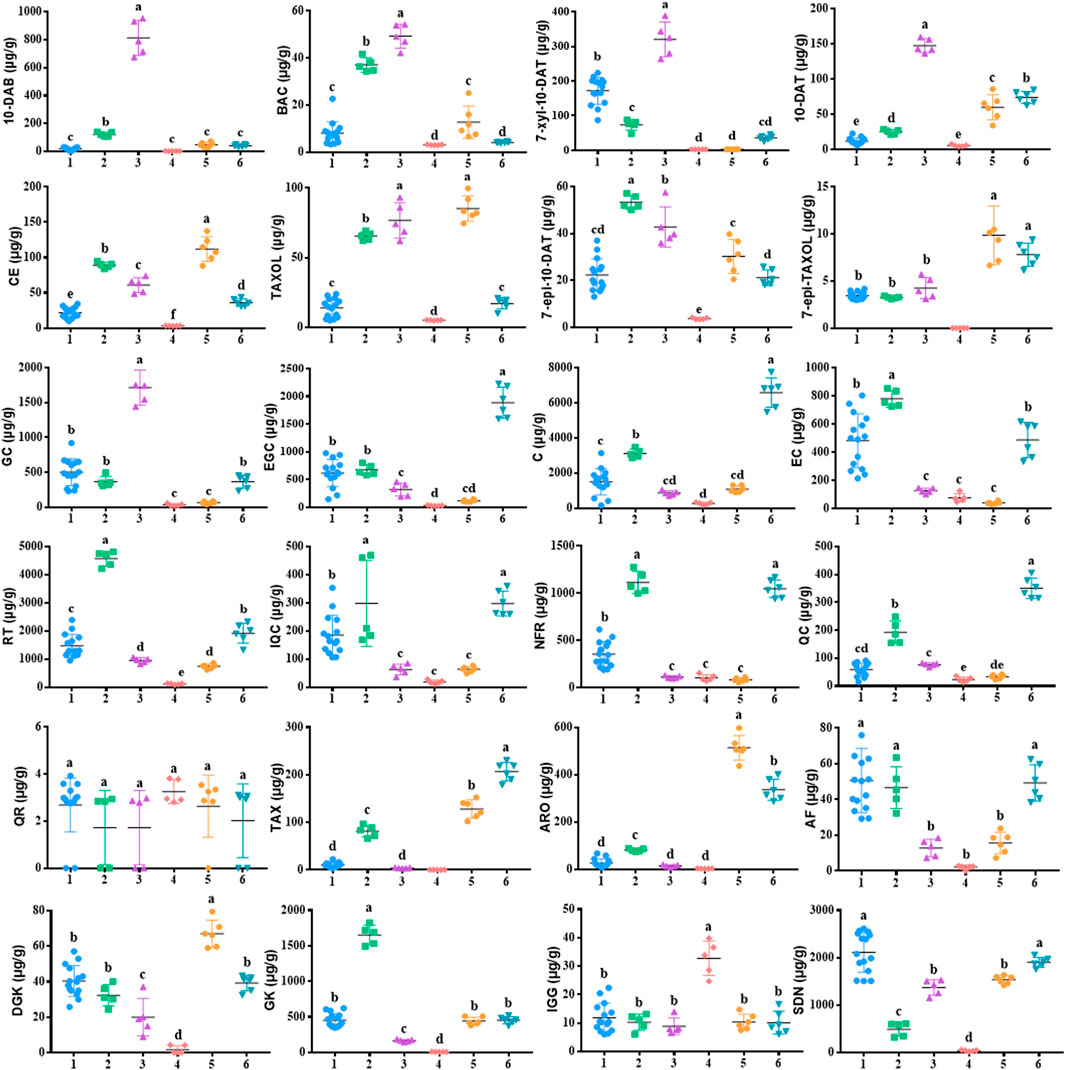
FIGURE 4. Comparative analysis of 24 components in 42 leaf samples from the six Taxus species. The mean ± SDs not sharing the same lowercase letters are signifificantly different (p < 0.05). 1: T. mairei, 2: T. chinensis, 3: T. yunnanensis, 4: T. wallichiana, 5: T. cuspidata, 6: T. media.
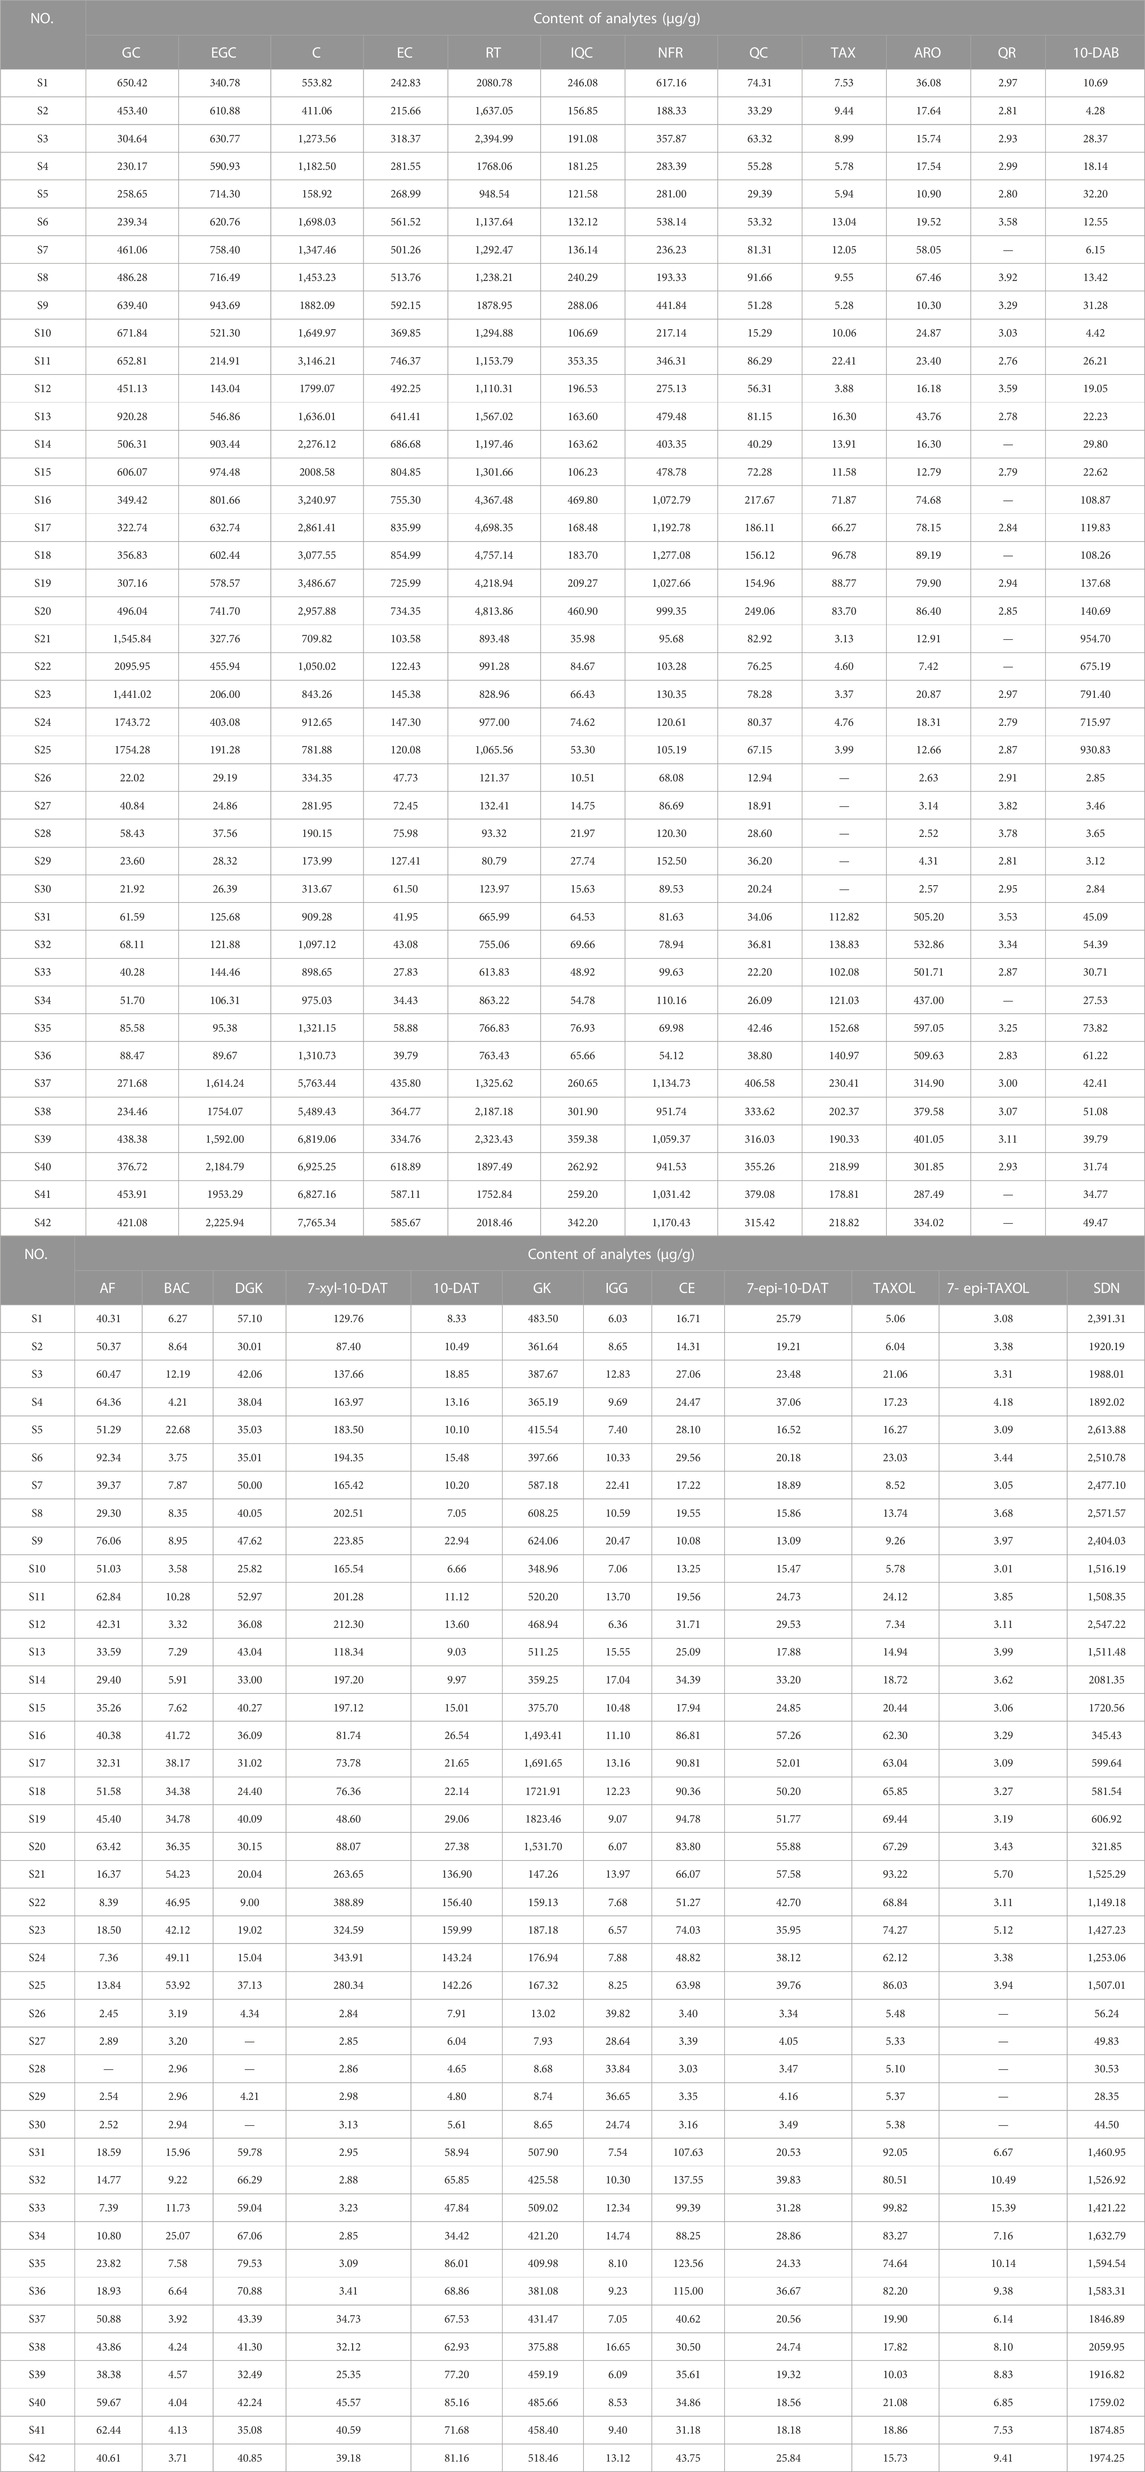
TABLE 7. Content results of 24 analytes.
3.5 Heatmap and HCA
HCA in Heatmap Illustrator 1.0 software was used to analyze the contents of the 24 analytes in the leaves of six Taxus species, and the content data were normalized. The clustering method was the Ward method, and the distance type was square Euclidean distance. The HCA results are shown in Figure 5. The 42 batches of leaf samples from the six Taxus species divided into six categories. Therefore, the established content determination method can distinguish the six different varieties of Taxus species. The differences in the contents of the 24 analytes in the leaves of different Taxus species can be clearly seen in Figure 5. Among the eight taxoids, 10-DAB, BAC, 7-xyl-10-DAT, and 10-DAT were higher in T. yunnanensis; CE, TAXOL, and 7-epi-TAXOL were higher in T. cuspidata; and 7-epi-10-DAT was higher in T. chinensis than in the other species. The contents of four flavanols and five flavonols were higher in T. chinensis and T. media than in the other Taxus species. However, GC was higher in T. yunnanensis than in the other Taxus species. The contents of two dihydroflavones were higher in T. cuspidata and T. media than in the other Taxus species. Among the biflavones, DGK was higher in T. cuspidata than in the other species. GK content was higher in T. chinensis, IGG content was higher in T. wallichiana, and SDN content was higher in T. mairei than in the other Taxus species. HCA revealed the differences in the contents of the 24 analytes in leaf samples from six different Taxus species with high intuitiveness.
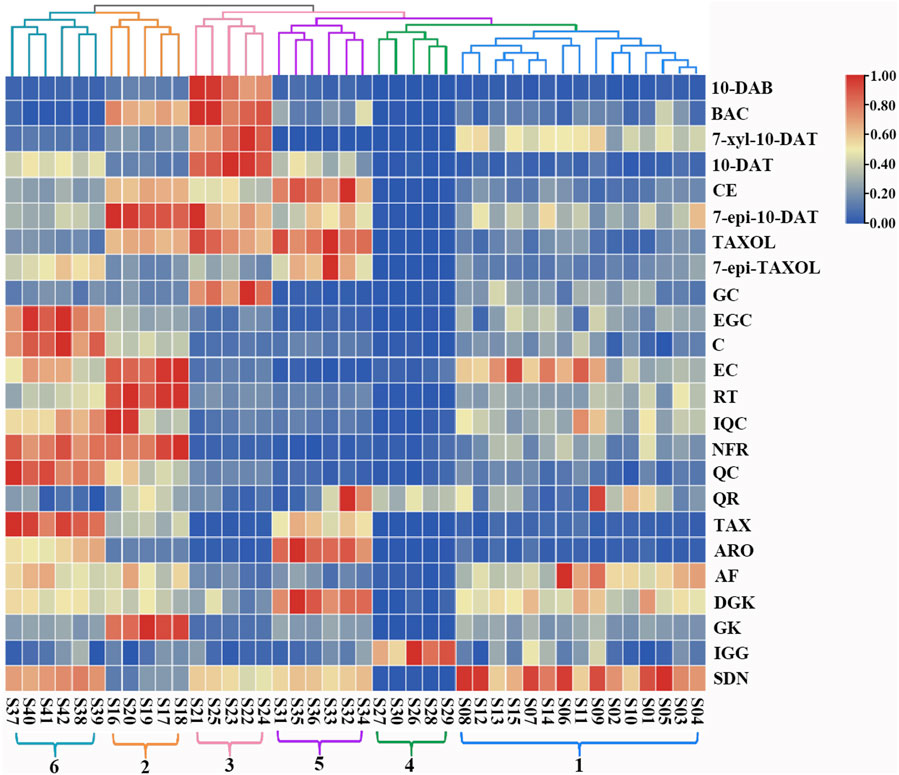
FIGURE 5. Heatmap and dendrogram of HCA in 42 leaf samples from the six Taxus species. S1-S42 represents 42 leaf samples from the six Taxus species. 1: T. mairei, 2: T. chinensis, 3: T. yunnanensis, 4: T. wallichiana, 5: T. cuspidata, 6: T. media, and 24 analyte names are shown at the right of the figure. The colors from red, yellow and blue represent the content of analytes in the sample from high to low.
3.6 PCA and OPLS-DA
PCA is the most commonly data analysis method in the statistical analysis of multiple elements. In this method, the information of original features is retained to the maximum extent without the loss of important information (Jolliffe and Cadima, 2016; Giuliani, 2017). We imported the data into Simca 14.1 with sample batch as the observation value and the 24 analytes as the variables. Unit variance scaling was used for data normalization to generate the PCA model. The scores and accumulated R2X and Q2 with different numbers of principal components are displayed in Figures 6A, B. Consistent with the HCA results, the 42 batches of Taxus leaf samples divided into six categories. The samples were well separated, indicating differences in the contents of the 24 analytes in the leaves of different Taxus species (Figure 6A). The main components of the PCA model can predict 92.8% of the changes in the original dataset (R2X [cum] = 0.928), and 73.4% of the cumulative prediction rate was predicted in the model through cross-fold validation (Q2 [cum] = 0.734, Figure 6B). Therefore, this model can represent the information of the original data, and the obtained results are scientific and effective. In the next step, we used OPLS-DA to identify the chemical components that distinguish the six Taxus species.
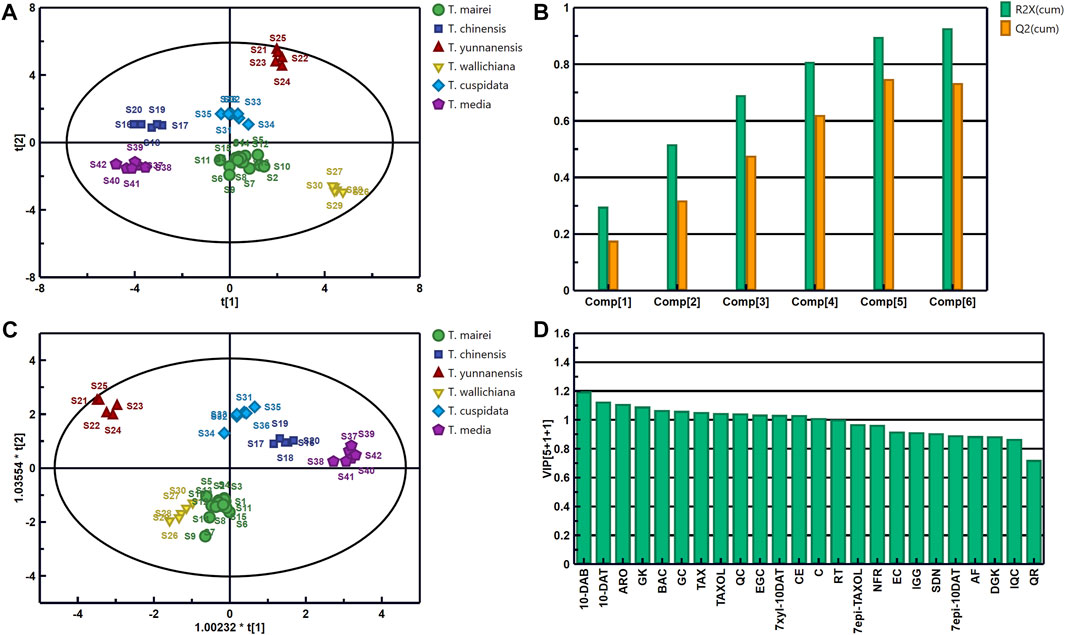
FIGURE 6. Scores (A) and Accumulated R2X and Q2 with different numbers of principal components (B) of PCA; scores (C) of OPLS-DA and the variable importance predictive value (VIP) of 24 analytes (D) in 42 leaf samples from the six Taxus species.
OPLS-DA is a supervised discriminant analysis method that can be used to find variables that cause differences between samples (Li et al., 2021; Wang et al., 2022). By using PCA, we further searched for the chemical components that distinguish the different Taxus species. Once again, we imported the content determination results of the 24 analytes in the 42 batches of Taxus leaf samples into SIMCA 14.1 for OPLS-DA. The OPLS-DA scores and the variable importance predictive values (VIPs) of the 24 analytes are presented in Figures 6C, D. The established OPLS-DA model can predict 97.4% of the information in the X matrix (R2X [cum] = 0.974) and 87.6% of the information in the Y matrix (R2Y [cum] = 0.876). Cross-validation (Q2 [cum] = 0.854) revealed that our model is stable and has good prediction ability. The OPLS-DA score plot was similar to the PCA score plot, which divided the six Taxus species into six categories. This result also verified that their compositions were different (Figure 6C). Two hundred permutation tests were used for the internal validation of the model to prevent overfitting. The R2 and Q2 values of the six varieties were greater than 0.9 and were higher than the left (negative) of the R2 and Q2 values, indicating that the model and results are reliable without overfitting (Supplementary Figure S5). Therefore, VIP was used to further analyze the differential components of the six Taxus species (Figure 6D). The VIP indicates the contribution of each analyte to distinguishing samples, and the variables with substantial contribution to grouping and VIPs greater than 1.0 were screened as the index (Giuliani, 2017). The following analytes with VIPs greater than 1.0 can be used to distinguish the six different Taxus species: 10-DAB, 10-DAT, ARO, GK, BAC, GC, TAX, TAXOL, QC, EGC, 7-xyl-10-DAT, CE, C, and RT. The above analytes can be applied as potential index components to distinguish the quality of the six different Taxus species.
3.7 RF
The 14 analytes selected by OPLS-DA can be utilized as the chemical components distinguishing the six Taxus species. However, the detection of numerous analytes requires great cost and time. In addition, the data scaling method has a strong effect on the model. RF will not excessively scale the data under the condition of mutual comparison (Zhang et al., 2020). Additional stable components were simplified to simplify the model and distinguish the six Taxus species. The RF model was selected for 100 iterations, ranking the importance of the 14 analytes each time. The cumulative times of each variable in the top Nth positions were obtained in accordance with the importance ranking of the variables in 100 RF model iterations. In Figure 7A, each line represents an analyte, and the line on the left has high characteristic importance, whereas the line on the right has the opposite characteristics. Afterward, the frequency of the variable that is the most important parameter in the 100-iteration modeling process was calculated (Figure 7B). The variable with the highest frequency was EGC, which accumulated 48 times, indicating that this analyte has a remarkable role in distinguishing the six Taxus species. Among other analytes, ARO accumulated 23 times, 7-xyl-10-DAT accumulated nine times, 10-DAB accumulated eight times, GK accumulated seven times, and RT accumulated five times. Therefore, we selected EGC, ARO, 7-xyl-10-DAT, 10-DAB, GK and RT to establish the model and evaluate the feasibility of simplifying the model through FDA.
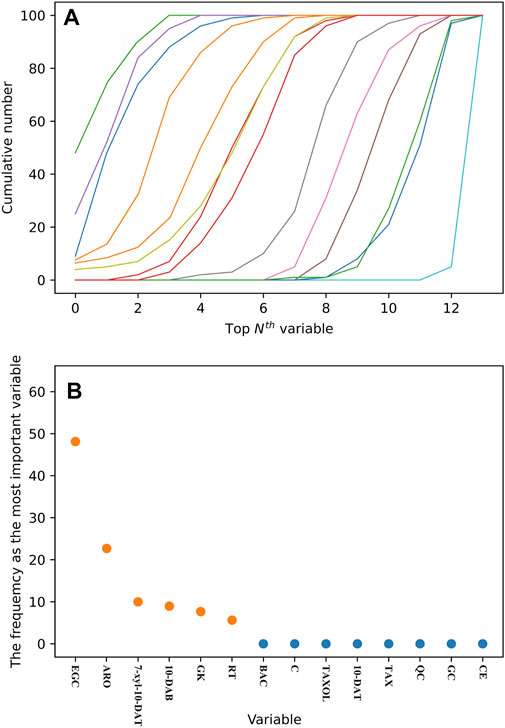
FIGURE 7. Cumulative number of each variable in the top Nth of 100 RF iterative modeling (A). Frequency of the variable as the most important parameter in 100 RF iterative modeling (B).
3.8 External validation by FDA
FDA is a typical pattern discrimination method. We employed FDA to verify the feasibility of classifying six Taxus varieties by using the six analytes, namely, EGC, ARO, 7-xyl-10-DAT, 10-DAB, GK, and RT, selected by RF. The discriminant function was produced in accordance with the content data of the six analytes in the 42 sample batches, as follows: Y(T. mairei) = 0.338 7-xyl-10-DAT + 0.064 GK + 0.027 RT −0.008 ARO + 0.130 10-DAB + 0.006 EGC −68.371; Y(T. chinensis) = 0.317 7-xyl-10-DAT + 0.263 GK + 0.065 RT −0.072 ARO + 0.192 10-DAB + 0.007 EGC −389.484; Y(T. yunnanensis) = 1.065 7-xyl-10-DAT + 0.003 GK + 0.044 RT −0.080 ARO + 0.790 10-DAB −0.016 EGC −512.021; Y(T. wallichiana) = 0.005 7-xyl-10-DAT + 0.002 GK + 0.001 RT + 0.000 ARO + 0.002 10-DAB + 0.001 EGC −1.885; Y(T. cuspidata) = 0.010 7-xyl-10-DAT + 0.043 GK − 0.002 RT + 0.683 ARO + 0.005 10-DAB + 0.024 EGC −187.611; Y(T. media) = 0.042 7-xyl-10-DAT + 0.057 GK + 0.015 RT + 0.480 ARO + 0.044 10-DAB + 0.065 EGC −172.673. Additionally, we selected samples S43–S51 outside the model and determined only the content of the six analytes (the content data results are shown in Table 8) for external validation. The samples of the established model and those outside the model based on the discriminant function of the linear combination of predictive variables were correctly discriminated and classified (Table 9), thus verifying the accuracy and practicality of the simplified model. We compared the differences in the chemical structures of the six analytes from Taxus species. 7-Xyl-10-DAT and 10-DAB were taxoids, and their distinguishing radical pharmacophores were hydroxyl and xylose groups; EGC was a flavanol, and its distinguishing radical pharmacophore was hydroxyl group; ARO was a dihydroflavone, and its distinguishing radical pharmacophore was C-ring α-hydroxyl and B-ring hydroxyl groups; GK was a biflavone, and its distinguishing radical pharmacophores were methoxy and hydroxyl groups; RT was a flavonol, and its distinguishing radical pharmacophores was rutinoside group. In Figure 1, circles mark the distinguishing radical pharmacophores of the compounds.
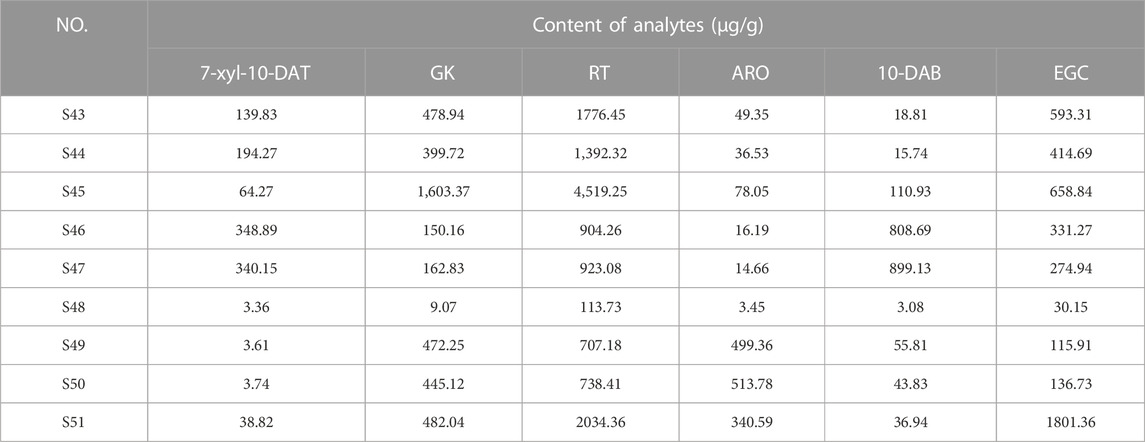
TABLE 8. Externally validated assay data for the FDA model.
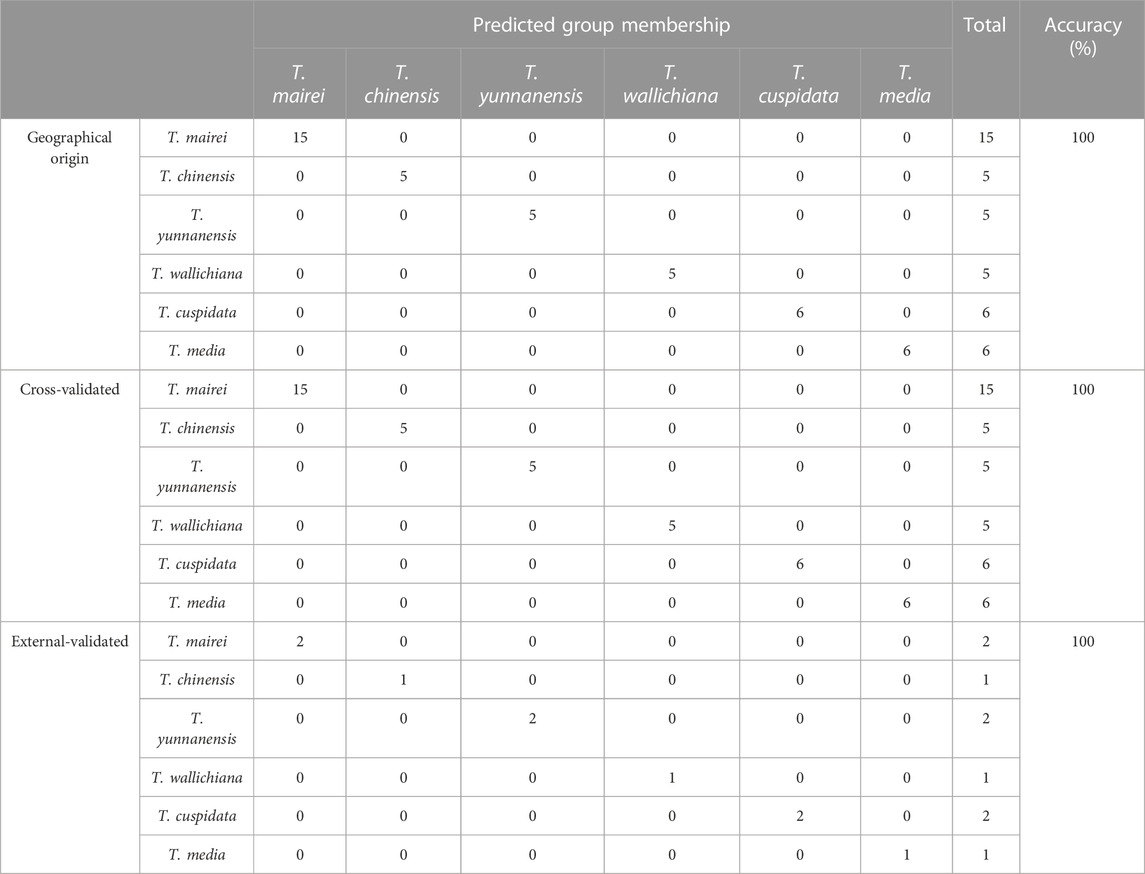
TABLE 9. FDA model classification results.
4 Conclusion
We established a UPLC–MS/MS method for the simultaneous determination of 24 analytes in the leaves of six Taxus species. Methodological verification demonstrated that our method can be used for rapid and accurate analysis. The results of UPLC–MS/MS combined with chemometric analysis revealed that six analytes, namely, EGC, ARO, 7-xyl-10-DAT, 10-DAB, GK, and RT, could be used to distinguish the six Taxus species for quality control. This chemical model can be used as a simple way to distinguish six different Taxus species. The effect of the varieties of these species on the effectiveness of use should be considered, and additional work needs to be done to evaluate and verify the analysis results of our study.
Data availability statement
The original contributions presented in the study are included in the article/Supplementary Material, further inquiries can be directed to the corresponding authors.
Author contributions
QC: construction method, writing manuscript. QS: carry out quantitative analysis. KJ and YL: data processing. YZ and JZ: software, verification. SL and LH: visualization, investigation. QX: sample collection. WX: it provides ideas for this study. MY: writing review and editing. ZH and WX: supervision, fund acquisition. All authors contributed to the article and approved the submitted version.
Funding
This work was financially supported by National Key R&D Program of China (2019YFC1710505); National Natural Science Foundation of China (81872990).
Conflict of interest
Author QX was employed by Fujian South Pharmaceutical Co., Ltd.
The remaining authors declare that the research was conducted in the absence of any commercial or financial relationships that could be construed as a potential conflict of interest.
Publisher’s note
All claims expressed in this article are solely those of the authors and do not necessarily represent those of their affiliated organizations, or those of the publisher, the editors and the reviewers. Any product that may be evaluated in this article, or claim that may be made by its manufacturer, is not guaranteed or endorsed by the publisher.
Supplementary material
The Supplementary Material for this article can be found online at: https://www.frontiersin.org/articles/10.3389/fchem.2023.1193188/full#supplementary-material
References
Cui, H.-C., Zheng, W.-H., Fu, Y.-F., Li, X.-Y., Fu, Y.-J., and Gu, C.-B. (2022). Determination and analysis of seven Taxanes in different Taxus species by HPLC method. For. Eng. 38 (4), 118–124. doi:10.3969/j.issn.1006-8023.2022.04.015
Gai, Q.-Y., Jiao, J., Wang, X., Liu, J., Fu, Y.-J., Lu, Y., et al. (2020). Simultaneous determination of taxoids and flavonoids in twigs and leaves of three Taxus species by UHPLC-MS/MS. J. Pharm. Biomed. Anal. 189, 113456. doi:10.1016/j.jpba.2020.113456
Giuliani, A. (2017). The application of principal component analysis to drug discovery and biomedical data. Drug. Discov. Today. 22 (7), 1069–1076. doi:10.1016/j.drudis.2017.01.005
Gu, Q., Li, Y., Chen, Y., and Ou, T. (2013). Sciadopitysin: Active component from Taxus chinensis for anti-alzheimer's disease. Nat. Prod. Res. 27 (22), 2157–2160. doi:10.1080/14786419.2013.790031
Hafezi, K., Hemmati, A., Abbaszadeh, H., Valizadeh, A., and Makvandi, M. (2020). Anticancer activity and molecular mechanisms of α-conidendrin, a polyphenolic compound present in Taxus yunnanensis, on human breast cancer cell lines. Phytother. Res. 34 (6), 1397–1408. doi:10.1002/ptr.6613
Huang, C.-J., Li, X., and Hu, L.-L. (2018). Analysis of the annual variation of five flavonoids contents in Taxus chinensis var. mairei in Hubei Zhongxiang. Chin. Hosp. Pharm. J. 38 (17), 1788–1791+1800. doi:10.13286/j.cnki.chinhosppharmacyj.2018.17.04
Jolliffe, I., and Cadima, J. (2016). Principal component analysis: A review and recent developments. Philos. Trans. R. Soc. A 374 (2065), 20150202. doi:10.1098/rsta.2015.0202
Li, C.-X., He, Q.-Y., Liu, J., Wang, Y.-C., Xue, B.-B., Tang, Q., et al. (2021). Predictive analysis of quality markers of Coptidis Rhizoma based on network pharmacology and multivariate statistical analysis. Chin. J. Matl. Med. 46 (11), 2718–2727. doi:10.19540/j.cnki.cjcmm.20210125.302
Li, S., Fu, Y., Zu, Y., Sun, R., Wang, Y., Zhang, L., et al. (2009). Determination of paclitaxel and other six taxoids in Taxus species by high-performance liquid chromatography-tandem mass spectrometry. J. Pharm. Biomed. Anal. 49 (1), 81–89. doi:10.1016/j.jpba.2008.10.006
Luo, Y., Wang, C.-Q., Gong, Z.-P., Li, Y.-T., Wang, A.-M., Chen, S.-Y., et al. (2020). Analysis of chemical compositions in Miao Medicine Caesalpinia decapetala by UPLC-Q-TOF-MS/MS. J. China. Pharm. 31 (20), 2481–2486. doi:10.6039/j.issn.1001-0408.2020.20.09
Sharma, H., and Garg, M. (2015). A review of traditional use, phytoconstituents and biological activities of Himalayan yew, Taxus wallichiana. J. Integr. Med. 13 (2), 80–90. doi:10.1016/S2095-4964(15)60161-3
Tan, P., Li, C.-Y., Zhang, C.-E., Zhang, D., and Zhang, H. Z. (2018). Application status and prospect of ultra-performance liquid chromatography inanalysis field of Chinese materia medica. Chin. Tradit. Herb. Drug. 49 (24), 5938–5945. doi:10.7501/j.issn.0253-2670.2018.24.030
Wang, M., Yu, M.-T., Peng, M. M., Yin, Z.-Z., Mao, C.-Q., Su, L.-L., et al. (2022). Quality evaluation of Curcumae Radix from different origins based on UPLC characteristic chromatogram, multicomponent content, and chemometrics. Chin. J. Matl. Med. 47 (11), 2964–2974. doi:10.19540/j.cnki.cjcmm.20210823.301
Wang, T., Zhang, F., Zhuang, W., Shu, X., and Wang, Z. (2019a). Metabolic variations of flavonoids in leaves of T. media and T. mairei obtained by UPLC-ESI-MS/MS. Molecules 24 (18), 3323–3336. doi:10.3390/molecules24183323
Wang, Y.-J., Liu, B.-C., Liu, J., Mo, J.-X., Hu, A.-Q., Liu, J.-Q., et al. (2019b). Identification of chemical components in active fraction of Xiaozhong Zhitong Lotion by UPLC-Q-TOFMS. J. China. Pharm. 30 (23), 3232–3239. doi:10.6039/j.issn.1001-0408.2019.23.12
Weng, H.-B., Han, W.-K., Xiong, Y.-W., Jin, Z.-H., Lan, Z., Lin, C., et al. (2018). Taxus chinensis ameliorates diabetic nephropathy through down-regulating TGF-β1/Smad pathway. Chin. J. Nat. Med. 16 (2), 90–96. doi:10.1016/S1875-5364(18)30034-7
Xu, D.-S., and HeZhong, Y.-J. L.-J. (2021). Research progress in the application of UPLC-QQQ-MS/MS in the analysis of traditional Chinese medicine. Clin. J. Tradit. Chin. Med. 33 (11), 2247–2250. doi:10.16448/j.cjtcm.2021.1149
Yang, L., Zheng, Z.-S., Cheng, F., Ruan, X., Jiang, D.-A., Pan, C.-D., et al. (2016). Seasonal dynamics of metabolites in needles of Taxus wallichiana var. mairei. Molecules 21 (10), 1403–1416. doi:10.3390/molecules21101403
Yi, C.-Y., Zhang, C., Sun, M.-Q., Lin, L., and Liu, J.-X. (2020). Mass spectrometric fragmentation pathways of three ginkgo biloba flavonoids using HPLC-Q-TOF MS. J. Chin. Mass. Spectr. Soc. 41 (01), 57–65. doi:10.7538/zpxb.2019.0011
Zhang, G., Li, Y., Wei, W., Li, J., Li, H., Huang, Y., et al. (2020). Metabolomics combined with multivariate statistical analysis for screening of chemical markers between Gentiana scabra and Gentiana rigescens. Molecules 25 (5), 1228. doi:10.3390/molecules25051228
Zhang, W., Scossa, F., and Fernie, A. (2021). The genomes of Taxus species unveil novel candidates in the biosynthesis of taxoids. Mol. Plant 14 (11), 1773–1775. doi:10.1016/j.molp.2021.08.017
Keywords: Taxus species, taxoids, flavonoids, chemometrics, quality control
Citation: Cai Q, Song Q, Jiang K, Lin Y, Zhang Y, Zhang J, Lin S, Huang L, Xue Q, Huang Z, Xu W, Xu W and Yam MF (2023) Quality evaluation of compounds in leaves of six Taxus species based on UPLC-MS/MS and chemometrics. Front. Chem. 11:1193188. doi: 10.3389/fchem.2023.1193188
Received: 24 March 2023; Accepted: 22 May 2023;
Published: 31 May 2023.
Edited by:
Qasim Alhadidi, Al Yarmouk University College, IraqCopyright © 2023 Cai, Song, Jiang, Lin, Zhang, Zhang, Lin, Huang, Xue, Huang, Xu, Xu and Yam. This is an open-access article distributed under the terms of the Creative Commons Attribution License (CC BY). The use, distribution or reproduction in other forums is permitted, provided the original author(s) and the copyright owner(s) are credited and that the original publication in this journal is cited, in accordance with accepted academic practice. No use, distribution or reproduction is permitted which does not comply with these terms.
*Correspondence: Zehao Huang, aHVhbmd6ZWhhb0BmdWRhbi5lZHUuY24=; Wen Xu, MjAxMjAyOUBmanRjbS5lZHUuY24=; Mun Fei Yam, eWFtbXVuZmVpQHlhaG9vLmNvbQ==
†These authors have contributed equally to this work