 K. Yogalakshmi
 D. Easwaramoorthy
- Department of Mathematics, School of Advanced Sciences, Vellore Institute of Technology, Vellore, Tamil Nadu, India
Perovskite material has gained popularity and attracted much attention in recent years. Calcium Titanium Oxide
1 Introduction
The fractal geometry is a form of mathematical geometry with irregular design that studies complex, self-similar structures and repeating patterns at various scales. In contrast to conventional Euclidean geometry, which works with smooth forms like lines and circles, fractal geometry works with objects that are frequently asymmetrical and broken, but nonetheless show some sort of structure and order. Furthermore, Benoit Mandelbrot formally defined the concept of fractals in 1975, establishing that a fractal is a set whose Hausdorff dimension strictly surpasses its topological dimension. Mandelbrot was also the pioneer in introducing the fractal geometry. The term “fractal”originates from the Latin word “fractus”, which translates to fractured or broken (Addison, 1997; Falconer, 2003; Mandelbrot, 1982). Fractals are typically generated through recursive formulas or iterative processes, where simple mathematical principles are applied repeatedly to develop intricate patterns. Moreover, these objects retain their appearance regardless of the level of magnification, whether zoomed in or out (Barnsley, 1993).
The fractal geometry is particularly useful for analyzing and estimating the intricate properties of natural objects, offering a more nuanced approach than traditional geometric methods. Also, the fractal geometry continues to be a vibrant and growing field that intersects with natural phenomena, computer graphics, art, signal and image processing, science, and engineering. Its exploration has enhanced our comprehension of the complexity inherent present in both mathematical concepts and natural systems. The fractal dimension is a non-integer single-valued, standard measure used to describe fractal structures (Banerjee et al., 2021; Edger, 2013). The fractal dimension is insufficient in the analysis of complex structures used with the fractal concept. Therefore, such an irregular complex structures are characterized using Generalized Fractal Dimensions (GFD) or Renyi Fractal Dimensions. These generalized dimensions are also employed to analyze, classify, and assess complex crystal networks. In this paper, the perovskite crystal structure is examined using GFD method (Thangaraj and Easwaramoorthy, 2022; Uthayakumar and Easwaramoorthy, 2013; Yogalakshmi and Easwaramoorthy, 2024; Yogalakshmi and Easwaramoorthy, 2025).
One of the minerals, Calcium Titanium Oxide or Calcium Titanate
Of these, titanium oxide
Mathematical chemistry is a field that applies mathematical techniques to address challenges in chemistry. A key aspect of this field is chemical graph theory, which focuses on the topological properties of molecular structures, including the mathematical analysis of isomerism and the creation of topological indices or descriptors (Liu et al., 2019; Trinajstic, 1992; Arockiaraj et al., 2024). Topological indices, which remain unchanged under graph isomorphism, are employed to predict a range of features of chemical compounds and nanomaterials, such as viscosity, radius of gyration, and boiling point. Cheminformatics is a growing field that employs QSPR (Quantitative Structure-Property Relationships) and QSAR (Quantitative Structure-Activity Relationships) to assess the biological activity and features of nanomaterials. This method predicts the behavior of chemical compounds by utilizing topological indices and physico-chemical characteristics (Ashraf and Idrees, 2024; Khabyah et al., 2023; Peter et al., 2025; Zuo et al., 2022; Daniel et al., 2025).
Polynomials also have applications in chemistry, similar to topological indices. For instance, the Hosoya polynomial (or Wiener polynomial) is crucial for calculating distance based topological indices. Similarly, the M-polynomial, introduced in 2015, is important for computing various degree based topological indices. The primary benefit of the M-polynomial is the detailed information it provides about degree based graph invariants (Afzal et al., 2020; Chaudhry et al., 2021; Liu et al., 2019; Zuo et al., 2022). Also, first and second reverse Zagreb polynomials and first and second reverse hyper-Zagreb polynomials have been presented to the crystallographic structure of molecules using the reverse degree (Wang et al., 2020).
Dongming Zhao et al. determined reverse degree-based topological indices for polycyclic metal organic networks, specifically TM-TCNB (Zhao et al., 2022). Likewise, Ali Khabyah et al. calculated certain descriptors for two-dimensional coronene fractal structures using reverse degree-based topological indices (Khabyah et al., 2023). In another study, Ali N.A. Koam et al. analyzed various reverse degree-based indices for the sodalite materials network. They also explored the structural behavior of this network, discussed related topological descriptors, and developed numerical equations to model it Koam et al. (2022). Xuewu Zuo et al. have computed topological indices for the molecular structure of polyphenylene using M-polynomials (Zuo et al., 2022). Faryal Chaudhry et al. derived the M-polynomial and topological indices for the tadpole graph and subsequently used the M-polynomial to retrieve numerous topological indices (Chaudhry et al., 2021).
Perovskite materials like calcium titanium oxide
The framework of this study is presented as follows. Section 2 covering the preliminaries required for this research. Section 3 describes the methodology for this study. In Section 4, the general formulae for reverse degree based topological indices using M-polynomials to assess the properties of
2 Preliminaries
This section discusses reverse degree based topological indices, M-polynomial, and generalized fractal dimensions derived from Renyi entropy.
2.1 Reverse degree based topological descriptors
A molecular graph is a basic connected graph in the field of Chemical Graph Theory (CGT), whose atoms are regarded as vertices and bonds as edges. Throughout this work, we will refer to
In (Zhao et al., 2022; Khabyah et al., 2023), the authors developed a topological descriptor or index
Then,
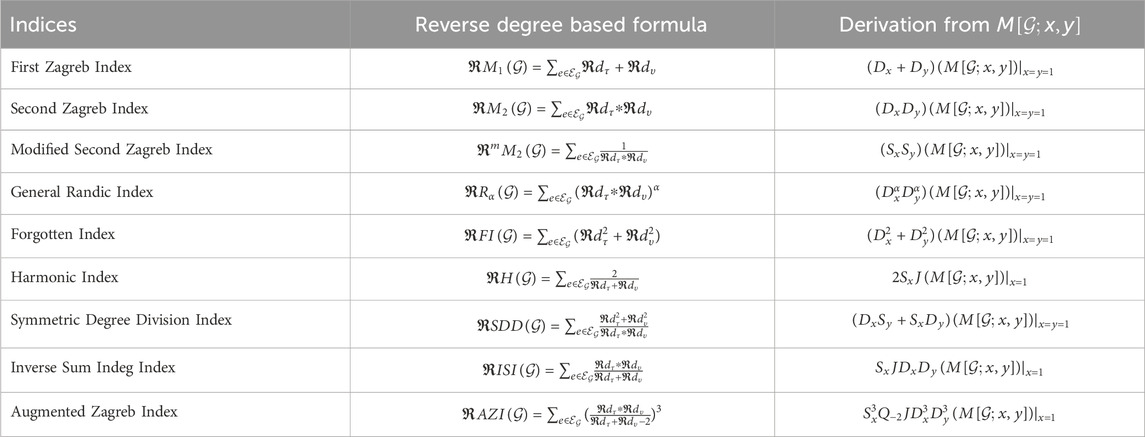
Table 1. Reverse degree dependent topological indices derived from M-polynomial of a graph
2.2 M-polynomial
A graph polynomial is a mathematical tool associated with a graph that generally characterizes the graph in a manner that is invariant under graph isomorphism. In the past, numerous algebraic graph polynomials have been created that can also describe the properties of molecular structures. A robust method for generating topological indices involves in computing the graph polynomial and then using integrals or derivatives of the polynomial at specific points to obtain the topological descriptor. This process is known as the Hosoya polynomial method (Zuo et al., 2022). The M-polynomial functions, similarly to the Hosoya polynomial, yields expressions related to topological indices that depend on vertex degrees. It is considered one of the most effective graph polynomials developed to date. This suggests that by analyzing the M-polynomial for the molecular structure, we can typically derive a closed formula for certain specific indices. For a graph
where
2.3 Renyi entropy based GFD measurements
When calculating Generalized Fractal Dimensions (GFD), Renyi entropy offers a potent framework for describing the multiscale complexity and diverse spatial distributions present in molecular structures. A probability distribution’s diversity or uncertainty is measured in information theory using the Renyi entropy, which is a generalization of the Shannon entropy. It was first presented by Alfred Renyi in 1961, and a non-negative real number
The following defines the Renyi entropy of order
where
Based on Equation 2, the Generalized Fractal Dimensions or Renyi Fractal Dimensions, of order
Here, GFD signifies the Generalized Renyi Entropy.
3 Methodology
3.1 Reverse degree based topological descriptors via M-Polynomial
The M-polynomial is a generating function that provides a unified structure for deriving different topological indices and encodes information about a molecular graph based on reverse degrees. The reverse degrees of the vertices connected by each edge are used to define the M-polynomial. It is constructed by grouping edges based on the reverse degrees of their endpoints and then summing the contributions from each of these edge classes.
This study investigates the three-dimensional structure of
where
The edge partition method separates the total set of edges into multiple groups based on the reverse degrees of their endpoint vertices, allowing for the calculation of indices related to reverse degrees. The partitioning is defined as follows:
The symbol
Using edge partitions based on reverse degrees, the M-polynomial defined in Equation 1 can be reformulated as follows:
where
For instance, when considering the reverse degree based first and second Zagreb indices derived from the M-polynomial,
3.2 Proposed GFD for self-similar
In this section, multifractal analysis is discussed to understand the complexity of the
The following approach is employed to introduce the probability distribution using the general formula for reverse degree based topological indices via the M-polynomial.
Let
Therefore, from Equations 3, 4, the formula for the generalized fractal dimensions, which is based on the reverse degree dependent topological indices via M-polynomial represented by
Using Equation 5, the reverse degree and M-polynomial based GFD can be modified as follows:
4 Main results on topological indices for
In this section, we provide generalized formulae for calculating reverse degree-based topological indices using the M-polynomial of the
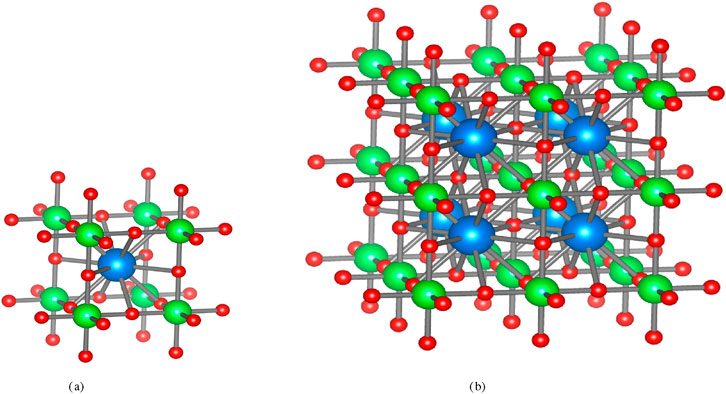
Figure 1. Perovskite crystal structure of
We determined that
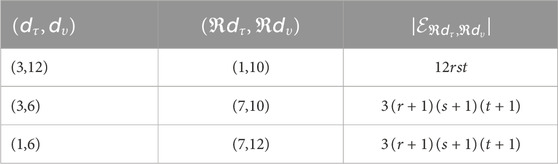
Table 2. Reverse degree based edge partition of
Theorem 1. The M-polynomial of
Proof. From Figure 1, the edge set of
such that
Now
Theorem 2. Let
1.
2.
3.
4.
5.
6.
7.
8.
9.
Proof. By Theorem 1, we have
4.1 First zagreb index
4.2 Second zagreb index
4.3 Modified second zagreb index
4.4 General randic index
4.5 Forgotten index
4.6 Harmonic index
4.7 Symmetric degree division index
4.8 Inverse sum indeg index
4.9 Augmented zagreb index
5 Reverse degree and M-Polynomial based multifractal analysis of
Multifractal Analysis is a specialized area within the dimension theory focused on examining the complexity of sets characterized by invariant local quantities, including Hurst exponents, Hausdorff dimensions, Holder exponents, and correlation dimensions. It serves as a valuable analytical tool for studying nonlinear systems (Brown et al., 1992). Multifractals can be viewed as an extension of fractals. A multifractal object exhibits greater complexity, remaining invariant under translation, while the scaling factor required to discern details varies based on the specific features being observed. A distinctive feature of multifractal analysis is its capacity to capture the self-similarities in the spatial arrangement of textons, essential microstructures in natural images, and information about complex structures. Multifractals have been proven that it is valuable in describing fluid and plasma turbulence, various material structures, crystal formations, and graphics (Mandelbrot, 1982; Saha et al., 2020; Lopes and Betrouni, 2009).
Through multifractal analysis, complex systems that are irregular in shape, amorphous, inhomogeneous, and anisotropic are characterized using geometric and statistical functions. Zinc oxide (ZnO) has been extensively investigated by researchers due to its potential applications in many devices, including electronic devices, pigments, catalysts and UV absorbers. Also, ZnO nanoparticles have been analyzed by the multifractal method. Significant applications, such as systematic categorization of crystal structures and studies on metastable crystallization, have recognized the importance of information-based assessments of structural intricacy (Saha et al., 2020; Lopes and Betrouni, 2009; Dafonte et al., 2015; Wang et al., 2012). This study utilizes a multifractal approach to gain insights into the intricate structures of complex crystals, a method that enables a deeper understanding of the unique characteristics and behaviors of these materials.
Renyi entropy is especially well-suited for capturing the multifractal characteristics of
In this section, by using Equation 6, we calculate generalized fractal dimensions based on some reverse degree indices via M-polynomial. The complete general equations for the GFD of each reverse index are written as statements in Theorem 2. GFD spectra derived from the proposed methodology are used to understand the relative stability of the structures formed at each iteration of the
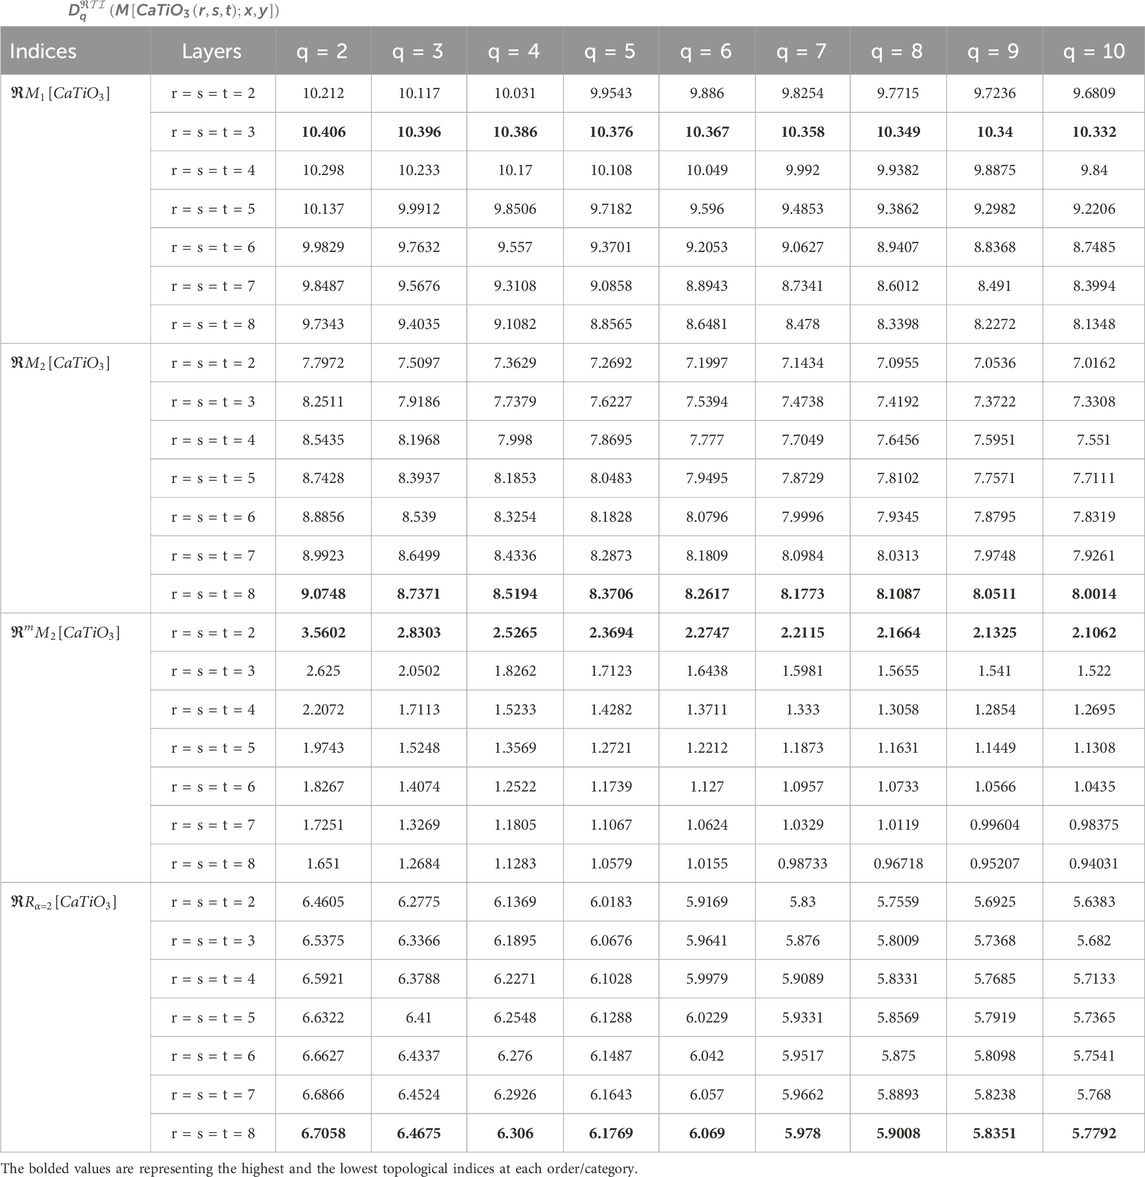
Table 3.
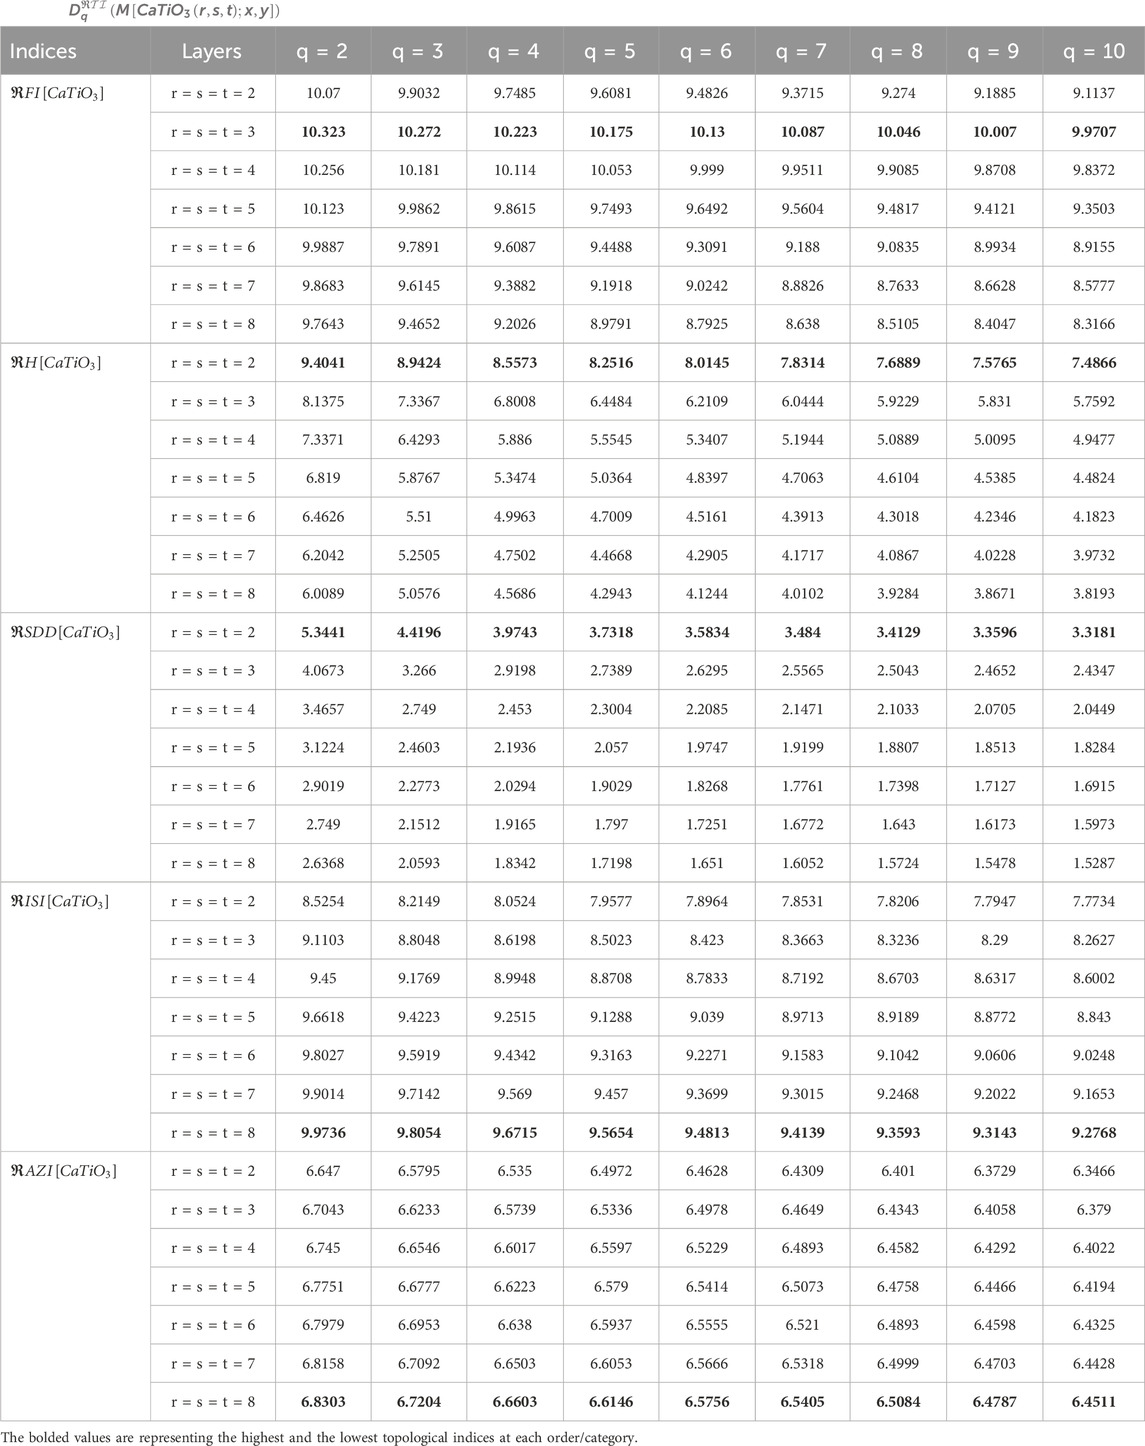
Table 4.
Looking at Tables 3, 4, especially for topological indices such as
On the other hand, the
The analysis of GFD using M-polynomial by reverse degree was conducted based on topological indices for
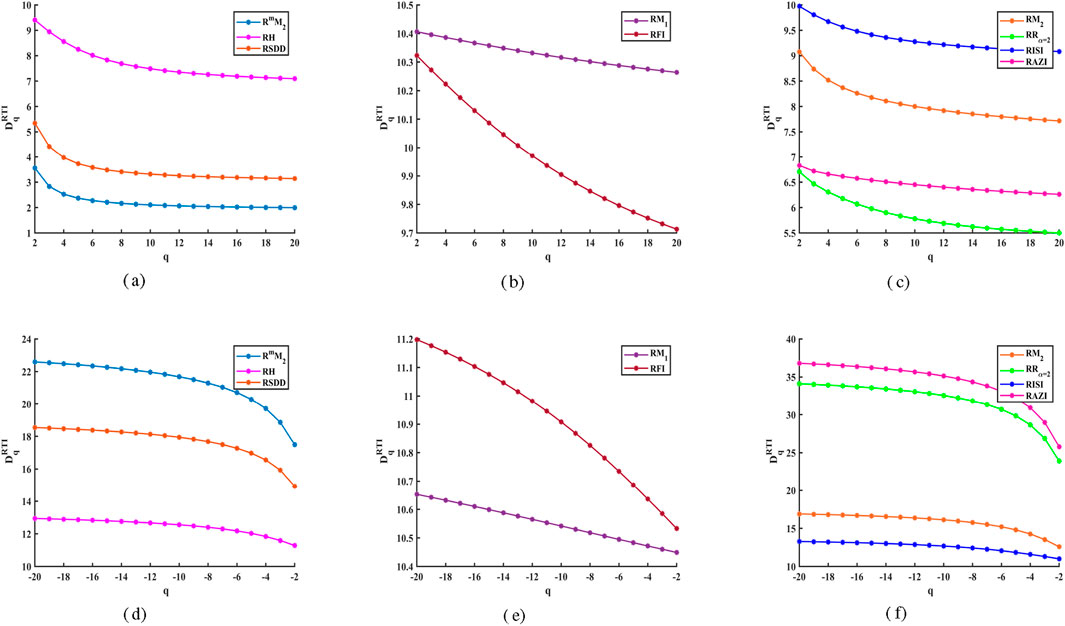
Figure 2. Reverse degree and M-polynomial based GFD values for
Likewise, Figures 2d–f indicate that the GFD curves increase as the negative values of the order
The growth and transformation of crystalline phases are geological phenomena that occur both globally and locally, which can be analyzed through complexity measures using GFD of the
The use of modularity, a fundamental design principle in many inorganic crystal structures, has greatly aided the investigation of structural categorization, relationships, description, and structure prediction. Thus, the concept of maximal simplicity in the modular crystallographic structure of
6 Correlation based predictive analysis on physical properties of
The aim is to present GFD concept based on topological indices, investigate the relationship between these values and the chemical features of compounds, and utilize them in QSPR and QSAR analyzes. We will conduct a correlation analysis on the examined structures to identify key topological indices that most effectively predict physical properties. The Molecular Mass (MM) and Collision Diameter (CD) help to predict its behavior in various applications and to characterize the crystal. Molecular mass provides information about the total mass of the crystal, affecting the density, stability, and reactivity of a crystal during chemical reactions. In thermodynamic calculations, it also contributes to the determination of melting points and phase transitions. Understanding how substances travel through a material and how diffusion occurs inside the crystal structure depends on the collision diameter. Additionally, it clarifies how inter-molecular interactions affect characteristics like heat conductivity and mechanical strength. A limited set of physical and chemical properties of
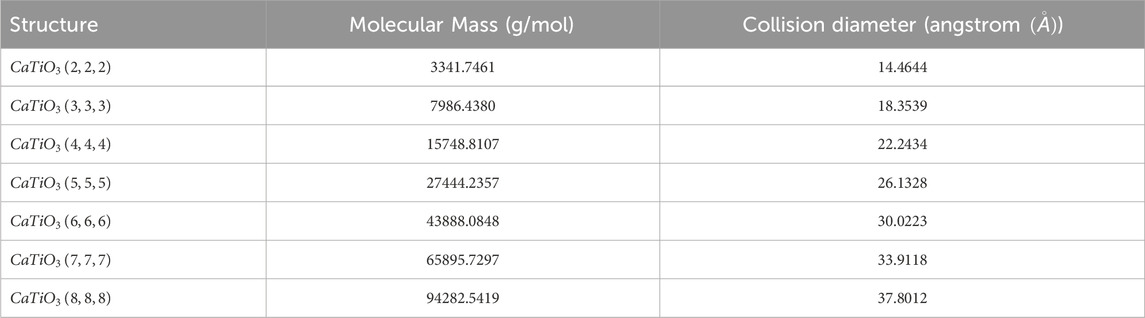
Table 5. Physical properties of
As the iterations of the
Table 6 displays the strength of the relationship between GFD and physical properties of
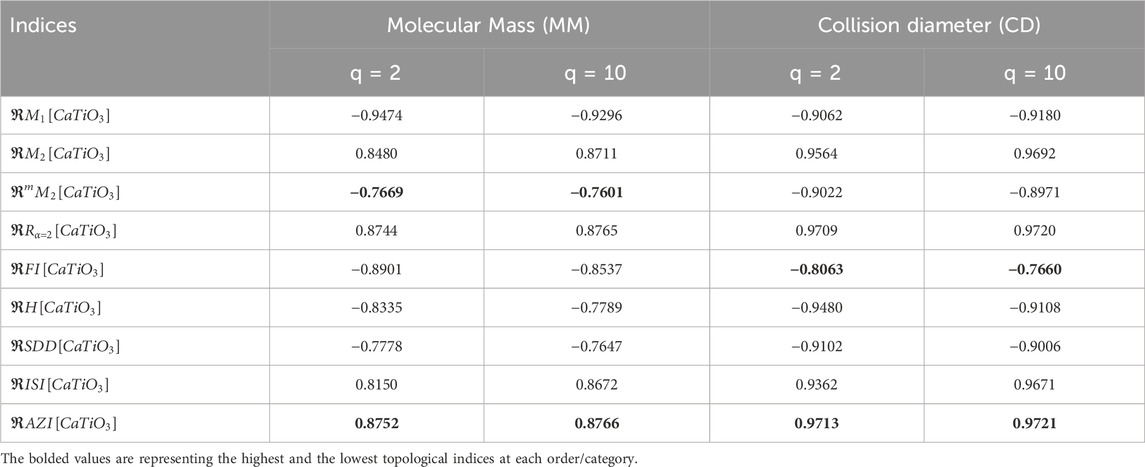
Table 6. Correlation coefficients between physical properties of
A extensive correlation analysis of
Figure 3 presents a linear regression analysis derived from the characteristics of
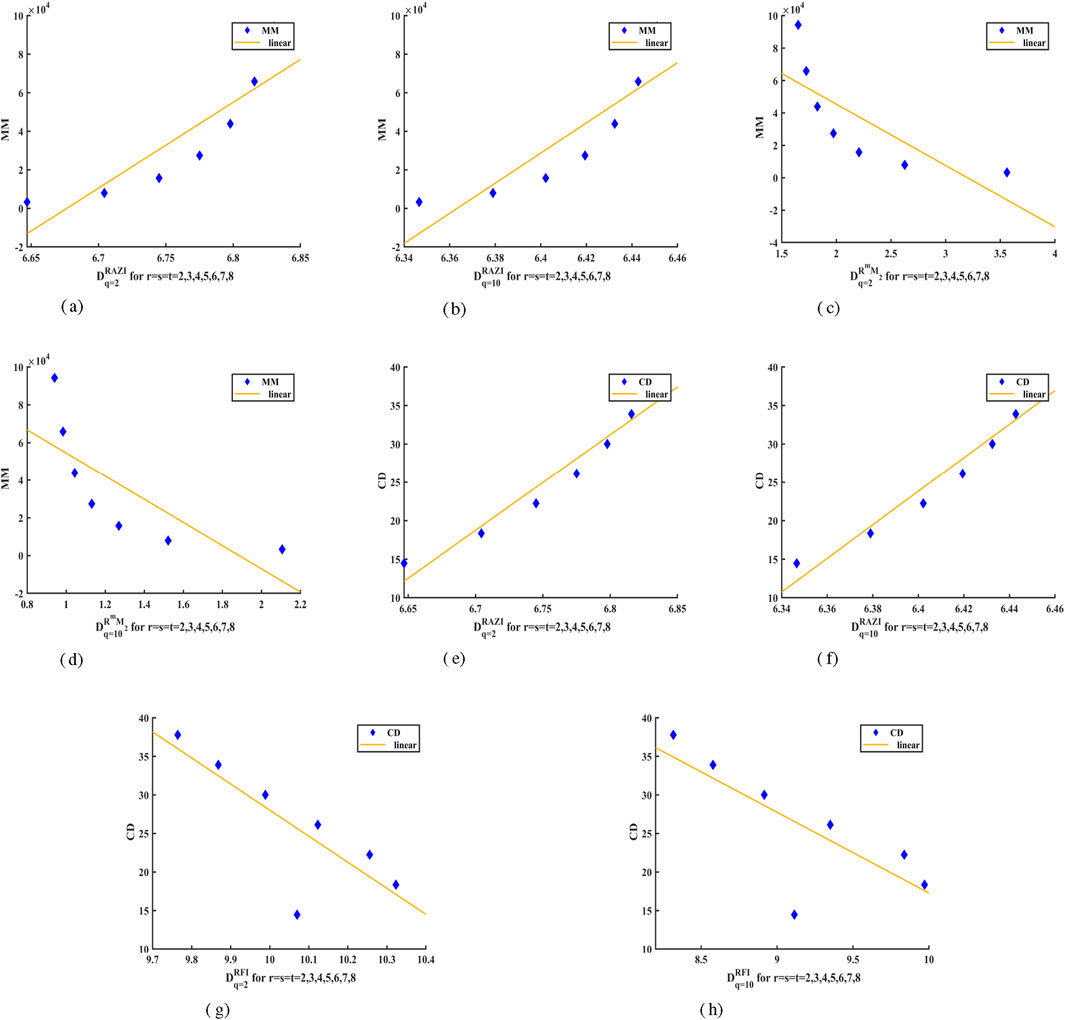
Figure 3. Linear Fitting of GFD values with Properties of
7 Conclusion
In this context, the precise analytical equations are derived for topological descriptors using a graph-theoretic edge partitioning method, focusing on various reverse degree based topological indices through M-polynomial of the
Data availability statement
The original contributions presented in the study are included in the article/supplementary material, further inquiries can be directed to the corresponding author.
Author contributions
KY: Conceptualization, Data curation, Formal Analysis, Investigation, Methodology, Resources, Software, Validation, Visualization, Writing – original draft, Writing – review and editing. DE: Conceptualization, Data curation, Formal Analysis, Funding acquisition, Investigation, Methodology, Project administration, Resources, Software, Supervision, Validation, Visualization, Writing – original draft, Writing – review and editing.
Funding
The author(s) declare that financial support was received for the research and/or publication of this article. This research work is funded by Vellore Institute of Technology, Vellore, Tamil Nadu, India.
Conflict of interest
The authors declare that the research was conducted in the absence of any commercial or financial relationships that could be construed as a potential conflict of interest.
Generative AI statement
The author(s) declare that no Generative AI was used in the creation of this manuscript.
Publisher’s note
All claims expressed in this article are solely those of the authors and do not necessarily represent those of their affiliated organizations, or those of the publisher, the editors and the reviewers. Any product that may be evaluated in this article, or claim that may be made by its manufacturer, is not guaranteed or endorsed by the publisher.
References
Addison, P. S. (1997). Fractals and chaos: an illustrated course. Bristol, United Kingdom: Institute of Physics Publishing.
Afzal, F., Hussain, S., Afzal, D., and Hameed, S. (2020). M-polynomial and topological indices of zigzag edge coronoid fused by starphene. Open Chem. 18, 1362–1369. doi:10.1515/chem-2020-0161
Ali, R., and Yashima, M. (2005). Space group and crystal structure of the perovskite catio3 from 296 to 1720 k. J. Solid State Chem. 178, 2867–2872. doi:10.1016/j.jssc.2005.06.027
Arockiaraj, M., Paul, D., Rahul, M. P., Clement, J., Tigga, S., and Balasubramanian, K. (2024). Topological and entropy indices in qspr studies of n-carbophene covalent organic frameworks. BioNanoScience 14, 2762–2773. doi:10.1007/s12668-024-01546-2
Ashraf, T., and Idrees, N. (2024). Topological indices based vikor assisted multi-criteria decision technique for lung disorders. Front. Chem. 12, 1407911. doi:10.3389/fchem.2024.1407911
Banerjee, S., Easwaramoorthy, D., and Gowrisankar, A. (2021). Fractal functions, dimensions and signal analysis. Springer Cham.
Brown, G., Michon, G., and Peyriere, J. (1992). On the multifractal analysis of measures. J. Stat. Phys. 66, 775–790. doi:10.1007/bf01055700
Chaudhry, F., Husin, M. N., Afzal, F., Afzal, D., Ehsan, M., Cancan, M., et al. (2021). M-polynomials and degree-based topological indices of tadpole graph. J. Discrete Math. Sci. Cryptogr. 24, 2059–2072. doi:10.1080/09720529.2021.1984561
Dafonte, J., Armesto, M. V., Dias, R. D. S., Vazquez, E. V., and Gonzalez, A. P. (2015). Assessment of the spatial variability of soil chemical properties along a transect using multifractal analysis. Cad. Lab. Xeol. Laxe. 38, 11–24. doi:10.17979/cadlaxe.2015.38.0.3580
Daniel, P., Arockiaraj, M., Peter, P., and Clement, J. (2025). Structural analysis of bond information entropy and homo-lumo gap in clo and kfi zeolites. J. Mol. Struct. 1328, 141276. doi:10.1016/j.molstruc.2024.141276
Easwaramoorthy, D., and Uthayakumar, R. (2011). Improved generalized fractal dimensions in the discrimination between healthy and epileptic eeg signals. J. Comput. Sci. 2, 31–38. doi:10.1016/j.jocs.2011.01.001
Falconer, K. (2003). Fractal geometry: mathematical foundations and applications. John Wiley and Sons Ltd.
Garcia-Mendoza, M. F., Torres-Ricardez, R., Ramirez-Morales, E., Alvarez-Ramirez, J. G., Diaz-Flores, L. L., del Angel-Meraz, E., et al. (2023). Catio3 perovskite synthetized by chemical route at low temperatures for application as a photocatalyst for the degradation of methylene blue. J. Mater. Sci. Mater. Electron. 34, 873. doi:10.1007/s10854-023-10309-w
Khabyah, A., Ahmad, A., Azeem, M., Ahmad, Y., and Koam, A. N. (2023). Reverse-degree-based topological indices of two-dimensional coronene fractal structures. Phys. Scr. 99, 015216. doi:10.1088/1402-4896/ad10db
Koam, A. N., Ansari, M. A., Haider, A., Ahmad, A., and Azeem, M. (2022). Topological properties of reverse-degree-based indices for sodalite materials network. Arabian J. Chem. 15, 104160. doi:10.1016/j.arabjc.2022.104160
Kulli, V. R. (2018). Reverse zagreb and reverse hyper-zagreb indices and their polynomials of rhombus silicate networks. Ann. Pure Appl. Math. 16, 47–51. doi:10.22457/apam.v16n1a6
Liu, J. B., Younas, M., Habib, M., Yousaf, M., and Nazeer, W. (2019). M-polynomials and degree-based topological indices of vc5c7[p, q] and hc5c7[p, q] nanotubes. IEEE Access 7, 41125–41132. doi:10.1109/ACCESS.2019.2907667
Lopes, R., and Betrouni, N. (2009). Fractal and multifractal analysis: a review. Med. image Anal. 13, 634–649. doi:10.1016/j.media.2009.05.003
Ng, T. K., Holguin-Lerma, J. A., Kang, C. H., Ashry, I., Zhang, H., Bucci, G., et al. (2021). Group-iii-nitride and halide-perovskite semiconductor gain media for amplified spontaneous emission and lasing applications. J. Phys. D Appl. Phys. 54, 143001. doi:10.1088/1361-6463/abd65a
Peter, P., Clement, J., Arockiaraj, M., and Jacob, K. (2025). Predictive modeling of molecular interaction energies using topological and spectral entropies of zeolite aww. Front. Chem. 13, 1543588. doi:10.3389/fchem.2025.1543588
Ramola, B., Joshi, N. C., Ramola, M., Chhabra, J., and Singh, A. (2019). Green synthesis, characterisations and antimicrobial activities of cao nanoparticles. Orient. J. Chem. 35, 1154–1157. doi:10.13005/ojc/350333
Rizwan, M., Usman, Z., Shakil, M., Gillani, S. S. A., Azeem, S., Jin, H. B., et al. (2020). Electronic and optical behaviour of lanthanum doped catio3 perovskite. Mater. Res. Express 7, 015920. doi:10.1088/2053-1591/ab6802
Saha, R. K., Debanath, M. K., and Saikia, E. (2020). Multifractal analysis of zno nanoparticles. Mater. Sci. Eng. C 106, 110177. doi:10.1016/j.msec.2019.110177
Thangaraj, C., and Easwaramoorthy, D. (2022). Generalized fractal dimensions based comparison analysis of edge detection methods in ct images for estimating the infection of covid-19 disease. Eur. Phys. J. Special Top. 231, 3717–3739. doi:10.1140/epjs/s11734-022-00651-1
Uthayakumar, R., and Easwaramoorthy, D. (2012). Multifractal-wavelet based denoising in the classification of healthy and epileptic eeg signals. Fluctuation Noise Lett. 11, 1250034. doi:10.1142/S0219477512500344
Uthayakumar, R., and Easwaramoorthy, D. (2013). Epileptic seizure detection in eeg signals using multifractal analysis and wavelet transform. Fractals 21, 1350011. doi:10.1142/S0218348X13500114
Wang, D. L., Yu, Z. G., and Anh, V. (2012). Multifractal analysis of complex networks. Chin. Phys. B 21, 080504. doi:10.1088/1674-1056/21/8/080504
Wang, Z., Chaudhry, F., Naseem, M., and Asghar, A. (2020). Reverse zagreb and reverse hyper-zagreb indices for crystallographic structure of molecules. J. Chem. 2020, 1–12. doi:10.1155/2020/9805829
Weon, S., Choi, E., Kim, H., Kim, J. Y., Park, H. J., Kim, S. M., et al. (2018). Active {001} Facet Exposed TiO2 Nanotubes Photocatalyst Filter for Volatile Organic Compounds Removal: From Material Development to Commercial Indoor Air Cleaner Application. Environ. Sci. Technol. 52, 9330–9340. doi:10.1021/acs.est.8b02282
Yogalakshmi, K., and Easwaramoorthy, D. (2024). A new approach for generalized fractal dimensions based on topological indices for pyracyclene and pentahexoctite networks. IEEE Access 12, 166176–166187. doi:10.1109/ACCESS.2024.3489218
Yogalakshmi, K., and Easwaramoorthy, D. (2025). Estimation of fractal dimension for self-similar and molecular networks using topological indices. Arabian J. Math., 1–24. doi:10.1007/s40065-025-00516-0
Zhao, D., Chu, Y. M., Siddiqui, M. K., Ali, K., Nasir, M., Younas, M. T., et al. (2022). On reverse degree based topological indices of polycyclic metal organic network. Polycycl. Aromat. Compd. 42, 4386–4403. doi:10.1080/10406638.2021.1891105
Keywords: fractal analysis, generalized fractal dimensions, topological indices, edge partition technique, reverse degree, CaTiO3 perovskite crystal
Citation: Yogalakshmi K and Easwaramoorthy D (2025) Multifractal based topological characterization of perovskite crystal and predictive analysis on its physical properties. Front. Chem. 13:1639522. doi: 10.3389/fchem.2025.1639522
Received: 02 June 2025; Accepted: 08 July 2025;
Published: 04 August 2025.
Edited by:
Hong Fang, Rutgers University Camden, United StatesReviewed by:
Wakeel Ahmed, University of Sialkot, PakistanNagesh H. M., PES University - Electronic City Campus, India
Copyright © 2025 Yogalakshmi and Easwaramoorthy. This is an open-access article distributed under the terms of the Creative Commons Attribution License (CC BY). The use, distribution or reproduction in other forums is permitted, provided the original author(s) and the copyright owner(s) are credited and that the original publication in this journal is cited, in accordance with accepted academic practice. No use, distribution or reproduction is permitted which does not comply with these terms.
*Correspondence: D. Easwaramoorthy, ZWFzYW5ka0BnbWFpbC5jb20=, ZWFzd2FyQHZpdC5hYy5pbg==