 Flora Giudicepietro1
 Antonietta M. Esposito1*
 Laura Spina2
 Andrea Cannata3,4
 Daniele Morgavi5
 Lukas Layer1,6,7
 Giovanni Macedonio1
- 1Istituto Nazionale di Geofisica e Vulcanologia, Osservatorio Vesuviano, Napoli, Italy
- 2Istituto Nazionale di Geofisica e Vulcanologia, Sezione di Roma1, Roma, Italy
- 3Istituto Nazionale di Geofisica e Vulcanologia, Osservatorio Etneo-Sezione di Catania, Catania, Italy
- 4Università degli Studi di Catania, Dipartimento di Scienze Biologiche, Geologiche e Ambientali, Catania, Italy
- 5Università degli Studi di Perugia, Dipartimento di Fisica e Geologia, Perugia, Italy
- 6Università degli Studi di Napoli “Federico II”, Napoli, Italy
- 7Istituto Nazionale di Fisica Nucleare, Sezione di Padova, Padova, Italy
The analogue experiments that produce seismo-acoustic events are relevant for understanding the degassing processes of a volcanic system. The aim of this work is to design an unsupervised neural network for clustering experimental seismo-acoustic events in order to investigate the possible cause-effect relationships between the obtained signals and the processes. We focused on two tasks: 1) identify an appropriate strategy for parameterizing experimental seismo-acoustic events recorded during analogue experiments devoted to the study of degassing behavior at basaltic volcanoes; 2) define the set up of the selected neural network, the Self-Organizing Map (SOM), suitable for clustering the features extracted from the experimental events. The seismo-acoustic events were generated using an ad hoc experimental setup under different physical conditions of the analogue magma (variable viscosity), injected gas flux (variable flux velocity) and conduit surface (variable surface roughness). We tested the SOMs ability to group the experimental seismo-acoustic events generated under controlled conditions and conduit geometry of the analogue volcanic system. We used 616 seismo-acoustic events characterized by different analogue magma viscosity (10, 100, 1000 Pa s), gas flux (5, 10, 30, 60, 90, 120, 150, 180 × 10−3 l/s) and conduit roughness (i.e. different fractal dimension corresponding to 2, 2.18, 2.99). We parameterized the seismo-acoustic events in the frequency domain by applying the Linear Predictive Coding to both accelerometric and acoustic signals generated by the dynamics of various degassing regimes, and in the time domain, applying a waveform function. Then we applied the SOM algorithm to cluster the feature vectors extracted from the seismo-acoustic data through the parameterization phase, and identified four main clusters. The results were consistent with the experimental findings on the role of viscosity, flux velocity and conduit roughness on the degassing regime. The neural network is capable to separate events generated under different experimental conditions. This suggests that the SOM is appropriate for clustering natural events such as the seismo-acoustic transients accompanying Strombolian explosions and that the adopted parameterization strategy may be suitable to extract the significant features of the seismo-acoustic (and/or infrasound) signals linked to the physical conditions of the volcanic system.
Introduction
In recent years, neural networks have been increasingly used thanks to the rapid progress of computer performances and the continuous growth of digital data worldwide, which are difficult to analyze with traditional search and classification methods. In the field of geophysics and volcanology, both supervised and unsupervised neural networks have been used in many applications, including tasks for the classification and recognition of seismic signals in volcanic (Carniel, 1996; Del Pezzo et al., 2003; Scarpetta et al., 2005; Ersoy et al., 2007; Langer et al., 2009; Messina and Langer, 2011; Esposito et al., 2013a; Carniel et al., 2013; Unglert et al., 2016; Burzynski et al., 2018; Ren et al., 2020; Watson, 2020) and tectonic (Köhler et al., 2009; Giudicepietro et al., 2017) environments, analysis of petrographic patterns (Esposito et al., 2020a; Esposito et al., 2020b), predictive analysis of seismicity (Esposito et al., 2014) and radon emissions (Ambrosino et al., 2020). In particular, among unsupervised neural networks, the Self-Organizing Map (SOM) is suitable for the discrimination of seismic signals generated by different sources in a composite seismic wavefield. For instance, several neural network based methods have been applied to study the seismicity of Stromboli (Esposito et al., 2006a, Esposito et al., 2008; Esposito et al., 2013b, Esposito et al., 2018), that is an example of seismo-acoustic wavefield dominated by signals produced by different sources linked to the degassing through a basaltic magma. More in general, the seismic and acoustic wavefield of an open conduit volcano might be originated from a wide spectrum of processes; unsupervised neural networks are fundamental for discriminating different sources of signals. Noteworthy, the investigation of seismo-acoustic transients, related to unsteady explosive activity, is known to provide fundamental information on the degassing dynamics also at other volcanoes such as Erebus (Rowe et al., 2000; Johnson et al., 2008) and Yasur (Spina et al., 2015; Capponi et al., 2016; Simons et al., 2020).
In parallel, analogue models of volcanic degassing have been developed to better understand the dynamics of open conduit volcanoes and define the elastic signature of magma-gas interaction with the volcanic conduit (e.g. James et al., 2004; James et al., 2006; Arciniega-Ceballous et al., 2014; Spina et al., 2018; Spina et al., 2019). Indeed, the laboratory approach offers the advantage of controlling physical properties and the thermodynamic state of the investigated systems. This is convenient for investigating physical processes whose controlling parameters are inaccessible to direct observation, as in a volcanic environment. The potentiality of constraining subsurface degassing dynamics by laboratory experiments on accurately scaled two-phase analogue systems has induced a flourishing number of literature studies focusing on the source of acoustic events (e.g. Vidal et al., 2006; Vidal et al., 2009; Divoux et al., 2008; Kobayashi et al., 2010; Lyons et al., 2013) or on the seismic signature of the ascent of volcanic gas slugs (e.g. James et al., 2004; James et al., 2006) and of the fragmentation processes (Arciniega-Ceballos et al., 2014; Arciniega-Ceballos et al., 2015). Moving from the evidence that conduit discontinuities are specific sites where pressure and momentum changes in the fluid are effectively coupled to the Earth (Chouet and Matoza, 2013 and references therein), Spina et al. (2019) assessed the effect of cross-sectional changes in the conduit geometry (in terms of irregularity of the conduit surface) and of physical properties on radiated seismic and acoustic signals. Noteworthy, cross-sectional changes of conduit shape are expected to result from the coupling between conduit shape and volcanic flow (Macedonio et al., 1994).
Innovative approaches to data analysis such as machine learning are important for studying the signals produced by analogue experiments. Actually, these data analysis techniques help to discover the relationships between experimental data and physical processes. The main objective of this work is to identify data preprocessing and clustering techniques capable to highlight a similarity among signals obtained from experiments featuring analogous starting conditions. In this way, the data similarity must reflect the activity of similar source processes, establishing a link between the signals that we can record and the physical processes that generate them, which in the case of natural systems are unknown. In this work, we apply a SOM based method for clustering a dataset of experimental events obtained through a novel experimental protocol described in Spina et al. (2019) suitable to investigate the seismo-acoustic signals generated at different experimental conditions (gas flux and liquid viscosity), taking into account analogue conduits with different extent of roughness of the internal wall. The dataset used in this work was produced by analogue experiments aimed at investigating the interplay among surface irregularity of the conduit, physical properties of the analogue magma in a range of viscosities and gas flux representative of basaltic systems (Spina et al., 2018, Spina et al., 2019).
Initially, we used two well established signal preprocessing approaches (Del Pezzo et al., 2003; Scarpetta et al., 2005) to extract the appropriate features to represent in a compressed form the significant characteristics of the signals such as the spectral content and the temporal evolution of the waveform. Then, we designed a SOM to group the experimental events. The results indicate that we are able to discriminate between analogue events generated under different experimental conditions, and thus this methodology may be applicable to volcanic datasets.
Materials and Methods
The Experimental Setup
The experimental setup for generating seismo-acoustic events (Figure 1) is fully described in Spina et al. (2018), Spina et al. (2019) and consists of two main parts: 1) the analogue volcano that reproduces volcanic degassing phenomena, and 2) the sensor system, used to measure the seismo-acoustic signals, i.e. the elastic energy radiated by the degassing processes.
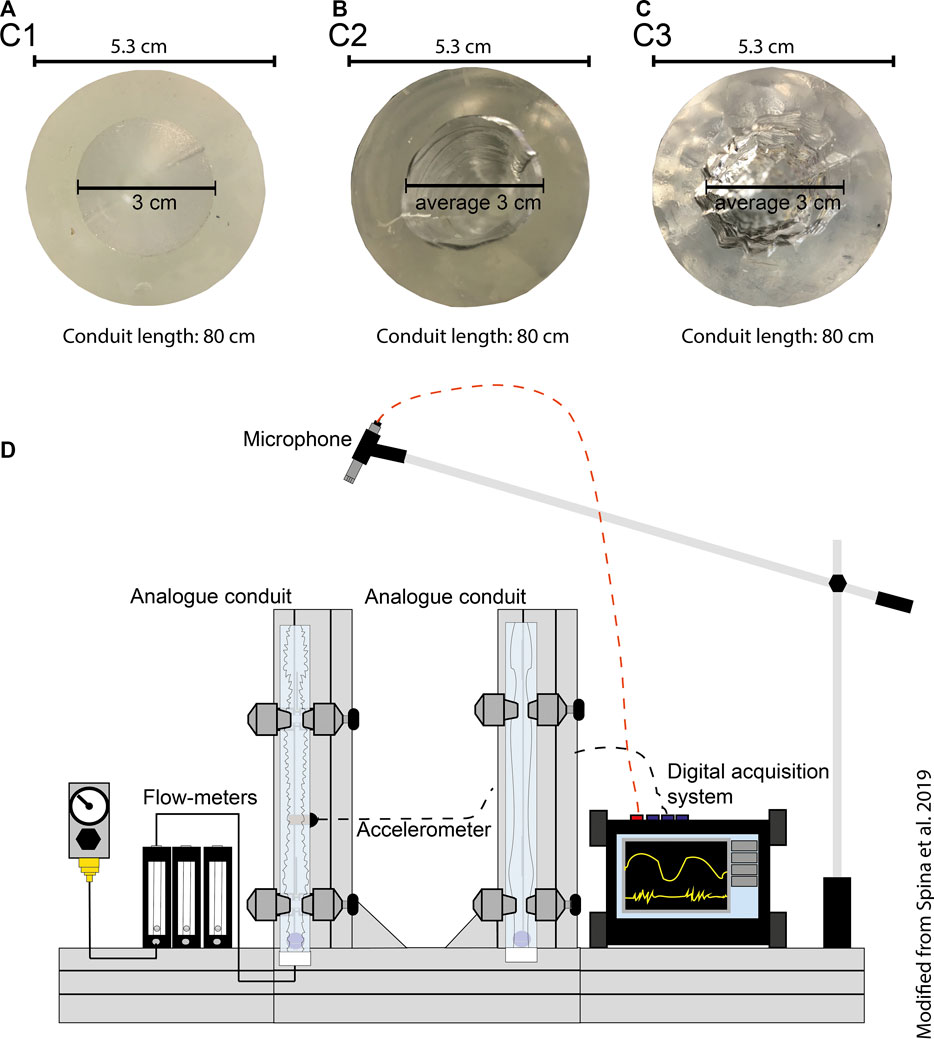
FIGURE 1. (A–C) Top pictures of the analogue conduits SM (FD = 2), F1 (FD = 2.18) and F2 (FD = 2.99), respectively. (D) Simplified sketch of the experimental device (not to scale; modified from Spina et al., 2019). The tubes shown in (D) are 80 cm high. Modified from Spina et al. (2019).
Part (1) is made up of a compressor system, connected to a set of flow-meters and injecting the air-gas into an epoxy conduit with a mean diameter of 3 cm and length of 80 cm. In order to investigate the role of conduit irregularity, a novel technique was developed to build epoxy conduits with different fractal dimension (FD) of the internal surface. Three conduits were used to carry out the experiments: a smooth cylinder (SM, FD = 2), and two cylinders with increasing extent of roughness of the internal wall (F1 and F2, FD = 2.18 and 2.99 respectively). The conduits were filled with silicone (Wacker©) oils as an analogue for magma, with viscosities in the range 101–103 Pa s and density of 970 kg/m3.
The sensor system mainly consists of a ceramic shear accelerometer ICP J352C33 model (PCB Piezotronics) with a sensitivity of 0.1 V/g in the band 0.5–10,000 Hz, and a microphone ICP 378B02 model (PCB Piezotronics) with a sensitivity of 50 mV/Pa in the band 7–10,000 Hz (±1 dB). The digital acquisition system is a DAS50 (SEFRAM) with four channels and sampling rate up to 1 MHz. In our case signals are sampled at 50 kHz. Since the accelerometer and microphone have slightly different frequency responses (e.g. the lower frequency limit is different) both seismic and acoustic signals were band-pass filtered in the range 10–10,000 Hz, interval of common flat response of accelerometer and microphone. A video-camera (25 fps) allowed observation of the degassing regimes through the optically clear analogue magma and link them with the recorded seismo-acoustic signal.
The Dataset
The dataset used in this work includes 616 experimental seismo-acoustic events generated under different experimental conditions. Each event is represented by a seismic recording and by an acoustic recording; therefore our dataset consists of 616 pairs of seismic and acoustic signal records (1232 files in total).
Three parameters were systematically changed to investigate the variability of the seismo-acoustic signals with different degassing states: the roughness of the epoxy conduits (SM, F1 and F2), the viscosity of the analogue magma (10, 100 and 1000 Pa s) and the air flow rate (5, 10, 30, 60, 90, 120, 150, 180 × 10–3 l/s). Figure 2 shows two examples of seismo-acoustic signals. The first (Figure 2A) was generated using the smooth experimental conduit (SM), analogue magma with viscosity of 10 Pa s and a flow rate of 120 × 10–3 l/s. The second one (Figure 2B) was also generated with viscosity of 10 Pa s and a flow rate of 120 × 10–3 l/s, but using a F2-type experimental conduit.
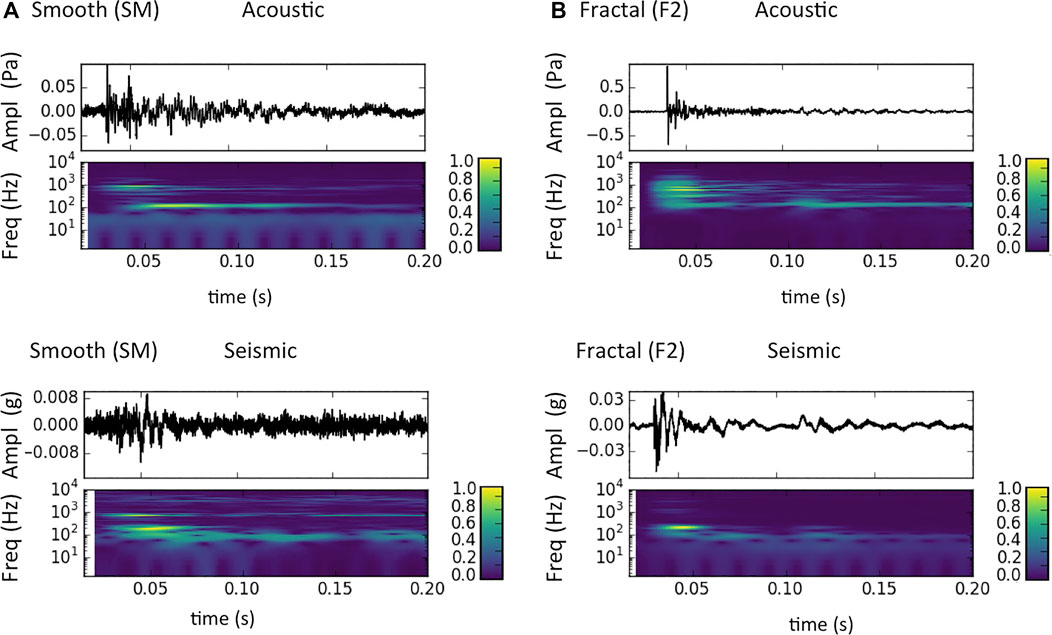
FIGURE 2. Comparison between the raw signal and the spectrogram of a seismo-acoustic event generated with a smooth SM-type conduit, viscosity = 10 Pa s, flow velocity = 120 × 10–3 l/s (A), and an event generated with a F2-type conduit, viscosity = 10 Pa s, flow velocity = 120 × 10–3 l/s (B).
The seismo-acoustic transients collected in the dataset were recorded during different degassing regimes, from bubbly flow (i.e. bubbles passively transported in the analogue magma) to slug regime (i.e. individual conduit-filling bubbles) to churn-annular flow (i.e. the gas phase is able to support the upward movement of the liquid along the conduit wall).
Feature Extraction Methods
The feature extraction (data preprocessing) is an important phase that precedes the application of the SOM neural network for the clustering. It provides an alternative data representation by removing redundant information and identifying the significant ones that uniquely describe them. In this way a compact and robust coding is obtained. There are several methods to do this, which depend on the particular application and its complexity degree. The crucial aspect is to choose the features that are relevant for the examined task. In our case, in order to select the most appropriate features, we took into account the information usually considered by analysts for the signal discrimination, i.e. the signal spectral content and waveform, in the frequency and time domain respectively. Then, to feature extraction techniques we relied on the good results obtained in Del Pezzo et al. (2003), Scarpetta et al. (2005), Esposito et al., (2006a), by using the Linear Predictive Coding (LPC) technique (Makhoul, 1975; Marple, 1980) for the frequency information and a waveform parametrization, for the amplitude-versus-time information, respectively. The advantage of using LPC over raw spectra is that LPC provides a more compressed representation of frequency content information. This aspect was discussed in Del Pezzo et al. (2003).
LPC is a widely used method in the speech recognition field to extract compact spectral features from audio signals, which are acoustic signals just like those considered in this work. However, it has also been successfully applied in the geophysical and volcanological fields (Esposito et al., 2013a; Giudicepietro et al., 2017; Esposito et al., 2018). In particular, the features extracted with the LPC were given in input both to unsupervised neural networks, such as the Self-Organizing Map (SOM) (Esposito et al., 2006a, Esposito et al., 2006b; Masiello et al., 2006), and supervised neural networks, such as the Multi-Layer Perceptron (MLP) (Del Pezzo et al., 2003; Scarpetta et al., 2005; Giudicepietro et al., 2017; Esposito et al., 2018). Therefore, we decided to use this technique following the good results provided in the previously mentioned works.
LPC predicts a signal sample through a linear combination of its previous samples:
where
The waveform parametrization (WP) is performed by a function defined as the normalized difference between the maximum and minimum signal amplitude computed in an arbitrary duration window. In Scarpetta et al. (2005) it was shown that the addition of this feature as further information on the data led to an improvement in the performance of the neural network up to 5% (reaching 100% in some experiments aimed at the classification of seismic signals at Mt. Vesuvius) compared to the performance obtained using only the LPC features.
Waveform parametrization is expressed as:
where
In general, the choice of the features used to represent the data can influence the results of the final clustering; for this reason this choice is critical for the good neural network performance. We chose the above described preprocessing methods because we are confident of their appropriateness for feature extraction on the basis of good results obtained in the previous cited works (Del Pezzo et al., 2003; Scarpetta et al., 2005; Esposito et al., 2006a; Esposito et al., 2018).
Self-Organizing Map (SOM)
SOM (Kohonen et al., 1996) is a special class of unsupervised artificial neural network (ANN) extensively used as a clustering and visualization tool in exploratory data analysis. In general, when a large data set is available and no information about which similarity measure is more appropriate to group them, then it may be useful to apply an unsupervised technique. Classic methods of cluster analysis often make assumptions regarding linearity, normal distribution or intrinsic clustering relationships in the data. For these reasons, they can fail for data with a complex structure.
Contrary to classical methods, the main advantages of using the SOM technique are that it does not require any a-priori assumption on the data structure and it is able to manage large data sets with high-dimension inputs to detect patterns and isolated structures in the data. Moreover, it provides an easy visualization and interpretation of the results.
SOM performs a nonlinear mapping of the input space into a two-dimensional grid, called map, by preserving the topological and metric relationships of the data. This makes the SOM an effective method to visualize the similarity and the distances between the input vectors.
The SOM architecture has typically two layers, the input and the output one, with the nodes of the input layer directly connected to those of the output layer (Figure 3). Nodes in the output layer are arranged in a topological structure, usually a bi-dimensional grid, since it is generally agreed that a two-dimensional map provides a better representation of the clusters.
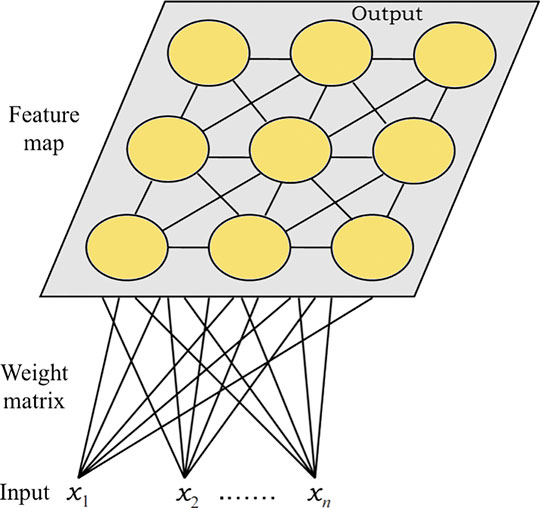
FIGURE 3. Example of the architecture of a Self-Organizing Map. The network has two layers: the input and the output layer, with the nodes of the input layer directly connected to those of the output layer.
Usually, the network topology is divided into two factors: the local lattice structure and the global map shape. The first one can be rectangular or hexagonal. In the rectangular one each internal node has four neighbors, while in the hexagonal one six. Hence, the hexagonal structure is usually preferred since it displays greater variance in neighborhood size. The global map shape instead can be sheet, cylinder or toroid. In our experiment, we used a SOM map with a local hexagonal structure (Figure 4A) and a global toroid shape (Figure 4B) visualized as a sheet to get a better interpretation of the obtained clusters.
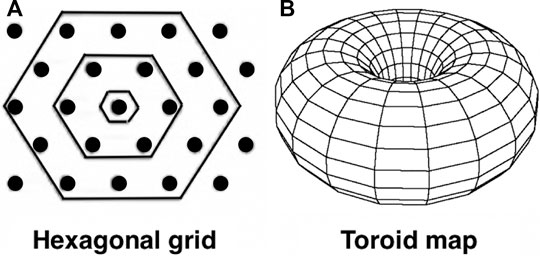
FIGURE 4. Examples of a local hexagonal lattice structure (A), and a global toroid map shape (B). In this article the toroid shape, visualized as sheet, is used (see Results section).
The SOM algorithm is unsupervised: this means that the network tries to discover the hidden relationships in the data by applying a competitive learning rule where the output nodes compete among themselves for representing the vectors of the input space. In this competition only the node whose weight vector is most similar to the input vector will be the winner or the Best Matching Unit (BMU). To find the BMU, in each training step, the distances between an input vector, chosen randomly, and all the weight vectors of the SOM are computed by using the Euclidean distance method, as suggested by Kohonen et al. (1996). After finding the BMU, the prototype of the winning node is updated toward the input vector and also the prototypes of the neighborhood nodes are adjusted (cooperative aspect) in a way that depends on the neighborhood function. We adopted a Gaussian neighborhood function. The learning rate, which controls the intensity of the attraction of the input vector, and the neighborhood radius, which controls the number of vectors attracted other than the winning node, depend on the Gaussian function. The learning rate and the neighborhood radius are time-dependent functions and their values decrease during the training phase. At the end of the iterative process, there is the convergence phase in which the prototypes of the different nodes reach their final values and the final map is obtained.
In this work, the SOM parameter were chosen according to the SOM toolbox for Matlab (http://www.cis.hut.fi/somtoolbox/, last accessed 25 October, 2020) and Kohonen et al. (1996).
Results
Data Preprocessing
Before extracting the features from the accelerometric and acoustic data produced during the experimental events, we cut the recordings using a standard Short Time Average/Long Time Average trigger algorithm (STA/LTA; e.g. Allen, 1978; Withers et al., 1998; Trnkoczy, 2012) to have a uniform criterion to generate the signal windows for preprocessing and analysis. Actually, the purpose of our study is not to develop an automatic system, but to discover the fingerprints of the degassing processes in seismo-acoustic signals; therefore the automatic procedure is used only to facilitate the picking of the event onsets.
We performed the automatic trigger of the events (Figure 5) using a classic STA/LTA algorithm (length of short time window = 0.01 s, length of long time window = 0.1 s, trigger on threshold = 2.5), included in the Python toolbox Obspy (Krischer et al., 2015). The STA/LTA was applied on the acoustic signals, and, each time an acoustic event was identified, 0.03 s windows of both acoustic and accelerometric signals (starting 0.002 s before each trigger time) were extracted. Although the microphone and accelerometer are located at different positions in the setup, their short distance (∼60 cm) allows for a delay time on the order of 10−3 s, which is by far smaller than events recurrence time (Figure 11 in Spina et al., 2019) and of the selected signal windows. Accordingly, we are confident that triggered seismic and acoustic signals share the same source. Thus, we obtained a dataset of 616 events, each composed by seismic and acoustic recordings of 1500 samples (both signals being sampled at 50,000 samples per second). Finally, we parameterized the events in the frequency domain, through LPC, and in the time domain, through the waveform function described above (WP).
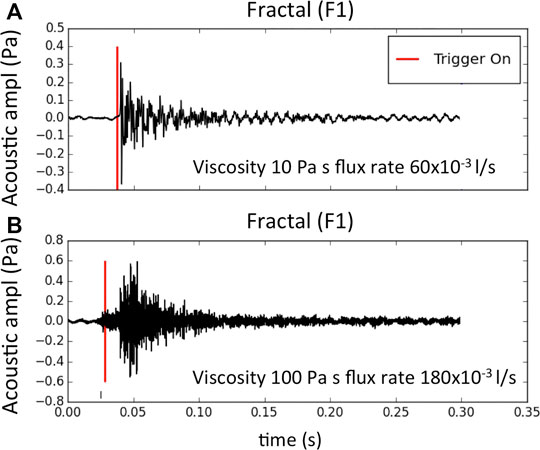
FIGURE 5. Examples of automatic picking of two acoustic events by STA/LTA algorithm. Both events were generated with a F1 fractal roughness conduit but with different viscosity and flux rate conditions. For the event in plot (A) viscosity = 10 Pa s and flux rate = 60 × 10−3 l/s; for event in plot (B) viscosity = 100 Pa s and flux rate = 180 × 10−3 l/s.
By using the librosa python library (McFee et al., 2015), we applied the LPC algorithm to extract the spectral content features. We made several experiments using a different number of windows and finally we found that the most appropriate solution to encode the LPC features of our data was to use a single 1024-sample length window for each signal, in order to correctly represent even the lower frequency events. So, we calculated the LPC on one signal window (first 1024 sample), extracting 46 LPC coefficients for each window. We chose the number of LPC coefficients as a trade-off between an adequate encoding of the spectral content and the compactness of the information. Thus, we encode the spectral content features of the experimental events with 46 features for each one of the seismic and acoustic signals.
For the waveform parameterization, we used only the acoustic signal features and we chose a 50 sample-long window, so obtaining 30 parameters from each 1500 sample-long recording. In order to avoid undesirable effects due to the automatic trigger of the signals that in different events can result in different pre-event signal segment, we sorted the waveform parameterization features in descending order. Finally, we took only the first 20 of these features, neglecting the queue which is less representative of the sorted signal. Therefore the waveform parameterization results in a 20-dimensional feature vector for each type of signal, acoustic and seismic. In this way the acoustic and seismic signals were encoded using for each of them 46 LPC features and 20 WP features. Finally, we combine the LPC features and the waveform parameterization (WP) of the acoustic signal obtaining the input vector of 46 + 46 + 20 = 112 features for each experimental event.
To scale the amplitude of the features extracted from acoustic and seismic signals, which are different in size and units of measurement (Figure 6A), we applied a feature scaling-normalization and obtained input vectors such as the one shown in Figure 6B.
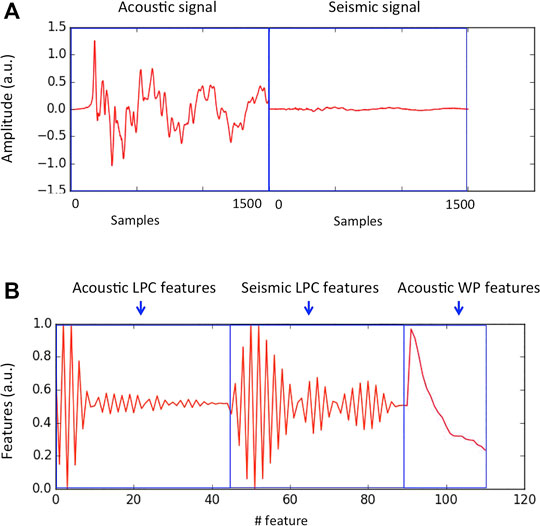
FIGURE 6. (A) Acoustic and seismic signals of an experimental event; (B) input vector with the features extracted from the acoustic and seismic signals.
SOM Clustering
In this study, we chose a SOM with a local hexagonal structure (Figure 4A) and a toroid shape (Figure 4B). The map size depends on the specific application. A “right number of nodes” does not exists, it depends on the detail one wants to have with the generated clusters. In our case we chose a map size of 14 × 8 nodes based on the number of events in the dataset. The map has 112 (14 × 8) nodes and the dataset contains 616 events, so we considered the ratio 616/112 = 5.5 that is a good compromise for data clustering.
Figure 7A shows the SOM map obtained on the examined dataset. The yellow hexagons indicate the non-empty nodes. Their size is proportional to the number, or data density, of input vectors, which fall in each of them. The numbers on the outside of the map (Figure 7A) indicate the order or numbering of the nodes on the map, that is, from top to bottom and from right to left. For some significant nodes the number is also reported inside the yellow hexagon.
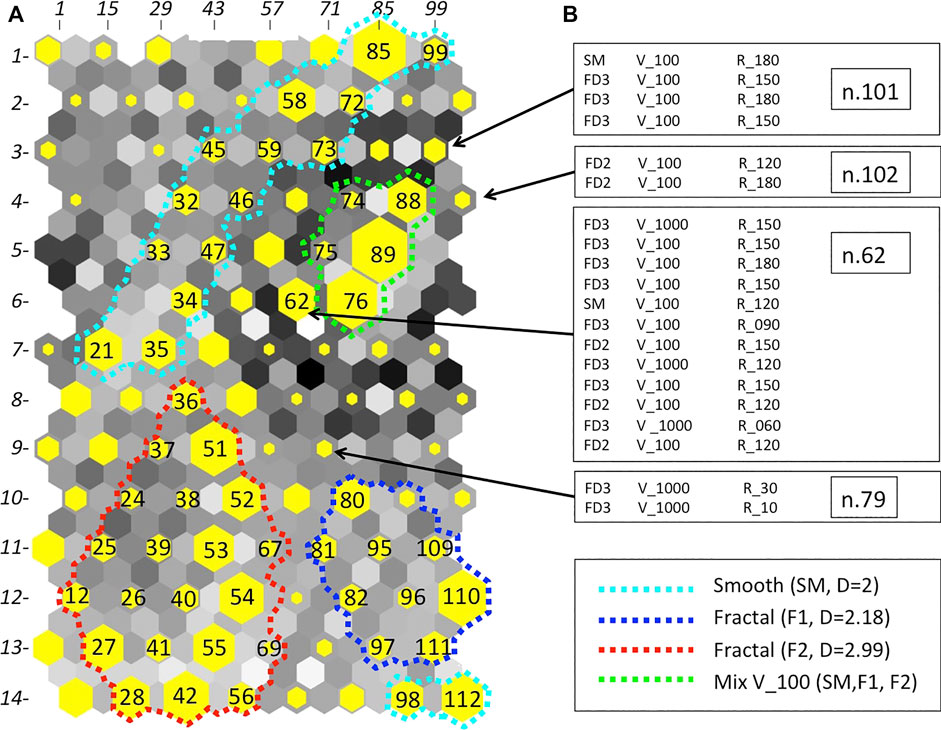
FIGURE 7. (A) The SOM Map with 14 × 8 = 112 nodes. Not-empty nodes are shown as yellow hexagons and their size represents the data density. The numbers on the outside of the map indicate the numbering of the nodes that is also reported in some significant nodes. The gray hexagons interposed between the yellow ones indicate the Euclidean distance between the nodes according to a gray scale. Cluster 1 (cyan), Cluster 2 (blue), Cluster 3 (red) and Cluster 4 (green) are highlighted by dotted outlines. On the right (B) the compositions of nodes n.62, n.79, n.101 and n.102 are shown. The labels SM, F1 and F2 indicate SM (smooth), F1 (FD = 2.18) and F2 (FD = 2.99) conduit roughness, respectively. The number preceded by V indicates the viscosity in Pa s and the number preceded by R indicates the gas flow rate in 10−3 l/s.
The gray hexagons among the yellow ones are not real nodes and are used to represent the Euclidean distances between the nodes according to a gray scale. Also the empty nodes, i.e. those that do not contain any input vector, are filled according to the Euclidean distance gray scale. White or light gray indicates that neighborhood nodes are similar to each other and therefore may belong to the same cluster. Dark gray or black mark a clear separation between the nodes. In this way a visual qualitative measure of the cluster structure discovered by the SOM is possible, which allows identifying areas where the nodes are more similar to each other.
Following this qualitative approach and based on the analysis of the content of each node, on the SOM in Figure 7A we identify four main areas of nodes more similar to each other or four main clusters that we represent on the map with different colors. The clusters are mainly characterized by the degree of roughness of the conduit and by the viscosity of the analogue magma. The cyan dotted line in Figure 7A marks the Cluster 1 (130 events) that groups events that were generated mainly with smooth conduit (SM) and an analogue magma viscosity of 10 Pa s. Cluster 2 (63 events) is delimited by a blue dotted line and mainly includes events generated in experiments with a F1 conduit and an analogue magma viscosity of 10 Pa s. It also includes some nodes that are at the bottom of the map. This is because we used a toroidal map, so the upper and lower part and the right and left one are to be considered united. In Figure 7A we displayed the map as a two-dimensional sheet to allow an easy interpretation of the results. Cluster 3 (176 events), surrounded by a red dotted line, mainly groups events generated in experiments with a F2 conduit and an analogue magma viscosity of 10 Pa s. Finally, Cluster 4 (66 events), delimitated by a magenta dotted line, mainly contains events generated in experiments with analogue magma viscosity of 100 Pa s. This cluster also includes most of the events generated with a viscosity of 1000 Pa s, which are relatively few in the dataset because the increase in analogue magma viscosity dramatically decreases the number of events (Spina et al., 2019). In fact, the time elapsed between consecutive explosions positively correlates with viscosity both in volcanoes environment (Dominiguez et al., 2016) and in our laboratory experiments (Spina et al., 2019). The roughness of the conduit relating to the events of Cluster 4 is mixed; indeed the cluster contains events generated with SM, F1 and F2 conduit roughness. This result suggests that in low viscosity experiments, e.g. 10 Pa s, the conduit roughness signature in the seismo-acoustic signals is clear, whereas in the experiments conducted with higher viscosity (e.g. 100 or 1000 Pa s) the conduit roughness imprint is less distinguishable in the signal features and the effect of viscosity prevails. However, in some nodes there are events produced with high viscosity (100 or 1000 Pa s) that were characterized by a prevailing type of conduit roughness. This is the case of the nodes 62, 79, 101 and 102 shown in Figure 7B. For the analysis of the other nodes, see the Supplementary Material, which contains the results of all the nodes of the SOM map.
Analyzing the distribution of the flux rate (5, 10, 30, 60, 120, 150, 180 × 10−3 l/s) for all the nodes of the four main clusters we find that it is less characterizing than the distribution of the analogue magma viscosity and the conduit roughness. However, we can note that in Cluster 4 the low flux rate classes (5, 10, 30 × 10−3 l/s) are missing. Furthermore, the few experimental events characterized by viscosity of 100 Pa s in Cluster 2 (most of the events that fall into this cluster were generated in experiments with analogue magma viscosity of 10 Pa s) systematically exhibit flux rate equal or below 60 × 10−3 l/s.
Figure 8 shows a summary of the distribution of experimental events of the four main clusters in the analogue magma viscosity (Figure 8A,D,G,J), conduit roughness (Figure 8B,E,H,K) and flux rate (Figure 8C,F,I,L) classes. An overall picture of the distribution of the 435 events contained in the four main clusters with respect to the different classes of conduit roughness, viscosity and gas flow rate is shown in Figure 9. We can see that seismo-acoustic signals produced in experiments conducted with low analogue magma viscosity (10 Pa s) are separated into Clusters 1 (cyan), 2 (blue) and 3 (red), which are characterized by different degrees of conduit roughness (SM, F2 and F3, respectively), whereas the events generated in high viscosity condition (100 Pa s and a few examples with 1000 Pa s), belonging to Cluster 4 (green), are distributed in all three conduit roughness classes (SM, F2 and F3). Furthermore, most of the events that fall into Cluster 4 were generated with flow rate > = 60 × 10−3 l/s.
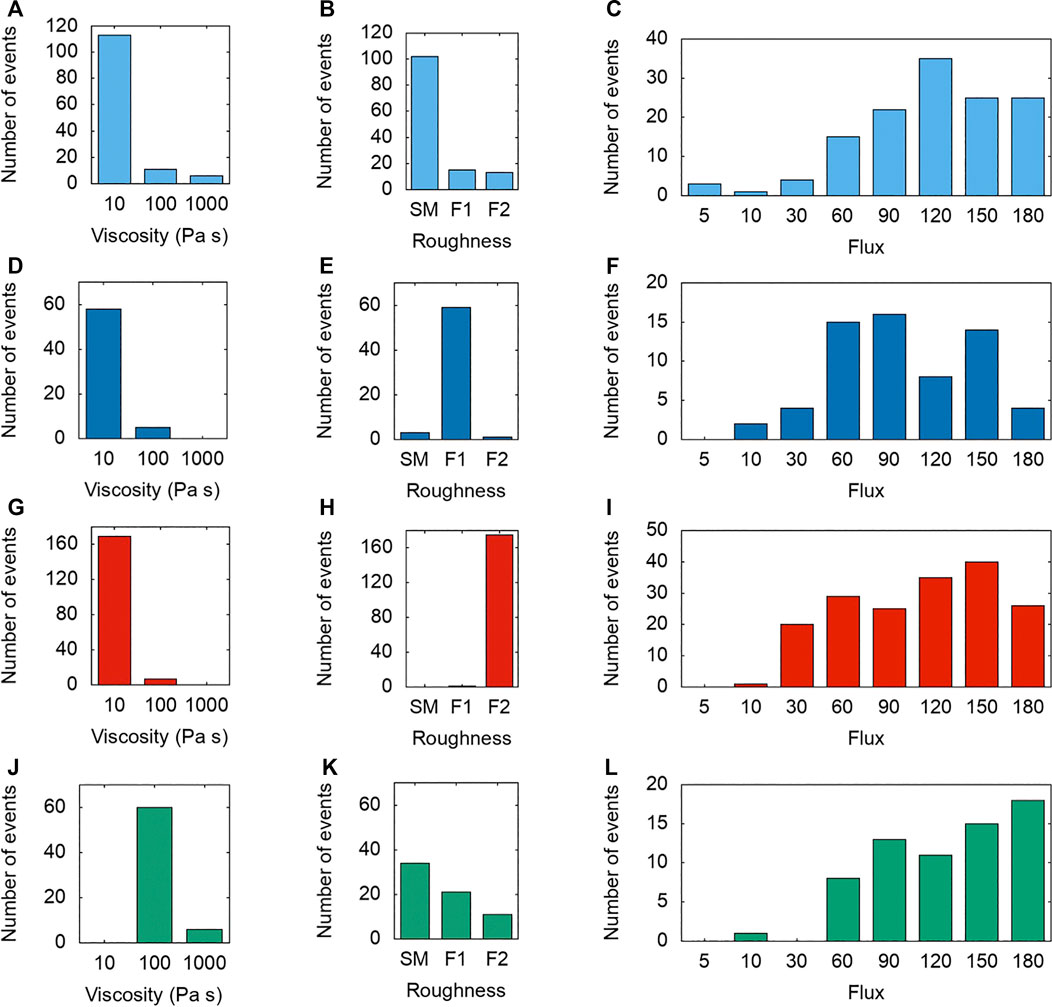
FIGURE 8. Histograms of the distribution of Cluster 1 (cyan), Cluster 2 (blue), Cluster 3 (red) and Cluster 4 (green) events in the analogue magma viscosity, analogue conduit roughness and flux rate classes. Plots (A), (D), (G), and (J) show the distribution of events belonging to the four clusters in the classes of viscosity, expressed in Pa s (B), (E), (H), and (K) represent the conduit roughness classes (SM: smooth; F1: FD = 2.18; F2: FD = 2.99). The flux rate (expressed in 10–3 l/s) histograms are shown in (C), (F), (I), and (L) plots.
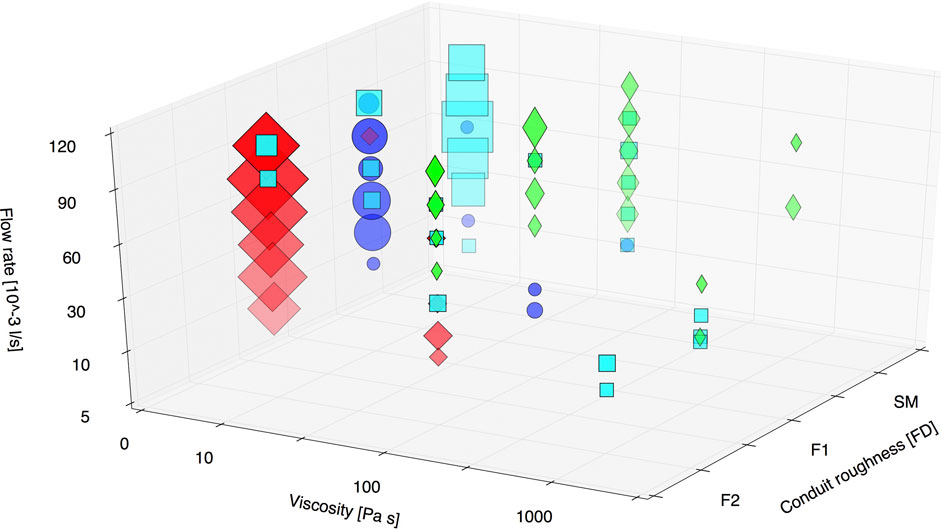
FIGURE 9. Overall picture of the distribution of events belonging to the four main clusters with respect to the viscosity of the analogue magma, roughness of the analogue conduit and the flow rate. Cluster 1 is indicated in cyan (squares), Cluster 2 in blue (circles), Cluster 3 in red (diamond) and Cluster 4 in green (thin diamond). The size of the squares is proportional to the number of events that share the same viscosity, roughness and flux values and belong to the same cluster.
Discussion
In the present work, we applied SOM to perform the analysis of experimental events and investigate the links between seismo-acoustic signals and their source processes, which in the case of analogue experiments are known and controlled. In this way, we benefit of joint information deriving from an efficient seismo-acoustic signal clustering method and the experiments conducted under controlled physical conditions. This approach can help us to increase our understanding of the degassing processes from basaltic open conduit systems and of their elastic markers. For this reason, we developed a parameterization strategy of seismo-acoustic experimental signals inspired by the one we have successfully used to cluster natural events (Ham et al., 1999; Del Pezzo et al., 2003; Esposito et al., 2007; Esposito et al., 2013a; Giudicepietro et al., 2017; Esposito et al., 2018; Nuha et al., 2019), but with appropriate modifications to better extract the features of the experimental data. Furthermore, we chose to jointly use the acoustic and seismic information that together cover the radiation emitted by the entire process of rising in the conduit and bursting to the free surface of the gas bubbles.
For the extraction of features, we used the LPC, which provides a compressed representation of the signal in the frequency domain of the seismic and acoustic recordings of each event. We have also adopted a parameterization in the time domain using a waveform function and rearranging the features in descending order, in order to avoid the problems related to the picking of the onset of the seismo-acoustic transients. This waveform parameterization technique, used for the first time to extract features for a seismic event classification problem applied to Mt. Vesuvius data, improved by 5% the performance obtained with this method (Scarpetta et al., 2005).
Experimental results of the degassing pattern have shown that at constant viscosity the increase in gas flux rate generates progressively longer and less-spaced slug bubbles which, at a given threshold of flux rate, merge leading to the transition from slug flow to churn-annular flow (e.g. Fabre and Linè, 1992; Paglianti et al., 1996). All the same, at medium-low gas flux rate an increase in liquid viscosity favors the coalescence of bubbles and the transition from slug flow to churn-annular flow (e.g. Pioli et al., 2012; Spina et al., 2019).
Based on the analysis of our SOM map, we identified four main clusters (Figure 7A) characterized by events generated under different experimental conditions, highlighting differences in the degassing patterns. In particular, most of the events of Cluster 1 are generated in experiments with low viscosity magma and smooth conduit and are associated with elongated slugs (Figure 10A). Notably, the few cases exhibiting a viscosity of 100 Pa s are characterized by relatively low gas flow rate (<60 × 10−3 l/s). Most of the events included in Clusters 2 and 3 were also generated in low viscosity conditions (10 Pa s), but they are clearly separated according to the roughness of the conduit which for Cluster 2 is of type F1 (FD = 2.18), whereas for Cluster 3 it is of type F2 (FD = 2.99). On the opposite, events of Cluster 4 are characterized by higher analogue magma viscosity (100 Pa s and few cases with 1000 Pa s) and gas flux generally above the threshold of 60 × 10−3 l/s. The degassing pattern in such cases is mostly represented by a chain of over-pressurized slugs that tend to coalesce with an irregular profile, suggesting the onset of churn-annular flow (Figure 10B). Increasing the viscosity of the liquid phase, the threshold of gas flux rate marking the transition between degassing regimes decreases (e.g. Pioli et al., 2012). Hence, the clusters associating 10 Pa s events (Cluster 1, 2, 3) and the one (Cluster 4) that groups high viscosity (100–1000 Pa s) and moderate to high gas flux events might actually reflect different degassing regimes, i.e. slug or churn-annular flow. Moreover, the features of the seismic and acoustic signals can be influenced by the flow regime that is generated in the experiment, which can be determined by different combination of viscosity of the analogue magma and gas flow rate. This can explain the characteristics of the events generated with different analogue magma viscosity and grouped in the same cluster.
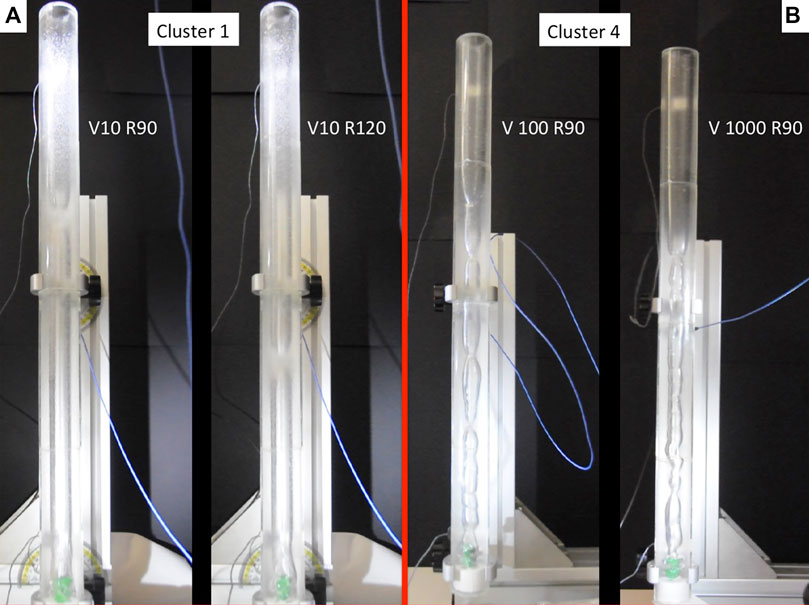
FIGURE 10. Examples of images of the experiments that generated events belonging to Cluster 1 (A) and Cluster 4 (B). V indicates the analogue magma viscosity in Pa s and R indicates the gas flow rate in 10−3 l/s. The tubes in the picture are 80 cm high and are smooth.
Notably, gas flow rate and viscosity are the main controlling factors in determining the transition between different degassing patterns (e.g. Pioli et al., 2012). Clustering of seismo-acoustic events, here performed, demonstrated that different degassing regimes are clearly linked to different features of the radiated elastic energy, with fundamental implications for monitoring purposes.
The clustering results suggest also that the viscosity of the liquid, where gas flows through, plays an important role in determining the features of the seismic and acoustic signals generated by such a gas uprising. Lyons et al. (2013) also found that fluid viscosity plays a major role in controlling the character of seismic and acoustic source generation. The same conclusion was reached by Clarke et al. (2019), who recorded in laboratory acoustic emissions, resulting from fracturing and fluid depressurization through the fractured rock. They concluded how the viscosity of volcanic fluids may affect the spectral content of the volcano seismicity. Actually, magma viscosity is a factor that significantly affects the eruptive style of volcanoes (e.g. Cassidy et al., 2018). Also field studies have shown that the waveform and spectral characteristics of the seismic signals acquired on volcanoes are influenced by the properties of the fluids filling the plumbing system (e.g. Kumagai and Chouet, 2000; Kumagai et al., 2002; Ichihara et al., 2013). This relationship between magma properties and explosive mechanisms is also highlighted by studies conducted at Stromboli volcano (Esposito et al., 2008; Giudicepietro et al., 2019; Giudicepietro et al., 2020; Witsil and Johnson, 2020), which is considered a natural laboratory for this type of activity, where the characteristics of the seismic signals produced by the explosions are influenced by the physical properties of the magma, e.g. gas content. However, our experiments show that the SOM map also identifies clusters (e.g. Cluster 1 Cluster 2 and Cluster 3) characterized by the prevalence of events generated with a specific analogue conduit roughness (e. g. smooth, fractal FD = 2.18 and fractal FD = 2.99). As mentioned above, the roughness of the conduit seemed to be a most prominent feature for clustering in low viscosity runs (10 Pa s). Basing on image analysis only (evaluation of slug velocity and rate), Spina et al. (2019) has also hypothesized a more dominant effect of conduit roughness at 10 Pa s compared to higher viscosity runs (10 and 1000 Pa s). In fact, the effect of conduit roughness is predominant in the inertia driven regime (i.e. for significant high values of superficial gas to liquid velocity ratio) and for higher values of two phase gas flux and gas content (Shannak, 2008; Bhagwat and Ghajar, 2016). This is promising to better understand the contribution of conduit roughness in natural systems.
The method tested in this article can be applied to seismic and/or acoustic events recorded in other laboratory experiments in order to analyze the characteristics of the produced data and their similarities. The necessary requirement to apply the method to other laboratory experiments is that the data are similar to those here examined and the dataset is composed of a sufficient number of events. Moreover, this method can easily be applied to analyze naturally recorded seismic and acoustic events, appropriately scaling the duration of the signal windows and the other parameters. Of course, experimental data are simple signals compared to real world observations. For example they lack of seismo-acoustic coupling, whereas acoustic wave propagation is known to couple into the seismic wavefield (e.g., Jolly et al., 2017; Matoza et al., 2019). These characteristics must be taken into account when addressing the feature extraction strategy of real signals. It is worth noting that each experiment was performed under steady conditions, in terms of conduit roughness, analogue magma viscosity and air flow rate, while on volcanoes such parameters can be space- and time-dependent. For instance, the material filling the conduit is assumed to be stratified, with a high-viscosity layer of melt in the uppermost part, whose features can gradually evolve in time (e.g. Lautze and Houghton, 2005; Capponi et al., 2016). In spite of these differences between laboratory experiments and real volcanoes, the findings of this work suggest how seismo-acoustic signals can contain plenty of information about the conditions of the uppermost part of the plumbing system and its variations over time.
Conclusion
In this work we present an application of the unsupervised SOM network on a dataset of experimental events obtained under different physical conditions. For the first time SOM network are used on an analogue experimental data set in order to better understand the relationship between degassing behavior and seismo-acoustic signals. The seismo-acoustic signals have been obtained by varying three parameters: the roughness of the epoxy conduits (SM, F1 and F2), the viscosity of the analogue magma (10, 100 and 1000 Pa s) and the gas flow rate (5, 10, 30, 60, 90, 120, 150, 180 × 10–3 l/s). An automatic trigger technique has been applied to identify the events. In order to group the data, we have first performed a processing phase in which the events have been represented through a 112-feature vectors encoding both spectral, by using the LPC method, and time (WP) information from seismo-acoustic event pairs generated by experimental runs, conducted under different physical conditions, and included in the dataset (616 pairs). The obtained feature vectors became the input of the selected neural network, the SOM, to perform clustering. The SOM is a projection technique able to identify and visualize at the same time on a bi-dimensional plane the hidden structure of the data. The results are very promising as the SOM was capable to separate events generated with low viscosity analogue magma from those generated with high viscosity magma and to discriminate among those generated with different roughness of the conduit. The promising results obtained from the data generated by the analogue experiments demonstrate that the method could be a valuable tool in volcano monitoring to provide interpretative tool on clustering that can be obtained on real data. Moreover, our study confirms that seismic and acoustic signals recorded on volcanoes can provide insights into the characteristics of the fluids in the plumbing system and their temporal evolution. In particular, viscosity, which most affects the clustering results, is one of the main parameters controlling the style of degassing and eruptions.
Data Availability Statement
The raw data supporting the conclusions of this article will be made available by the authors, without undue reservation.
Author Contributions
FG conceptualization, article writing, data analysis procedures, interpretation of results, article revising; AE article writing, data analysis procedures, interpretation of results, article revising; LS article writing, dataset preparation, interpretation of results, article revising; AC article writing, dataset preparation, interpretation of results, article revising; DM article writing, dataset preparation, interpretation of results, article revising; LL data analysis procedures, interpretation of results, article revising; GM conceptualization, data analysis procedures, interpretation of results, article revising.
Funding
This work benefited from funds of the EU (DG ECHO) Project EVE n. 826292 and was partially supported by the project Progetto Strategico Dipartimentale INGV 2019 “Forecasting eruptive activity at Stromboli volcano: timing, eruptive style, size, intensity and duration” (FIRST) and by the project INGVFISR-2017 “Sale Operative Integrate e Reti di Monitoraggio del Futuro: l’INGV 2.0”. This work is also supported by a Marie Sklodowska-Curie Innovative Training Network Fellowship of the European Commissions Horizon 2020 Programme under Contract Number 765710 INSIGHTS. This work was also funded by the project AEOLUS (Fondo Ricerca di Base MORGABASE2015 funded by Department of Physics and Geology, University of Perugia). This work was partially supported by the project Progetto Strategico Dipartimentale INGV 2019 “FIRST - ForecastIng eRuptive activity at Stromboli volcano: Timing, eruptive style, size, intensity, and duration”.
Conflict of Interest
The authors declare that the research was conducted in the absence of any commercial or financial relationships that could be construed as a potential conflict of interest.
Acknowledgments
We thank the Reviewers and the Editors, who have helped us improve our work. We wish to thank the Project ROUGHER (Progetti di Ricerca Libera) funded by INGV.
Supplementary Material
The Supplementary Material for this article can be found online at: https://www.frontiersin.org/articles/10.3389/feart.2020.581742/full#supplementary-material.
References
Allen, R. V. (1978). Automatic earthquake recognition and timing from single traces. Bull. Seismol. Soc. Am. 68 (5), 1521–1532.
Ambrosino, F. C., Sabbarese, C., Roca, V., Giudicepietro, F., and Chiodini, G. (2020). Analysis of 7-years radon time series at Campi Flegrei area (Naples, Italy) using artificial neural network method. Appl. Rad. Isotop. 163, 109239. doi:10.1016/j.apradiso.2020.109239
Arciniega-Ceballos, A., Alatorre‐Ibargüengoitia, M., Scheu, B., and Dingwell, D. B. (2015). Analysis of source characteristics of experimental gas burst and fragmentation explosions generated by rapid decompression of volcanic rocks. J. Geophys. Res. Solid Earth, 120 (7), 5104–5116. doi:10.1002/2014jb011810
Arciniega-Ceballos, A., Alatorre‐Ibargüengoitia, M., Scheu, B., Dingwell, D. B., and Delgado‐Granados, H. (2014). Seismological analysis of conduit dynamics in fragmentation experiments. J. Geophys. Res. Solid Earth, 119 (3), 2215–2229. doi:10.1002/2013jb010646
Bhagwat, S. M., and Ghajar, A. J. (2016). Effect of pipe surface roughness on frictional pressure drop in gas-liquid two phase flows, fluid mechanics and thermodynamics 2016, in “12th International Conference on Heat Transfer”
Burzynski, A. M., Anderson, S. W., Morrison, K., Patrick, M. R., Orr, T., and Thelen, W. (2018). “Lava lake thermal pattern classification using self-organizing maps and relationships to eruption processes at Kīlauea Volcano, Hawai ‘i”. in Field Volcanology: A Tribute to the Distinguished Career of Don Swanson, 538, 307.
Capponi, A., James, M. R., and Lane, S. J. (2016). Gas slug ascent in a stratified magma: implications of flow organisation and instability for Strombolian eruption dynamics. Earth Planet Sci. Lett. 435, 159–170. doi:10.1016/j.epsl.2015.12.028
Carniel, R., Jolly, A. D., and Barbui, L. (2013). Analysis of phreatic events at Ruapehu volcano, New Zealand using a new SOM approach. J. Volcanol. Geoth. Res. 254, 69–79. doi:10.1016/j.jvolgeores.2012.12.026
Carniel, R. (1996). Neural networks and dynamical system techniques for volcanic tremor analysis. Ann. Geophys. 39 (2), 496.
Cassidy, M., Manga, M., Cashman, K., and Bachmann, O. (2018). Controls on explosive-effusive volcanic eruption styles. Nat. Commun. 9, 2839. doi:10.1038/s41467-018-05293-3
Chouet, B. A., and Matoza, R. S. (2013). A multi-decadal view of seismic methods for detecting precursors of magma movement and eruption. J. Volcanol. Geoth. Res. 252, 108–175. doi:10.1016/j.jvolgeores.2012.11.013
Clarke, J., Adam, L., Sarout, J., van Wijk, K., Kennedy, B., and Dautriat, J. (2019). The relation between viscosity and acoustic emissions as a laboratory analogue for volcano seismicity. Geology 47 (6), 499–503. doi:10.1130/G45446.1
Del Pezzo, E., Esposito, A., Giudicepietro, F., Marinaro, M., Martini, M., and Scarpetta, S. (2003). Discrimination of earthquakes and underwater explosions using neural networks. Bull. Seismol. Soc. Am. 93 (1), 215–223.
Divoux, T., Vidal, V., Melo, F., and Géminard, J. C. (2008). Acoustic emission associated with the bursting of a gas bubble at the free surface of a non-Newtonian fluid. Phys. Rev. E Stat. Nonlinear Soft Matter Phys. 77 (5), 056310. doi:10.1103/PhysRevE.77.056310
Dominguez, L., Pioli, L., Bonadonna, C., Connor, C. B., Andronico, D., Harris, A. J. L., et al. (2016). Quantifying unsteadiness and dynamics of pulsatory volcanic activity. Earth Planet Sci. Lett. 444, 160–168. doi:10.1016/j.epsl.2016.03.048
Ersoy, O., Aydar, E., Gourgaud, A., Artuner, H., and Bayhan, H. (2007). Clustering of volcanic ash arising from different fragmentation mechanisms using Kohonen self-organizing maps. Comput. Geosci. 33 (6), 821–828. doi:10.1016/j.cageo.2006.10.008
Esposito, A. M., Giudicepietro, F., Scarpetta, S., D’Auria, L., Marinaro, M., and Martini, M. (2006a). Automatic discrimination among landslide, explosion-quake, and microtremor seismic signals at Stromboli volcano using neural networks. Bull. Seismol. Soc. Am. 96 (4A), 1230–1240.
Esposito, A. M., Scarpetta, S., Giudicepietro, F., Masiello, S., Pugliese, L., and Esposito, A. (2006b). Nonlinear exploratory data analysis applied to seismic signals. Lect. Notes Comput. Sci. 3931/2006, 70–77. doi:10.1007/11731177_11
Esposito, A., Esposito, A. M., Giudicepietro, F., Marinaro, M., and Scarpetta, S. (2007). “Models for identifying structures in the data: a performance comparison”, in International conference on knowledge-based and intelligent information and engineering systems. Berlin, Heidelberg: Springer, 275–283.
Esposito, A. M., Giudicepietro, F., D’Auria, L., Scarpetta, S., Martini, M. G., Coltelli, M., Marinaro, M., et al. (2008). Unsupervised neural analysis of very-long-period events at Stromboli volcano using the self-organizing maps. Bull. Seismol. Soc. Am. 98 (5), 2449–2459. doi:10.1785/0120070110
Esposito, A. M., D’Auria, L., Giudicepietro, F., Caputo, T., and Martini, M. (2013a). Neural analysis of seismic data: applications to the monitoring of Mt. Vesuvius. Ann. Geophys. 56 (4), 0446. doi:10.1371/journal.pone.0203210
Esposito, A. M., D’Auria, L., Giudicepietro, F., and Martini, M. (2013b). Waveform variation of the explosion-quakes as a function of the eruptive activity at Stromboli volcano, Neural nets and surroundings. Berlin, Heidelberg: Springer, 111–119.
Esposito, A. M., D’Auria, L., Angelillo, A., Giudicepietro, F., and Martini, M. (2014). “Predictive analysis of the seismicity level at Campi Flegrei volcano using a data-driven approach”, in Recent advances of neural network models and applications. Cham: Springer, 133–145.
Esposito, A. M., Giudicepietro, F., Scarpetta, S., and Khilnani, S. (2018). “A neural approach for hybrid events discrimination at Stromboli volcano”, in Multidisciplinary approaches to neural computing, Series “Smart Innovation and Springer International Publishing AG, Systems and Technologies (SIST), (New York: Springer), 69. doi:10.1007/978-3-319-56904-8_2 http://www.springer.com/us/book/9783319569031.
Esposito, A. M., Alaia, G., Giudicepietro, F., Pappalardo, L., and D’Antonio, M. (2020a). “Unsupervised geochemical analysis of the eruptive products of Ischia, Vesuvius and Campi Flegrei”, in Progresses in Artificial Intelligence and Neural Systems. (Singapore: Springer), 175–184.
Esposito, A. M., De Bernardo, A., Ferrara, S., Giudicepietro, F., and Pappalardo, L. (2020b). SOM-based analysis of volcanic rocks: an application to Somma-Vesuvius and Campi Flegrei volcanoes (Italy), in Neural approaches to dynamics of signal exchanges. (Singapore: Springer), 55–60.
Fabre, J., and Liné, A. (1992). Modeling of two-phase slug flow. Annu. Rev. Fluid Mech. 24 (1), 21–46. doi:10.1146/annurev.fl.24.010192.000321
Giudicepietro, F., Calvari, S., Alparone, S., Bianco, F., Bonaccorso, A., Bruno, V., et al. (2019). Integration of ground-based remote-Sensing and in Situ multidisciplinary monitoring data to analyze the eruptive activity of Stromboli volcano in 2017–2018. Rem. Sens. 11 (15), 1813. doi:10.3390/rs11151813
Giudicepietro, F., Esposito, A. M., and Ricciolino, P. (2017). Fast discrimination of local earthquakes using a neural approach. Seismol Res. Lett. 88 (4), 1089–1096. doi:10.1785/0220160222
Giudicepietro, F., López, C., Macedonio, G., Alparone, S., Bianco, F., Calvari, S., et al. (2020). Geophysical precursors of the July-August 2019 paroxysmal eruptive phase and their implications for Stromboli volcano (Italy) monitoring. Sci. Rep. 10 (1), 1–16. doi:10.1038/s41598-020-67220-1
Ham, F. M., Leeney, T. A., Canady, H. M., and Wheeler, J. C. (1999). “An infrasonic event neural network classifier IJCNN'99”, in International Joint Conference on Neural Networks Proceedings (Cat. No. 99CH36339), 6, 3768–3773.
Ichihara, M., Lyons, J. J., and Yokoo, A. (2013). Switching from seismic to seismo-acoustic harmonic tremor at a transition of eruptive activity during the Shinmoe-dake 2011 eruption. Earth Planets Space 65, 14 doi:10.5047/eps.2013.05.003
James, M. R., Lane, S. J., and Chouet, B. A. (2006). Gas slug ascent through changes in conduit diameter: laboratory insights into a volcano-seismic source process in low-viscosity magmas. J. Geophys. Res. Solid Earth 111 (B5) doi:10.1029/2005JB003718
James, M. R., Lane, S. J., Chouet, B., and Gilbert, J. S. (2004). Pressure changes associated with the ascent and bursting of gas slugs in liquid-filled vertical and inclined conduits. J. Volcanol. Geoth. Res. 129 (1–3), 61–82.
Johnson, J., Aster, R., Jones, K. R., Kyle, P., and McIntosh, B. (2008). Acoustic source characterization of impulsive Strombolian eruptions from the Mount Erebus lava lake. J. Volcanol. Geoth. Res. 177 (3), 673–686. doi:10.1016/j.jvolgeores.2008.06.028
Jolly, A. D., Matoza, R. S., Fee, D., Kennedy, B. M., Iezzi, A. M., Fitzgerald, R. H., et al. (2017). Capturing the acoustic radiation pattern of strombolian eruptions using infrasound sensors aboard a tethered aerostat, Yasur volcano, Vanuatu. Geophys. Res. Lett. 44 (19), 9672–9680. doi:10.1002/2017GL074971
Kobayashi, T., Namiki, A., and Sumita, I. (2010). Excitation of airwaves caused by bubble bursting in a cylindrical conduit: experiments and a model. J. Geophys. Res. Solid Earth 115, B10. doi:10.1029/2009JB006828
Köhler, A., Ohrnberger, M., and Scherbaum, F. (2009). Unsupervised feature selection and general pattern discovery using Self-Organizing Maps for gaining insights into the nature of seismic wavefields. Comput. Geosci. 35 (9), 1757–1767. doi:10.1016/j.cageo.2009.02.004
Kohonen, T., Hynninen, J., Kangas, J., and Laaksonen, J. (1996). SOM_PAK: the self-organizing map program package, Report A31, Helsinki University of Technology, Laboratory of Computer and Information Science, Espoo, Finland. Available at: www.cis.hut.fi/research/som_lvq_pak.shtml
Krischer, L., Megies, T., Barsch, R., Beyreuther, M., Lecocq, M., Caudron, C., et al. (2015). Obspy: a bridge for seismology into the scientific python ecosystem. Comput. Sci. Discov. 8, 014003. doi:10.1088/1749-4699/8/1/014003
Kumagai, H., and Chouet, B. A. (2000). Acoustic properties of a crack containing magmatic or hydrothermal fluids. J. Geophys. Res. 105 (B11), 25493–25525. doi:10.1029/2000JB900273
Kumagai, H., Chouet, B. A., and Nakano, M. (2002). Temporal evolution of a hydrothermal system in Kusatsu-Shirane Volcano, Japan, inferred from the complex frequencies of long-period events. J. Geophys. Res. 107 (B10), 2236. doi:10.1029/2001JB000653
Langer, H., Falsaperla, S., Masotti, M., Campanini, R., Spampinato, S., and Messina, A. (2009). Synopsis of supervised and unsupervised pattern classification techniques applied to volcanic tremor data at Mt Etna, Italy. Geophys. J. Int. 178 (2), 1132–1144. doi:10.1111/j.1365-246X.2009.04179.x
Lautze, N. C., and Houghton, B. F. (2005). Physical mingling of magma and complex eruption dynamics in the shallow conduit at Stromboli volcano, Italy. Geology 33 (5), 425–428. doi:10.1130/G21325.1
Lyons, J. J., Ichihara, M., Kurokawa, A., and Lees, J. M. (2013). Switching between seismic and seismo‐acoustic harmonic tremor simulated in the laboratory: insights into the role of open degassing channels and magma viscosity. J. Geophys. Res. Solid Earth 118, 277–289. doi:10.1002/jgrb.50067
Macedonio, G., Dobran, F., and Neri, A. (1994). Erosion processes in volcanic conduits and application to the AD 79 eruption of Vesuvius. Earth Planet Sci. Lett. 121 (1–2), 137–152. doi:10.1016/0012-821x(94)90037-x
Marple, L. (1980). A new autoregressive spectrum analysis algorithm, IEEE Trans. Acoust. Speech Signal Process. 28, 4.
Masiello, S., Esposito, A. M., Scarpetta, S., Giudicepietro, F., Esposito, A., and Marinaro, M. (2006). Application of self organized maps and curvilinear component analysis to the discrimination of the Vesuvius seismic signals. In WSOM.
Matoza, R. S., Arciniega‐Ceballos, A., Sanderson, R. W., Mendo‐Pérez, G., Rosado‐Fuentes, A., and Chouet, B. A. (2019). High‐broadband Seismoacoustic signature of Vulcanian explosions at popocatépetl volcano, Mexico. Geophys. Res. Lett. 46 (1), 148–157.
McFee, B., Raffel, C., Liang, D., Ellis, D. P., McVicar, M., Battenberg, E., et al. (2015). “Librosa: audio and music signal analysis in python”, in Proceedings of the 14th Python in Science Conference, 18–25.
Messina, A., and Langer, H. (2011). Pattern recognition of volcanic tremor data on Mt. Etna (Italy) with KKAnalysis—a software program for unsupervised classification. Comput. Geosci. 37 (7), 953–961. doi:10.1016/j.cageo.2011.03.015
Nuha, H. H., Balghonaim, A., Liu, B., Mohandes, M., and Fekri, F. (2019). Seismic data compression using deep neural network predictors, in “SEG technical program expanded abstracts 2019”. (New York: Society of Exploration Geophysicists), 258–262.
Paglianti, A., Giona, M., and Soldati, A. (1996). Characterization of subregimes in two-phase slug flow. Int. J. Multiphas. Flow 22 (4), 783–796. doi:10.1016/0301-9322(96)00019-5
Pioli, L., Bonadonna, C., Azzopardi, B. J., Phillips, J. C., and Ripepe, A. M. (2012). Experimental constraints on the outgassing dynamics of basaltic magmas. J. Geophys. Res. Solid Earth 117 (B3), 19.
Ren, C. X., Peltier, A., Ferrazzini, V., Rouet Leduc, B., Johnson, P. A., and Brenguier, F. (2020). Machine learning reveals the seismic signature of eruptive behavior at Piton de la Fournaise volcano. Geophys. Res. Lett. 47, e2019GL085523doi:10.1029/2019GL085523
Rowe, C. A., Aster, R. C., Kyle, P. R., Dibble, R. R., and Schlue, J. W. (2000). Seismic and acoustic observations at mount Erebus volcano, ross Island, Antarctica, 1994–1998. J. Volcanol. Geoth. Res. 101 (1–2), 105–128. doi:10.1016/S0377-0273(00)00170-0
Scarpetta, S., Giudicepietro, F., Ezin, E. C., Petrosino, S., Del Pezzo, E., Martini, M., et al. (2005). Automatic classification of seismic signals at Mt. Vesuvius volcano, Italy, using neural networks. Bull. Seismol. Soc. Am. 95 (1), 185–196.
Shannak, B. A. (2008). Frictional pressure drop of gas liquid two-phase flow in pipes. Nucl. Eng. Des. 238 (12), 3277–3284. doi:10.1016/j.nucengdes.2008.08.015
Simons, B. C., Jolly, A. D., Eccles, J. D., and Cronin, S. J. (2020). Spatiotemporal relationships between two Closely‐spaced strombolian‐style Vents, Yasur, Vanuatu. Geophys. Res. Lett. 47 (5), e2019GL085687. doi:10.1029/2019GL085687
Spina, L., Cannata, A., Morgavi, D., and Perugini, D. (2019). Degassing behaviour at basaltic volcanoes: new insights from experimental investigations of different conduit geometry and magma viscosity. Earth Sci. Rev. 10, 28. doi:10.1016/j.earscirev.2019.03.010
Spina, L., Morgavi, D., Cannata, A., Campeggi, C., and Perugini, D. (2018). An experimental device for characterising degassing processes and related elastic fingerprints: analogue volcano seismo-acoustic observations. Rev. Sci. Instrum. 89, 055102. doi:10.1063/1.5020004
Spina, L., Taddeucci, J., Cannata, A., Gresta, S., Lodato, L., Privitera, E., and Palladino, D. M. (2015). Explosive volcanic activity at Mt. Yasur: a characterization of the acoustic events (9–12th July 2011). J. Volcanol. Geoth. Res. 302, 24–32. doi:10.1007/s00445-017-1108-x
Trnkoczy, A. (2012). “Understanding and parameter setting of STA/LTA trigger algorithm”, in IASPEI New manual of seismological observatory practice 2 (NMSOP-2). Deutsches GeoForschungs Zentrum GFZ, Potsdam, Potsdam, 1–20. doi:10.2312/GFZ.NMSOP-2_IS_8.1
Unglert, K., Radić, V., and Jellinek, A. M. (2016). Principal component analysis vs. self-organizing maps combined with hierarchical clustering for pattern recognition in volcano seismic spectra. J. Volcanol. Geoth. Res. 320, 58–74. doi:10.1016/j.jvolgeores.2016.04.014
Vidal, V., Ichihara, M., Ripepe, M., and Kurita, K. (2009). Acoustic waveform of continuous bubbling in a non-Newtonian fluid. Phys. Rev. E Stat. Nonlinear Soft Matter Phys. 80 (6), 066314. doi:10.1103/PhysRevE.80.066314
Vidal, V., Géminard, J. C., Divoux, T., and Melo, F. (2006). Acoustic signal associated with the bursting of a soap film which initially closes an overpressurized cavity. Eur. Phys. J. B Condens. Matter Complex Syst. 54 (3), 321–339.
Watson, L. M. (2020). Using unsupervised machine learning to identify changes in eruptive behavior at Mount Etna, Italy. J. Volcanol. Geoth. Res. 46, 107042.
Withers, M., Aster, R., Young, C., Beiriger, J., Harris, M., Moore, s., et al. (1998). A comparison of select trigger algorithms for automated global seismic phase and event detection. Bull. Seism. Soc. Am. 88, 95–106.
Keywords: self-organizing map, neural network, seismo-acoustic signals, experimental volcanology, clustering method
Citation: Giudicepietro F, Esposito AM, Spina L, Cannata A, Morgavi D, Layer L and Macedonio G (2021) Clustering of Experimental Seismo-Acoustic Events Using Self-Organizing Map (SOM). Front. Earth Sci. 8:581742. doi: 10.3389/feart.2020.581742
Received: 09 July 2020; Accepted: 21 December 2020;
Published: 28 January 2021.
Edited by:
Nico Fournier, GNS Science, New ZealandReviewed by:
Oliver D. Lamb, University of North Carolina at Chapel Hill, United StatesArthur Jolly, GNS Science, New Zealand
John J Lyons, U.S. Geological Survey, United States
Copyright © 2021 Giudicepietro, Esposito, Spina, Cannata, Morgavi, Layer and Macedonio. This is an open-access article distributed under the terms of the Creative Commons Attribution License (CC BY). The use, distribution or reproduction in other forums is permitted, provided the original author(s) and the copyright owner(s) are credited and that the original publication in this journal is cited, in accordance with accepted academic practice. No use, distribution or reproduction is permitted which does not comply with these terms.
*Correspondence: Antonietta M. Esposito, YW50b25pZXR0YS5lc3Bvc2l0b0Bpbmd2Lml0