 Jun-Hyeok Son
 Kyong-Hwan Seo
 Seok-Woo Son
 Dong-Hyun Cha
- 1Department of Atmospheric Sciences, Division of Earth Environmental System, Pusan National University, Busan, South Korea
- 2Research Center for Climate Science, Pusan National University, Busan, South Korea
- 3School of Earth and Environmental Sciences, Seoul National University, Seoul, South Korea
- 4Department of Urban and Environmental Engineering, Ulsan National Institute of Science and Technology, Ulsan, South Korea
The Northern Hemisphere summer climate isstrongly affected by a circumglobal stationary Rossby wave train, which can be manifested by the first EOF mode of the geopotential height at 200 hPa. Interannual variation of this Northern Hemisphere wave (NHW) pattern has a significant impact on remarkably warm surface temperature anomalies over the North Atlantic, Northeast Europe, East Asia to Central-North Pacific, and America, particularly in 2018 and 2010. The NHW pattern is likely generated by atmospheric diabatic heating and vorticity forcing: diabatic heating is mainly confined in the Indian summer monsoon (ISM) precipitation region, whereas the anti-cyclonic vorticity forcing is distributed in the globe. The ISM is a well-known diabatic heat source; however, the main source of vorticity forcing has not been established. In general, the tropical vorticity anomaly comes from diabatic heating-induced atmospheric waves and randomly generated inherent internal waves. The linear baroclinic model experiment reveals that the NHW pattern can be generated by the westward propagating tropical waves generated by the ISM diabatic heat forcing.
Introduction
More than 90% of the world’s population lives in the Northern Hemisphere, and the human life is significantly influenced by weather and climate variability. In summer, the occurrences of the heavy rainfall and heatwave are fatal to people’s health and food production. These extremes are often caused by atmospheric Rossby waves, rather than randomly occurring (e.g., Feldstein and Dayan, 2008; Schubert et al., 2011; Harnik et al., 2016; Wirth et al., 2018). If the phase speed of the Rossby wave is zero, then the Rossby waves become stationary, and these waves have a tremendous impact on the climate system. The primary characteristic of the atmospheric Rossby waves is that waves propagate westward by the planetary vorticity advection; however, the Doppler effect of the westerly jet stream carries the waves eastward. In observations, planetary-scale small zonal wavenumber waves move westward, but large wavenumber waves propagate eastward by the Doppler effect. When the westward propagating phase speeds of the Rossby waves and the westerly wind speeds are the same, the waves become stationary relative to the ground.
Stationary Rossby wave trains over the Northern Hemisphere in summer are reported as the silk road pattern (SRP), circumglobal teleconnection (CGT), and the North Atlantic–Eurasian (AEA) teleconnection, and all these Rossby wave patterns significantly modulate the global climate system (Lu et al., 2002; Ding and Wang, 2005; Wu et al., 2009). East–west elongated Eurasian wave train trapped in the subtropical jet stream is named the SRP (Lu et al., 2002; Enomoto et al., 2003). As an interannual component of the SRP (Chen and Huang, 2012), the CGT is the dominant circulation pattern over the midlatitude, and this wave train is known to be a result of diabatic heating in the Indian subcontinent or vorticity forcing around the exit of the jet stream over the North Atlantic (Ding and Wang, 2007; Ding et al., 2011). North Atlantic oscillation (NAO) related stationary Rossby waves penetrating across the Eurasian continent are explained as the North Atlantic–Eurasian (AEA) teleconnection in boreal summer (Wu et al., 2009; Seo et al., 2012; Seo and Son, 2012; Wu et al., 2012; Zheng et al., 2016; Li and Ruan, 2018).
In general, the phase-locking of the stationary Rossby waves is owing to stationary forcing such as a huge mountain, land–sea thermal contrast, slowly varying oceanic heat source, long-lasting atmospheric diabatic heating, and atmospheric vorticity forcing. The potential energy conversion from the baroclinic Asian jet to the kinetic energy of waves and the phase-locking effect of topographic boundary forcing are considered as the major mechanisms of the SRP (Sato and Takahashi, 2006; Kosaka et al., 2009). Hence, some portion of the SRP is regarded as the middle latitude-inherent internal mode in association with baroclinic instability; however, the CGT and AEA patterns may be generated by the stationary atmospheric diabatic heating and vorticity forcing.
The spatial structures of the CGT and SRP are almost the same over the Eurasian continent in monthly field (e.g., pattern correlation of geopotential height between CGT and SRP is above 0.80; not shown); however, a discrepancy is that the CGT is formed circumglobally, while the SRP phase is locked only in the Eurasian sector (Zhou et al., 2019). The source of the CGT is known to be related to the anomalous Indian summer monsoon (ISM) precipitation and the vorticity forcing around the Atlantic jet stream exit region, and the decadal variation of the CGT is linked to the Atlantic multidecadal oscillation (Lin et al., 2016; Stephan et al., 2019).
The ISM is one of the most intense convective systems over the globe, and the monsoon precipitation has a considerable variation on subseasonal to interdecadal timescale. The variability of atmospheric stationary waves is strongly tied with the temporal and spatial variations of forcing; however, the existence of inherent internal waves associated with the tropical convective random forcing or extratropical baroclinic instability is also related to the generation of a quasi-stationary wave train, and therefore it causes a lot of uncertainties in the stationary forcing-response causal relationship. Thus, a basic question arises here, “Does the ISM diabatic heat forcing generate the dominant stationary wave pattern in the Northern Hemisphere?” To answer this question, first, we defined the predominant mode of the Northern Hemisphere stationary Rossby waves. The EOF analysis using the geopotential height at 200 hPa in July reveals that the prominent Rossby wave train covers the entire Northern Hemisphere (Figure 1). For instance, if the EOF analysis is performed on the JJA average or other months, the space-time pattern is significantly different from using only in July (not shown). Interestingly, although the first EOF mode (EOF1) explains only ∼16% of the total variance, overall anomaly pattern of the geopotential height in the Northern Hemisphere in July 2018 can be explained by the EOF1. In summer 2018, most countries in the Northern Hemisphere midlatitudes suffered severe heatwaves with long-lasting atmospheric stationary Rossby waves. Hereafter, we term this stationary Rossby wave pattern the Northern Hemisphere wave (NHW). The reason for using the new definition in this study is to intuitively express the dominant wave train that actually occurs, rather than understanding it based on the various and complex wave trains defined in previous studies. The principal component (PC) of NHW has substantial interannual variability, and it has a temporal correlation of 0.34 with CGT interannual time series, 0.41 with SRP index, and 0.51 with the AEA index. The CGT pattern is generally defined as an EOF1 of the meridional wind anomaly at 200 hPa over 100°W–100°E, 20°–80°N as suggested by Saeed et al. 2011; Saeed et al. 2014. On the other hand, the SRP index is calculated by the PC of the EOF1 using the meridional wind at 200 hPa in 30°–130°E, 30°–60°N (Chen et al., 2013), and the AEA teleconnection is represented in the EOF2 of the geopotential height anomaly at 500 hPa in 45°W–135°E, 15°–90°N (Li and Ruan, 2018). As shown in the previous studies, the CGT and SRP teleconnection patterns are formed in the midlatitude, whereas the AEA is situated in the high latitude. Therefore, it is considered that uniqueness of the NHW is that it is rather entire northern hemispheric pattern, as the name indicates. Furthermore, the entire NH pattern well represents the characteristic pattern appearing in the extreme heat wave events in July (Figure 2).
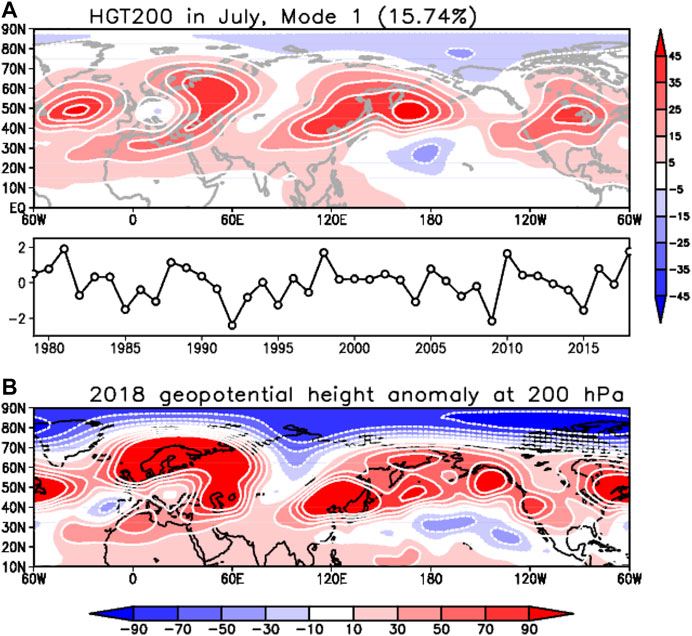
FIGURE 1. (A) The EOF1 of geopotential height at 200 hPa in July and (B) the anomaly pattern in July 2018.
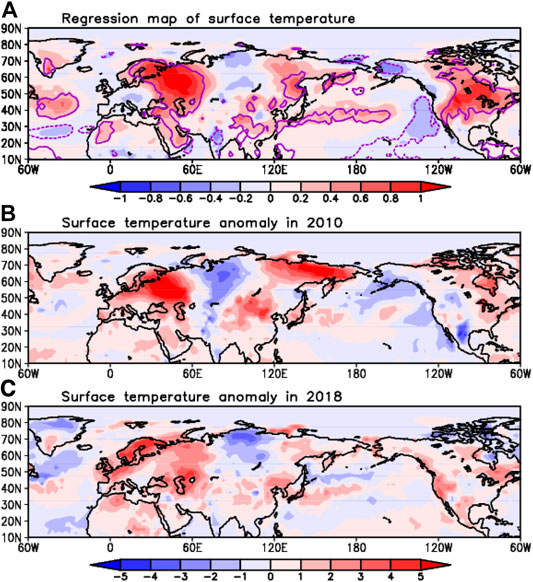
FIGURE 2. (A) The surface temperature regression map (shading) in July against the PC, (B) 2010, and (C) 2018 anomaly pattern. Purple contours show 95% significant area.
For the examination of the physical characteristics of the NHW, we analyzed the Rossby wave energy propagation pathway and demonstrated the trajectory using the Rossby wave ray-tracing method (Seo and Son, 2012; Zhao et al., 2015; Lee and Seo, 2019). The atmospheric responses to thermodynamical heat forcing or dynamical vorticity forcing are examined using the linear baroclinic model (LBM) (Watanabe and Kimoto, 2000). The steady-state LBM simulation shows the stationary wave response to prescribed diabatic heating or vorticity forcing. In this study, we investigate the source of the NHW pattern, and through this, the cause of the Northern Hemisphere temperature anomaly pattern is also elucidated. Finally, the decadal linear trend of the Northern Hemisphere circulation pattern and its possible mechanism are discussed.
Data and Methods
The following monthly mean datasets (1979–2018) are used in this study: European Center for Medium-Range Weather Forecasts ERA-Interim reanalysis datasets in the pressure coordinate (Dee et al., 2011) and Global Precipitation Climatology Project precipitation version 2.3 (Adler et al., 2003).
Over the Northern Hemisphere in July, the EOF analysis is performed using the 200-hPa geopotential height anomaly, in which the linear trend is removed at each grid point. For the statistical significance test in observational analysis, the Student t-test is used, and the Mann–Kendall significance test is performed for the linear trend analysis.
The apparent heat source (Q1) and apparent moisture sink (Q2) are calculated to illustrate tropical–subtropical diabatic heat forcing as follows (Yanai, 1961; Yanai et al., 1973):
where
The Q1 is the heating resulting from convection, radiation, condensation, and eddy heat flux processes, and the Q2 is associated with the moisture sink due to net condensation and eddy moisture transport divergence. Note that the deep tropical convection and intense precipitation occurring during the ISM are accompanied by a significant amount of diabatic heating in the middle troposphere.
The LBM experiment is performed to verify whether the observed NHW circulation pattern is a primary linear response to direct diabatic heating or dynamical vorticity forcing. The model has a horizontal resolution of T42 and 20 vertical levels in the sigma coordinate, and the steady response to the prescribed diabatic heating or vorticity forcing is calculated (Watanabe and Kimoto, 2000). First, to search for potential forcing regions, arbitrary idealized heat forcing is applied to all grid points in the Northern Hemisphere, and the simulation results are compared with observations; then observational three-dimensional Q1 forcing is applied to the LBM for the verification of the physical relationship between the ISM and NHW.
The trajectory of the Rossby wave energy propagation starting from diabatic heat and vorticity forcing is calculated by the ray-tracing method (Lighthill, 1978; Hoskins and Karoly, 1981; Hoskins and Ambrizzi, 1993; Seo and Son, 2012; Zheng et al., 2016; Lee and Seo, 2019). A detailed description of the ray-tracing method using the barotropic nondivergent vorticity equation in a horizontally nonuniform background flow can be found in Li et al. (2015) and Zhao et al. (2015). For the calculation of the ray, the initial zonal wavenumber is set to two to four, and the zonal and meridional wavenumbers are allowed to vary along the trajectory (Zhao et al., 2015).
Linkage Between the Northern Hemisphere Wave Pattern and the Northern Hemisphere Surface Temperature
In July 2018, the Northern Hemisphere climate was greatly influenced by stationary Rossby waves, and the peculiar geopotential height pattern can be described as the first mode of EOF (Figure 1). In the EOF1, the dominant zonal wave number in the midlatitudes is 4 or 5, and the positive anomaly centers are located in the North Atlantic, Northeast Europe, Northeast Asia, and America. The PC index shows strong interannual fluctuation, and the values for 1981, 1998, 2010, and 2018 are higher than +2 standard deviations. For example, the EOF1 and the 2018 anomaly patterns of geopotential height match well, but the detailed structures are not perfectly identical. The geopotential height fields over the Eurasian and African continent, and the Pacific look similar; however, the anomaly pattern in America and the North Atlantic is not correctly matched in Figure 1.
The regression map of surface temperature against the PC time series shows the corresponding surface temperature anomaly pattern with geopotential height anomaly (Figure 2A). Basically, the vertical structure of the midlatitude stationary Rossby waves is barotropic; this means that the upper tropospheric pressure anomaly is likely to modulate the surface pressure and accordingly temperature fields. In Figure 2A, warm temperature anomalies have formed in the North Atlantic, Northeast Europe, East Asia to Central-North Pacific, and America. It is interesting to see that the large-scale features of surface temperature in 2018 and 2010 are very similar to the regression map of surface temperature: the warm temperature over Northeastern Europe, East Asia, and Northeast America, and even cold anomaly in central Russia. From these shreds of evidence, now we can infer that the NHW significantly impact on the Northern Hemisphere pressure fields and temperature in July.
Potential Forcing for the Generation of the Northern Hemisphere Wave
Apparently thermodynamical or dynamical forcing may be required for the generation of the NHW; therefore, to examine the potential forcing of the NHW pattern, a suite of the LBM experiment is designed as follows: using prescribed steady forcing such as atmospheric diabatic heating and negative vorticity, respectively, experiments are conducted over the climatological (1979–2018) background state in July. The forcing having a diameter of 10° moves from 0° to 360°E and 0° to 80°N with 5° intervals as shown in Figure 3.
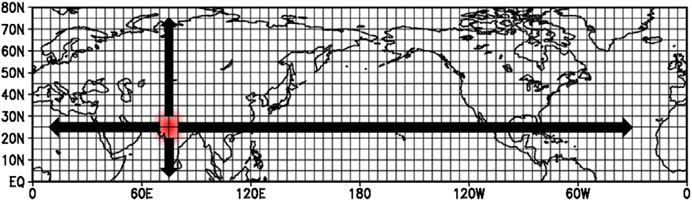
FIGURE 3. Forcing centers for the LBM experiment. Red shading shows a prescribed forcing, and the forcing moves step by step to every grid on the Northern Hemisphere.
In general, deep atmospheric convection accompanies a huge amount of diabatic heating, and this thermodynamic forcing can generate the atmospheric Rossby wave teleconnection. Deep convection is usually characterized by middle heavy heating profile as shown in Figure 4A (if it is well organized so it has stratiform anvil clouds, then heating profile is top-heavy). Therefore, the middle-level (∼500 hPa) heavy profile is prescribed as the idealized diabatic heat forcing structure, while the vorticity forcing has an upper troposphere (∼250 hPa) heavy shape (Figure 4). In the tropics, the upper tropospheric negative relative vorticity or the positive geopotential height anomaly is physically linked to the lower-level cyclonic circulation by the vertical baroclinic structure. The strong baroclinicity of the pressure anomalies coincides with the occurrence of middle tropospheric diabatic heat forcing inside the organized large-scale convective system. However, in the mid and high latitude, the bottom heavy diabatic heat forcing directly induces atmospheric thickness change and drives vertically barotropic dynamic systems (Peng et al., 2003). For the consistency of the atmospheric response from diabatic heating and vorticity forcing, the negative vorticity forcing is prescribed in the upper troposphere. The upper troposphere heavy structure in vorticity forcing portrays the observational vorticity structure (not shown) (Lau and Nath, 1991; Li et al., 2007; Qian et al., 2019; Shi et al., 2019).
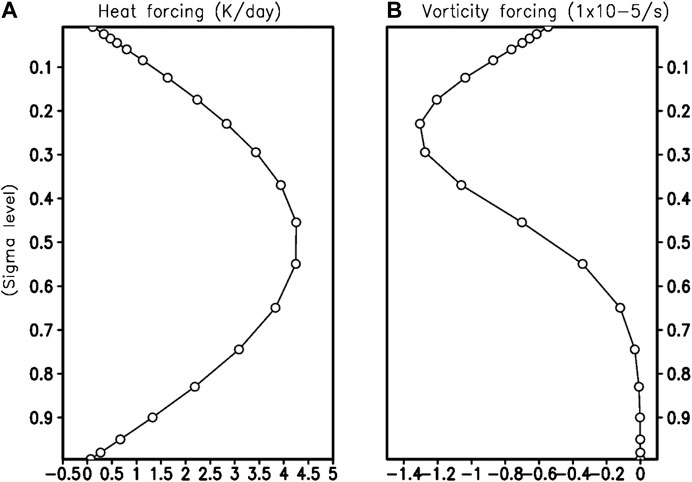
FIGURE 4. Vertical profiles of individual heat and vorticity forcing for LBM experiments.
Diabatic heating is representative atmospheric thermodynamic forcing induced by the vigorous tropical convective activity and heavy precipitation. As a result of the LBM experiment by moving atmospheric diabatic heating horizontally, it seems that four forcing positions can make a meaningful contribution to the NHW. First, the NHW-like pattern (pattern correlation 0.40) can emerge from the diabatic heating situated over the Atlantic Ocean near Western Africa (Figure 5A). The geopotential height anomaly in the LBM simulation reveals that Rossby waves are generated from the Atlantic Ocean, and the Rossby wave energy propagates to the northeast across Russia. Meanwhile, the westward propagating tropical Rossby waves approach to Eastern America from the initial forcing region. Here, we note that the upper troposphere positive geopotential height anomalies and negative vorticity forcing over subtropical regions can be generated by westward propagating atmospheric waves. This means that the tropical–subtropical diabatic heat forcing generates the westward propagating Rossby waves, and again this anomalous vortex flow can be an additional vorticity forcing on the atmosphere. Second, the NHW pattern (correlation 0.52) can arise from Northeast Africa to the midlatitude (Figure 5B). In Figure 5B, the Rossby wave ray moves to the west initially, and then the path turns to the north across the Mediterranean, penetrating the critical latitude where the zonal wind is zero, by background southerly wind (Zhao et al., 2015).
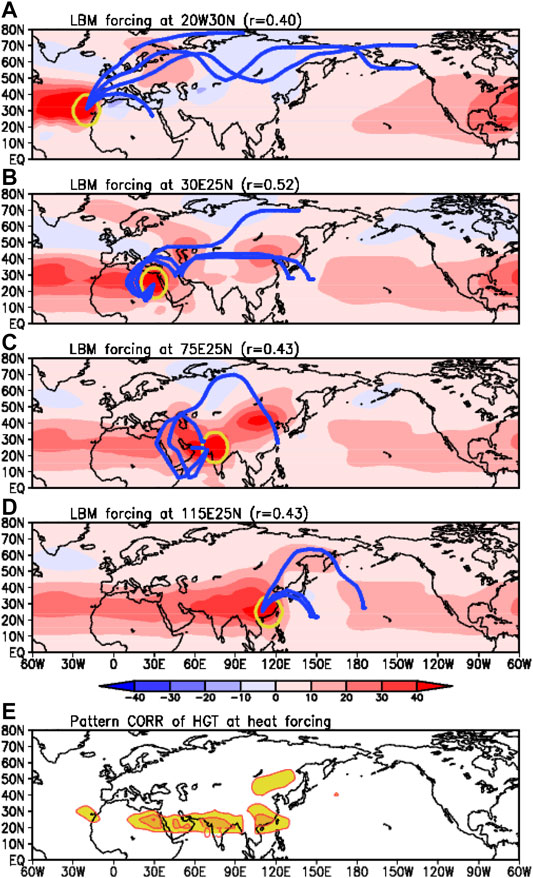
FIGURE 5. The LBM experiment using diabatic heat forcing migrating in 5° interval over the Northern Hemisphere. The geopotential height anomaly at 200 hPa in the LBM experiment is shown for forcing of (A) 20°W 30°N, (B) 30°E 25°N, (C) 75°E 25°N, and (D) 115°E 25°N. The yellow circle denotes the heat forcing area, and the blue line shows the Rossby wave propagation path. The pattern correlation between the geopotential height anomaly in LBM experiments and EOF1 (Figure 1A) is calculated in (E). The correlation is shown at each forcing center, and the contour interval is 0.1.
Third, the NHW can be generated (correlation 0.43) by Indian diabatic heat forcing (Figure 5C). Here, the Rossby wave trains pass through Turkey to the midlatitude by the southerly wind. Forth, forcing over South China (Figure 5D) also makes the NHW-like pattern (correlation 0.43). All those diabatic heating regions are potential forcing areas for the generation of the NHW (Figure 5E). The potential diabatic heat forcing regions, represented by forcing in LBM experiments inducing significant value of pattern correlation coefficient between geopotential height anomalies of EOF1 and LBM simulations, are shown in Figure 5E, where forcing lies along the subtropical regions from the Eastern Atlantic to South China.
The Rossby wave response forced by the negative (anti-cyclonic) vorticity is much different from the results of diabatic heat forcing. The vorticity forcing over North Africa has an important role in the formation of the NHW pattern (Figure 6). The negative vorticity forcing over North Africa can generate the NHW-like pattern (correlation above 0.40). Over the tropics, the stationary diabatic heating generates the westward propagating Rossby waves (Figure 5). The tropical vorticity forcing can be induced systematically by organized convective heat forcing, and the vorticity forcing can emerge randomly by the tropical internal wave dynamics. That means, the mechanism of the NHW pattern is classified into two categories as the stationary convective heat forcing with westward propagating Rossby waves, and the atmospheric internal waves.
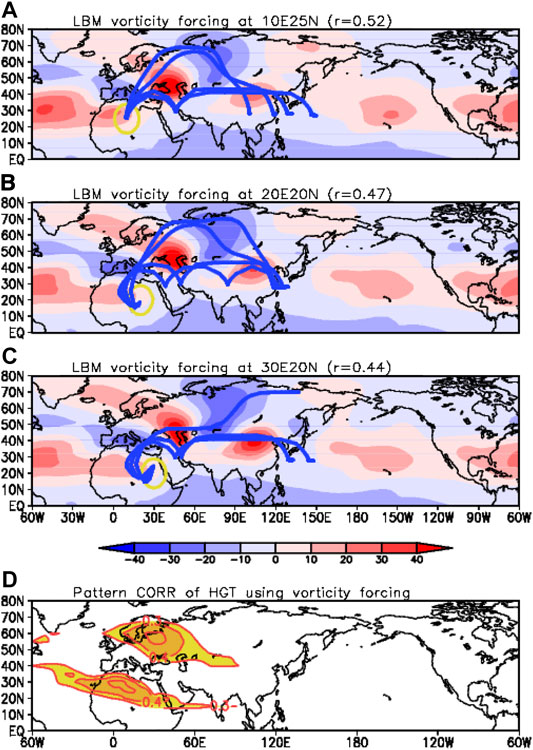
FIGURE 6. The LBM experiment using vorticity forcing migrating in 5° interval over the Northern Hemisphere. Geopotential height anomaly at 200 hPa in LBM simulations using negative vorticity (anti-cyclonic) forcing (A) 10°E 25°N, (B) 20°E 20°N, and (C) 30°E 20°N is illustrated. The yellow circle denotes the vorticity forcing area, and the blue line shows the Rossby wave propagation path. The pattern correlation coefficient between EOF1 and LBM simulations is calculated at each forcing point (D).
The LBM results do not guarantee that all potential forcing regions can be actual forcing for the NHW pattern in the real world, because the forcing in the LBM simulations is prescribed in arbitrary locations and vertical structures. Despite these limitations of the idealized experiment, relevant messages can be summarized as follows.
1. Diabatic heating in the Atlantic Ocean, Northeast Africa to India, and East China is a potential thermodynamic heat source inducing the NHW pattern.
2. Upper tropospheric negative vorticity over North Africa may be an important dynamical forcing for generating the NHW.
3. The westward propagating tropical waves emerging from the tropical and subtropical diabatic heat forcing can induce anomalous vorticity forcing for the NHW pattern.
The Generation of the Northern Hemisphere Wave Pattern Forced by Indian Summer Monsoon Precipitation
In observations, the NHW index is well correlated with the ISM precipitation, and the most prominent heat source region is the Indian subcontinent region (Figure 7). For reference, the extremely strong precipitation occurs over the Indian ocean and Indian subcontinent in 2010, and the strong positive precipitation is formed over northern India in 2018 (not shown). The heavy rainfall or tropical-subtropical deep convection is accompanied with the atmospheric diabatic heating, which can be estimated by the apparent heat source Q1 and moisture sink Q2 (Figures 7B,C). When the intense precipitation appears, the Q1 shows the mid- and top-heavy vertical structure by the combination of condensation and radiation heating; however, the latent heat release in deep convection leads to a middle-level heavy vertical profile of Q2 (Seo and Wang, 2010).
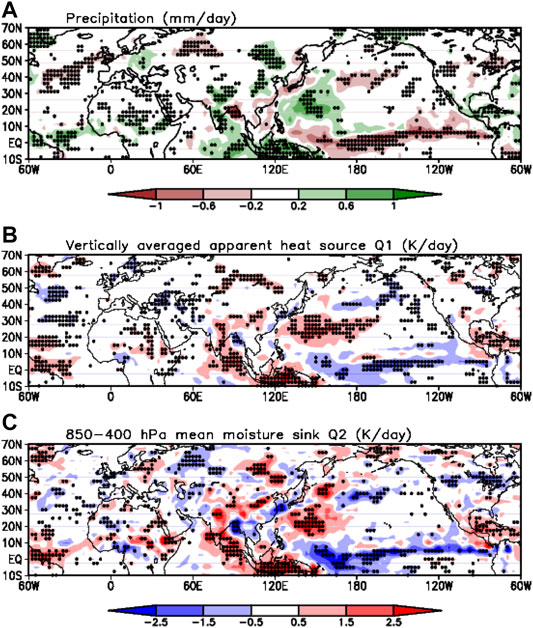
FIGURE 7. Regression map of precipitation (GPCP), apparent heat source (Q1), and moisture sink (Q2) in July against PC time series. Dots denote significant area at the 95% level.
According to the previous section, the NHW pattern is regulated by Indian diabatic heating itself and the related vorticity forcing; however, the quantitative contribution of the ISM to relevant vorticity forcing for the NHW pattern is still not elucidated. For the clarification on this point, the LBM experiments are performed using observational interannual Q1 anomaly forcing. In here, an essential assumption for the LBM experiment is that the climatological geopotential height pattern is related to climatological diabatic heat forcing, but the interannual variation of the geopotential height is constructed by anomalous atmospheric forcing. The LBM experiment using 3-dimensional Indian Q1 anomaly forcing (70°–85°E, 7.5°–25°N, 1,000–10 hPa) from 1979 to 2018 simulates interannual variation of the geopotential height, and thus we can calculate the interannual variance of the geopotential height anomaly as depicted by the procedure in Figure 8. The result shows that significant amount of geopotential height variance stretches out to North Africa from the Indian subcontinent diabatic heat forcing. Meanwhile, the tropical–subtropical total forcing explains a tremendous amount of geopotential height variability over the midlatitude. By the comparison of variances in two different experimental results (Total—Indian forcing), the fractional contribution of the Indian forcing is illustrated in Figure 8. The percentage contribution of geopotential height induced by Indian diabatic heating is 5–20% over the potential vorticity forcing regions shown in Figure 6.
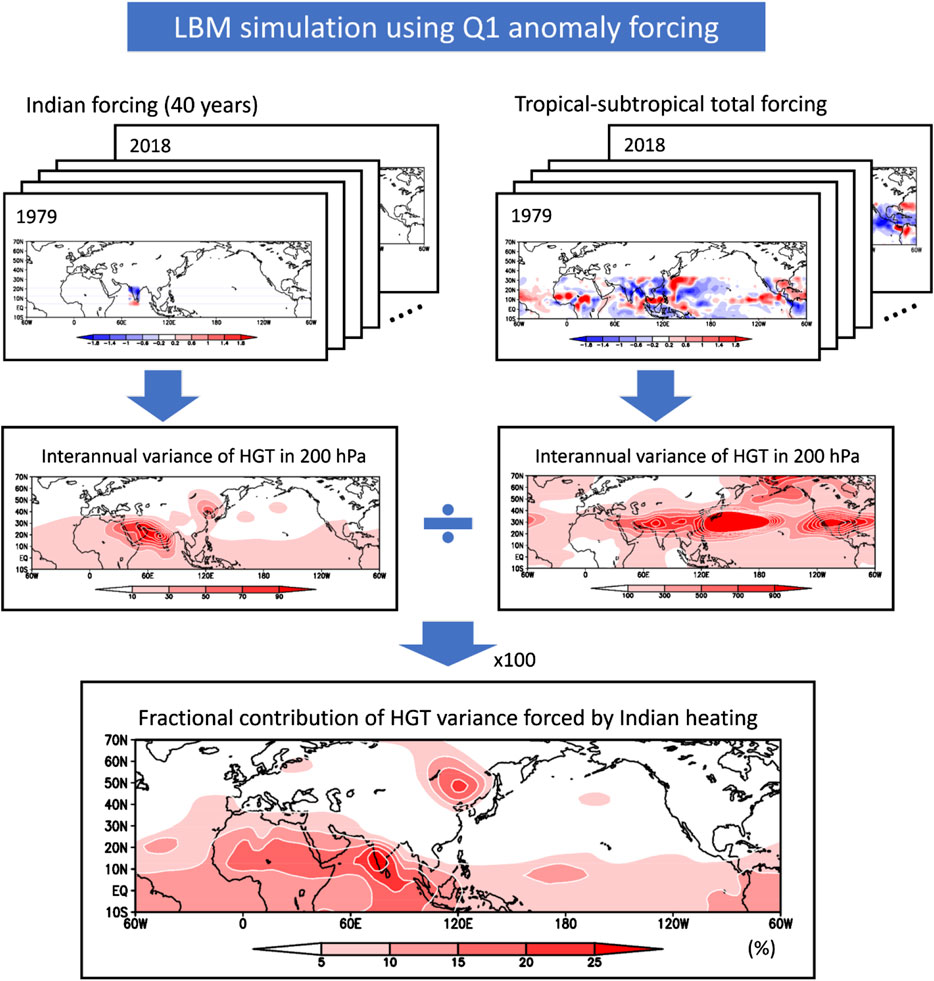
FIGURE 8. LBM simulations to calculate a percentage contribution (%) of geopotential height in 200 hPa forced by Indian Q1 anomaly.
The fractional variance of 5–20% seems small quantity; however, the Indian diabatic heating itself and sequential vorticity forcing over North African regions together generate the NHW pattern. Note that most of North African vorticity perturbations are induced by random tropical forcing with internal tropical easterly waves, and these waves are typically regarded as an atmospheric noise; therefore, the rigorous signal of 5–20% has a grateful meaning to understand the origin of the NHW pattern.
Summary and Discussion
With dominant stationary wave pattern over the Northern Hemisphere in July, the NHW pattern is related to the anomalous ISM precipitation and sequential westward propagating tropical easterly waves. The tropical vorticity forcing comes from both the internal and forced atmospheric waves; here, the forced waves are primarily caused by the steady heat forcing, while atmospheric internal waves are regarded to exist randomly. The ISM precipitation and related stationary diabatic heating are responsible for the 5–20% of total geopotential height variability over North Africa. This result denotes that the ISM precipitation anomaly with westward propagating tropical waves contributes to the generation of NHW (Figure 9).
FIGURE 9. Schematic diagram of the Northern Hemisphere teleconnection induced by the Indian monsoon. Gray lines show the teleconnection pathway generated from Indian diabatic heat forcing.
The midlatitude stationary Rossby waves can be generated from tropical forcing such as the ISM precipitation, but additional background environmental conditions are needed for the Rossby wave energy propagation from the tropics to the midlatitude. In Figures 5, 6, and 9, the tropical wave paths penetrate the critical latitude (zonal wind speed 0 m/s area) in relation to the distribution of southerly wind (not shown). In the future climate under the global warming, the vertical structures of forcing and background wind structure may change, and then detailed characteristics of the NHW will be changed, for example, by the zonal wavenumber change or individual location of the low- and high-pressure anomalies change by modification of background wind structures with brand new Rossby waves pathway.
For the discussion of a current decadal variability of the stationary wave patterns, the linear trend maps of geopotential height at 200 hPa, surface temperature, and precipitation are illustrated in Figure 10. Interestingly, the linear trend of the global geopotential height mimics the NHW pattern (pattern correlation is 0.60). Even at surface temperatures in Figure 10B, the pattern is nearly identical to the NHW related surface temperature shown in Figure 3. The interannual variability of NHW is owing to Indian precipitation (Figure 7), whereas the positive precipitation trend over Northern India, the Arabian Sea, and Eastern China is relevant to the positive decadal trend of the NHW (Figure 10C). Due to the global warming, the land heats more than the sea so moisture flux convergence is increasing over these monsoon areas. Those regions having the positive trend of precipitation are corresponding to the potential diabatic forcing regions shown in Figure 5, and this result implies that the long-term variation of the NHW also can be explained by tropical–subtropical diabatic heat forcing. However, the majority of forcing for the NHW can be changed with respect to the timescale; therefore, further analysis of the NHW pattern under the various timescale is needed.
FIGURE 10. Linear trend of (A) geopotential height at 200 hPa, (B) surface temperature, and (C) precipitation (1979–2018). The nonparametric Mann–Kendall test is used to evaluate whether there is a statistically significant linear trend in the time series at each grid point. Dots denote the significant regions at the 95% confidence level.
With closing remarks, the occurrence of long-lasting stationary Rossby waves can change the global and regional climate, but the slow group velocity of transient eddies also has a significant role on the extreme temperature and precipitation (Feldstein and Dayan, 2008; Lau and Kim, 2012; Trenberth and Fasullo, 2012; Wirth et al., 2018). The phase speed means propagation of individual troughs and ridges, whereas the group velocity shows the speed of propagation of the entire wave packet. Therefore, integrated work needs to clarify the relative contribution of the stationary waves and transient eddies on the extraordinary midlatitude climate.
Data Availability Statement
All original datasets used in this study are publicly available. The ERA-Interim data were taken from https://apps.ecmwf.int/datasets/. The GPCP precipitation data were downloaded from https://www.ncei.noaa.gov/data/global-precipitation-climatology-project-gpcp-daily/access/. The ETOPO5 topography data were taken from https://www.ngdc.noaa.gov/mgg/global/etopo5.HTML.
Author Contributions
JS and KS conceived the study and wrote the manuscript. All authors provided critical feedback and helped shape the research and manuscript.
Funding
This study was supported by the National Research Foundation of Korea (NRF) grant funded by the Korea government (MSIP) (No. NRF-2020R1A2C2009414) and the KMA Research and Development Program under Grant KMI2018–01012.
Conflict of Interest
The authors declare that the research was conducted in the absence of any commercial or financial relationships that could be construed as a potential conflict of interest.
References
Adler, R. F., Huffman, G. J., Chang, A., Ferraro, R., Xie, P.-P., Janowiak, J., et al. (2003). The version-2 global precipitation Climatology Project (GPCP) monthly precipitation analysis (1979-present). J. Hydrometeorol. 4, 1147–1167. doi:10.1175/1525-7541(2003)004<1147:tvgpcp>2.0.co;2
Chen, G., and Huang, R. (2012). Excitation mechanisms of the teleconnection patterns affecting the July precipitation in northwest China. J. Clim. 25, 7834–7851. doi:10.1175/jcli-d-11-00684.1
Chen, G. S., Huang, H. R., and Zhou, T. L. (2013). Baroclinic instability of the Silk Road pattern induced by thermal damping. J. Atmos. Sci. 70, 2875–2893. doi:10.1175/JAS-D-12-0326.1
Dee, D., Uppala, S. M., Simmons, A. J., Berrisford, P., Poli, P., Kobayashi, S., et al. (2011). The ERA-Interim reanalysis: configuration and performance of the data assimilation system. Q. J. Roy. Meteor. Soc. 137, 553–597. doi:10.1002/qj.828
Ding, Q., and Wang, B. (2005). Circumglobal teleconnection in the northern hemisphere summer. J. Clim. 18, 3483–3505. doi:10.1175/jcli3473.1
Ding, Q., and Wang, B. (2007). Intraseasonal teleconnection between the summer Eurasian wave train and the Indian monsoon. J. Clim. 20, 3751–3767. doi:10.1175/jcli4221.1
Ding, Q., Wang, B., Wallace, J. M., and Branstator, G. (2011). Tropical-extratropical teleconnections in Boreal summer: observed interannual variability. J. Clim. 24, 1878–1896. doi:10.1175/2011jcli3621.1
Enomoto, T., Hoskins, B. J., and Matsuda, Y. (2003). The formation mechanism of the Bonin high in August. Q. J. R. Meteorol. Soc. 129, 157–178. doi:10.1256/qj.01.211
Feldstein, S. B., and Dayan, U. (2008). Circumglobal teleconnections and wave packets associated with Israeli winter precipitation. Q. J. R. Meteorol. Soc. 134, 455–467. doi:10.1002/qj.225
Harnik, N., Messori, G., Caballero, R., and Feldstein, S. (2016). The circumglobal North American wave pattern and its relation to cold events in eastern North America. Geophys. Res. Lett. 43, 11015–11023. doi:10.1002/2016gl070760
Hoskins, B. J., and Ambrizzi, T. (1993). Rossby wave propagation on a realistic longitudinally varying flow. J. Atmos. Sci. 50, 1661–1671. doi:10.1175/1520-0469(1993)050<1661:rwpoar>2.0.co;2
Hoskins, B. J., and Karoly, D. J. (1981). The steady linear response of a spherical atmosphere to thermal and orographic forcing. J. Atmos. Sci. 38, 1179–1196. doi:10.1175/1520-0469(1981)038<1179:tslroa>2.0.co;2
Kosaka, Y., Nakamura, H., Watanabe, M., and Kimoto, M. (2009). Analysis on the dynamics of a wave-like teleconnection pattern along the summertime Asian jet based on a reanalysis dataset and climate model simulations. JMJS 87, 561–580. doi:10.2151/jmsj.87.561
Lau, N.-C., and Nath, M. J. (1991). Variability of the baroclinic and barotropic transient eddy forcing associated with monthly changes in the midlatitude storm tracks. J. Atmos. Sci. 48, 2589–2613. doi:10.1175/1520-0469(1991)048<2589:votbab>2.0.co;2
Lau, W. K. M., and Kim, K.-M. (2012). The 2010 Pakistan flood and Russian heat wave: teleconnection of hydrometeorological extremes. J. Hydrometeorol. 13, 392–403. doi:10.1175/jhm-d-11-016.1
Lee, H.-J., and Seo, K.-H. (2019). Impact of the Madden-Julian oscillation on Antarctic sea ice and its dynamical mechanism. Sci. Rep. 9 (1). doi:10.1038/s41598-019-47150-3
Li, J. P., and Ruan, C. Q. (2018). The North Atlantic–Eurasian teleconnection in summer and its effects on Eurasian climates. Environ. Res. Lett. 13, 024007. doi:10.1088/1748-9326/aaeb56
Li, S., Robinson, W. A., Hoerling, M. P., and Weickmann, K. M. (2007). Dynamics of the extratropical response to a tropical Atlantic SST anomaly. J. Clim. 20, 560–574. doi:10.1175/jcli4014.1
Li, Y., Li, J., Jin, F. F., and Zhao, S. (2015). Interhemispheric propagation of stationary Rossby waves in a horizontally nonuniform background flow. J. Atmos. Sci. 72, 3233–3256. doi:10.1175/jas-d-14-0239.1
Lin, J.-S., Wu, B., and Zhou, T.-J. (2016). Is the interdecadal circumglobal teleconnection pattern excited by the Atlantic multidecadal oscillation?. Atmos. Oceanic Sci. Lett. 9, 451–457. doi:10.1080/16742834.2016.1233800
Lu, R.-Y., Oh, J.-H., and Kim, B.-J. (2002). A teleconnection pattern in upper-level meridional wind over the North African and Eurasian continent in summer. Tellus 54, 44–55. doi:10.1034/j.1600-0870.2002.00248.x
Peng, S., Robinson, W. A., and Li, S. (2003). Mechanisms for the NAO responses to the north Atlantic SST tripole. J. Clim. 16, 1987–2004. doi:10.1175/1520-0442(2003)016<1987:mftnrt>2.0.co;2
Qian, Q., Jia, X., and Wu, R. (2019). Changes in the impact of the Autumn Tibetan plateau snow cover on the winter temperature over North America in the mid‐1990s. J. Geophys. Res.: Atmosphere 124, 343. doi:10.1029/2019jd030245
Saeed, S., Lipzig, N.V., Müller, W. A., Saeed, F., and Zanchettin, D. (2014). Influence of the circumglobal wave-train on European summer precipitation. Clim. Dyn. 43, 503–515. doi:10.1007/s00382-013-1871-0
Saeed, S., Müller, W.A., Hagemann, S., and Jacob, D. (2011). Circumglobal wave train and summer monsoon over northwestern India and Pakistan; the explicit role of the surface heat low. Clim. Dyn. 37, 1045–1060. doi:10.1007/s00382-010-0888-x
Sato, N., and Takahashi, M. (2006). Dynamical processes related to the appearance of quasi-stationary waves on the subtropical jet in the midsummer Northern Hemisphere. J. Clim. 19, 1531–1544. doi:10.1175/jcli3697.1
Schubert, S., Wang, H., and Suarez, M. (2011). Warm season subseasonal variability and climate extremes in the Northern Hemisphere: the role of stationary Rossby waves. J. Clim. 24, 4773–4792. doi:10.1175/jcli-d-10-05035.1
Seo, K.-H., Son, J.-H., Lee, S.-E., Tomita, T., and Park, H.-S. (2012). Mechanisms of an extraordinary East Asian summer monsoon event in July 2011. Geophys. Res. Lett. 39. doi:10.1029/2011gl050378
Seo, K.-H., and Son, S.-W. (2012). The global atmospheric circulation response to tropical diabatic heating associated with the Madden-Julian oscillation during northern winter. J. Atmos. Sci. 69, 79–96. doi:10.1175/2011jas3686.1
Seo, K.-H., and Wang, W. (2010). The Madden-Julian oscillation simulated in the NCEP climate forecast system model: the importance of stratiform heating. J. Clim. 23, 4770–4793. doi:10.1175/2010jcli2983.1
Shi, N., Tian, P., and Zhang, L. (2019). Simultaneous influence of the Southern Hemisphere annular mode on the atmospheric circulation of the Northern Hemisphere during the boreal winter. Int. J. Climatol. 39, 2685–2696. doi:10.1002/joc.5981
Stephan, C. C., Klingaman, N. P., and Turner, A. G. (2019). A mechanism for the recently increased interdecadal variability of the silk road pattern. J. Clim. 32, 717–736. doi:10.1175/jcli-d-18-0405.1
Trenberth, K. E., and Fasullo, J. T. (2012). Climate extremes and climate change: the Russian heat wave and other climate extremes of 2010. J. Geophys. Res. 117. doi:10.1029/2012jd018020
Watanabe, M., and Kimoto, M. (2000). Atmosphere-ocean thermal coupling in the North Atlantic: a positive feedback. Q. J. Royal Met. Soc. 126, 3343–3369. doi:10.1002/qj.49712657017
Wirth, V., Riemer, M., Chang, E. K. M., and Martius, O. (2018). Rossby wave packets on the midlatitude waveguide-A review. Mon. Weather Rev. 146, 1965–2001. doi:10.1175/mwr-d-16-0483.1
Wu, Z., Li, J., Jiang, Z., He, J., and Zhu, X. (2012). Possible effects of the north Atlantic oscillation on the strengthening relationship between the East Asian summer monsoon and ENSO. Int. J. Climatol. 32, 794–800. doi:10.1002/joc.2309
Wu, Z., Wang, B., Li, J., and Jin, F.-F. (2009). An empirical seasonal prediction model of the east Asian summer monsoon using ENSO and NAO. J. Geophys. Res. 114, D18120. doi:10.1029/2009jd011733
Yanai, M. (1961). A detailed analysis of typhoon formation. J. Meteorol. Soc. Jpn. 39, 187–214. doi:10.2151/jmsj1923.39.4_187
Yanai, M., Esbensen, S., and Chu, J.-H. (1973). Determination of bulk properties of tropical cloud clusters from large-scale heat and moisture budgets. J. Atmos. Sci. 30, 611–627. doi:10.1175/1520-0469(1973)030<0611:dobpot>2.0.co;2
Zhao, S., Li, J., and Li, Y. (2015). Dynamics of an interhemispheric teleconnection across the critical latitude through a southerly duct during boreal winter. J. Clim. 28, 7437–7456. doi:10.1175/jcli-d-14-00425.1
Zheng, F., Li, J., Li, Y., Zhao, S., and Deng, D. (2016). Influence of the summer NAO on the spring-NAO-based predictability of the East Asian summer monsoon. J. Appl. Meteor. Climatol. 55, 1459–1476 doi:10.1175/jamc-d-15-0199.1
Keywords: stationary Rossby waves, teleconnection, heat waves, Indian monsoon, linear baroclinic model
Citation: Son J-H, Seo K-H, Son S-W and Cha D-H (2021) How Does Indian Monsoon Regulate the Northern Hemisphere Stationary Wave Pattern?. Front. Earth Sci. 8:599745. doi: 10.3389/feart.2020.599745
Received: 28 August 2020; Accepted: 06 November 2020;
Published: 20 January 2021.
Edited by:
Jasti S. Chowdary, Indian Institute of Tropical Meteorology (IITM), IndiaReviewed by:
Wei Chen, Institute of Atmospheric Physics (CAS), ChinaRamesh Kumar Yadav, IITM, India
Wei Wei, Sun Yat-sen University, China
Copyright © 2021 Son, Seo, Son and Cha. This is an open-access article distributed under the terms of the Creative Commons Attribution License (CC BY). The use, distribution or reproduction in other forums is permitted, provided the original author(s) and the copyright owner(s) are credited and that the original publication in this journal is cited, in accordance with accepted academic practice. No use, distribution or reproduction is permitted which does not comply with these terms.
*Correspondence: Kyong-Hwan Seo, a2hzZW9AcHVzYW4uYWMua3I=